




Abstract
Log-linear models for contingency tables are a key tool for the study of categorical inequalities in sociology. However, the conventional approach to model selection and specification suffers from at least two limitations: reliance on oftentimes equivocal diagnostics yielded by fit statistics, and the inability to identify patterns of association not covered by model candidates. In this article, we propose an application of Lasso regularization that addresses the aforementioned limitations. We evaluate our method through a Monte Carlo experiment and an empirical study of educational assortative mating in Chile, 1990–2015. Results demonstrate that our approach has the virtue, relative to ad hoc specification searches, of offering a principled statistical criterion to inductively select a model. Importantly, we show that in situations where conventional fit statistics provide conflicting diagnostics, our Lasso-based approach is consistent in its model choice, yielding solutions that are both predictive and parsimonious.
Introduction
Sociology has had a long-standing interest in categorical inequalities, starting with black/white and male/female dichotomies, to more complex classifications. Underlying this interest lies the assumption that some categories, such as race, class, and education, cannot be fully captured by gradational or scalar forms (Tilly 1999). Methodologically, log-linear models have played a central role in the quantitative study of these categories and their relationship to inequality and population change. This is because they allow researchers to explore patterns of association between categorical variables, instead of reducing them to aggregated-level measures (e.g., correlation coefficients). Indeed, most seminal studies on interracial marriage (e.g., Gullickson 2005; Qian 1997), assortative mating (e.g., Mare 1991; Schwartz and Mare 2005), intergenerational mobility (e.g., Duncan 1979; Hout 1984; Mare 1991), and migration flows (e.g., Little and Raymer 2013; Raymer and Rogers 2007; Willekens 1983) have used log-linear models for contingency tables as their main analytic strategy. These models are still the standard tool in the analysis of assortative mating (Schwartz 2013) as shown by recent publications in the discipline’s leading journals (e.g., Gullickson and Torche 2014; Schwartz 2010; Schwartz and Mare 2012; Schwartz, Zeng, and Xie 2016; Torche 2010).
More specifically, the main goal of log-linear models is to achieve an accurate description of the patterns of association between categorical variables while avoiding overfitting 1 the data. To resolve this trade-off between descriptive accuracy and parsimony, researchers typically rely on a combination of theory-based model specifications and goodness-of-fit statistics. Because log-linear models typically involve a large number of parameters, often statistics that penalize model complexity—such as the Bayesian information criterion (BIC) and the Akaike information criterion (AIC)—are preferred.
Despite its wide use, under some circumstances, this approach to model selection is problematic. First, it has been shown that goodness-of-fit statistics yield equivocal diagnostics regarding the “best” model when (i) the sample size is too small, (ii) the number of parameters is large, and/or (iii) tables are sparse (Clogg 1982; Dziak et al. 2015; Fitzmaurice and Goldthorpe 1997; Weakliem 1999). Unfortunately, combinations of these issues are common in empirical research. In such situations, the researcher faces the necessity of choosing a model specification based on limited statistical information, having to rely on prior knowledge on the subject. As a consequence, methodological decisions tend to be ad hoc, not always tractable and prone to subjective biases. Second, while this approach leads to selecting the best model among candidates, it is, by definition, insensitive to patterns of association that are not covered by the models under comparison. Thus, if a set of parameters are consequential for the descriptive capacity of the model but are not incorporated by any candidate specification, the researcher risks offering an overly simplistic representation of the phenomenon under investigation (see Hauser [1980] for an early attempt to address this issue).
To deal with these particular limitations, we introduce an innovative approach to specification and selection of log-linear models based on an application of the Least Absolute Shrinkage and Selection Operator (Lasso) regression (Tibshirani 1996). The Lasso is an established regularization tool, which contains desirable properties for the aforementioned problems. Under conditions of sparse data and/or small sample size, this tool yields solutions that increase out-of-sample predictive power by preventing overfitting (Hastie, Tibshirani, and Friedman 2009; James et al. 2013). In addition, taking advantage of Lasso’s data-driven approach to variable selection, our application serves as a “discovery tool” that allows for the emergence of patterns potentially masked by solely theory-driven models.
In this article, we illustrate our proposed method by applying it to the study of educational assortative mating. Our analysis proceeds in two steps. First, we implement a Monte Carlo simulation to compare the performance of Lasso and conventional fit statistics. Findings show that our method recovers the simulated pattern of assortative mating, which was not the case with the conventional goodness-of-fit statistics. Second, we apply our method to an empirical case where conventional goodness-of-fit statistics yield inconsistent diagnostics. We demonstrate how our application of Lasso provides a systematic procedure to inductively decide on a model specification under these circumstances. Different Lasso solutions lead to consistent model specifications, which were both predictive—according to out-of-sample cross-validation—and parsimonious.
Together, the main contribution of this article is to provide researchers using log-linear models an alternative approach to select a model specification that achieves descriptive accuracy without sacrificing parsimony. Importantly, in situations where conventional fit statistics provide equivocal diagnostics, our approach has the virtue, relative to ad hoc specification searches, to offer a principled statistical criterion to inductively select a model. As mentioned, log-linear models have been the preferred strategy for the study of social mobility, racial intermarriage, and assortative mating in sociology. As data in these fields have increasingly gained complexity through the use of administrative records and big data (e.g., social media), we think an inductive and data-driven approach to model selection will be an especially useful tool for researchers. Finally, to facilitate other scholars’ use of Lasso regularization for selection of log-linear models, we provide a detailed code with all the necessary steps to implement our method in R (see Section A.5 in the Online Appendix).
Log-linear Analysis and Model Selection
Log-linear Models for Contingency Tables
Log-linear models for contingency tables have been the standard approach to characterize patterns of social mobility, migration flows, and assortative mating. The basic goal of these models is to describe the patterns of association and interaction between the different levels of categorical variables (Agresti 2002). In particular, these models provide estimates of the association between categorical variables while controlling for changes in their marginal distribution. This is an important trait as researchers often want to disentangle the net association between categorical variables from compositional changes in the population. For example, in the case of assortative mating, it is important to distinguish between the net increase of educational homogamy, from the overall increase of educational attainment in the population due to educational expansion.
In contrast to linear regression, in log-linear models the outcome variable is the frequency of a phenomenon of interest, and both the outcome and the explanatory variable appear symmetrically rather than causally related in the model (Powers and Xie 2000). In other words, the estimation of the causal effect of a treatment variable on a particular outcome is not the purpose of log-linear analysis. Indeed, the central goal is to describe the patterns of association between two categorical variables, not focusing on their causal relationship.
Equation ( 1) describes a saturated log-linear model for the contingency table resulting from the cross-tabulation of three categorical variables, here denoted as row (R), column (C), and layer variable (L):

here
In log-linear modeling, the saturated model is the starting point of model selection. As observed in equation (1), this model incorporates all information existing in the data (i.e., one parameter for each data point) thus leading to a perfect fit. Evidently, such model is of little use for the researcher because it does not provide a parsimonious account of the association between variables; it just contains the observed patterns in the data.
Typically, parameters are estimated by fitting a Poisson model predicting the vector of counts derived from the contingency table, where the levels of each variable operate as predictors. Consequently, the log of the expected value of counts can be expressed as:

where
Conventional Approach to Model Specification and Selection
In order to characterize, the social or demographic patterns of interest researchers typically test several theory-driven model specifications against the saturated model. These specifications are parsimonious constructs, each representing a theory about the processes that lead to the observed patterns in the data. In the particular case of assortative mating—our empirical application—most theory-driven specifications are variants of two model families, that is, topological models, such as homogamy and crossing specifications, and ordinal models (Powers and Xie 2000). Importantly, the goal of these theory-driven specifications is to characterize marriage patterns by educational attainment over time not to explain changes in educational assortative mating using particular predictors.
Homogamy models test whether individuals are more likely to marry partners with their same level of educational attainment. For instance, the constrained homogamy model assumes assortative mating patterns are captured by the marginal distribution of husbands’ and wives’ educational attainment, plus one three-way interaction that models educational homogamy across the main diagonal of the contingency table for each year (Powers and Xie 2000). Equation (3) formalizes the homogamy model. In contrast with the saturated model described in equation (1), in this model, changes in assortative mating are captured by a single parameter

where
Different versions of this model relax some of the assumptions described above, allowing a more complex pattern of educational homogamy. For example, related models allow the strength of homogamy to vary across levels of educational attainment or incorporate parameter(s) to capture a/symmetric patterns of intermarriage along the minor diagonals of the contingency table.
In the case of crossing models, the association between spouses’ education is represented as a series of barriers to intermarriage between education groups. The hypothesis implied by this model is that different categories of education present varying degrees of difficulty for crossing (Powers and Xie 2000; Schwartz and Mare 2005). Formally,

where
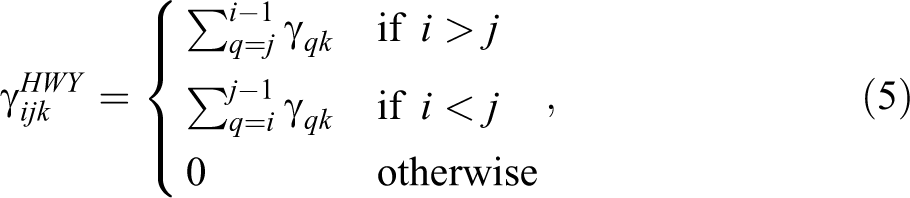
Here, the
Finally, another class of models incorporate the ordinal nature of the variables in the contingency table. Ordinal models assume these categories are ranked on either an observed or a latent scale and use this information to obtain parsimonious model specifications (Powers and Xie 2000). For example, in the linear-by-linear model, the association between row and column variables are scaled as a linear-by-linear interaction and expressed by a single parameter

where

where
Adjudication across different model specifications is one of the key steps in log-linear analysis. Because models typically involve a large number of parameters, direct examination of parameter estimates across different models is often unfeasible. For this reason, it is customary to first select a model among several specifications and then examine the parameters of the chosen model to draw substantive conclusions. In this vein, the development of goodness-of-fit statistics to guide scholars in the process of model selection became a prolific field of academic discussion (Burnham and Anderson 2004; Grusky and Hauser 1984; Kuha 2004; Raftery 1995; ). These statistics include the likelihood ratio (
The main goal of this process is to select a model specification that accurately fits the data while preserving parsimony. Given the high dimensionality of the parameter space, researchers commonly rely on statistics that penalize model complexity, in combination with their own previous knowledge on the case of study. In particular, the BIC is often the preferred statistic because it maximizes out-of-sample prediction and incorporates a penalty to the number of parameters—scaled by the log of the sample size—thus preserving model parsimony. 4
Although widely used in the discipline, this approach to model selection can sometimes be problematic. First, under specific conditions, goodness-of-fit statistics yield equivocal diagnostics regarding which is the best model. Indeed, it is well known that different statistics tend to prefer ill-fitted models when the sample size is small (Clogg 1982; Weeden and Grusky 2005). For instance, it has been shown that if the null hypothesis is false and sample size is small, the BIC still tends to favor the null hypothesis, leading to underfitting (Atkinson 1978; Weakliem 2004). Yet a less recognized issue is that a large sample size, when combined with a large number of parameters, can induce the BIC to impose severe penalties on additional parameters. In these scenarios, (1) the prior distribution will tend to favor the null hypothesis as the marginal proportions become more unequal as
In addition, scholars have shown the AIC is not a consistent criteria as it always contains some probability of selecting models that are too large, leading to overfitting (Hurvich and Tsai 1989; Kuha 2004). In particular, in the AIC, Type II error rates—retaining a false null hypothesis—decrease as
Second, while this approach leads to selecting the best model among candidates, it is, by definition, insensitive to patterns of association that are not covered by the specifications under comparison. Thus, if a set of parameters are consequential for the descriptive capacity of the model but are not incorporated by any candidate specification, the researcher risks offering an overly simplistic representation of the phenomenon under investigation. In recognition of this limitation, Hauser (1980) proposed a data-driven method for specification of log-linear models, based on iterative fitting and examination of residuals to detect empirical patterns that are missed by theory-driven model specifications. In practice, this approach has not been widely used, presumably because it is labor intensive and runs the risk of overfitting the data.
An Alternative Approach: Model Selection via the Lasso
Overview of Lasso Regularization
In order to cope with some of the limitations explained above, we propose the use of the Lasso (Tibshirani 1996) as an alternative approach to model specification and selection. Lasso is a regularization technique for regression in which a penalty is introduced to constrain coefficient estimates by shrinking them toward zero (Hastie et al. 2009; James et al. 2013). The purpose of regularization is to increase out-of-sample predictive power, prevent overfitting, and facilitate interpretation when models involve a large number of parameters (potentially more parameters than observations). As with all regularization methods, the Lasso trades a reduction in variance for an increase in the bias of the estimates. Currently, the Lasso is one of the most established regularization methods in the statistical literature, being successfully applied to various fields 5 (Jaggi 2014).
In its canonical form, the Lasso is a penalized version of ordinary least squares (OLS) where parameter estimates are obtained by minimizing the sum of squared errors, subject to a constrain on the sum of the absolute values of coefficients. 6 In its Lagrangian form, we can express the Lasso problem as an optimization of the following objective function:

where
Lasso penalties can also be applied to generalized linear models (Zou and Hastie 2005). In the case of Poisson models—the current standard tool for estimation of log-linear models—the penalized log-likelihood to be minimized is:

where
Our Approach: Specification and Selection of Log-linear Models via the Lasso
The reliance on goodness-of-fit statistics for model selection is problematic under some conditions. As mentioned, when researchers are working with small sample sizes, sparse matrices or large samples with many parameters, these statistics tend to not coincide in their diagnostic. This situation is not rare in the context of log-linear modeling. To deal with model selection under these conditions, we propose the use of Lasso regularization for contingency tables. We argue that the Lasso has desirable properties that make it a suitable device for this endeavor.
In what follows, we show that complementing the conventional approach to log-linear models with Lasso regularization may help researchers to circumvent some of the aforementioned obstacles. Moreover, being an inductive data-driven method, it can also assist researchers as a “discovery” tool in the process of deciding which model specifications will be compared via goodness-of-fit statistics.
Our proposed method unfolds in three core steps. First, we create a
Second, we fit a saturated model to predict the counts in the contingency table. Such model specification allows for the full interaction between the discrete variables that generate the contingency table
7
and thus comprises all the available information in the table. Consequently, when estimated via unpenalized maximum likelihood—the standard estimation approach to generalized linear models—the saturated model dedicates one parameter to each observation (i.e., each cell), fitting the data perfectly and thus yielding a nonparsimonious output. Our approach consists of estimating the parameters in the saturated model for the contingency table using a Poisson model with a Lasso penalty. The key property that makes the Lasso a suitable device for the task at hand is that the
Moreover, because our starting point is the saturated model for the contingency table, the selection of variables performed by Lasso is equivalent to a data-driven specification of a log-linear model. That is, while in principle every cell in the contingency table has a parameter attached, Lasso will set to zero the coefficients for those cells that are irrelevant for improving model fit. Thus, by inducing sparseness, Lasso will transform an initial situation with equal number of parameters and observations into a classic parsimonious model, one with less parameters than observations.
Third, we select the strength of the penalty (controlled by the parameter

where
Together, we claim there is an important parallelism between ours and the conventional approach to log-linear models in social science. In particular, we can think of any topological model specification as a saturated model where some parameters are a priori set to zero to provide a stylized representation of the world. Analogously, our approach accomplishes the same purpose, but the shrinkage decisions are inductive and data driven. The three steps described above constitute the core elements of our application of Lasso regularization to log-linear models. As we will illustrate in “Empirical Application: Educational Assortative Mating in Chile 1990–2015” Section, researchers might face additional methodological choices when applying Lasso regularization in empirical settings. Before delving into these particular decisions, we highlight two general caveats.
First, it is worth noticing that there are many ways to represent a saturated model when predictors are categorical. While the choice of coding scheme does not affect estimation procedures in standard models (Luo et al. 2016), this is not the case in regularized categorical regression (Chiquet, Grandvalet, and Rigaill 2016). In this context, both estimates and the predictive performance yielded by different penalties have been shown to be sensitive to coding schemes. Although there are no preferable penalty–coding combinations, some authors advocate for the use of coding schemes that yield meaningful reference levels and encourage users to check the sensitivity of solutions to different coding schemes (Chiquet et al. 2016; Tutz and Gertheiss 2016). Throughout this article, we use dummy coding for all independent variables, taking the lowest educational level of each partner and the starting year in the time series as reference categories. We choose this representation because this is the convention in the log-linear model literature, but also because it enables for a clearer interpretation of parameters, allowing to disentangle between changes due to marginal distributions from transformations in assortative behavior.
Second, its important to warn the reader that Lasso regularization is not always an appropriate tool for model selection. If the goal of a particular model is to draw inferences on the causal effect of
Empirical Evaluation
In this section, we implement and evaluate the performance of our method in two steps. First, we validate our approach in a realistic Monte Carlo simulation regarding educational assortative mating. For illustration purposes and because we control the data generating process, we apply the simplest version of our Lasso-based approach (as described in “Our Approach: Specification and Selection of Log-linear Models via the Lasso” Section) to analyze the simulated data. In a nutshell, this analysis shows that the Lasso recovers the data generating process set in the simulations much closely than the conventional tools for model selection. Second, we apply our method to the study of assortative mating in Chile and compare the patterns yielded by the conventional approach versus Lasso regularization. For this case, in which we do not know the data generating process a priori, we present the reader with additional methodological tools that might make the use of Lasso regularization more feasible in empirical settings. In particular, we introduce additional ways to control the Lasso penalties, as well as statistical and substantive criteria to evaluate the performance of different models. Findings indicate that our approach provides a systematic procedure to inductively decide on a model specification under circumstances where goodness-of-fit statistics yield equivocal diagnostics. In contrast, different Lasso solutions lead to consistent model specifications, which are both predictive—according to out-of-sample cross-validation—and parsimonious. In addition, we show how insights from our inductive approach can be used in combination with traditional log-linear models.
A Monte Carlo Experiment: Simulated Patterns of Educational Assortative Mating
We evaluate the performance of both the conventional approach to model selection and our Lasso-based method at identifying simulated patterns of educational assortative mating. In this simulation, we create a stylized version of assortative mating where there is over time increasing educational homogamy among college graduates and decreasing homogamy among individuals with only an elementary education. In addition, we allow for heterogamy in the minor diagonals of the contingency table, where educational hypogamy and hypergamy have the same strength and do not change over time. Outside the major and minor diagonals, all assortative mating is driven by the marginal distributions, which are set to be time invariant (see details on the data generating process in Online Appendix A4). To be consistent with our empirical case described in the next section, we simulate the data for an equal number of survey years as in the Chilean case, that is, 12 measurements that span a period of 25 years.
We choose this data generating process for two reasons. First, the patterns of association set in our simulation have a clear correspondence to one of the theory-driven model specifications (model 7 below). Thus, ensuring that such specification could effectively recovered with the conventional approach to model selection. Second, our simulated pattern of assortative mating encompasses only a subset of the parameters considered in the aforementioned model specification. This makes it a suitable setting to test whether our Lasso-based method is able to accurately describe the data, while still retaining model parsimony (i.e., not using unnecessary parameters).
We characterize the simulated pattern of assortative mating through two strategies. First, following the conventional approach to model selection, we test several specifications regarding the mating structure and adjudicate across models using goodness-of-fit statistics. More specifically, model 1 (independence) assumes that all association between husband’s education (H), wife’s education (W), and year (Y) is explained by their marginal distribution, and thus the three variables are independent of each other. Model 2 (conditional independence) assumes that the educational similarity of partners is time invariant but allows the distributions of husband’s education and wife’s education to vary over time. Substantively, this means there are no changes in the net association between husband’s and wife’s education over time. Model 3 builds on model 2 but adds a special parameter to capture changes in homogamy across years that is constrained to be the same over educational levels. Model 4 relaxes model 3 by allowing the homogamy parameter to vary by educational category. Model 5 goes back to a constrained parameter for homogamy but allows symmetrical movements across the minor diagonals, where these movements are allowed to vary over time. Model 6 relaxes these movements by allowing hypergamy to be different than hypogamy. Models 7 and 8 are similar to Models 5 and 6, respectively, but allow an unconstrained major diagonal. Moreover, model 9 introduces a classical crossing model. Model 10 adds to model 9 a constrained major diagonal. Further, model 11 relaxes the assumption made on model 10, allowing heterogeneous homogamy. Specification 12 is a linear-by-linear model, where a single term 11 captures the linear-by-linear interaction between husband’s and wife’s education. This parameter is allowed to vary over time. Lastly, specification 13 is a log-multiplicative layer effect model (Unidiff) where the layer (L) corresponds to year. 12
As a second strategy, we use Lasso regularization in order to perform data-driven, automatized model selection.
Given that BIC is asymptotically consistent 13 but performs poorly in small samples and/or on sparse data, we implement these two approaches for three simulated sample sizes, one of small size (average of 19 counts per cell and total count of 5,700), one medium sized (average of 117 counts per cell and total count of 35,100), and one of very large size (average of 833 counts per cell and total count of 249,900). Furthermore, the pattern of assortative mating we imposed implies that some regions of the contingency table are heavily overpopulated, resulting in serious sparseness for the small size sample (e.g., 40 percent of the table’s cells present a count lower than 10 and 17 percent of cells have counts lower than 5) but no sparseness for the medium and very large size sample (Figure 1 displays the distribution of cell frequencies in all three scenarios). Comparing the performance of the two described approaches across different sample sizes and spareness levels gives us insights on the conditions under which—if any—Lasso can effectively complement the diagnostics of goodness-of-fit statistics for selection of log-linear models. We compare the performance of both model selection strategies by evaluating which one most closely captures the patterns set in the simulated data.
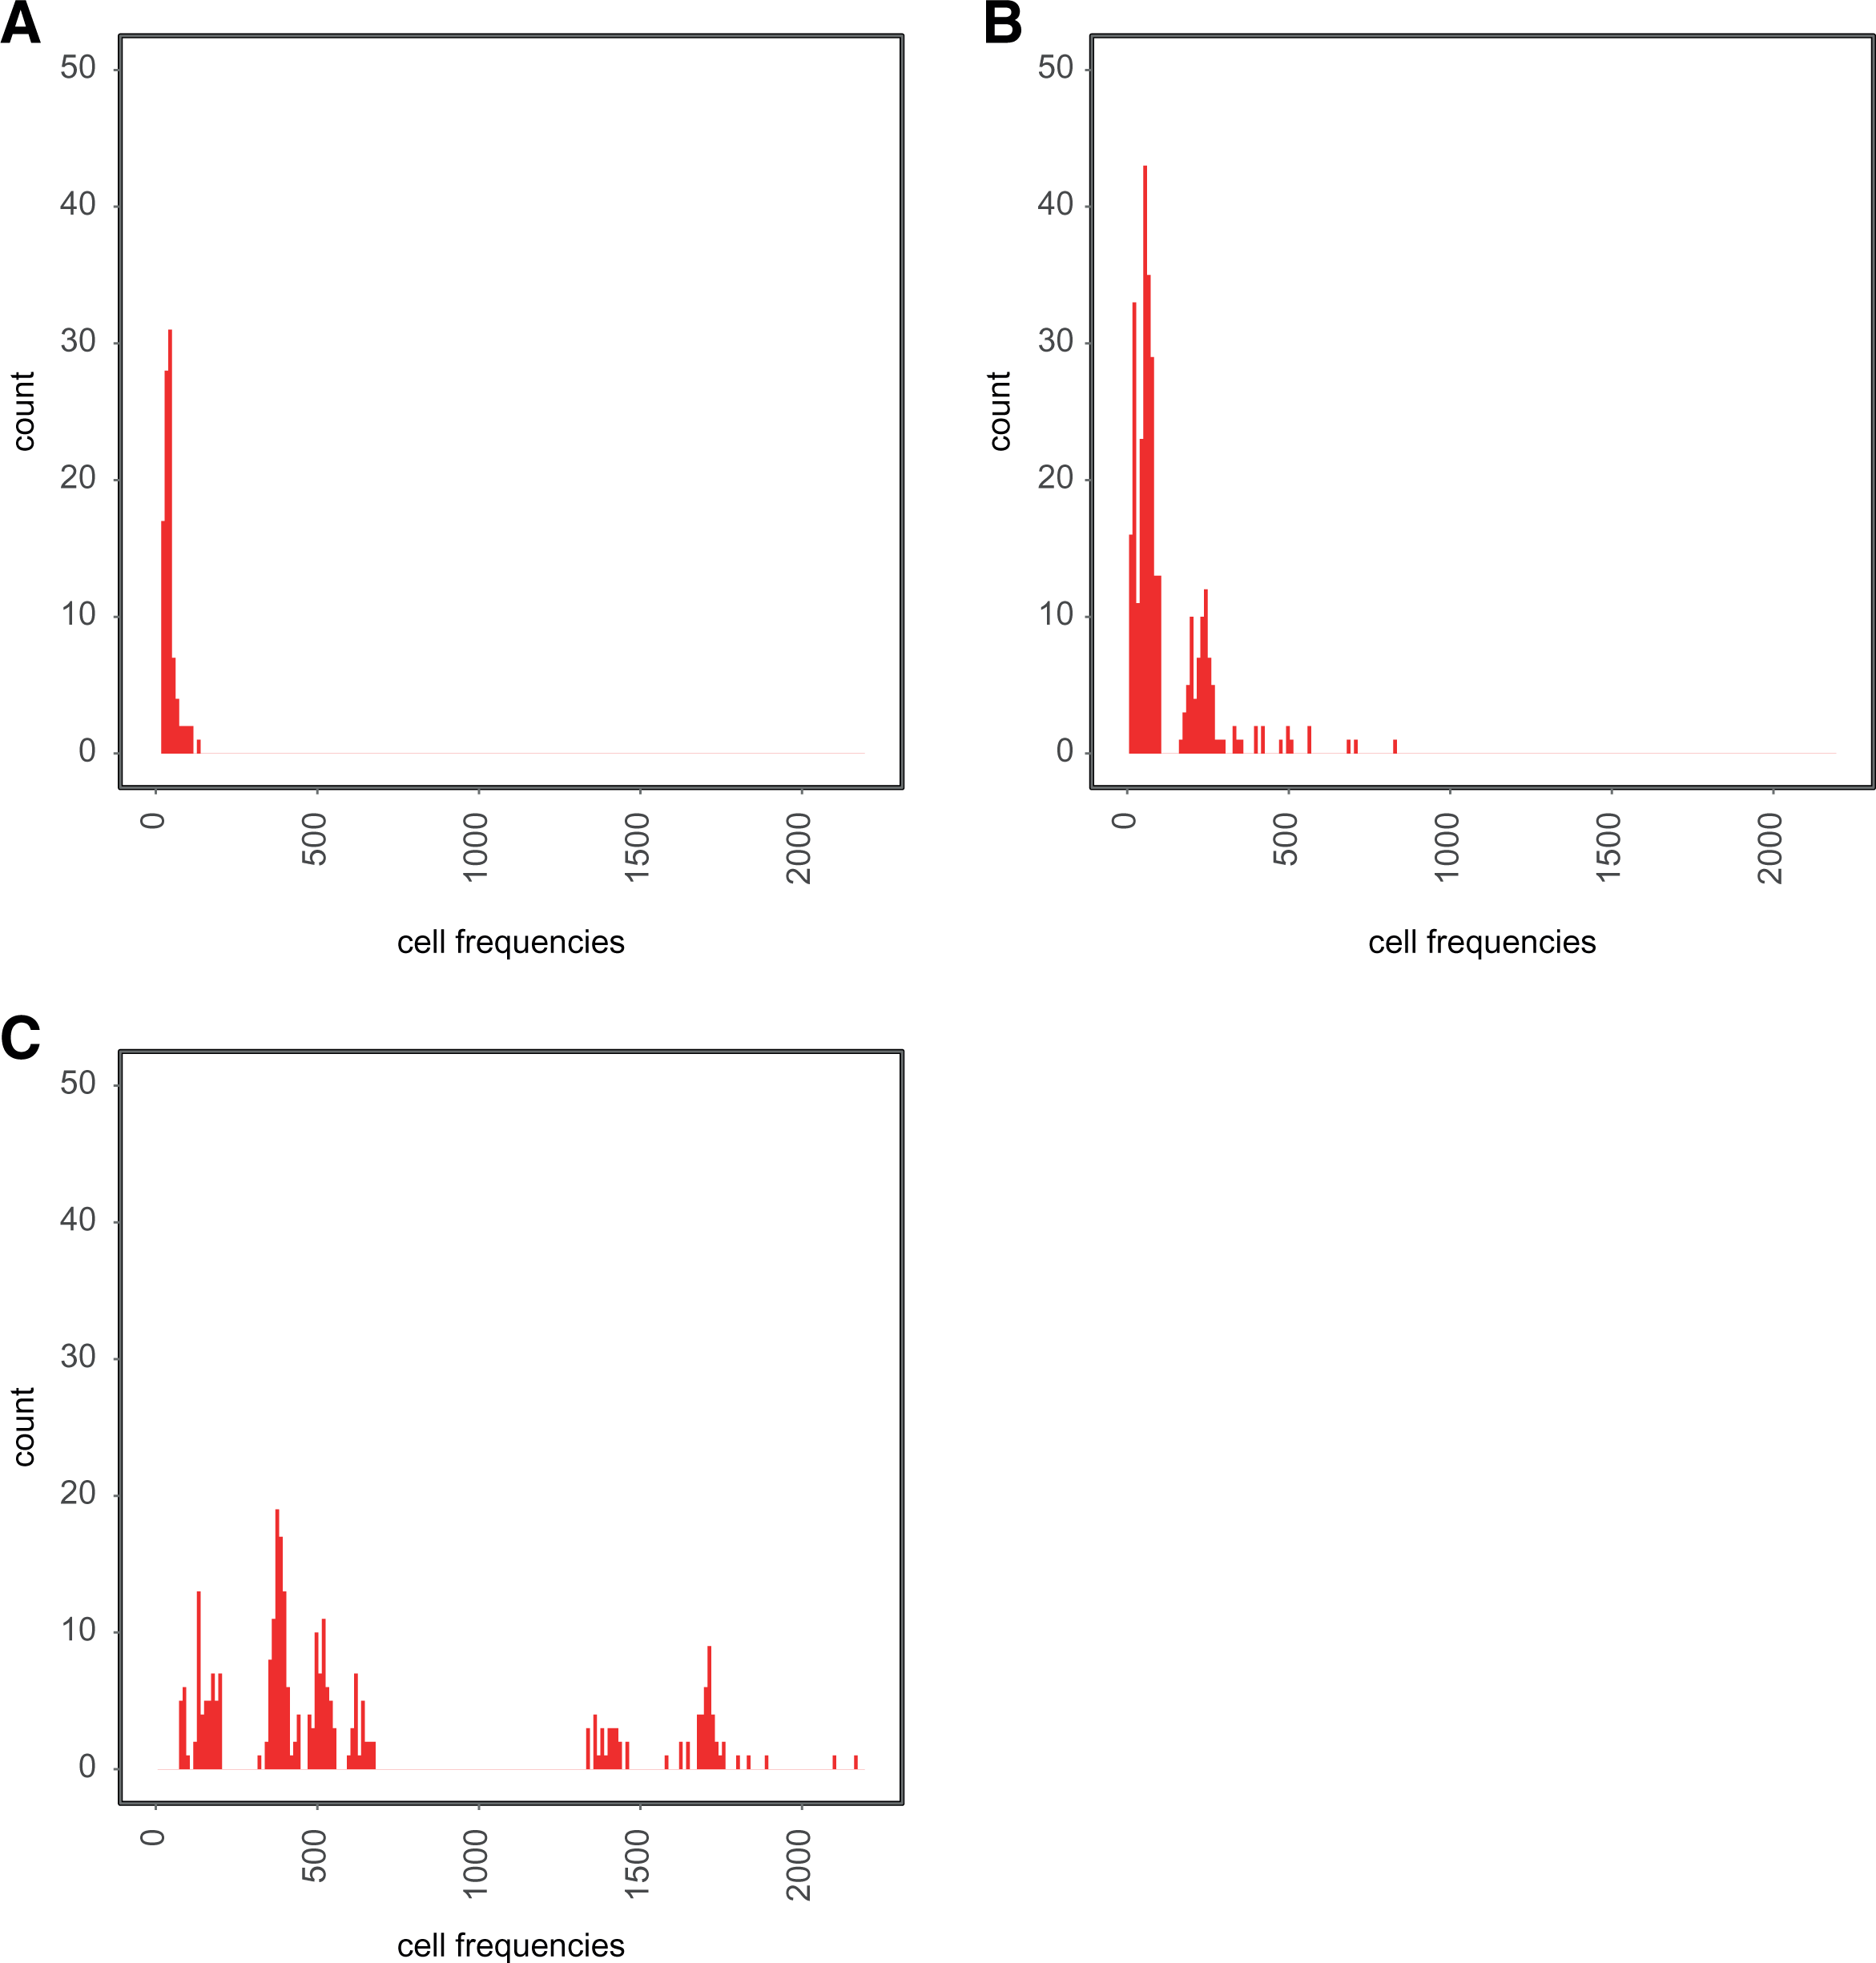
Monte Carlo experiment. Distribution of cell frequencies in simulated contingency tables. (A) Small sample size (19 counts per cell on average), (B) medium sample size (117 counts per cell on average), and (C) very large sample size (833 counts per cell on average).
Findings with conventional approach to selection of log-linear models
Given that we control the data generating process, we know beforehand that among the different log-linear specifications, the simulated pattern of assortative mating is represented by a model with an unconstrained major diagonal and symmetric movements along the minor diagonals (model 7 in Tables 1 –3). Nevertheless, Tables 1 –3 show that goodness-of-fit statistics suggest other specifications as the preferred model. In the case of the small sparse data, the BIC and AIC show a strong preference for the simplest model specification (model 2 in Table 1), one where assortative mating is entirely driven by the marginal distributions and over time changes in education. When the same analyses are conducted on a medium size sample (Table 2), both the BIC and AIC prefer a slightly more complex specification, but they do not agree on a preferred model: While the AIC chooses a model with unconstrained homogamy (model 4 in Table 2), BIC prefers a conditional independence model (model 2 in Table 2). Only when we use a very large and nonsparse data, the AIC and BIC coincide on a preferred specification, an unconstrained homogamy model (model 4 in Table 3) that only partially captures the patterns of assortative mating set in the simulation. Lastly, both AIC and BIC rate model 7—a specification able to capture the underlying true model—as the second best choice.
Log-linear Models of the Association between Husband’s and Wife’s Educational Attainment, Simulated Data.
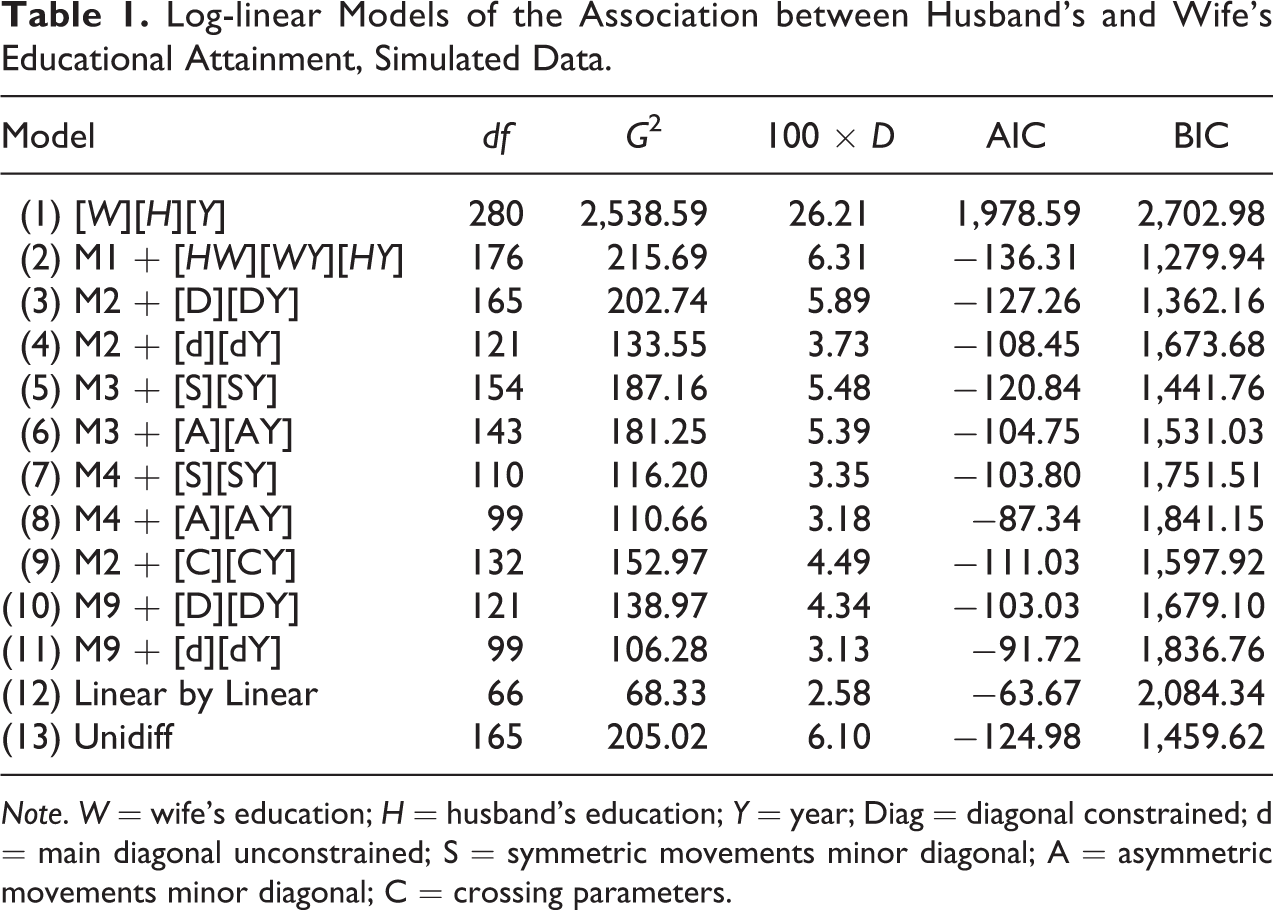
Note. W = wife’s education; H = husband’s education; Y = year; Diag = diagonal constrained; d = main diagonal unconstrained; S = symmetric movements minor diagonal; A = asymmetric movements minor diagonal; C = crossing parameters.
Log-linear Models of the Association between Husband’s and Wife’s Educational Attainment, Simulated Data.
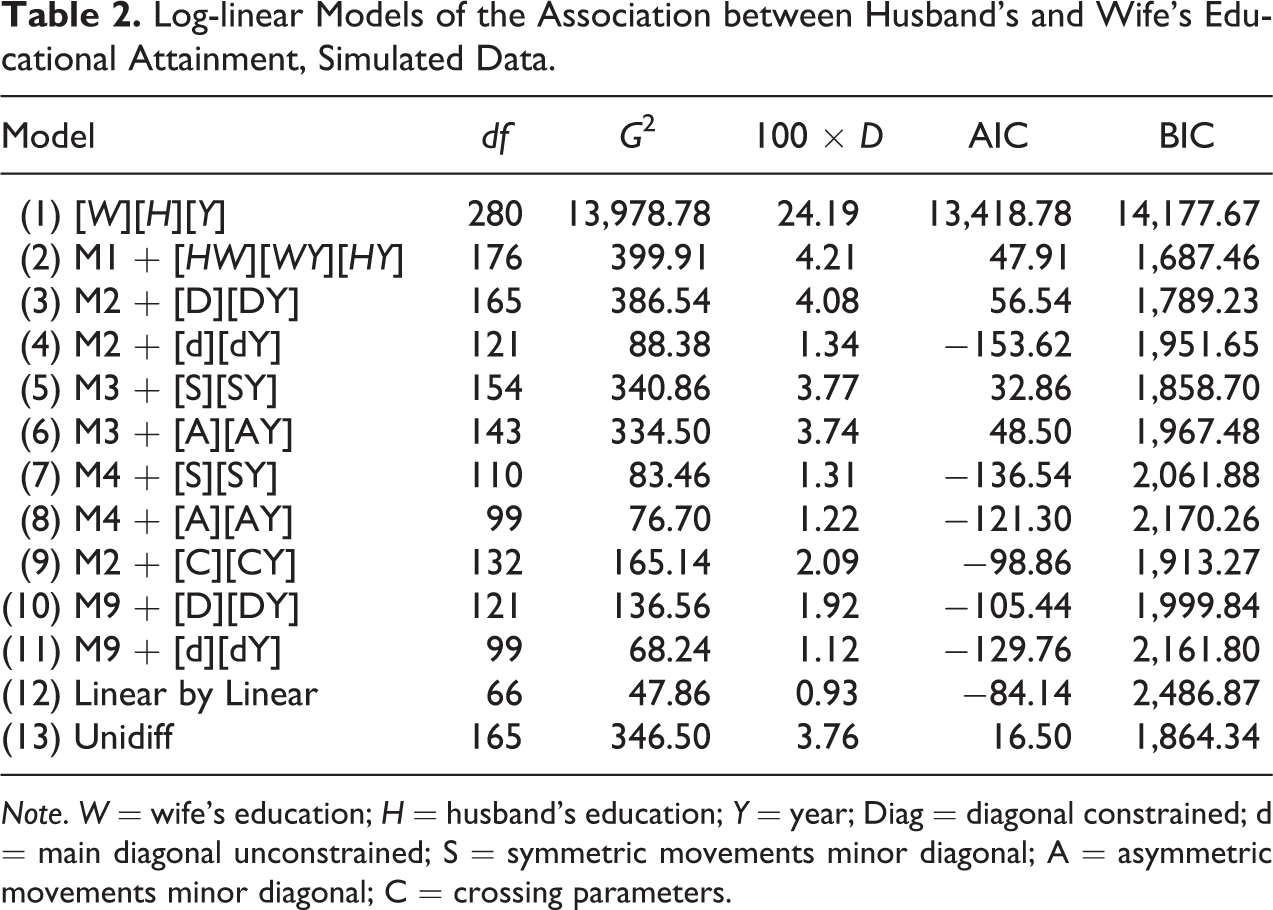
Note. W = wife’s education; H = husband’s education; Y = year; Diag = diagonal constrained; d = main diagonal unconstrained; S = symmetric movements minor diagonal; A = asymmetric movements minor diagonal; C = crossing parameters.
Log-linear Models of the Association between Husband’s and Wife’s Educational Attainment, Simulated Very Large Data (Average n per Cell = 833).

Note. W = wife’s education; H = husband’s education; Y = year; Diag = diagonal constrained; d = main diagonal unconstrained; S = symmetric movements minor diagonal; A = asymmetric movements minor diagonal; C = crossing parameters.
Overall, we can see that different goodness-of-fit statistics yield different diagnostics, leaving the researcher in need of choosing a model specification on the basis of her or his prior knowledge on the case of study. Moreover, while ambiguity in the diagnostics is more severe when using small size sparse data, this limitation is not entirely solved by working with a medium-sized sample. By contrast, when the analyses are conducted on a very large nonsparse data, AIC and BIC yield comparable diagnostics and are more or less able to identify the true model among the candidates. These results are consistent with the well-studied asymptotic properties of these two goodness-of-fit statistics and their poor performance on small and/or sparse data.
Findings with selection of log-linear models via the lasso
In this section, we approach model selection via the Lasso. First, we report performance metrics of the Lasso for the three samples. Figure 2 illustrates how coefficients are shrunk under different values of

Monte Carlo experiment. Path of Lasso regularized coefficients from the saturated model. (A) Small sample, (B) medium size sample, and (C) very large sample.
Following standard practice, we choose the value of
Second, Figure 3 plots model coefficients estimated through Lasso regularization for Poisson regression for all sample sizes. Coefficients represent the log odds for each combination of partners’ educational level relative to the baseline categories (i.e., both partners with “less than elementary” in 1990). At a first glance, we can see that despite their difference in the number of parameters, the general patterns of assortative mating are strikingly similar for the three sample sizes. Findings indicate there is a remarkable increase in the log odds of homogamy between individuals with a college degree. In addition, both plots show a decrease in the log odds of homogamy between husbands and wives with only elementary education, while minor diagonals are symmetric and remain stable over time. Thus, it can be observed that regardless of sample size and data sparseness, our approach effectively recovered the pattern of assortative mating that we set in the simulation. These results stark in contrast to those yielded by the AIC and BIC, which only approximated the true data generating process when the data were very large and nonsparse.

Monte Carlo experiment. Log odds for combinations of partners’ education according to Lasso coefficients. (A) Small sample, (B) medium size sample, and (C) very large sample. Log odds were calculated from fitted frequencies.
Lastly, in order to evaluate the stability of these solutions, we take advantage of the random nature of the cross-validation procedure used to select the value of
Empirical Application: Educational Assortative Mating in Chile 1990–2015
In this section, we empirically demonstrate the use of Lasso regularization for selecting log-linear models by applying this technique to the study of assortative mating. More specifically, we assess how educational assortative mating has changed in Chile the last 25 years. This country’s sustained reduction of income inequality over the last decades together with its rapid growth in educational attainment—especially postsecondary education—provides a unique scenario to test how marriage patterns change under these transformations. Cross-sectional evidence indicates that Chile features very strong barriers to intermarriage at the top of the educational distribution but a more fluid exchange elsewhere (Torche 2010). Evidence regarding the evolution of assortative mating is, however, scant. An exception is a study by Esteve, McCaa, and López (2013) who, using census data, show that educational homogamy in Chile is highest among college graduates 16 and has increased since the 2000s.
We study assortative mating in Chile using data from the National Socio-Economic Characterization Survey (CASEN), the most commonly used data set for social research in this country. This household survey is conducted every two or three years since 1985 by the Chilean Government, sampling around 70,000 households each time. Data are representative at the national, regional, urban, and rural levels. For this analysis, we pool all CASEN surveys from 1990 to 2015. 17 We restrict this analysis to the subsample of prevailing marriages and cohabitating couples. Ideally, we would focus only on newlyweds as prevailing unions are subject to different sources of bias, such as educational upgrade after marriage and selective union dissolution (Schwartz and Mare 2005; Torche 2010). Unfortunately, our data did not allow to identify these newly formed couples. In addition, we only include couples where males partners are between 30 and 35 years old to ensure that most of the cohort that enters a union is observed as such (Torche 2010). Thus, the total sample size is of 55,255 couples or 110,510 individuals.
We measured educational attainment of each spouse using five categories: “Less than Elementary” (E−), “Elementary Completed or Some High School” (E), “High School Completed or Vocational Degree” (H), “Some College or Technical Degree” (C−), and “College Degree or Higher” (C). We analyze the three-way contingency table resulting from the cross-tabulation of these two variables and survey year. 18 This table has an average of 184 counts per cell and is moderately sparse, with 20 percent of cells having less than 10 observations and 10 percent having less than five counts.
In order to characterize the Chilean pattern of assortative mating and its evolution over time, we first use log-linear models for contingency tables. We test several well-known model specifications, each corresponding to a different hypothesis regarding assortative mating. For each model, we report conventional goodness-of-fit statistics. Additionally, we apply Lasso regularization as a data-driven approach to specification and selection of log-linear models. For this, we implement a Poisson regression with Lasso penalties over a saturated model for the contingency table. More specifically, we estimate four versions of this general model. These versions differ in the weights that we apply to the Lasso penalties for each coefficient (see Section A3 in Online Appendix for more details on weighted Lasso penalties). These weights reflect our previous knowledge regarding assortative mating and allow us to impose restrictions over the Lasso penalties on a substantive basis. We examine the robustness of these different shrinkage regimes because in this case, unlike in our Monte Carlo experiment, we do not have a priori knowledge on the data generating process.
Lasso free: Equally weighted Lasso penalties are imposed to all parameters of the saturated model. This is the same procedure we use in our Monte Carlo experiment.
Adaptive Lasso: The adaptive Lasso is an extension of the Lasso. In particular, it applies a weighted penalty that is inversely proportional to the absolute value of an initial estimate of the parameter. The main goal is to favor predictors with previously known importance to avoid spurious selection (Zou 2006; Huang et al. 2008). We use as initial estimates the parameters yielded by the log-linear saturated model, so that parameters with large coefficients are mildly penalized, while parameters with small coefficients are more heavily penalized.
19
Lasso independence: We leave unpenalized all parameters corresponding to marginal distributions, while the remaining parameters are subject to Lasso penalties. We call this model “Lasso independence” because its unpenalized part is equivalent to the log-linear model of independence.
Lasso independence + [WY][HY]: This model extends the restriction imposed in the Lasso independence approach. Here, all parameters corresponding to the marginal distributions, as well as those capturing changes over time in the educational distribution of partners, are not penalized. All remaining parameters are subject to Lasso penalties. The idea is to ensure that parameters capturing educational assortative mating are not biased due to the shrinkage of coefficients that describe the marginal distribution of variables and their changes over time.
Unlike in the simulation study presented in “A Monte Carlo Experiment: Simulated Patterns of Educational Assortative Mating” Section, in the empirical study of assortative mating, we do not know the underlying data generating process. Thus, in order to evaluate the descriptive capacity of all models according to a common metric, we implement a cross-validation procedure. Because cross-validation serves the purpose of evaluating the predictive capacity of a model out of sample, we believe that this tool can complement the diagnostic yielded by traditional goodness-of-fit statistics that penalize model complexity (i.e., BIC and AIC).
Findings with conventional approach to selection of log-linear models
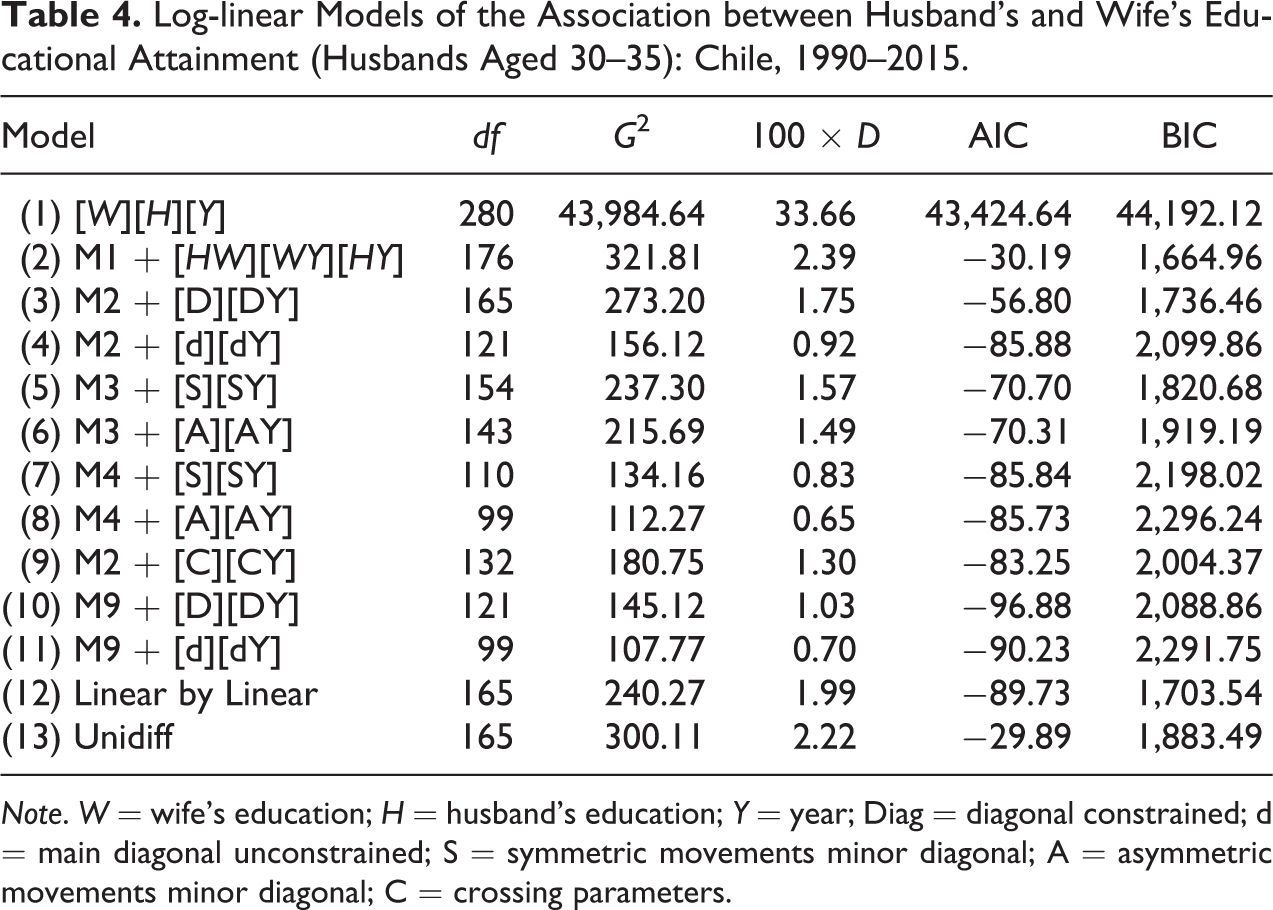
We fit different model specifications to describe over time trends of assortative mating. As mentioned, each of these specifications depicts a hypothesis pertaining to marriage patterns across time. Table 4 shows the goodness-of-fit statistics corresponding to each model specification.
Log-linear Models of the Association between Husband’s and Wife’s Educational Attainment (Husbands Aged 30–35): Chile, 1990–2015.
Note. W = wife’s education; H = husband’s education; Y = year; Diag = diagonal constrained; d = main diagonal unconstrained; S = symmetric movements minor diagonal; A = asymmetric movements minor diagonal; C = crossing parameters.
In particular, we see that these statistics do not agree on which is the best model for the Chilean case. According to the BIC, the conditional independence model (model 2) is the best alternative, followed by the liner-by-linear association model (model 12). These specifications represent very different patterns: While in model 2, educational assortative mating is stable over time, in model 12, the linear association between spouses’ education is allowed to vary across years. Alternatively, the AIC indicates a preference for model 10—a crossing model with constrained major diagonals. Not only do the BIC and AIC not coincide on which is the best model, but they actually yield contradictory results. Indeed, according to the AIC, BIC’s preferred model (model 2) has almost the worst fit across all specifications. Finally, the
As mentioned, in a situation like this, the researcher faces the necessity of selecting a model specification on the basis of previous knowledge about the subject. We suspect this leads to decisions that are not always tractable and more susceptible to subjective biases.
Findings with selection of log-linear models via the lasso
We now address the same problem but using Lasso regularization to characterize the pattern of educational assortative mating in Chile. We present results corresponding to the four variants of Lasso models described above. For each model, we report coefficients corresponding to an adaptively chosen value
As can be observed in Tables A5 to A8 in the Online Appendix, all four Lasso solutions yield an estimated vector of coefficients that is highly sparse, using at most 150 parameters of the 300. This makes Lasso solutions more parsimonious than almost all the conventional model specifications tested earlier. Figure 4 plots the log odds of partners’ education yielded by each model. Higher log odds imply a stronger association between the particular level of education of each spouse conditional on survey year. In general, it can be seen that all four models depict a scenario where assortative mating is mostly explained by educational homogamy and educational heterogamy along the minor diagonals—couples where one of their members has one extra level of education. As can be seen in the graphs, these associations vary in strength depending on the educational level of the partners. For instance, educational homogamy is consistently stronger among individuals with a college degree, as shown by the purple line in column C in each panel. This is followed by unions where both members have some college (red line, column C− in each panel) and high school degrees (green line, column H in each panel). Similarly, across Lasso models, heterogamy along the minor diagonals is the strongest for couples were husbands have a college degree and wives have some college education (purple line, column C− in each panel). Interestingly, this reveals the presence of educational hypergamy, which is stable across the observed period.
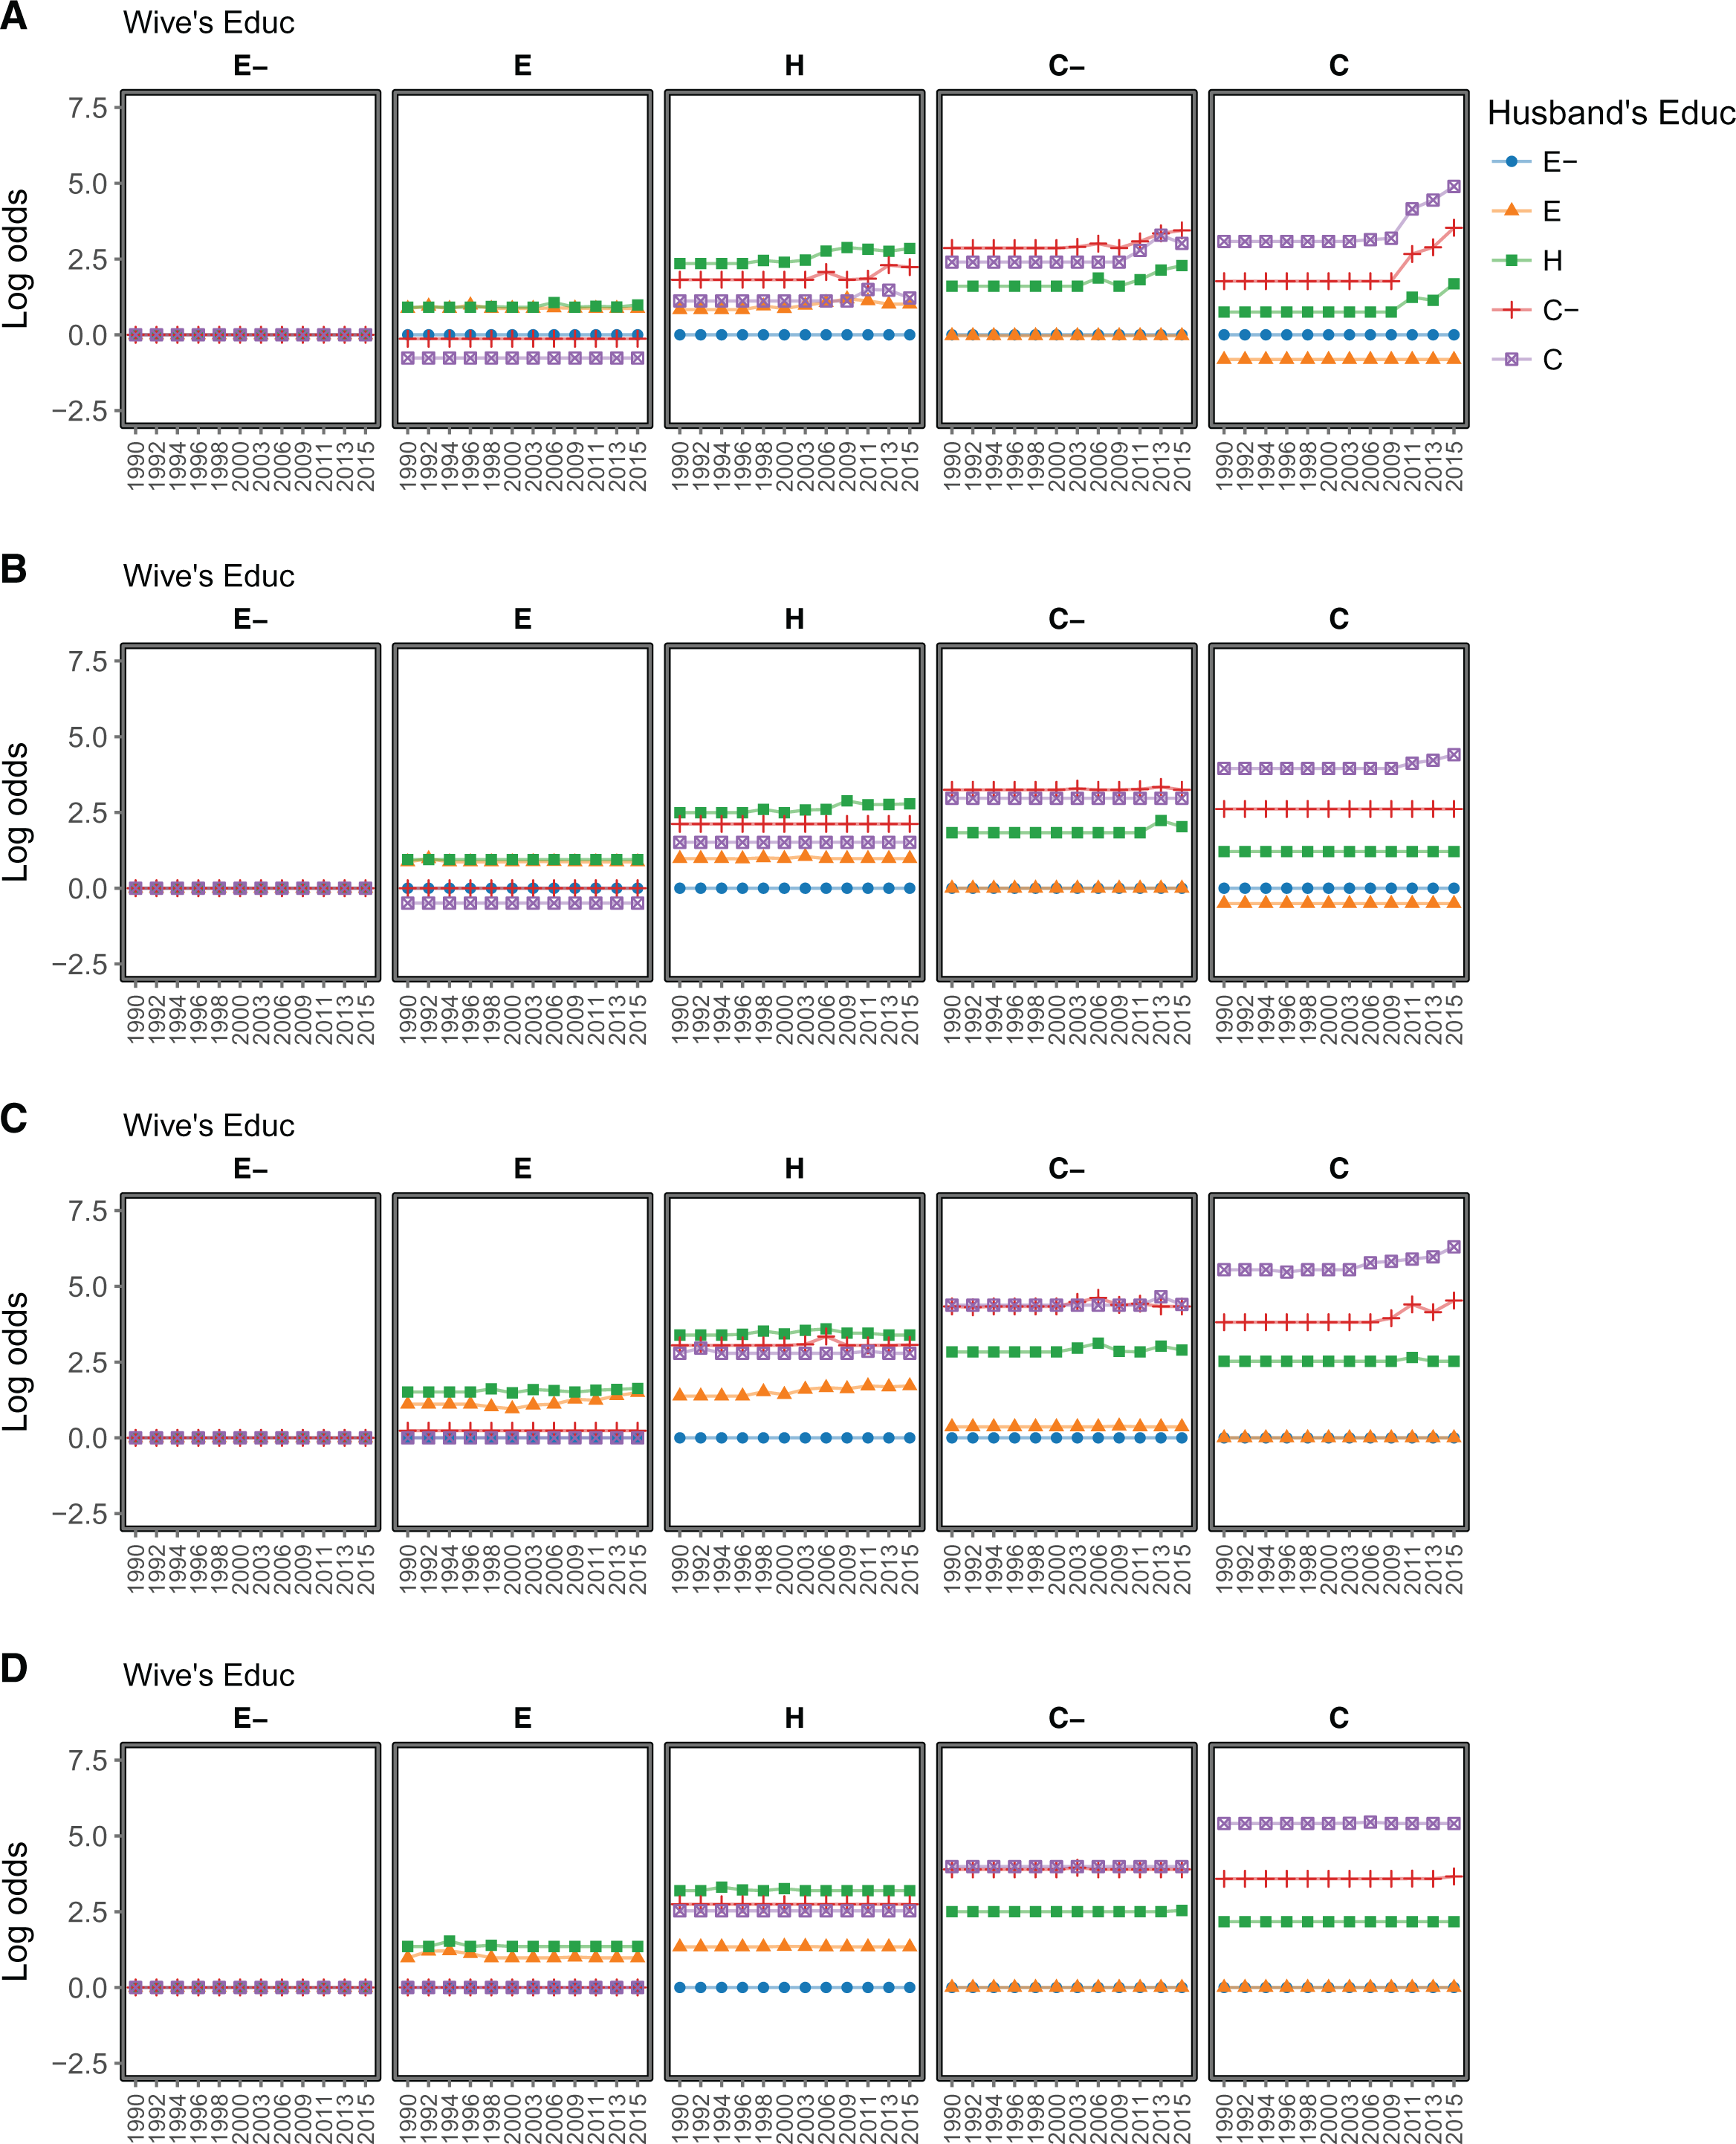
Log odds for combinations of partners’ education with respect to reference categories, Chilean data. (A) Lasso free, (B) adaptive Lasso, (C) Lasso independence, and (D) Lasso independence + [WY][HY]. Log odds were calculated from fitted frequencies.
Despite these similarities, the main source of discrepancy between different Lasso models has to do with over time changes in these associations, especially the evolution of homogamy among couples with a college degree. In this regard, the first three models (“Lasso free,” “adaptive Lasso,” and “Lasso independence”) indicate that homogamy among college graduates was relatively high and stable between 1990 and the mid-2000s, followed by a more or less sharp increase in the next decade. Some of these specifications also indicate a similar increase among homogamous couples with some college (Lasso free, panel A), and couples where the wife is a college graduate and the husband has some college education (Lasso free, panel A and Lasso Independence, panel C). In contrast, the model in which the marginal distributions and the variables capturing over time educational expansion are not penalized (“Lasso independence + [WY][HY]”) indicates that the levels of homogamy and heterogamy along the minor diagonals remain stable over the entire analyzed period.
Overall, these results depict two different representations of the evolution of educational assortative mating in Chile: one where there are high and rising levels of homogamy and heterogamy among the highly educated, and another where homogamy and heterogamy among the highly educated is also high but stable over time. However, because we do not know the data generating process, we need additional information to decide which model provides the best representation of the underlying mating process. To accomplish this, in the next section, we evaluate the four Lasso models and the conventional log-linear specifications according to their out-of-sample predictive capacity using a repeated
Our cross-validation procedure
In order to evaluate the performance of the models introduced above, we use a repeated k-fold cross-validation with 10 folds and 10 repetitions. That is, we divide the data into 10 random partitions and fit each model using a training set (9/10 of the data randomly selected) and create predictions in a “testing set” (the unused 1/10 of the data). We compare these predictions to the observed outcome in the testing set and measure the predictive accuracy of each model using the Poisson deviance, a proper loss function for Poisson distributed outcomes. We iterate this entire process 10 times, so that all partitions of the data serve as testing set once. Furthermore, we repeat the process 10 times in order to prevent the possibility that the randomness of the data partition might affect the results. At the end of the process, we average out the cross-validation error metrics computed at each iteration (100 in total), obtaining an overall cross-validation error for each model.
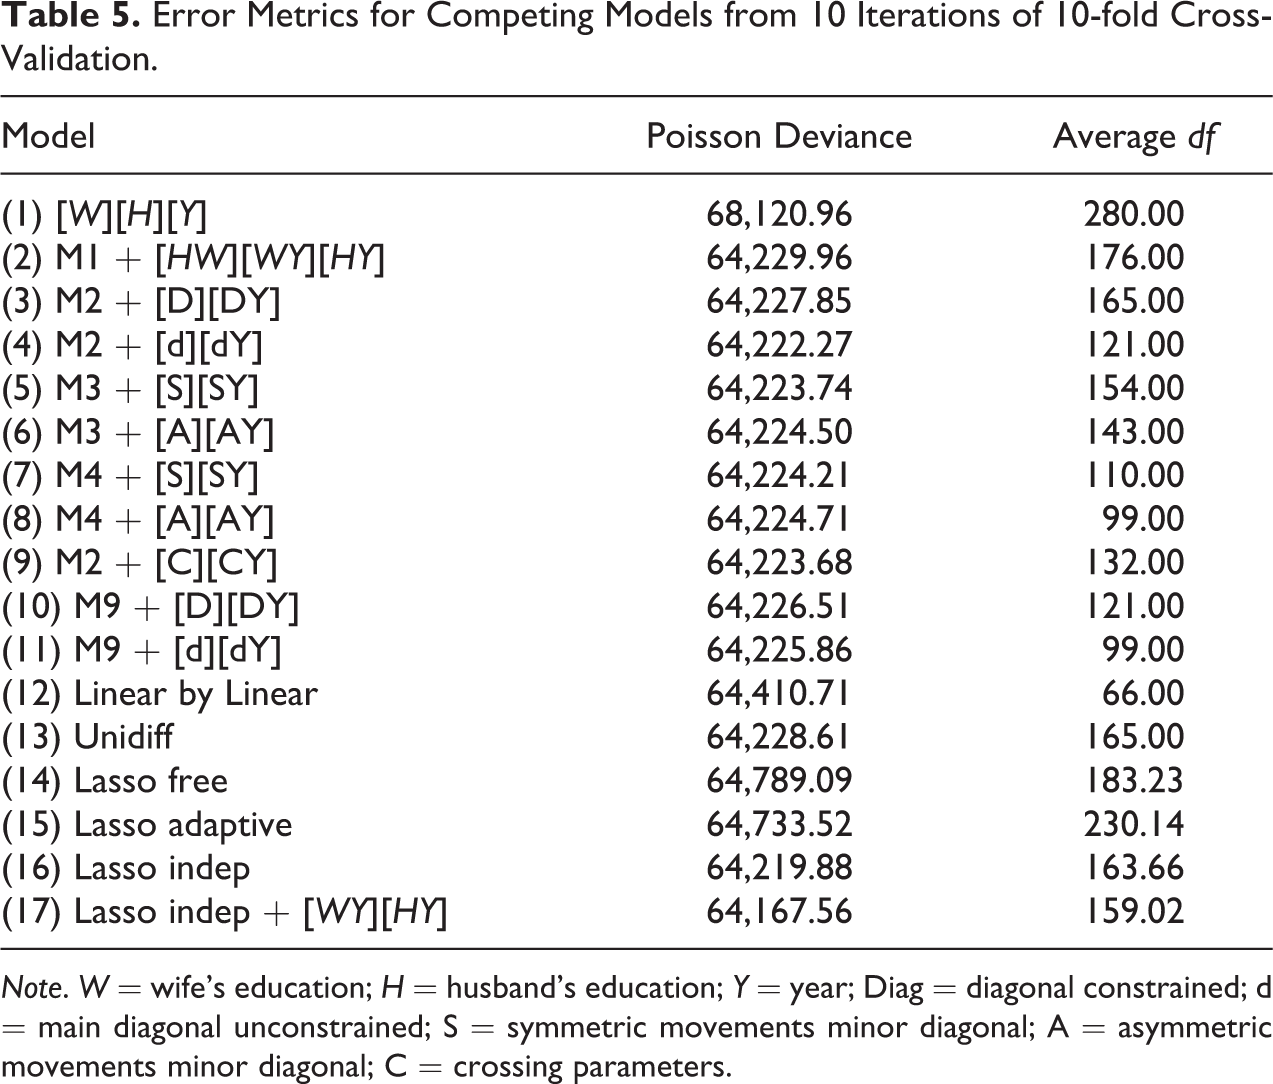
It can be observed that all models—with the exception of the independence model—perform relatively similar in terms of predictive accuracy (see Table 5). Among all models, the “Lasso independence + [WY][HY]” has the lowest deviance, closely followed by the “Lasso independence” model. As shown in Figure 4, the representations of the Chilean pattern of educational assortative mating yielded are remarkably alike between these two models (panels C and D). However, they differ regarding the evolution of educational homogamy among college educated couples. While the “Lasso independence” model predicts a smooth increase in homogamy starting in the mid-2000s, the “Lasso independence + [WY][HY]” suggests that such rise is entirely explained by the population expansion of college graduates (i.e., change in the marginal distribution). This discrepancy is expected since, by construction, the “Lasso independence + [WY][HY]” model does not penalize changes in the marginal distribution of spouses education over time, while the “Lasso independence” model is able to shrink these terms. In the particular case of Chile, this model discrepancy might be of special relevance. Indeed, it has been documented that the pattern of educational assortative mating is isomorphic to the pattern of income inequality (Torche 2010) and that income inequality and social immobility are mostly driven by concentration and closure at the very top of the social ladder (Torche 2005). Thus, accurately describing trends in assortative mating among the highly educated population can be crucial for understanding changes in the distribution of resources and opportunities.
Error Metrics for Competing Models from 10 Iterations of 10-fold Cross-Validation.
Note. W = wife's education; H = husband's education; Y = year; Diag = diagonal constrained; d = main diagonal unconstrained; S = symmetric movements minor diagonal; A = asymmetric movements minor diagonal; C = crossing parameters.
In order to resolve this discrepancy, we examine a traditional log-linear model specification able to capture the main features detected by the Lasso, with the advantage of yielding unbiased estimates. The latter would combine the inductive knowledge gained by the Lasso with unbiased estimates provided by conventional Poisson models. This strategy has also being successfully applied for the case of OLS models by Belloni and Chernozhukov (2013), where OLS post-Lasso estimates have a smaller bias. In our application, the two preferred Lasso models yield a common pattern of assortative mating: different levels of homogamy by educational level and heterogamy along the minor diagonals. Yet, as mentioned, they differ in whether there is changes over time among college educated couples. In this case, a model with an unconstrained major diagonal and asymmetric movements along the minor diagonals (model 8) theoretically captures the main commonalities of the two preferred Lasso models.
Figure 5 plots the patterns of assortative mating generated by this model. These trends confirm that a higher extent of educational homogamy exists among couples with high levels of education, as well as heterogamy along the minor diagonals.
20
Importantly, it suggests a slight increase in homogamy among college graduates, which lead us to favor the results yielded by the “Lasso independence” model over the “Lasso independence + [WY][HY].” We arrive at this conclusion by combining the insights of both traditional log-linear specifications and Lasso models. It is specially reassuring that these findings regarding educational homogamy at the top, and its evolution over time, are consistent with those reported by previous research using Chilean census data (Esteve et al. 2013). Lastly, it is important to note that the sole inspection of conventional goodness-of-fit statistics does not provide clear evidence to select model 8 on a statistical basis. The only statistic that preferred this specification was the Dissimilarity Index (
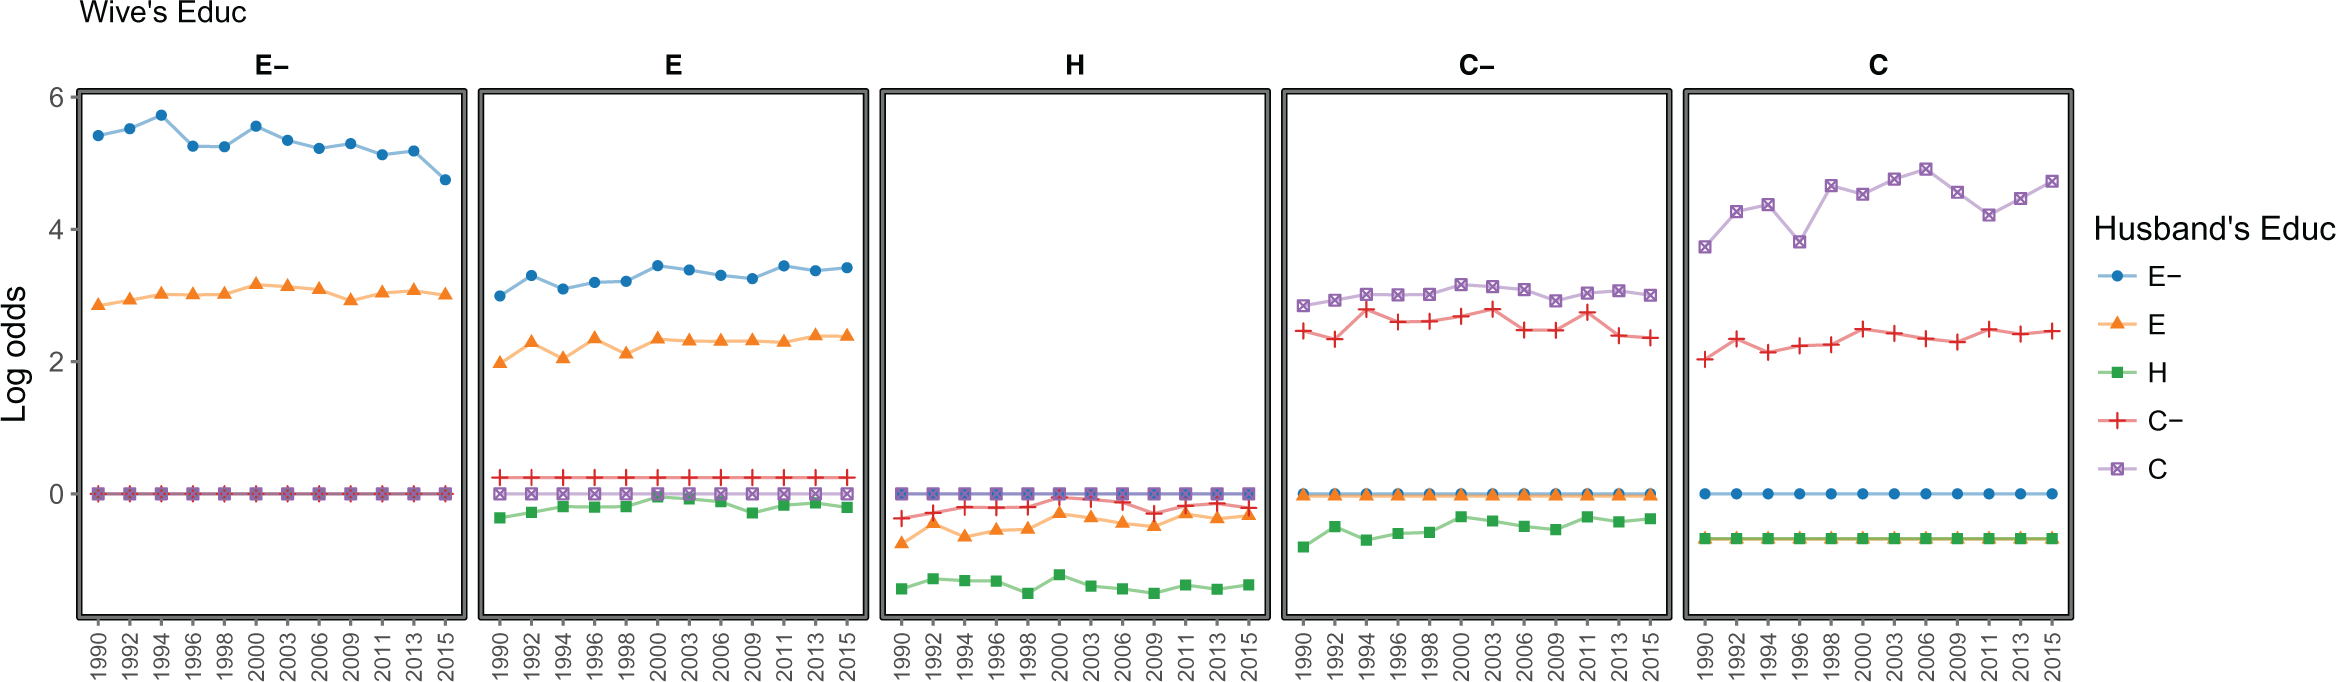
Log odds for combinations of partners’ education with respect to reference categories, Chilean data. Parameters from log-linear model CI + [Diag][DiagY][Asym][AsymY]. Log odds were calculated from fitted frequencies.
Thus, our empirical analysis demonstrates that researchers could apply the insights from the Lasso approach to inductively set a log-linear model specification. In particular, given that the Lasso adds bias to the estimates in order to reduce variance, the patterns of assortative mating shown in the regularized regression coefficients can be used to inform the specification of a regular Poisson model. The latter will yield unbiased estimates while reducing the risk of misspecification.
Final Remarks
In this article, we introduce an innovative approach to model specification and selection based on Lasso regularization. Importantly, in situations where conventional fit statistics provide equivocal diagnostics, our approach has the virtue, relative to ad hoc specification searches, of offering a principled statistical criterion to inductively select an appropriate model. In addition, this approach can assist researchers as a discovery tool in the process of deciding which model specifications will be compared via goodness-of-fit statistics.
We illustrate our proposed approach in two steps. First, we implement a Monte Carlo simulation to compare the performance of Lasso and conventional fit statistics. Findings show that our method recovers the simulated pattern of assortative mating, which was not the case with the conventional goodness-of-fit statistics. Second, we apply our method to an empirical case where conventional goodness-of-fit statistics yield inconsistent diagnostics. We demonstrate how our application of Lasso provides a systematic procedure to inductively decide on a model specification under these circumstances. Different Lasso solutions led to consistent model specifications, which were both predictive—according to cross-validation—and parsimonious.
In addition, we demonstrate how our proposed method could complement conventional approaches to log-linear models for contingency tables. Such approach embraces McFarland, Lewis, and Goldberg’s (2016) idea of “forensic social science,” combining both inductive and theory-driven methods to gain insights about complex assortative mating patterns in a statistically informed fashion.
Nevertheless, it is important to note some caveats regarding this approach. First, as all regularization methods, Lasso induces bias to the estimates in exchange for a reduction in variance. Second, Lasso solutions run the risk of overlooking specific effects, especially if their size is small. This can be problematic when interested in the value of particular coefficients. Third, if misused, it can lead to excessive reliance on automatized model selection without conferring proper attention to theory. For these reasons, we recommend evaluating the results of our Lasso-based method in combination with those yielded by conventional model selection approaches (e.g., BIC). Lastly, this approach is optimally suited to discover log-linear specifications of the topological family. Ordinal models, such as the linear-by-linear or log multiplicative layer effect model, are not comprised in the model space of our Lasso-based approach, and thus they cannot be directly discovered. Nevertheless, researchers can assess whether the Lasso-based solution has a better performance than different types of models (including ordinal models) using cross-validation.
We conclude by underscoring some research areas, outside assortative mating, for which Lasso regularization could be a useful method for sociologists. A natural application of our method would be to the study of social and occupational mobility. While log-linear models have been the preferred analytical strategy in this area, in recent years, the complexity of new occupational classifications (Jonsson et al. 2009; Weeden and Grusky 2012) has generated contingency tables that are typically high dimensional and sparse, compromising the performance of conventional goodness-of-fit statistics. Precisely, we think that our proposed method would provide a direct solution to these issues, as Lasso regularization contains especially desirable properties as a model selection tool under conditions of sparse data. In addition, scholars have used log-linear models to analyze migration patterns across regions (Little and Raymer 2013; Raymer and Rogers 2007; Willekens 2016). For this, a parsimonious representation of the migration structure is chosen by using conventional goodness-of-fit statistics. Thus, if one model specification fits the data well, this model is used to indirectly estimate migration flows. Similarly to the case of assortative mating, under some circumstances, fit-statistics might not coincide in their diagnostic, and thus implementing our approach as a principled statistical criterion to inductively specify and select a model would be particularly helpful. More broadly, Lasso regularization offers a potential solution to concerns on information asymmetry and uncertainty in model selection decisions in sociology (Young 2009; Young and Holsteen 2017). As theories can be tested in a myriad of ways, model decisions may have paramount implications for the researcher’s results. In this vein, the implementation of a principled statistical criterion to inductively select an appropriate model—via the Lasso—could contribute to increase the tractability and transparency of model selection decisions. Future work could further elaborate on the details of such a procedure for a broader set of modeling techniques.
Supplemental Material
Supplemental Material, Appendix - Lasso Regularization for Selection of Log-linear Models: An Application to Educational Assortative Mating
Supplemental Material, Appendix for Lasso Regularization for Selection of Log-linear Models: An Application to Educational Assortative Mating by Mauricio Bucca, and Daniela R. Urbina in Sociological Methods & Research
Footnotes
Acknowledgments
We are grateful for helpful feedback on this work from Jeremy Cohen, Dan J. DellaPosta, Fedor A. Dokshin, Adeline Lo, Ian Lundberg, Mario Molina, Radu Pârvulescu, Brandon Stewart, and Martin T. Wells. This paper also benefited from feedback received at the PAA Annual Meeting 2017, the RC28 Summer Meeting 2017, and the Annual Popfest Conference 2017. Finally, we want to thank three anonymous reviewers for their valuable comments.
Declaration of Conflicting Interests
The author(s) declared no potential conflicts of interest with respect to the research, authorship, and/or publication of this article.
Funding
The author(s) disclosed receipt of the following financial support for the research, authorship, and/or publication of this article: Research reported in this publication was supported by The Eunice Kennedy Shriver National Institute of Child Health & Human Development of the National Institutes of Health under Award Number P2CHD047879. The content is solely the responsibility of the authors and does not necessarily represent the official views of the National Institutes of Health.
Supplemental Material
Supplemental material for this article is available online.
Notes
References
Supplementary Material
Please find the following supplemental material available below.
For Open Access articles published under a Creative Commons License, all supplemental material carries the same license as the article it is associated with.
For non-Open Access articles published, all supplemental material carries a non-exclusive license, and permission requests for re-use of supplemental material or any part of supplemental material shall be sent directly to the copyright owner as specified in the copyright notice associated with the article.
