



Abstract
We propose some theoretical and empirical advances by supplying the methodology for analyzing the factors that influence two sensitive variables when data are collected by randomized response (RR) survey modes. First, we provide the framework for obtaining the maximum likelihood estimates of logistic regression coefficients under the RR simple and crossed models, then we carry out a simulation study to assess the performance of the estimation procedure. Finally, logistic regression analysis is illustrated by considering real data about cannabis use and legalization and about abortion and illegal immigration. The empirical results bring out certain considerations about the effect of the RR and direct questioning survey modes on the estimates. The inference about the sign and the significance of the regression coefficients can contribute to the debate on whether the RR approach is an effective survey method to reduce misreporting and improve the validity of analyses.
Keywords
In survey practice, it is a well-established fact that investigating sensitive issues concerning deviant, undesirable, illegal, dishonest, incriminating, or simply personal and confidential traits by direct questioning (DQ) produces high nonresponse rates and misleading reporting. Nonresponse and untruthful responses represent nonsampling errors that can seriously flaw the quality of the collected data with harmful consequences for the validity of the final analyses. The problem cannot be completely solved, but it may be somewhat limited by assuring respondents of a high degree of anonymity, thereby enhancing their cooperation. Many solutions have been proposed to serve this purpose. One approach for encouraging greater cooperation is the elicitation of the requested information without posing any direct sensitive question to the survey participants who are thus not obliged to openly declare whether they bear stigmatizing traits. Hence, privacy is protected since true responses remain known only to the respondents, and consequently, their true status remains uncertain and undisclosed to both the interviewer and the researcher. This approach covers different procedures which are grouped under the general term of indirect questioning techniques (e.g., Chaudhuri 2011; Chaudhuri and Christofides 2013). In terms of the amount of contributions produced in the literature, the randomized response (RR) theory (RRT) plays a role of primary importance among the indirect questioning survey modes. The technique was introduced by Warner (1965) in order to collect reliable sensitive information without jeopardizing respondents’ privacy. Greenberg et al. (1969) proposed a first variant on the Warner method, called the unrelated-question model, which requires one sensitive statement and one innocuous, neutral statement (e.g., “My mother was born between January and March”). The RRT, initially conceived for dealing with binary variables denoting the presence or absence of a sensitive behavior, was rapidly adapted for more complex situations and has generated over time a vast amount of literature, including both theoretical and empirical contributions, most of which are included in the monographs by Fox and Tracy (1986), Chaudhuri and Mukerjee (1988), Chaudhuri (2011), Chaudhuri and Christofides (2013), Tian and Tang (2014), Chaudhuri, Christofides, and Rao (2016), Fox (2016), and in the two special issues of the international journal Model Assisted Statistics and Applications (Vol. 9, No. 1, 2014; Vol. 10, No. 4, 2015).
The idea underlying the binary RRT is intuitive and fascinating. Respondents are provided with a randomization device (for instance, a die, a deck of cards, a spinner, a box with colored and numbered balls) which is used to select one question from a set, some or all of which are related to the sensitive variable. The outcome of the device determines which question is selected and answered with a “yes” or “no” response. Since the respondent is instructed not to reveal to anyone which question is being answered, and both the interviewer and the researcher are kept blind about the outcome of the device, the technique enables the respondents to reply without revealing their true status, which remains unknown, and consequently, privacy is protected. Although the individual responses cannot be used to discover the true status of the respondents, the responses collected from all the survey participants can be used for inferential purposes. In fact, the randomization device, designed and controlled by the researcher, generates a probabilistic relation between the sensitive question and a released answer which is used to make inferences about unknown parameters of interest, in particular the prevalence of the sensitive attribute in the target population.
The Warner procedure applies to a population which is ideally divided into two mutually exclusive groups according to whether respondents have or do not have the sensitive attribute in question. However, in real studies, interest may be focused on more than one sensitive variable. With this in mind, Christofides (2005) proposed an RR procedure for investigating two sensitive characteristics at the same time using two randomization devices. Tian et al. (2007) proposed a method for assessing the association of two binary variables which uses a nonsensitive question instead of a randomization device. Lee, Sedory, and Singh (2013) proposed two different RR designs, called the simple model and the crossed model, to simultaneously collect data on two sensitive attributes and estimate their prevalence in the population together with other characteristics of association. The recent contribution by Ewemooje, Amahia, and Abedola (2017) also goes in the direction of examining the prevalence of two related sensitive characteristics. Perri, Pelle, and Stranges (2016) employed the crossed model by Lee et al. (2013) in a real survey to investigate induced abortion and the illegal immigration status of female immigrants. Although during the study a number of sociodemographic variables were surveyed by means of face-to-face interviews, the main emphasis of the research focused on estimating the prevalence of the two sensitive attributes, for the entire population and subgroups of it, without using other individual characteristics. Indeed, in social and behavioral sciences, interest generally goes beyond determining the prevalence of deviant behaviors, stigmatizing traits, or incriminating attitudes but rather extends to the associations between several variables. Motivated by this need, the present article aims at combining the collected RR data with other nonsensitive information on respondents and estimating the determinants of the sensitive behaviors by including available covariates in a bivariate logistic regression model that assumes, as dependent variables, the observed “yes” and “no” responses stemming from the RR crossed model questioning format. For completeness, theoretical developments are also extended to the simple model, even if no empirical analysis is supplied.
Due to the artificial variance that affects the response variable when subject to RR, traditional regression techniques are not suitable for RR data and need to be adapted to this new framework. The idea of applying logistic regression models to RR dates back to Maddala (1983), who complained about the lack of methods for estimating the factors that affect sensitive behaviors. Scheers and Dayton (1998) developed logistic regression models for the Warner device and the unrelated-question technique. Van den Hout, Van der Heijden, and Gilchrist (2007) elaborated the multivariate logistic regression model for two RR variables as presented by Glonek and McCullagh (1995), while Corstange (2009) proposed a method to estimate the parameters of a hidden logistic regression model. For the unrelated-question technique, Hsieh, Lee, and Shen (2010) presented a logistic regression model in the presence of missing covariates. Recently, Hsieh et al. (2016) used a logistic regression model based on an RR design which jointly considers the Warner method and unrelated-question technique and can effectively improve the efficiency of the maximum likelihood (ML) estimator of Scheers and Dayton (1998). Cruyff et al. (2016) provided a review of regression procedures for RR data, including univariate and multivariate logistic regression. Applications of the RR logistic regression model may be found, among others, in Kerkvliet (1994), Elffers, Van der Heijden, and Hezemans (2003), Lensvelt-Mulders et al. (2006), Van den Hout et al. (2007), Jann, Jerke, and Krumpal (2012), Krumpal (2012), Wolter and Preisendörfer (2013), and Korndörfer, Krumpal, and Schmukle (2014).
Following the theoretical approach discussed in Van den Hout et al. (2007), in this article, we extend bivariate logistic regression analysis to RR data that are assumed to be produced according to the simple model and crossed model. For both models, methodological aspects are supported by simulated experiments and, for the RR crossed design only, by two empirical analyses performed on real RR data. Hopefully, our contribution can support and further the applications of these RR models.
The outline of the article is as follows. First, we introduce the notation and the design for the simple and crossed models in the absence of covariates. Then, we discuss a bivariate logistic regression model under the aforesaid RR designs and provide the theory for ML estimation. Afterward, we present the results of a Monte Carlo simulation study carried out to investigate the finite-sample properties of the estimates of the logistic regression coefficients for the simple and crossed models. Next, we provide two applications based on real RR data collected with the crossed model. The first application is a study conceived to investigate two sensitive variables, cannabis use and cannabis legalization, using both RR and DQ survey modes; the second revisits the RR survey presented in Perri et al. (2016) related to induced abortion and illegal immigration status of female immigrants. Some final comments conclude the work.
Method
A Review of the Warner Model
We start with the design of the original related-question RR model conceived by Warner (1965) as a way of introducing the notation and making a bridge with the RR methods suggested by Lee et al. (2013). The basic idea is to randomize whether a respondent has to answer the sensitive statement (A) or its inverse (Ac
). In order to illustrate the Warner procedure, let us assume that each female respondent is provided with a deck of cards marked with the following two statements:
A: I have had an abortion.
Ac
: I have never had an abortion.
Let p denote the proportion of cards marked with the statement A, and
In order to set a general framework for developing the theoretical aspect of the problem, let, without loss of generality, Y
1 be a latent RR binary variable (i.e., a sensitive variable subject to RR) that models the response to the sensitive statement (i.e., statement A in the aforementioned example), with

Similarly, we can determine probability

the misclassification (or transition) matrix of

The prevalence estimate of the sensitive attribute A can be obtained from equation (1). If

Let us assume, now, that a second sensitive characteristic, related to the first, has to be surveyed. For instance, the status of female immigrants in a country may be of interest for the researcher investigating induced abortion (see, e.g., Perri et al. 2016). Hence, the sensitive attribute to be studied is the status of female immigrants, and the aim is the estimation of the prevalence of women without the legal status.
As in the previous example, a deck of cards marked with the following two statements is used to randomize the response:
B: I am an irregular immigrant.
Bc
: I am a regular immigrant.
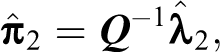
Hence, according to the previous setting, and without loss of generality, let Y
2, S
2, and
with an obvious meaning of the symbols employed.
Indeed, when two (or more) RR-sensitive variables are considered which are correlated with each other and simultaneously surveyed in the same population, the emphasis may be placed on different prevalence estimates and some measures of association. In this spirit, Lee et al. (2013) proposed two methods for studying the association between two sensitive characteristics and estimating many different population parameters from a single sample and a couple of responses from each survey participant. Hence, using the notation already introduced in two observable variables
After these preliminary remarks, in the next two sections, we will describe the Lee et al. (2013) simple and crossed models in terms of misclassification probabilities. For simplicity, we will continue referring to the two sensitive attributes previously delineated through statements A, Ac , B, and Bc . Specifically, we will define the transition matrix associated with the two RR designs and express them in a matrix form in such a way as to include them in the framework outlined by Van den Hout et al. (2007) and, hence, incorporated in an RR bivariate logistic regression model.
Simple Model
The implementation of the simple model may be described as follows. Each respondent is provided with two randomization devices such as two decks of cards, say deck I and deck II, with deck I containing cards marked with the statements A and Ac , and deck II with cards of type B and Bc as in the previous section. Respondents are asked to shuffle the two decks, select a card from each deck, and report a simultaneous response to the statements on the selected cards. Hence, each respondent provides a couple of responses which may be (no, no), (no, yes), (yes, no), or (yes, yes). Note that each deck of cards acts as a Warner randomization device.
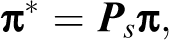
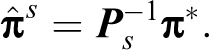
According to the results previously shown for the Warner design, the misclassification for

Hence, the misclassification design for the RR simple model may be expressed as:
and
Crossed Model
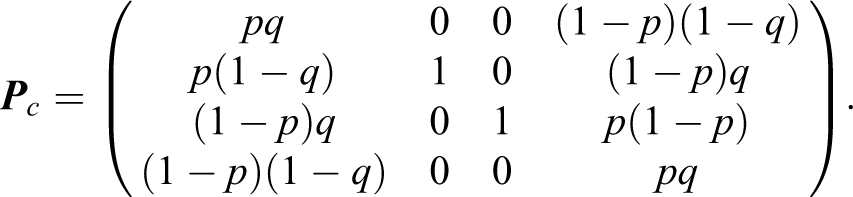
The procedure for collecting data is the same for the simple model, the only difference being the statements marked on the cards of the two decks. In fact, a proportion p of cards in deck I are marked with statement A and the remainder with statement Bc
. Conversely, cards in deck II show the statements B and Ac
in proportions q and
For this design, the transition matrix of
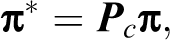
Accordingly, the crossed model can be expressed as:
and

ML Estimation for RR Bivariate Logistic Regression Model
We consider the multivariate logistic regression model proposed by Glonek and McCullagh (1995), and, following Van den Hout et al. (2007), we adapt it to the bivariate model with RR data collected using the simple and crossed models previously discussed. Preliminarily, it is worth remarking that, due to the randomization procedure which misclassifies the dependent variable and introduces artificial variability, it is not possible to employ standard regression estimation techniques as in the situation where collected data are not subject to RR. ML estimation requires that the likelihood function be modified in order to incorporate the randomization design. Hence, maximization can be achieved following the usual iterative procedures.
For two latent binary RR variables Y 1 and Y 2, the bivariate logistic regression model may be described in the context of the well-known family of generalized linear models through the link functions:

where

where

where
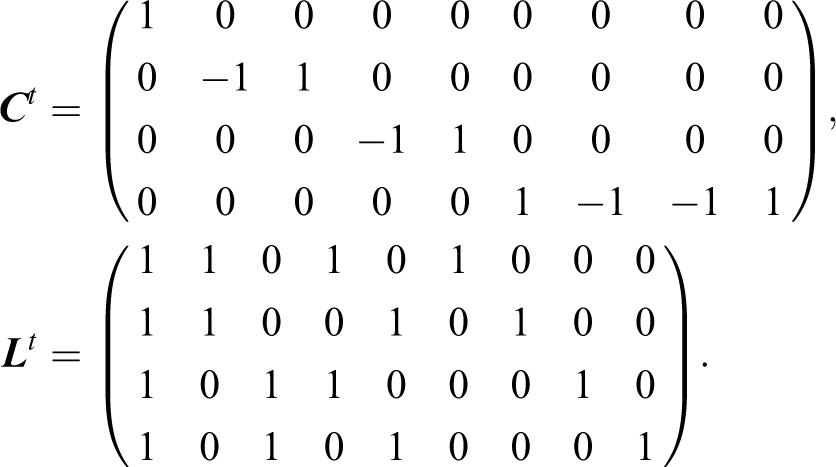
Note that equation (4) is a marginal model in the sense that it implies univariate logistic models for both Y
1 and Y
2 marginally (Glonek and McCullagh 1995). ML estimates of vector

where
Given a sample of n selected units, the bivariate logistic regression model for the ith observation,
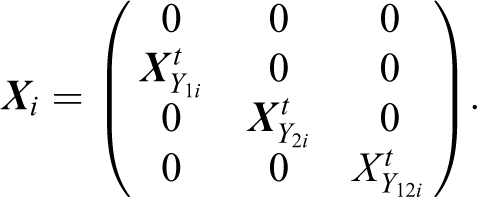
Note that the elements of the first row of

Simulation
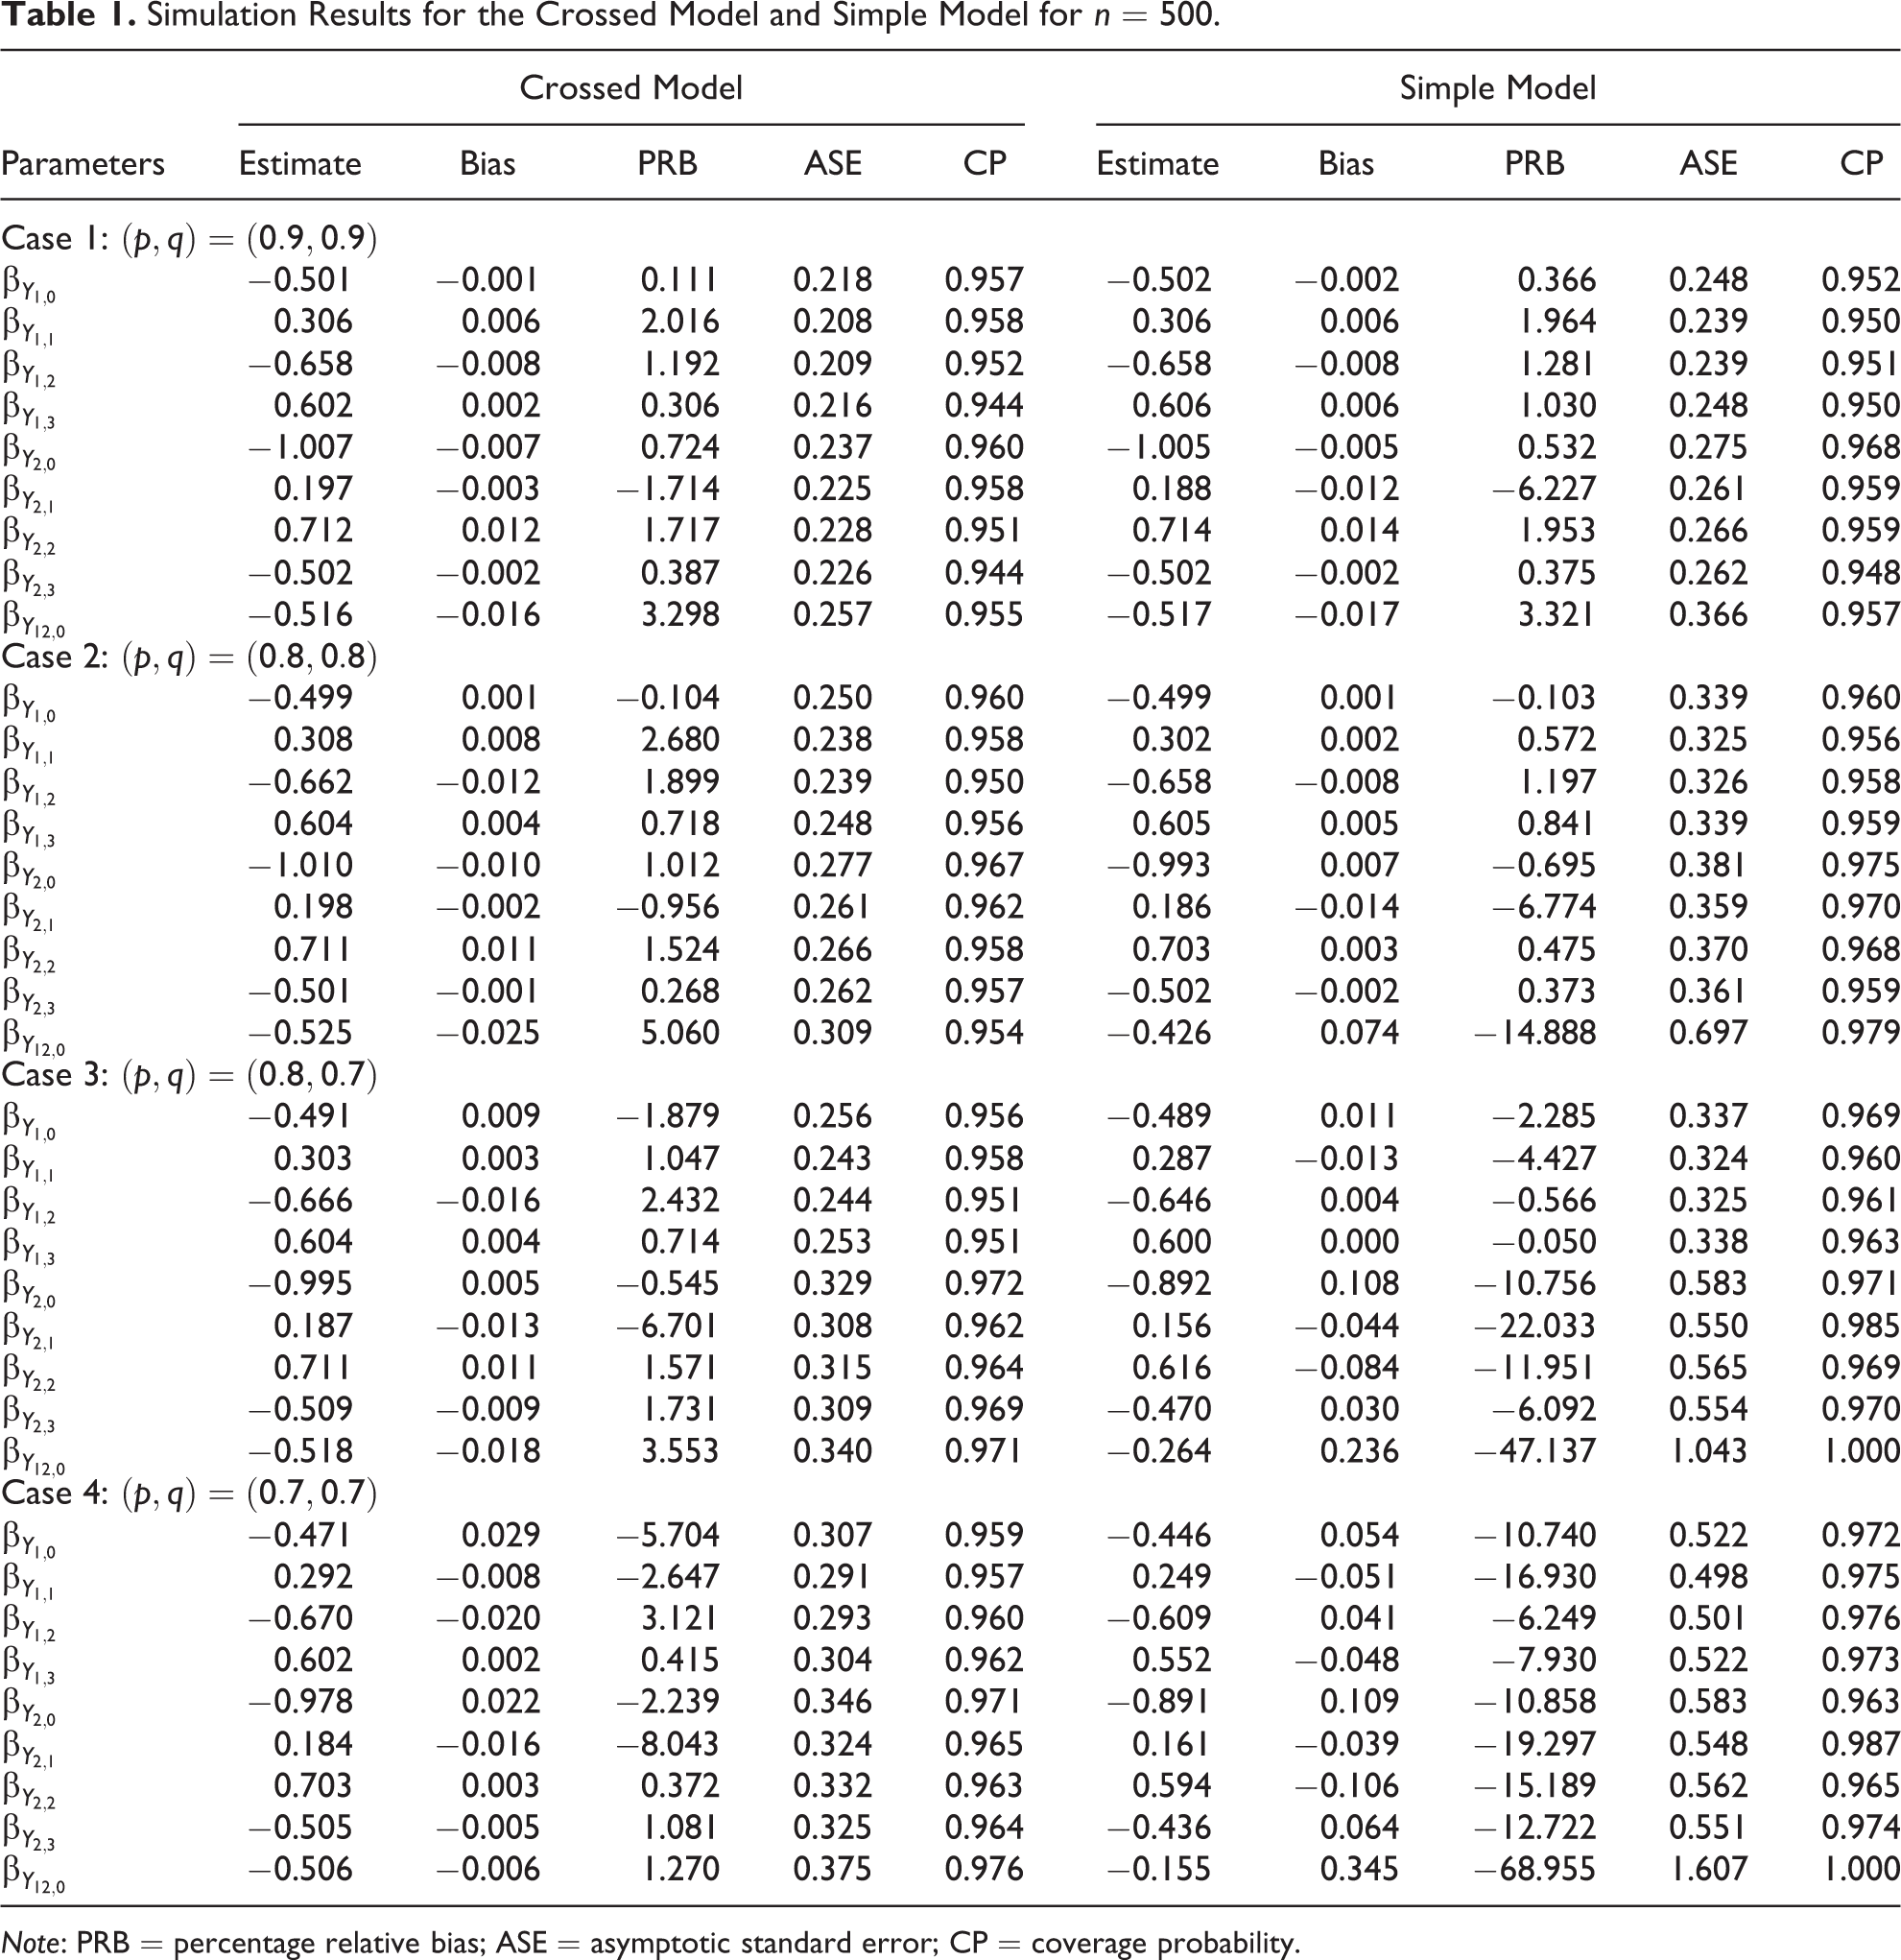
In this section, we present the results of a Monte Carlo simulation study carried out to investigate the finite-sample performance of the bivariate logistic regression estimates under the simple and crossed models. For each configuration of the simulation experiments, we use sample sizes of
We consider the case with three covariates, say X
1, X
2, and X
3, which are binary variables with
The simulation findings for the crossed model and simple model are reported in Table 1 for
Simulation Results for the Crossed Model and Simple Model for n = 500.
Note: PRB = percentage relative bias; ASE = asymptotic standard error; CP = coverage probability.
Simulation Results for the Crossed Model and Simple Model for n = 300.
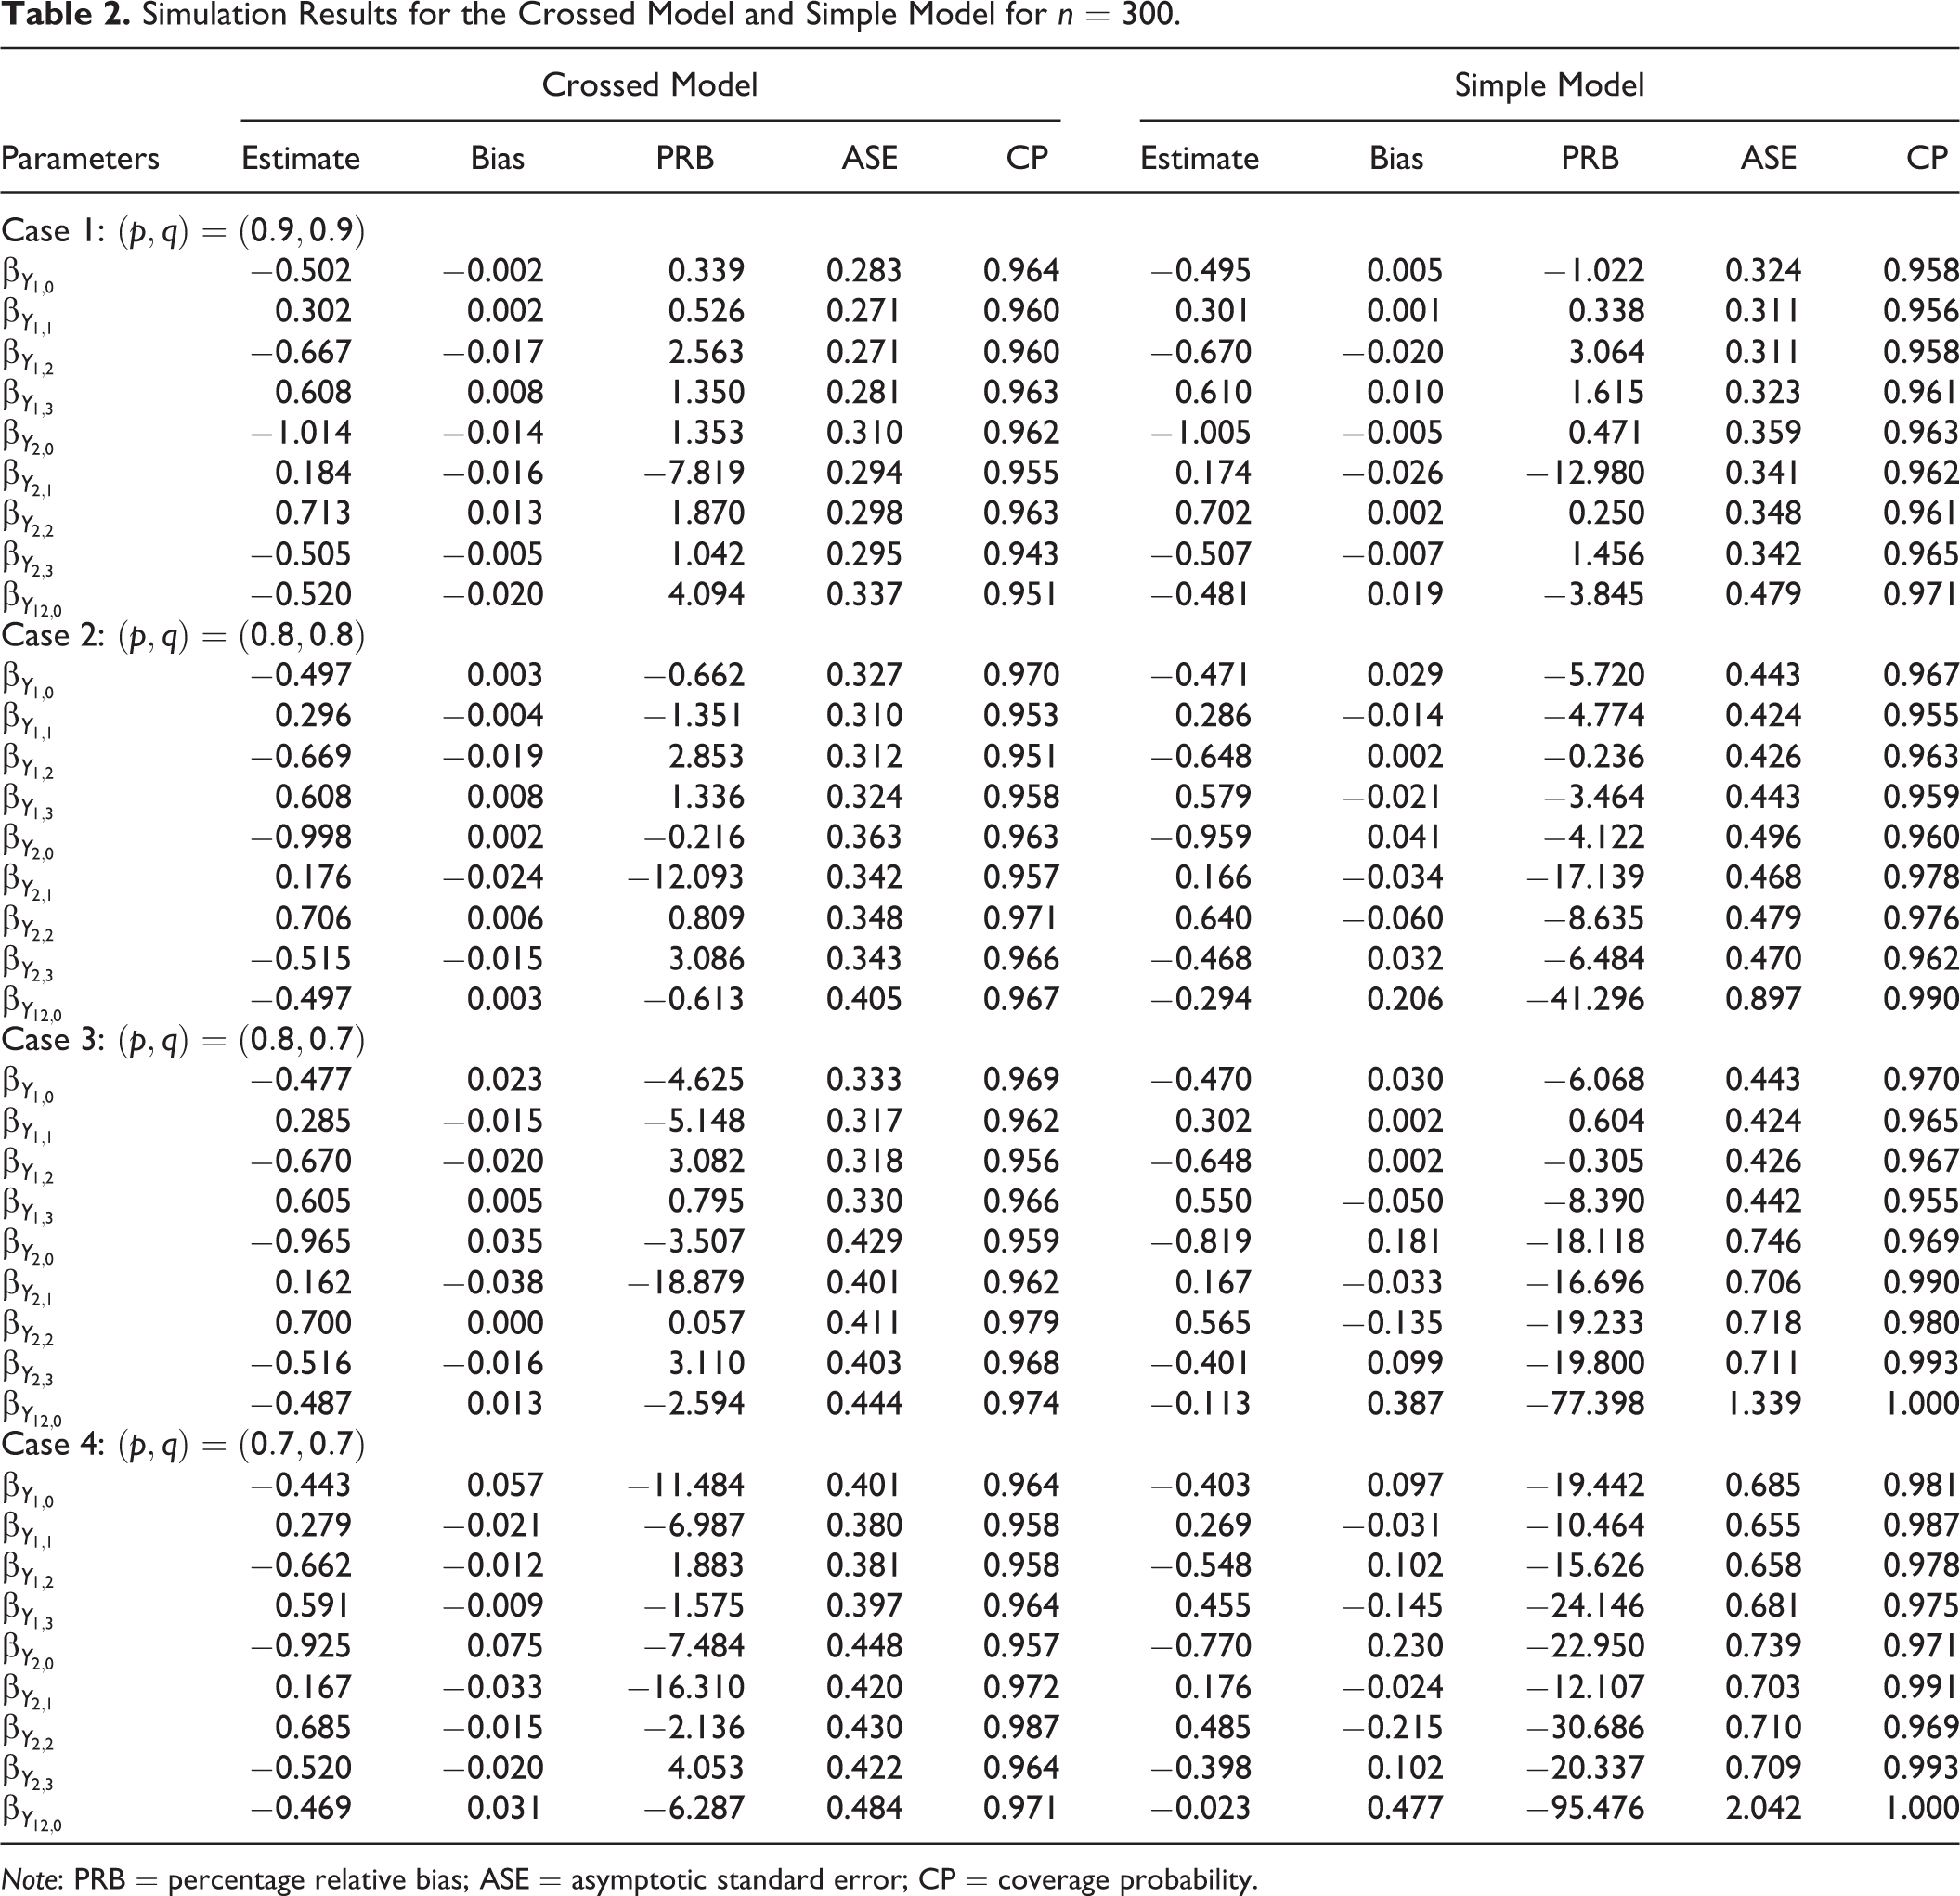
Note: PRB = percentage relative bias; ASE = asymptotic standard error; CP = coverage probability.
In order to compare the two RR designs, the simple model seems to suffer from lack of efficiency, especially when the values of p and q and the sample size decrease. Estimates under the crossed model show smaller ASE and tend to have smaller bias, especially for
Two Real Studies
We apply RR logistic regression to real data collected by means of the crossed model in order to evaluate the feasibility of the method in estimating the determinants of two sensitive attributes. Data from two small-scale surveys are analyzed. Both studies are face-to-face surveys with interviewer-administered paper-and-pencil questionnaires. The first survey considers the use of cannabis for recreational purposes and its legalization. Conceived as a pilot study, it was designed ad hoc to collect both RR and DQ data and to compare logistic regression estimates under the two question survey modes in order to check whether the impact of factors determining the response behaviors varies across the two survey approaches. The study has, hence, intrinsic value in terms of comparative validation and can contribute to the debate regarding whether DQ surveys are reasonably accurate and useful for estimating the determinants of illegal drug use (see, e.g., Kerkvliet 1994). The second survey is related to the study discussed in Perri et al. (2016) on induced abortion and illegal immigration. Here, only RR data are considered and analyzed.
It is worth pointing out right away that the two applications are not intended as sociological and demographic studies aimed at discovering facts and providing interpretations and motivations of the observed findings. Nonetheless, they may offer the experts in the research fields some useful elements for further investigation. The next two sections describe the survey designs and present the results of the bivariate logistic regression analyses.
Cannabis Use and Its Legalization
The survey was conducted in a municipality of about 5,000 inhabitants located in Southern Italy. The motivating idea of the study is twofold: (1) estimate the prevalence of individuals who have used cannabis at least once in their life and those who are in favor of its legalization (either for therapeutic or recreational purposes) and (2) show whether the impact of individual determinants may differ across data collection modes. To this end, data have been collected on the same people with both the RR crossed model and the DQ survey format. Following the crossed model, the randomization device was implemented exactly as previously described by means of two decks of cards, with deck I containing a proportion
The fieldwork was realized by a single interviewer who recruited a voluntary sample of respondents on the basis of personal contacts. Participants were first submitted to a face-to-face interview using a short paper-and-pencil standardized questionnaire containing some generic sociodemographic information about gender, age, education, employment status, marital status, and the number of children. Then, once a confidential atmosphere had been established, interviewees were provided with the two decks of cards in order to implement the RR crossed device. The interviewer asked the respondents to shuffle the cards, draw one card from each deck, read the statements on the selected cards without revealing them, and report in “yes” or “no” fashion on whether their status did or did not match the statements on the cards. Hence, each respondent provided just one of the possible pairs of responses: (no, no), (no, yes), (yes, no), or (yes, yes). The interviewer was instructed to check by an example, before embarking on the RR survey, on whether the survey participants fully understood the rules of the randomization device. In the event of doubts or questions raised about the correct execution of the experiment, the interviewer was instructed to explain the rules again and invite the participants to desist if any doubts remained after the third explanation or if they were unable to implement the technique properly. After the crossed model was run and the responses were collected, the interviewer posed the two sensitive questions directly. At the end of the period scheduled for the collection of the data, the analyzable cases included 289 participants, aged 16–60 years, who gave all the information required during the face-to-face interview.
In order to perform our analyses, let Y
1 denote the observed answer to the question “Have you used cannabis at least once in your life?” and Y
2 the observed answer to the question “Are you in favor of cannabis legalization?” with
Prevalence estimation without employing covariates
Using both types of collected data, we first obtain prevalence estimates of the investigated behaviors without employing covariates. Specifically, under DQ responses on Y
1 and Y
2, we get the prevalence estimate of

Consequently, the prevalence estimate of individuals who have used cannabis at least once in their life, say

and, consequently, the RR estimates of
Prevalence Estimates Under DQ and RR Survey Approaches Without Covariates.

Note: DQ = direct questioning; RR = randomized response.
Table 4 reports the distribution of the entire sample by sociodemographic characteristics and gives evidence on the association between the six individual characteristics and the two sensitive attributes under investigation through the chi-squared independence test. We observe that gender is almost equally represented (46.71 percent of respondents are female and are 53.29 percent male) and 46.02 percent of respondents are aged 35–60 years. Most interviewees (66.44 percent) claimed to have a medium or high level of education (nine or more years of school), while the remainder have a low level (less than nine years). Turning to the employment status, about 50 percent of interviewees have a job. Just over half of respondents claimed to be married or cohabiting and with no children (52.25 percent and 52.60 percent, respectively).
Sociodemographic Characteristics of Respondents for DQ Data
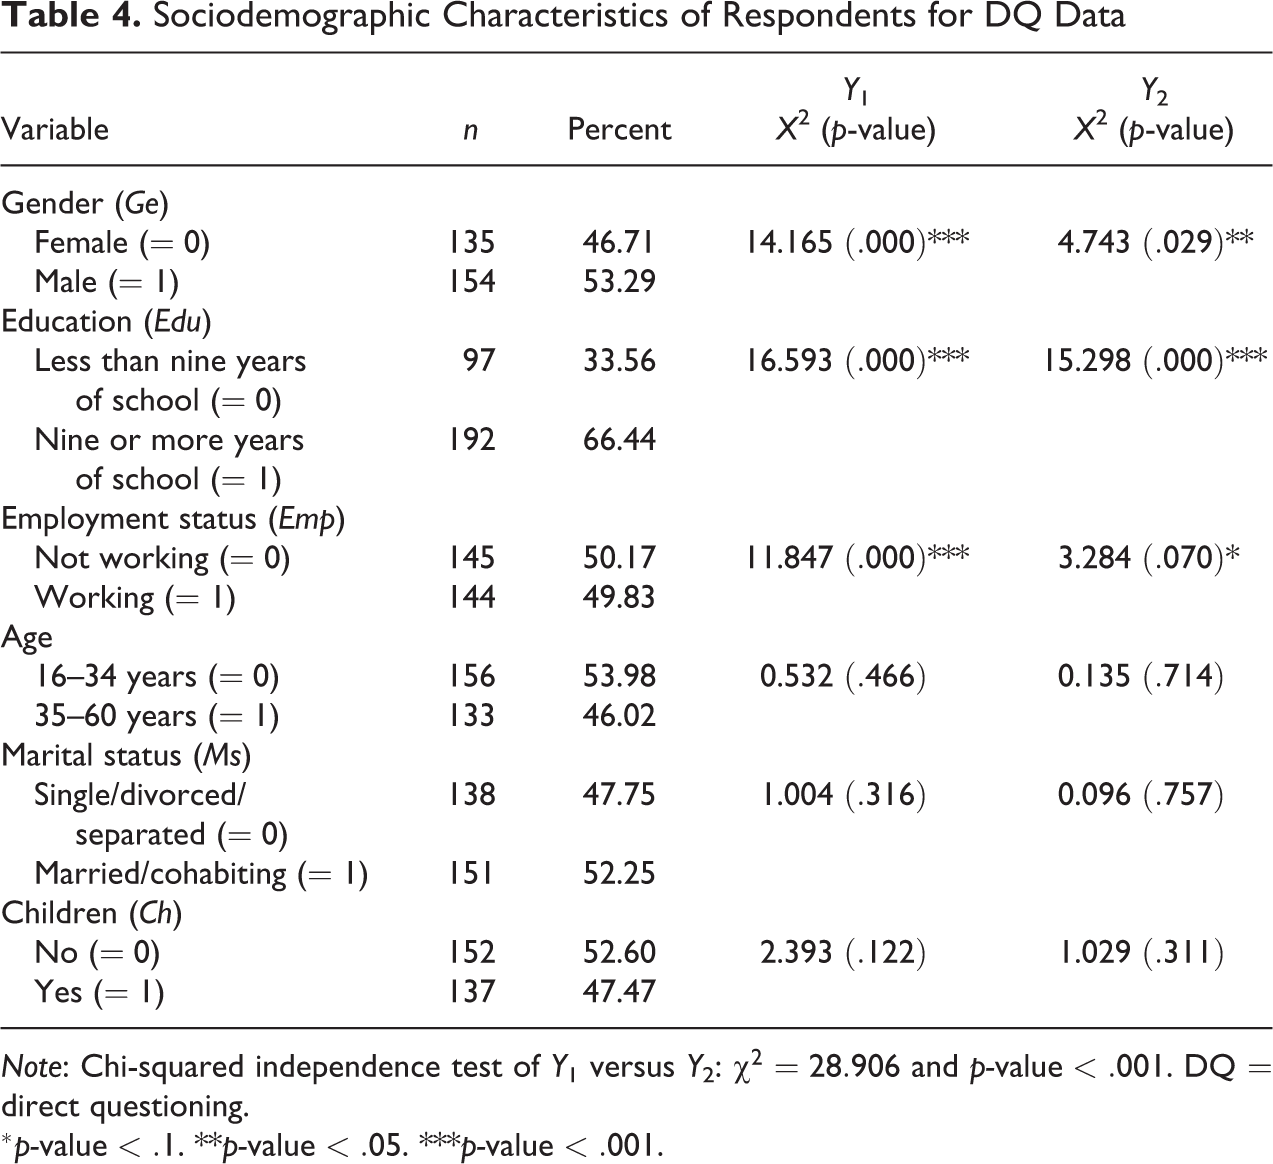
Note: Chi-squared independence test of Y
1 versus Y
2:
Some associations appear statistically significant. Specifically, the group of respondents who reported having used cannabis (
To examine such possible effects of the two sensitive behaviors further, we first consider two marginal univariate logistic regression models for Y 1 and Y 2 which include six binary variables for the full model in Table 5. From our analysis, we note that cannabis use is more likely for males, highly educated people, and people with a job and less likely for people who have children or are married or cohabiting. Moreover, the probability of cannabis use increases with age. Similar results, except for the sign of the variable Ms, are observed for the determinants that affect Y 2. After sequentially removing all these nonsignificant background variables, we examined the three variables Ge, Edu, and Emp for the reduced model. For both the response variables Y 1 and Y 2, DQ data produce statistically significant estimates for the effects of Ge and Edu, while the determinant Emp has a significant positive effect only on Y 1, even though its effect becomes smaller and its significance lessens in the reduced model in Table 5.
Univariate Logistic Regression Analysis for DQ Data.
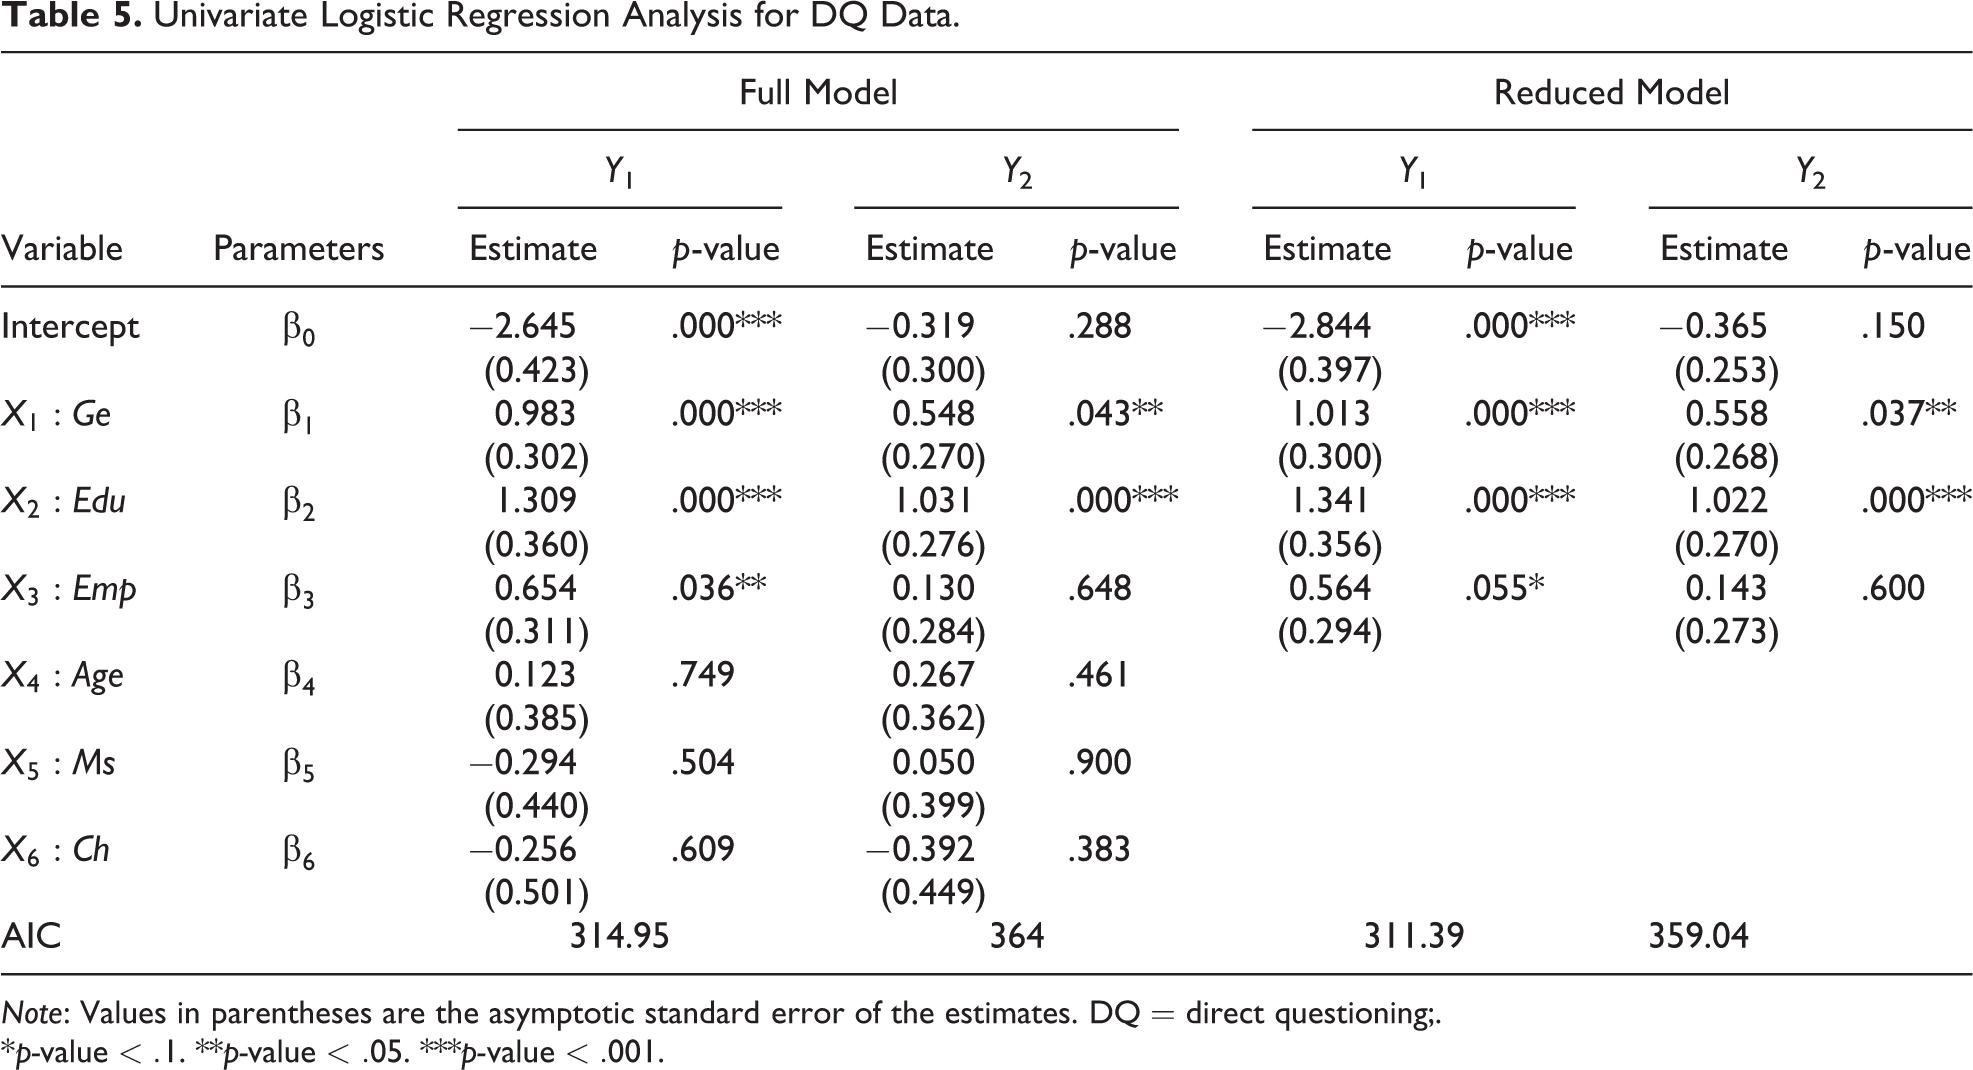
Note: Values in parentheses are the asymptotic standard error of the estimates. DQ = direct questioning;.
*
Bivariate logistic regression analysis for RR and DQ data
Table 6 reports the bivariate logistic regression analyses between cannabis use (Y 1) and cannabis legalization (Y 2) using the same two sets of covariates: one that includes six variables for the results of the full model and the other only the variables Ge, Edu, and Emp for the results of the reduced model. The results highlight interesting comparisons between the RR and DQ survey modes. We preliminarily remark that the interpretation of the regression coefficients estimated on RR data mimics that for DQ estimates.
First, looking at the DQ estimates, we observe that the effects and the significance of the determinants are nearly the same as in the univariate models. The effects of
For the RR crossed design and full model, we observe that the association between Y
1 and Y
2 is significant (
Bivariate Logistic Regression Analysis for RR and DQ Data.
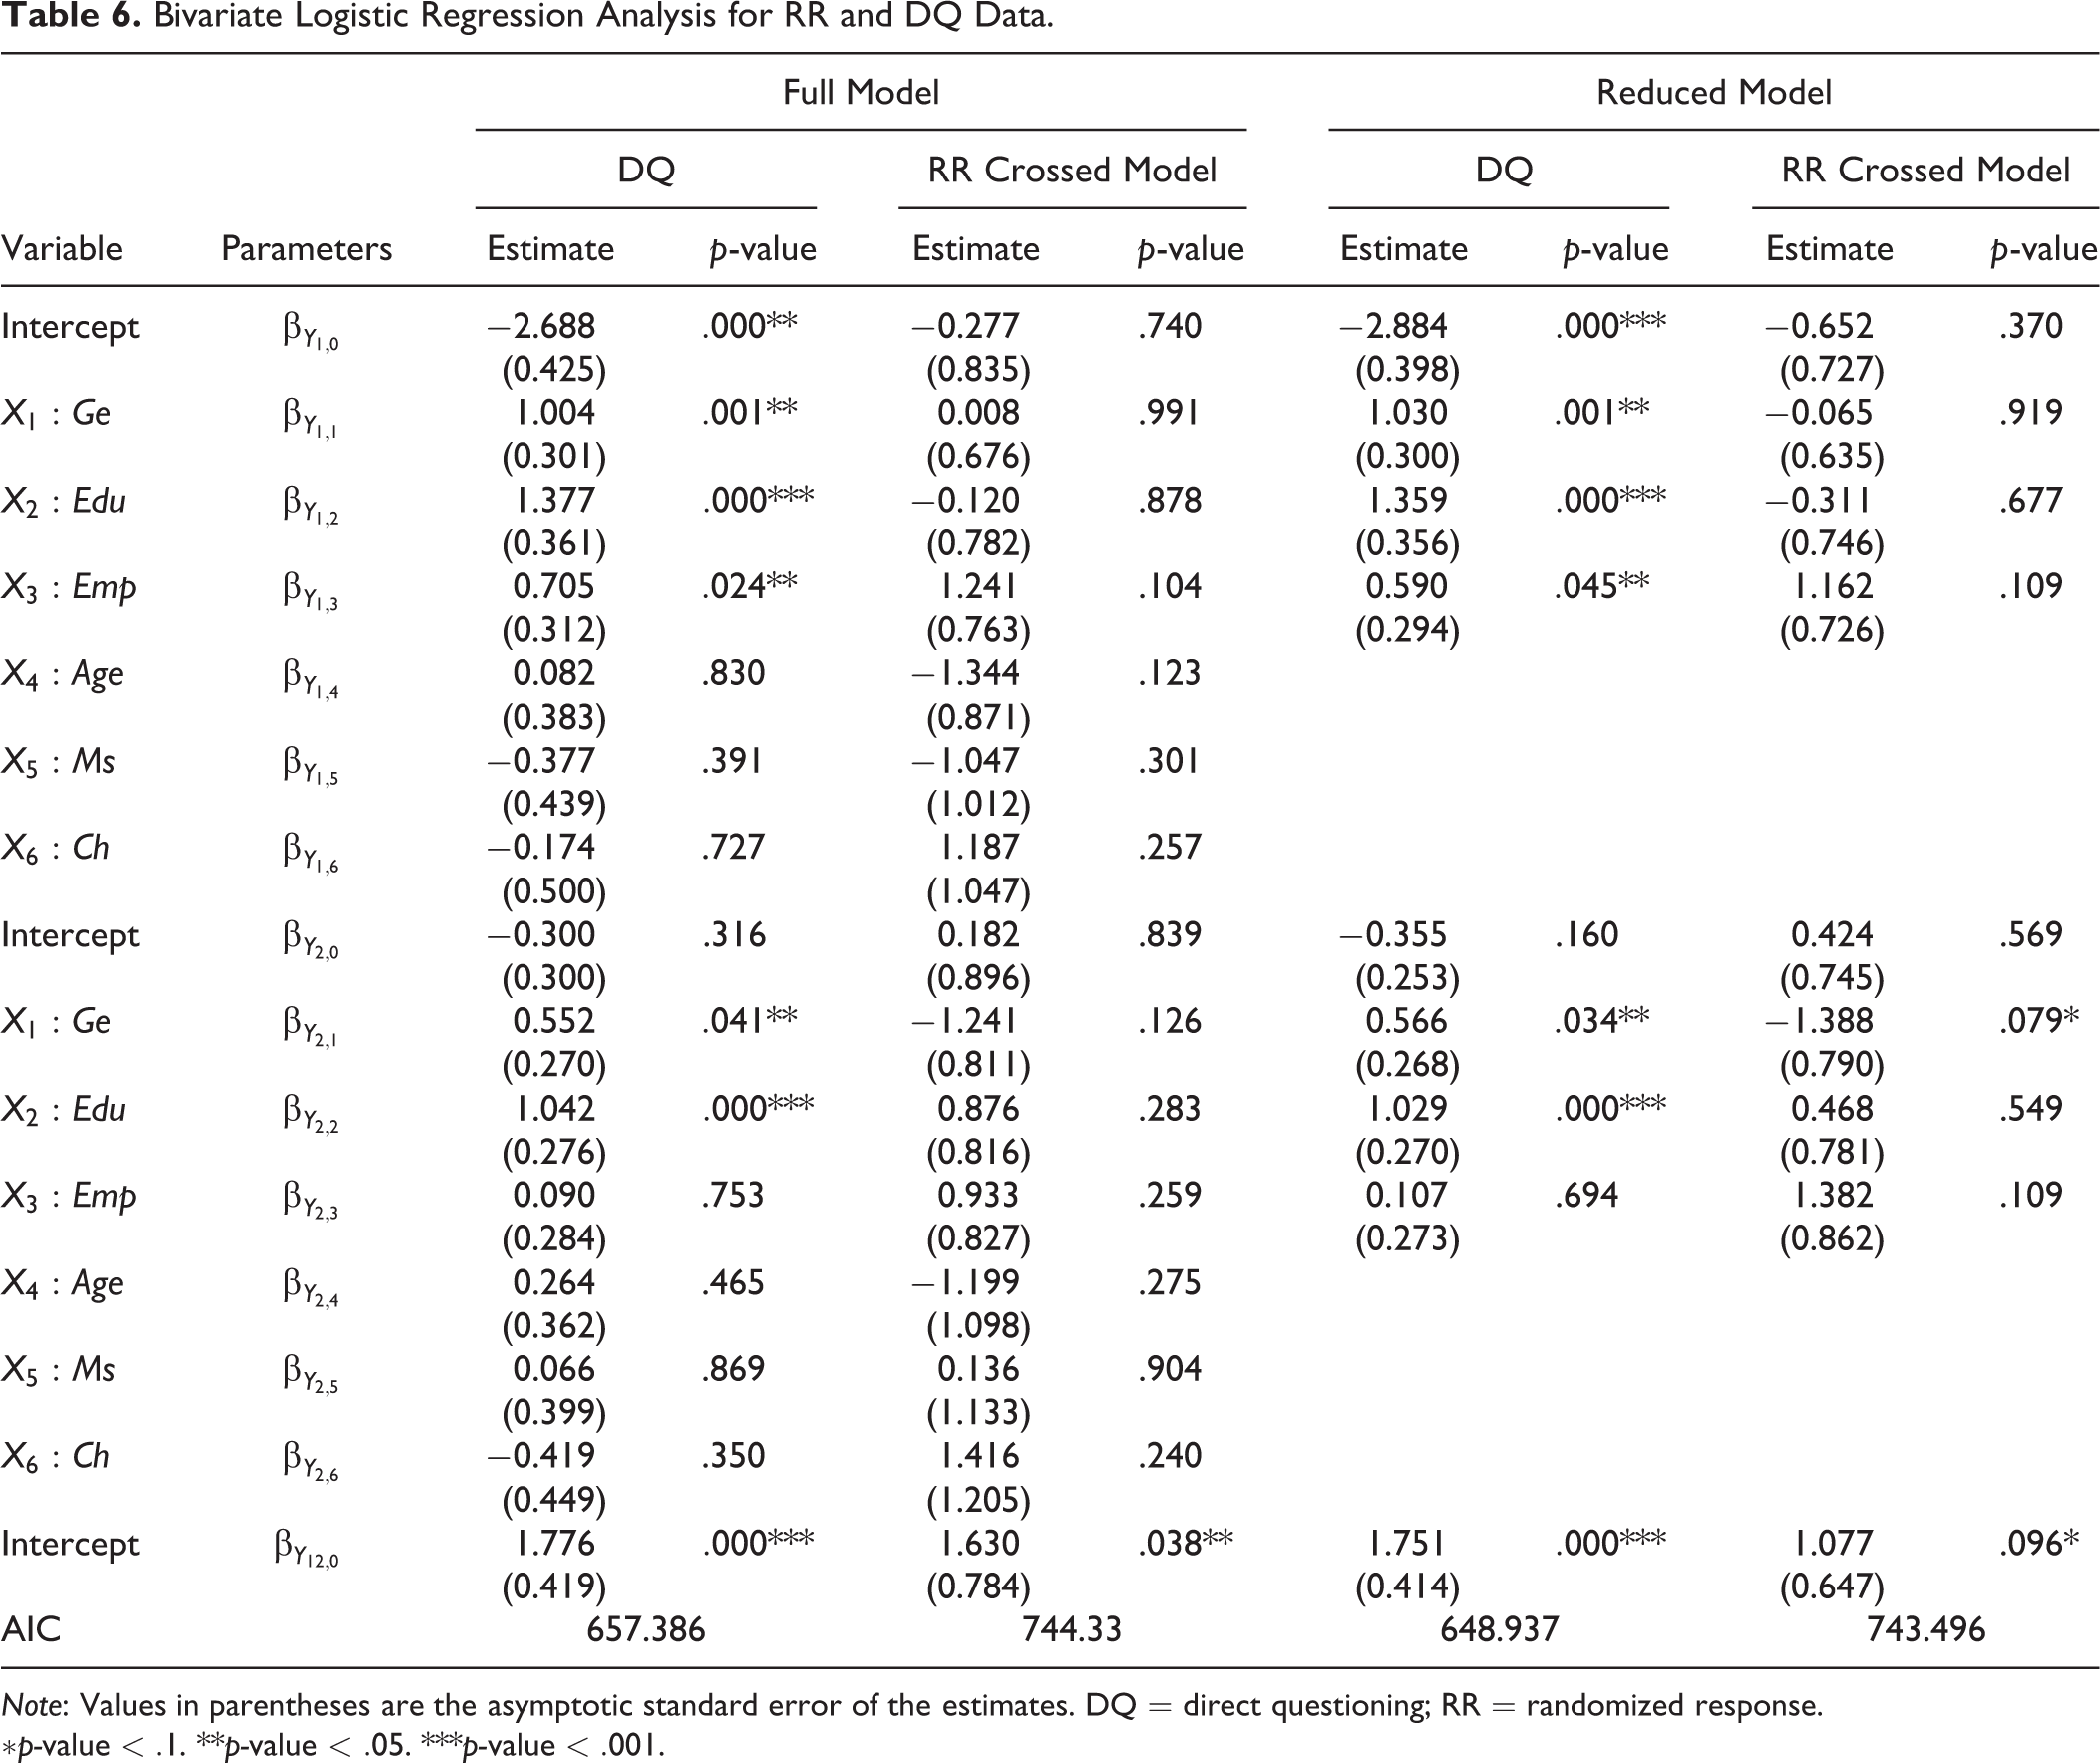
Note: Values in parentheses are the asymptotic standard error of the estimates. DQ = direct questioning; RR = randomized response.
At first sight, this finding might not sound promising even if, upon deeper analysis, it is not so surprising given the (modest) size of the sample (n = 289) and considering that, in general, the RRT adds a random noise to the responses that reduce the statistical efficiency of the inferential procedures. This lack of efficiency represents the cost of enhancing respondent privacy protection and increasing cooperation. For the RR crossed design, this aspect clearly emerges from Table 6, where we observe that RR estimates are always affected by higher standard errors than DQ. As a consequence, the higher standard error of the estimates is likely to significantly reduce the statistical power of the testing procedure for the regression coefficients, and larger sample sizes would be required to achieve the same level of precision as DQ estimates. Undoubtedly, the statistical power of RR analysis depends on several factors such as the prevalence of the sensitive attribute, the RR design, and the randomization probabilities (see, e.g., Ulrich, Schröter, and Stringel 2012). That said, it is not so easy to determine in advance the sample size required to yield a sufficiently high level of statistical power and reduce Type II error. To our knowledge, no statistical power analysis for the RR crossed and simple models has been carried out in the literature, so we do not have sufficient information to assess the extent of the problem. The issue, which is beyond the scope of this article, certainly deserves more attention and may be the object of future investigation. The lack of statistical power is not the sole reason for why regression coefficients do not appear significant. A more epistemological and theoretical reason can be adduced: It is based on an underlying assumption of the RRT, according to which the indirect questioning survey modes should eliminate or at least reduce the effects of individual attributes of the respondent and/or situational characteristics of the interview. In line with this hypothesis, discussed and supported, for instance, in Wolter and Preisendörfer (2013), the covariates are not expected to be significant in predicting the response variables. Therefore, if that expectation were well grounded, the assumption would be confirmed by our work. Unfortunately, at the moment, there is insufficient empirical evidence in the literature to support this working hypothesis, and the same results in Wolter and Preisendörfer (2013) are not fully confirmatory.
As stated by Kerkevliet (1994), differences between the estimates of the regression coefficients with RR and DQ data can be used to evaluate the sensitivity (or fragility) of the two survey modes. Large differences (in the sign and the statistical significance of the coefficients) would tend to vitiate the usefulness of DQ data on drug use. Due to these ascertained differences in our analysis, we would have reasons to support many of the criticisms directed at DQ, according to which DQ data are likely to produce biased conclusions on the determinants of drug use. Nonetheless, even if our results seem to point in that direction, in the light of the questions raised previously, we prefer to be more cautious and maintain a low profile, without venturing any definitive conclusion on the validity of one method rather than another. Certainly, with hindsight, a larger scale survey would have been useful to disentangle the question about the statistical performance of the crossed model in investigating the determinants of cannabis use and its legalization, but, following the Kerkevliet (1994) RR survey based on 215 students, and considering our limited resources, we felt that a sample size of around 300 units would be sufficient for a pilot study and to implement the RR bivariate logistic model.
To conclude the section, we display in Table 7 the point prevalence estimates and the 95 percent confidence intervals for
Prevalence Point Estimate and Wald 95 Percent Confidence Interval (CI) From Bivariate Logistic Regression Model for Cannabis Use and Its Legalization.

Note: DQ = direct questioning; RR = randomized response.
Induced Abortion and Illegal Immigration
We perform a bivariate logistic regression analysis based on RR data to simultaneously evaluate the determinants of two sensitive topics, that is, induced abortion and illegal immigration, previously investigated by Perri et al. (2016) without making use of covariates.
According to Italian legislation on immigration, “irregular status” is defined as lack of documents (residence permit or any other authorization) which allows a foreigner to legally reside in the country. Data on the subject have been collected only through the RR crossed survey model, whose details, together with estimates of the prevalence of the two phenomena, are provided in Perri et al. (2016). In short, the survey was realized in Calabria, a region in Southern Italy, and involved a convenience sample, spread across the entire region, of
Prevalence estimation without employing covariates
Let Y
1 and Y
2 denote the two latent sensitive variables indicating abortion and immigrant status, respectively. Moreover, let

from which it follows that
Bivariate logistic regression analysis for RR data
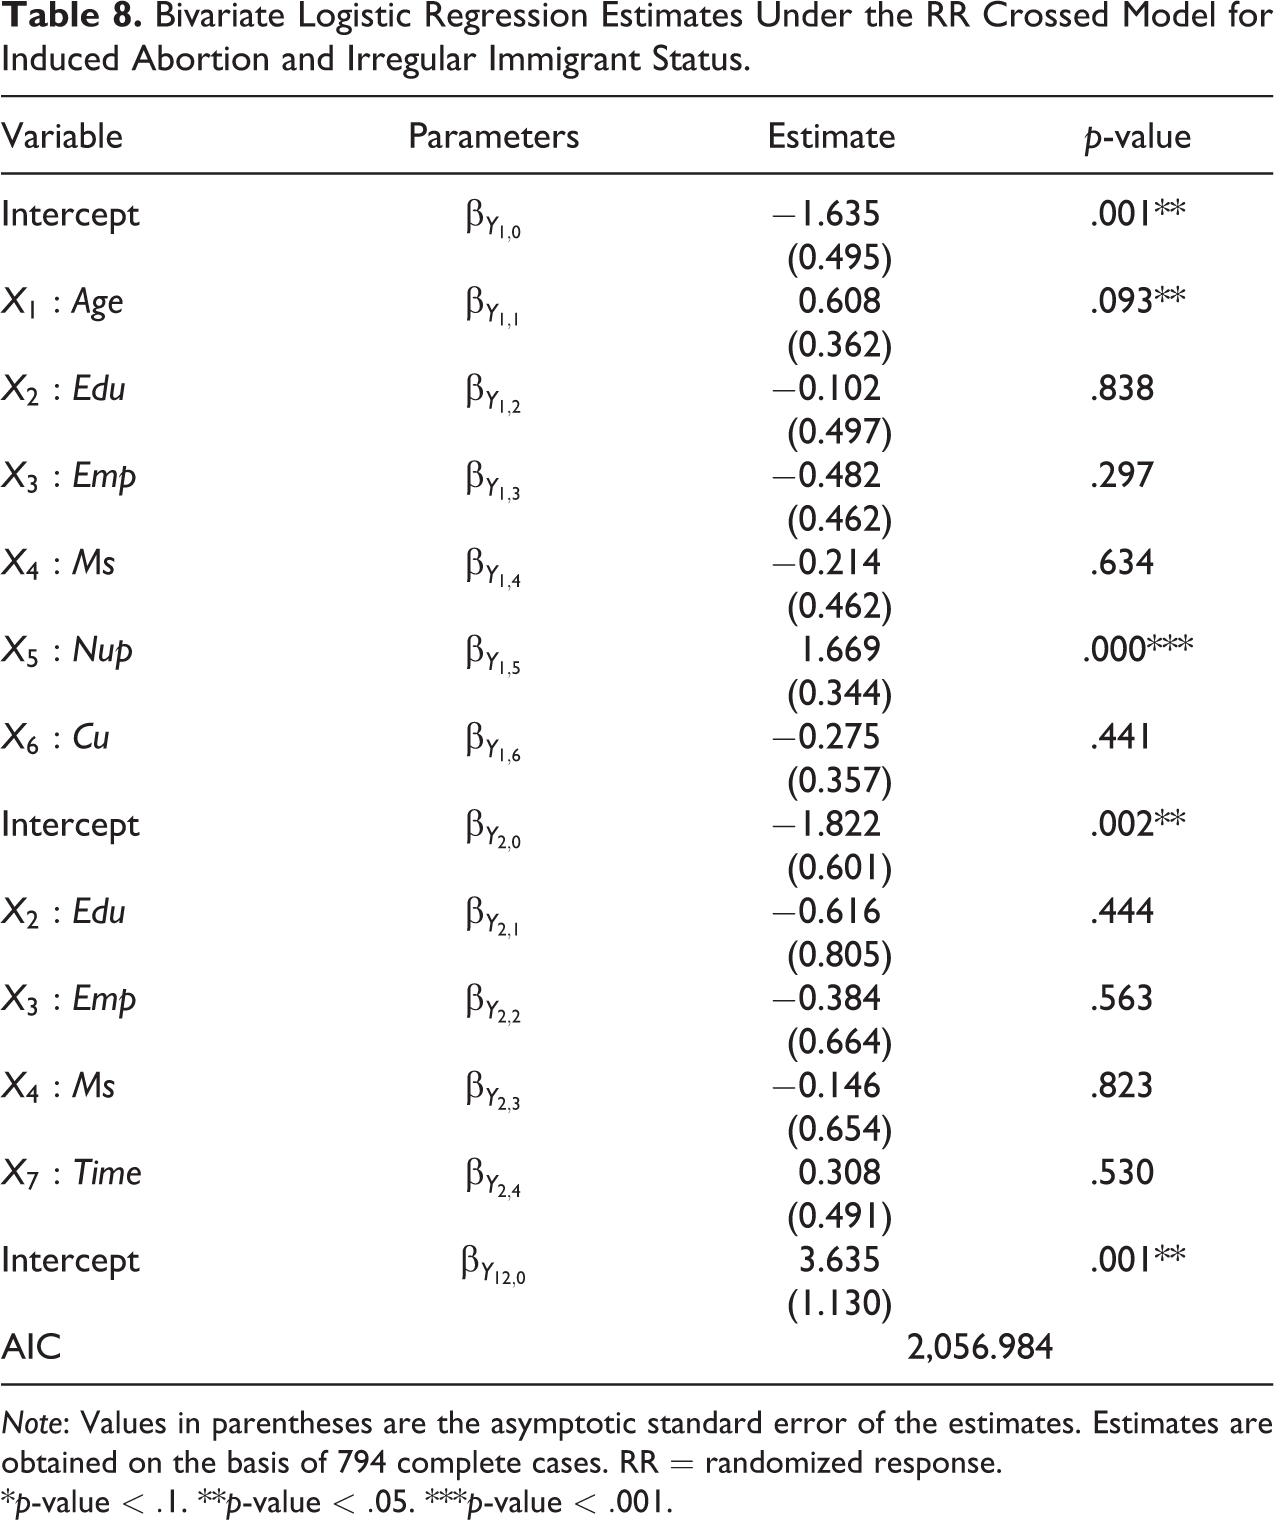
Bivariate regression analysis between abortion (Y 1) and irregular immigrant status (Y 2) is performed using the following binary sociodemographic variables: age (Age; 15–34 years = 0; 35 years or more = 1), education (Edu; 13 years or more = 1), employment status (Emp; not working = 0, working = 1), marital status (Ms; single/separated/divorced = 0, married/cohabiting = 1), number of unwanted pregnancies (Nup; 1 or more = 1), contraceptive use (Cu; no = 0, yes = 1), and time spent in Italy (Time; 6.5 years or more = 1). A number of models have been estimated using different combinations of covariates for Y 1 and Y 2. For brevity, and the sake of illustration, we shall only comment on the results for the model presented in Table 8. Note first that there are 794 subjects in the validation data set.
Bivariate Logistic Regression Estimates Under the RR Crossed Model for Induced Abortion and Irregular Immigrant Status.
Note: Values in parentheses are the asymptotic standard error of the estimates. Estimates are obtained on the basis of 794 complete cases. RR = randomized response.
*p-value
Older women and those who have experienced unwanted pregnancies are much more likely to have had a voluntary abortion, while the propensity decreases for educated women, working women, those who have a partner, and those who utilize contraception. Except, perhaps, for the variable Age, which in the demographic literature is known to exert a quadratic effect on abortion (with the abortion rates decreasing with age), all these results are reasonable, coherent, and in line with the literature on the subject. Also reasonable are the conclusions for the determinants of the immigrant status. The propensity to be irregular decreases with years of education, and working women or those with a partner are more likely to have regular immigration status. Highly educated women are presumed to have sufficient financial resources for their stay in Italy, have a job, or be studying, conditions that, according to Italian law, allow non-Italian citizens the right of residence in the country. Having a partner suggests a more stable family relationship, which is often found in legal immigrants. Moreover, women who are married to men legally residing in Italy have the right stay in the country, for a long-term, fixed-term, or indefinite stay, upon the issuance of an entry visa for family reunification. The length of the stay in Italy at the time of the interview has positive effect on the irregular status: Women who have been in Italy for a long time are more likely to have irregular status. Although this aspect may sound strange, it is not completely unexpected and is probably linked to the large presence in the surveyed population of the so-called overstayers, that is, foreigners who entered in Italy legally and remained in the country after their right to stay had expired. A large number of the women surveyed (37 percent) are from Eastern Europe, and all citizens of an EU27 Member State have the right to enter the country without any formal permit, other than valid travel documents (usually an identity card or passport) and, preferably, a health insurance policy that covers medical expenses in case of need, for up to three months. But, according to Italian law, after this period, non-Italian citizens are required to register at the municipality of residence and will receive a residence permit only if they have a job, are currently studying in the country, or have sufficient financial resources to cover their stay. Our explanation based on the overstayers seems to be confirmed by adding the variable Age in the covariate set for the irregular immigrant status (Y 2). For the new model (not presented here), the estimated coefficients for Age and Time are both positive, and this supports the idea that irregular presence is likely to be attributable mostly to overstaying.
Regarding the statistical performance of the RR survey, we observe that the association between the two sensitive behaviors is significant (
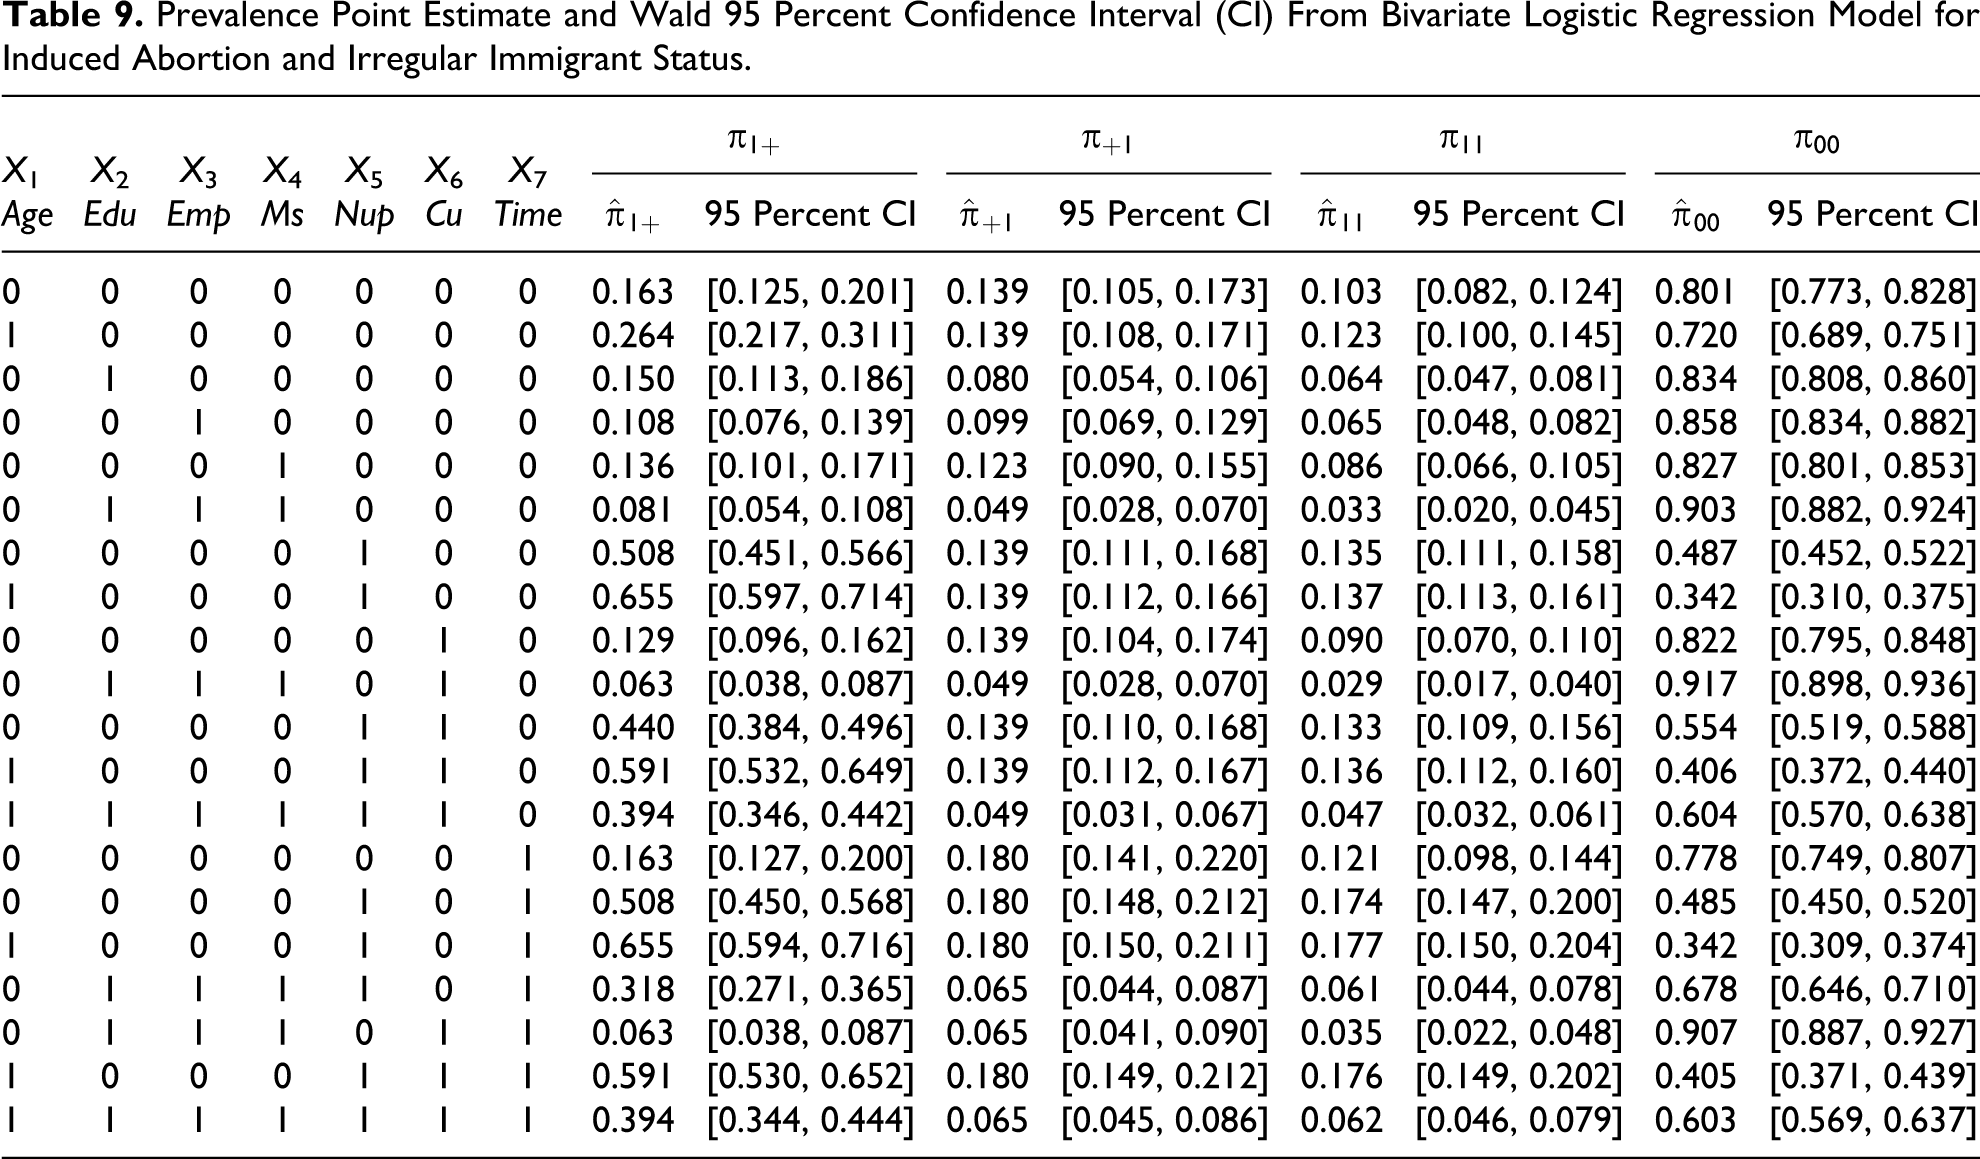
According to the estimated regression model in Table 8, we derived for all the subgroups of the population the point estimates and the Wald 95 percent confidence intervals for the prevalence of women who have had an abortion (
Prevalence Point Estimate and Wald 95 Percent Confidence Interval (CI) From Bivariate Logistic Regression Model for Induced Abortion and Irregular Immigrant Status.
Conclusion
This article aims at the evaluation of the simple and crossed models, two different RR procedures proposed by Lee et al. (2013) to simultaneously elicit more valid information than DQ on two sensitive characteristics, and to estimate their prevalence in the population. Indeed, substantive questions in the social and behavioral sciences go beyond determining the prevalence of deviant behaviors, stigmatizing traits, or incriminating attitudes and explore associations between several variables. In line with this, the prime concern of the article lies in the correlation and prediction involving one or more covariates.
Some methodological advances have been produced and supported by a simulation study and by two real surveys based on RR data. Specifically, we combined data from the RR simple and crossed models with other individual information to estimate the determinants of two sensitive behaviors. Since the RRT approach leads to data misclassification, adjusted methods for data analysis are required. Hence, to serve this purpose and utilize RR data, we adapted the multivariate logistic regression model, initially proposed by Gloneck and McCullagh (1995) and subsequently discussed in Van den Hout et al. (2007), to the case where sensitive response variables are intentionally misclassified for the purpose of protecting the privacy of survey participants. The ML estimation of the bivariate logistic regression models is introduced, and a simulation study is performed to assess the accuracy of the estimates. The simulation also sheds light on the performance of the two considered RR designs with the balance in favor of the crossed model. To complete the article, an application has been included which discusses how the crossed model has been implemented in two real surveys and presents some bivariate logistic regression analyses on the determinants of the sensitive behaviors investigated in the surveys. It is worth observing that the performed analyses do not claim to be exhaustive or to fully explain the phenomena by providing sociological motivations and implications; rather, they aim at drawing researchers’ attention to a number of open questions to be disentangled in future research.
In the first of the two surveys, concerning cannabis use and its legalization, both RR and DQ data are used to estimate the determinants of the two sensitive topics. Comparing prevalence estimates, it emerges that RR estimates are in general higher than DQ. A few exceptions have been found for certain subgroups of respondents depending on the sensitivity of the surveyed themes. Consequently, in keeping with the well-known “more-is-better assumption,” the RR survey is more likely to produce more valid results than DQ. Furthermore, regression analyses performed under the two survey modes give the opportunity to evaluate whether the inferential conclusions are the same across data types and whether there are differences in the effects of determinants according to the questioning mode. Differences are, therefore, emphasized and a study of sensitivity is conducted by looking at the sign and significance of the logistic regression coefficients. The output of the analysis shows that, under the two data collection methods, the sign of the coefficients is different as is their statistical significance. Specifically, RR estimates turn out to be nonsignificant, except for one covariate, and two possible explanations are provided: (1) low statistical power of the inferential procedure due to the modest size (n = 298) of the surveyed sample and (2) empirical evidence of the hypothesis according to which RR procedures eliminate, or at least reduce, the effect of respondent characteristics.
In the second real survey, only RR data are used to investigate the determinants of induced abortion and irregular immigration status, and therefore, comparative analyses cannot be produced between RR and DQ data as in the first study. However, also in this survey, the estimated regression coefficients are, with the exception of one covariate, nonsignificant, although the sample size is undoubtedly larger (n = 794) than in the first study.
To conclude, we shall summarize in a few points the salient aspects that characterize the article: (1) producing feasible methodological and empirical advances in the use of RR simple and crossed models; (2) confirming, with the exception of few and somewhat expected cases, that more valid and reliable estimates can be produced by using RR data rather than DQ data and (3) empirical evidence of the underlying idea behind RR surveys according to which there may be differences in the determinants that affect sensitive behaviors across questioning modes. Accordingly, at least for the considered surveys, the RR crossed model seems to significantly reduce the effect of the individual characteristics of the respondents on the sensitive response variables.
Supplemental Material
SupplementaryMaterial_SMR_20191215 - A Logistic Regression Extension for the Randomized Response Simple and Crossed Models: Theoretical Results and Empirical Evidence
SupplementaryMaterial_SMR_20191215 for A Logistic Regression Extension for the Randomized Response Simple and Crossed Models: Theoretical Results and Empirical Evidence by Shu-Hui Hsieh and Pier Francesco Perri in Sociological Methods & Research
Footnotes
Acknowledgment
The authors are grateful to an associate editor and two referees for their helpful comments that improved the presentation.
Declaration of Conflicting Interests
The author(s) declared no potential conflicts of interest with respect to the research, authorship, and/or publication of this article.
Funding
The author(s) disclosed receipt of the following financial support for the research, authorship, and/or publication of this article: The research of S. H. Hsieh was supported by the Ministry of Science and Technology (MOST) of Taiwan, ROC (105-2118-M-001-009). The research of P.F. Perri was supported by the Ministerio de Economía y Competitividad (Spain), grant ID MTM2015-63609-R.

Supplemental Material
Supplemental material for this article is available online.
References
Supplementary Material
Please find the following supplemental material available below.
For Open Access articles published under a Creative Commons License, all supplemental material carries the same license as the article it is associated with.
For non-Open Access articles published, all supplemental material carries a non-exclusive license, and permission requests for re-use of supplemental material or any part of supplemental material shall be sent directly to the copyright owner as specified in the copyright notice associated with the article.
