
Abstract
Surveys of income are complicated by the sensitive nature of the topic. The problem researchers face is how to encourage participants to respond and to provide truthful responses in surveys. To correct biases induced by nonresponse or underreporting, we propose a two-stage multilevel randomized response (MRR) technique to investigate the true level of income and to protect personal privacy. For a wide range of applications, we present a proportional odds model for two-stage MRR data and apply inverse probability weighting and multiple imputation methods to deal with covariates on some subjects that are missing at random. A simulation study is conducted to investigate the effects of missing covariates and to evaluate the performance of the proposed methods. The practicality of the proposed methods is illustrated with the regular monthly income data collected in the Taiwan Social Change Survey. Furthermore, we provide an estimate of personal regular monthly mean income.
Keywords
Surveys of income are complicated by the sensitive nature of the topic. Some researchers have even ranked income as one of the hardest-to-ask questions (see, e.g., Lillard, Smith, and Welch 1986; Riphahn and Serfling 2002; Yu and Li 2011; Zweimüller 1992). In general, a sensitive question is perceived to be one related to an illegally and/or socially undesirable behavior or private information or information considered either private or shameful within a given culture, and so on. Individuals may be reluctant to admit directly having earnings or other money income, which can induce them either to lie about their income behavior (response bias) or to refuse to take part in the study (nonresponse bias) because they wish to avoid answering sensitive questions. Response and nonresponse bias in a survey affects the validity of results and makes a reliable estimate of income difficult to obtain. The problem researchers face is how to encourage participants to respond and how to elicit truthful responses in surveys. Hence, we consider a two-stage multilevel randomized response (MRR) technique to investigate the true level of income as well as to protect personal privacy.
The randomized response (RR) technique was proposed by Warner (1965) as an interview technique to elicit sensitive information while protecting respondents’ privacy and, hence, to reduce response and nonresponse bias. Using this RR technique, the respondents are divided into two mutually exclusive groups by means of a randomization device, such as a spinner, dice, playing cards, random numbers, or a computer, to enable the respondents to answer the sensitive questions without revealing their true status about the stigmatized or private attribute to the interviewer. Since then, different developments and variants of the RR technique of Warner (1965) have been proposed by different authors (see, e.g., Christofides 2003; Franklin 1989; Greenberg et al. 1969; Hsieh, Lee, and Tu 2018; Mangat 1994; Moors 1971; Lensvelt-Mulders et al. 2005). Among them, Lensvelt-Mulders et al. (2005) discussed two meta-analyses on 32 comparative RR technique studies in which the RR technique may yield a more reliable estimate compared with self-administered questionnaires or face-to-face interviews, especially when dealing with highly sensitive topics. The RR technique has been used successfully in several sensitive research areas such as homosexual behaviors and AIDS, drug abuse history, abortion experience, income and tax evasion, and so on (see, e.g., Esponda, Huerta, and Guerrero 2016; Houston and Tran 2001; Tian et al. 2009).
Despite the wide applicability of the RR technique and several methodological advances, we find surprisingly few applications. Indeed, our extensive search yields only a handful of published studies that use the RR method to answer a multiple-choice question by using an appropriate regression model. In a logistic regression model for RR data, Scheers and Dayton (1988) showed the relationship between sensitive questions and explanatory variables for a related question design (Warner 1965) and an unrelated question design (Greenberg et al. 1969). Corstange (2009) proposed a method to estimate the parameters of a hidden logistic regression model. Lensvelt-Mulders et al. (2006) extended the logistic regression procedure to incorporate personal characteristics of respondents so as to make it possible to weight a sample toward population characteristics. Ronning (2005) discussed a probit model for RR data. In a multivariable logistic regression model for RR data, Van den Hout, Van der Heijden, and Gilchrist (2007) elaborated the multivariable logistic regression model as presented by Glonek and McCullagh (1995) for two RR variables. Cruyff, Van den Hout, and Van der Heijden (2008) discussed the analysis of a summary of multivariate data. Böckenholt and Van den Heijden (2007) used a multivariate approach to estimate self-protective responses by using an item-randomized-response model. However, survey data as entered are often not measured perfectly. Hsieh, Lee, and Shen (2010) discussed a logistic regression model for RR data with missing covariates. Missing a covariate of paramount importance will hence require a more advanced method to avoid bias and imprecision in parameter estimates than if the missing covariate is of less significance.
As far as we know, there has been very little research regarding the analysis of RR data with missing covariates. In this work, we propose a proportional odds model (POM) for a two-stage MRR variable and fit the model to income data to study its relationship with a set of missing covariates. In the MRR technique proposed by Hsieh et al. (2018), the outcome variable is the absolute difference between two integers, one corresponding to her or his sensitive true states (e.g., income) on an ordinal scale and the other produced by a random number generator provided by the interviewer. The two-stage MRR technique is proposed by using both the direct question (DQ) and MRR technique where an MRR is applied in the second stage. The POM, which is used to fit the two-stage MRR data, reveals the relationship between the covariates and the probability of sensitive true states for ordinal categories. It is important to include covariates that can explain some of the observed between-subject variability for RR data in the regression models. One active research area in practical problems has been the study of regression models with missing covariates. Although the naive complete-case (CC) method can yield consistent estimates if covariates are missing completely at random (MCAR), which means that the missingness mechanism is independent of both observed data and missing data (Rubin 1976), this approach yields inconsistent estimates when the missingness mechanism depends on the observed data, which may be missing at random (MAR; Little 1992). 1 Little’s study focused almost exclusively on multivariate normal models, whereas Horton and Laird (1999) focused exclusively on the maximum likelihood (ML) methods for generalized linear models (GLMs) with MAR categorical covariates. Ibrahim et al. (2005) provided a detailed overview and comparisons for various paradigms for inference in GLMs with categorical or continuous as well as MAR or nonignorable missing covariates. Note that nonignorable missingness means the missing data depend on a missing data mechanism such as data not MAR. Under the MAR assumption, Lee, Gee, and Hsieh (2011) proposed semiparametric methods to estimate the parameters of a POM for ordinal response data with missing covariates. These approaches include the conditional estimation method, joint conditional method, and weighted method.
We develop alternative estimation procedures to accommodate MAR missing covariate data in the POM for a dependent variable subject to the two-stage MRR technique. Specifically, we apply the inverse probability weighting (IPW) and nonparametric multiple imputation (MI) methods to carry out the estimation of the covariate effects in the presence of missing covariate data. Lee, Hwang, and de Dieu Tapsoba (2016) used these methods to estimate the population size under a capture–recapture model with missing covariate data. We also prove the asymptotical equivalence of estimators based on the IPW and nonparametric MI methods under the POM for a dependent variable subject to the two-stage MRR technique with covariate data MAR.
The second section describes the motivating example and presents the POM for a dependent variable subject to the two-stage MRR technique and the ML framework. The third section summarizes the effects of missing covariate data when using a naive CC analysis method and development of alternative estimation approaches that are based on the IPW and two types of nonparametric MI. The fourth section provides an extensive simulation study, which is conducted to evaluate the finite-sample performance of the proposed estimators. The fifth section illustrates the practical use of the proposed approaches by using the regular monthly income data from the Taiwan Social Change Survey (TSCS). Some conclusions are given in the sixth section. Technical details are given in Supplementary Material (which can be found at http://smr.sagepub.com/supplemental/).
The POM Framework
Motivating Example
Income is a sensitive topic for most people. In the traditional DQ methods, respondents with either a higher income or a lower income are more likely to say “don’t know” or to refuse to reply when encountering the income question, and hence, it lowers the response accuracy. There has been very little work done using the RR technique in surveys that include questions about income. 2 One study directly addressed this issue by the forced response design (Boruch 1971), which was conducted in a nationwide survey to assess the level of noncompliance with social security regulations by the Dutch Department of Social Affairs in 2004 (Cruyff, Böckenholt et al. 2008). In 2012, the MRR technique was investigated and applied in the TSCS, which was administered in face-to-face interviews by the Center for Survey Research at Academia Sinica. Survey responses were representative of the general population of Taiwanese aged 18 years old or older.
The survey included questions on income level, and the results obtained by using both the DQ and MRR techniques were combined. Motivated in part by a preliminary investigation of the two-stage MRR design, the TSCS had two questions as follows in order to ask for information about income:
Q
1: Is your regular monthly income (including your salary, compensation, and bonus) from your job NT$30,000 or more?
Respondents were instructed to say “Yes” or “No.” Under the assumption of truthful response by all participants, if their answer to the first question Q
1 was “Yes,” they needed to answer the second question Q
2. The second question Q
2 was designed according to the MRR design as follows:
Q
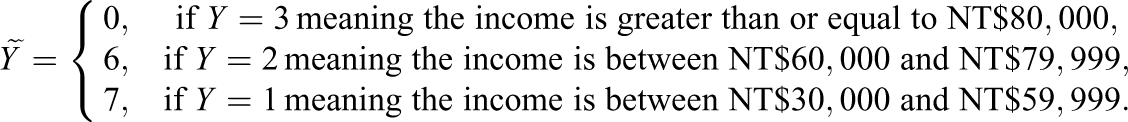
2: Which one of the following numbers best indicates your regular monthly income? Number 7: income between NT$30,000 and NT$59,999, Number 6: income between NT$60,000 and NT$79,999, Number 0: income greater than or equal to NT$80,000.
The respondent was instructed to keep that number in mind and randomly pick up a card from a well-shuffled deck of
To the best of our knowledge, there have been no studies regarding the analysis of data from the two-stage MRR design in regression models. For a wide range of applications, we develop the ML framework to estimate the parameters of the POM for a two-stage MRR variable of the income on an ordinal scale.
Model Setting
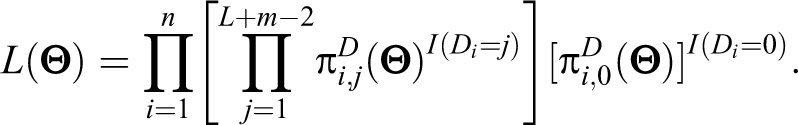
Assume that the ordinal outcome variable, Y, takes on

where

Here,
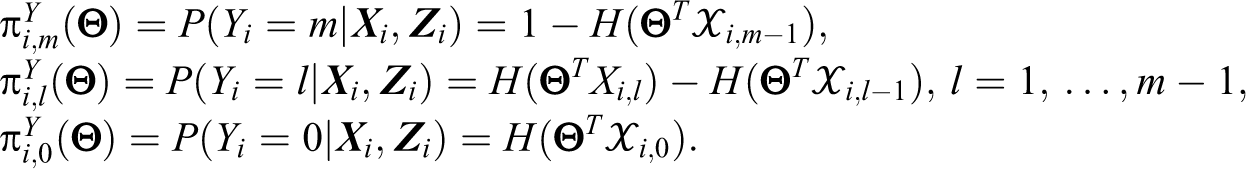
We define the vector by
We can then have
In this study, it was observed that each respondent answered the first dichotomous question Q
1, and Yi
can only be obtained when Yi
is equal to 0 based on the answer of “No”. For
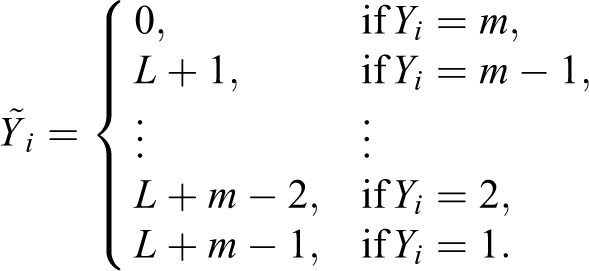
The primary assumption made here is because
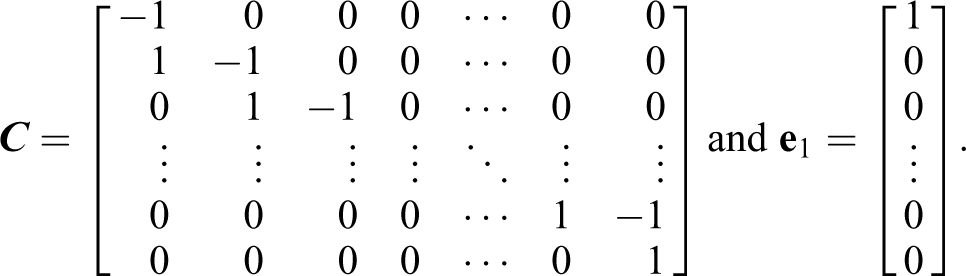
Following Hsieh et al. (2018), for

We then define the parameter vector by

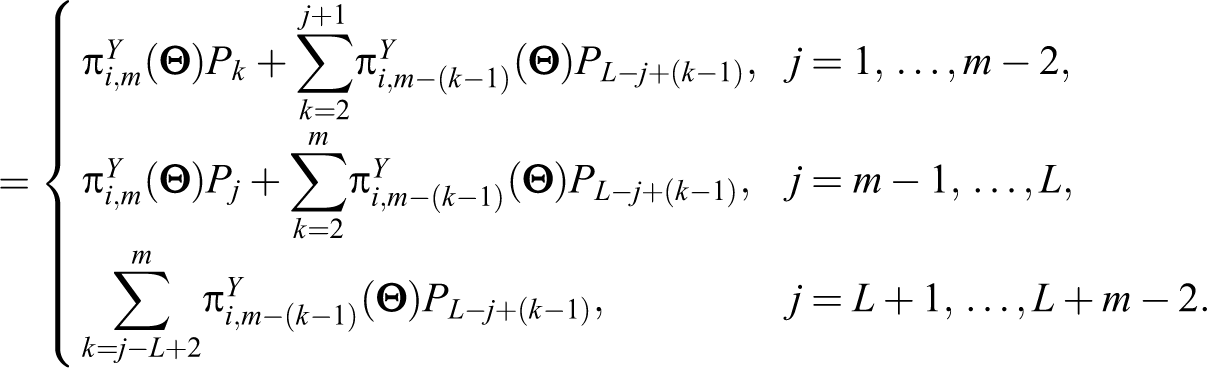
Under the two-stage MRR design,

where
Estimation
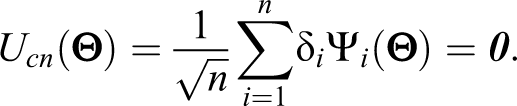
To derive some properties of the ML estimator of
Let

where

The ML estimator of
Methods for Handling Missing Covariates in POM
Developing methods for regression analysis with missing covariates has been an active research area in the past decades (for a review, see Little 1992; Little and Rubin 2002). A closely related problem arises when the covariate X is missing and a surrogate variable for X is available. For this problem, several estimation methods have been proposed (see, e.g., Breslow and Cain 1988; Hsieh, Lee, and Shen 2009; Lee et al. 2011; Wang et al. 1997, 2002). Lee et al. (2011) proposed semiparametric methods to estimate the parameters of a POM for ordinal response data with missing covariates. These approaches include the conditional estimation method, joint conditional method, and weighted method.
We consider the problem of estimating the parameters of the POM for the two-stage MRR data with missing covariates. To simplify the presentation, we assume that Xi
is a univariable, but the structure can be easily extended to a multivariable case. Suppose Xi
is a covariate that may be MAR. Let
We can only observe
Due to deleting the incomplete data, the CC analysis method has two potential disadvantages: (a) loss of efficiency and (b) the potential to yield inconsistent estimates when the validation data set is not a random subsample of the original cases. Note that the estimator
Next, we propose an IPW method and nonparametric MI method to deal with missing covariate data under the two-stage MRR design.
IPW Method
When the missingness mechanism is MAR, Flanders and Greenland (1991) and Zhao and Lipsitz (1992) suggested a weighted method, which uses the inverse of the probability that data are observed as the weight of each respondent. To simplify the notation, we define
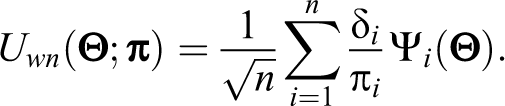
In practice, the selection probabilities
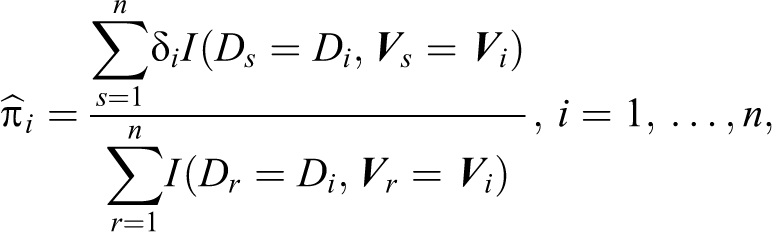
where
where
MI Method
The MI method was proposed by Rubin (1987) and Rubin and Schenker (1986). This method involves repeatedly generating random values of the missing data X from the conditional distribution
When the covariate Xi
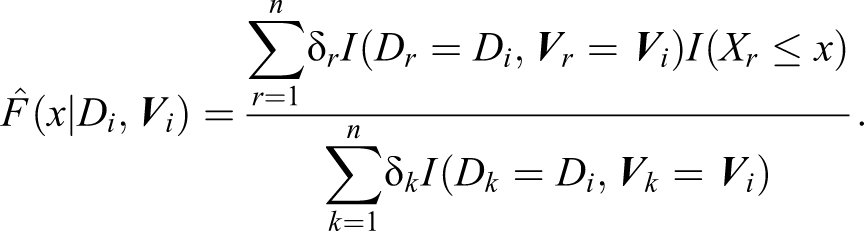
is missing, we impute its value by generating random observations from the empirical conditional distribution
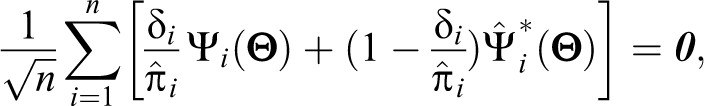
After M imputations, we use the average of these estimators
Next, we consider the second-type MI (MI2) estimator of
Overall, when
Simulation Study
A simulation study was carried out to evaluate the finite-sample performance of the full data, CC, IPW, MI1, and MI2 methods. Note that the
Simulation Results for Various Values of Selection Probability.
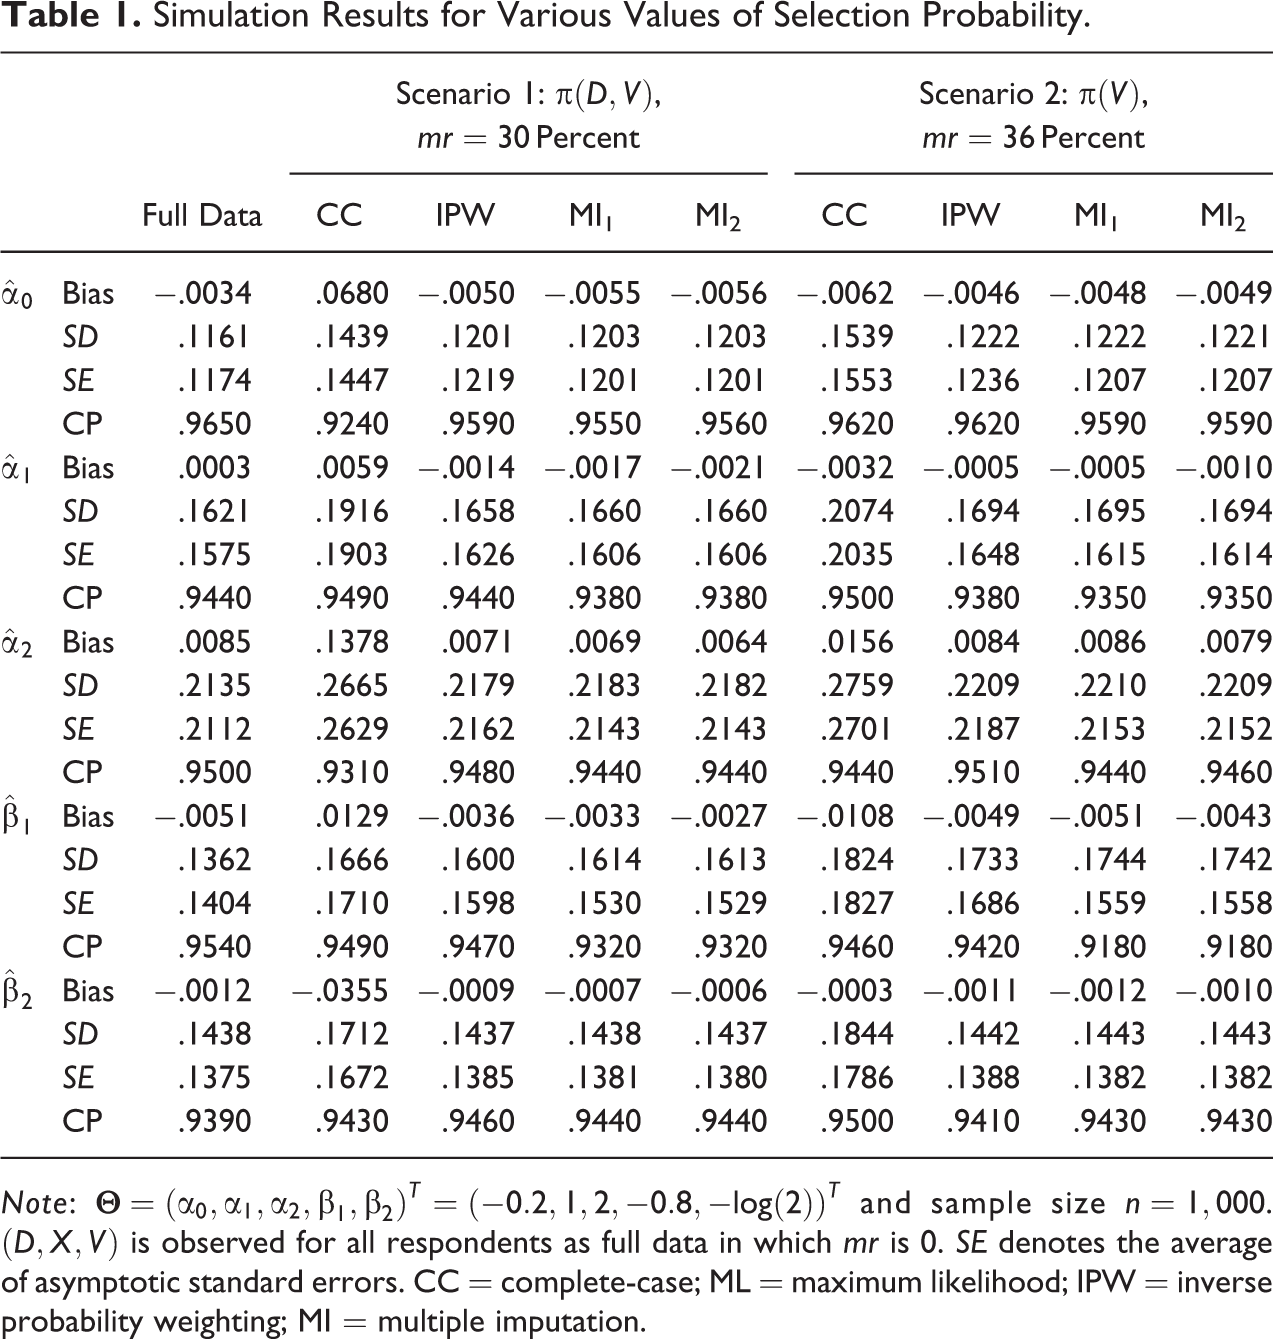
Note:
The case of bivariate covariates X and Z was considered. The binary covariates X and Z were generated independently with
The outcome variable D was then the absolute difference between
The simulation results given in Table 1 show that the efficiencies of all estimators were increased as the sample size was increased. In scenario 1, the selection probability depended on
In scenario 2, the selection probability did not depend on D, and
Empirical Analysis
The proposed methods are applied to the regular monthly income data from the TSCS, which was administered in face-to-face interviews by the Center for Survey Research at Academia Sinica in 2012. The TSCS, which is the first nationally representative survey in Taiwan, was established in 1985. Since 1990, the annual TSCS, which consists of two independent survey modules, has been conducted continuously. This long-lasting series of surveys aims to track the long-term trends of social change and provide nationally representative survey data that cover political, economic, social, and other aspects of Taiwan. To facilitate time series comparisons, the TSCS devoted one of the two annual survey modules to repeat major research topics every five years. For this example, we use the 2012 TSCS (round 6, year 3), which consists of two modules: Social Stratification and Gender. This study had 4,206 respondents in both modules, but only 2,470 (
Respondents were asked what their average regular monthly income from their job was when using the two-stage MRR technique. The 2012 TSCS had the following two questions, Q
1 and Q
2, in order to ask for information about the average regular monthly income:
Q1
: Is your regular monthly income (including your salary, compensation, and bonus) from your job NT$30,000 or more?
Q2
: Which one of the following numbers best indicates your regular monthly income? Number 7: income between NT$30,000 and NT$59,999, Number 6: income between NT$60,000 and NT$79,999, Number 0: income greater than or equal to NT$80,000.
All the respondents were required to answer the first question Q
1. When the
From
In addition, these three explanatory variables, years of working, gender, and education were included in the POM. Assume X is the answer to the question QX
: “For how many years in total have you been working, starting from your first job to the current (last) job?” which is defined as 1 if working experience is greater than or equal to 14.5 years and 0 otherwise. However, the first module of the 2012 TSCS did not contain the question QX
, so 1,256 participants did not answer this question QX
because of the questionnaire design. In the second module, 24 participants refused to answer this question QX
. There were

Estimation of Regression Parameters
The analysis results are given in Table 2. We used estimates of the selection probability that is a function of D and
Analysis Results of Average Regular Monthly Income Data by Using POM.
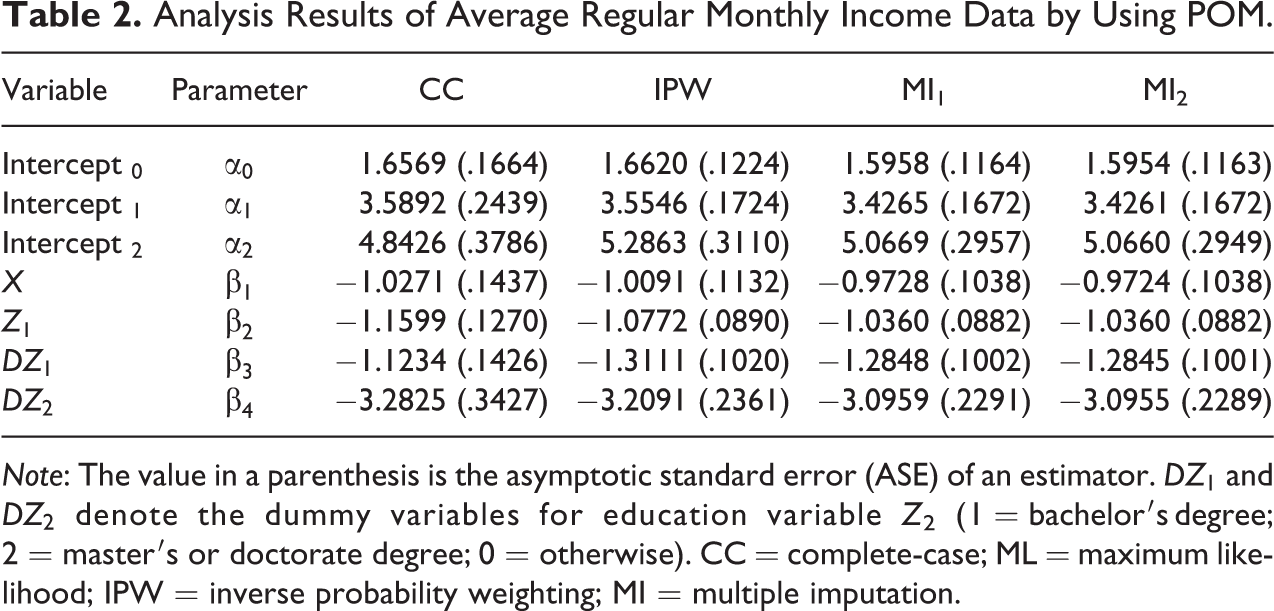
Note: The value in a parenthesis is the asymptotic standard error (ASE) of an estimator.
As shown in Figure 1, based on the MI2 method, we generate plots of the fitted POM for the effects of years of working by gender and education. It can be easily seen that the predicted probability of the lowest income is the highest for a female respondent with non-university education and working experience less than 14.5 years. On the other hand, a male respondent who had a master’s or doctorate degree had significantly different income than a male respondent with non-university education. The income gap between the male respondents and female respondents was also apparent. Overall, for each educational level, the female respondents had a lower average regular monthly income compared with the male respondents.
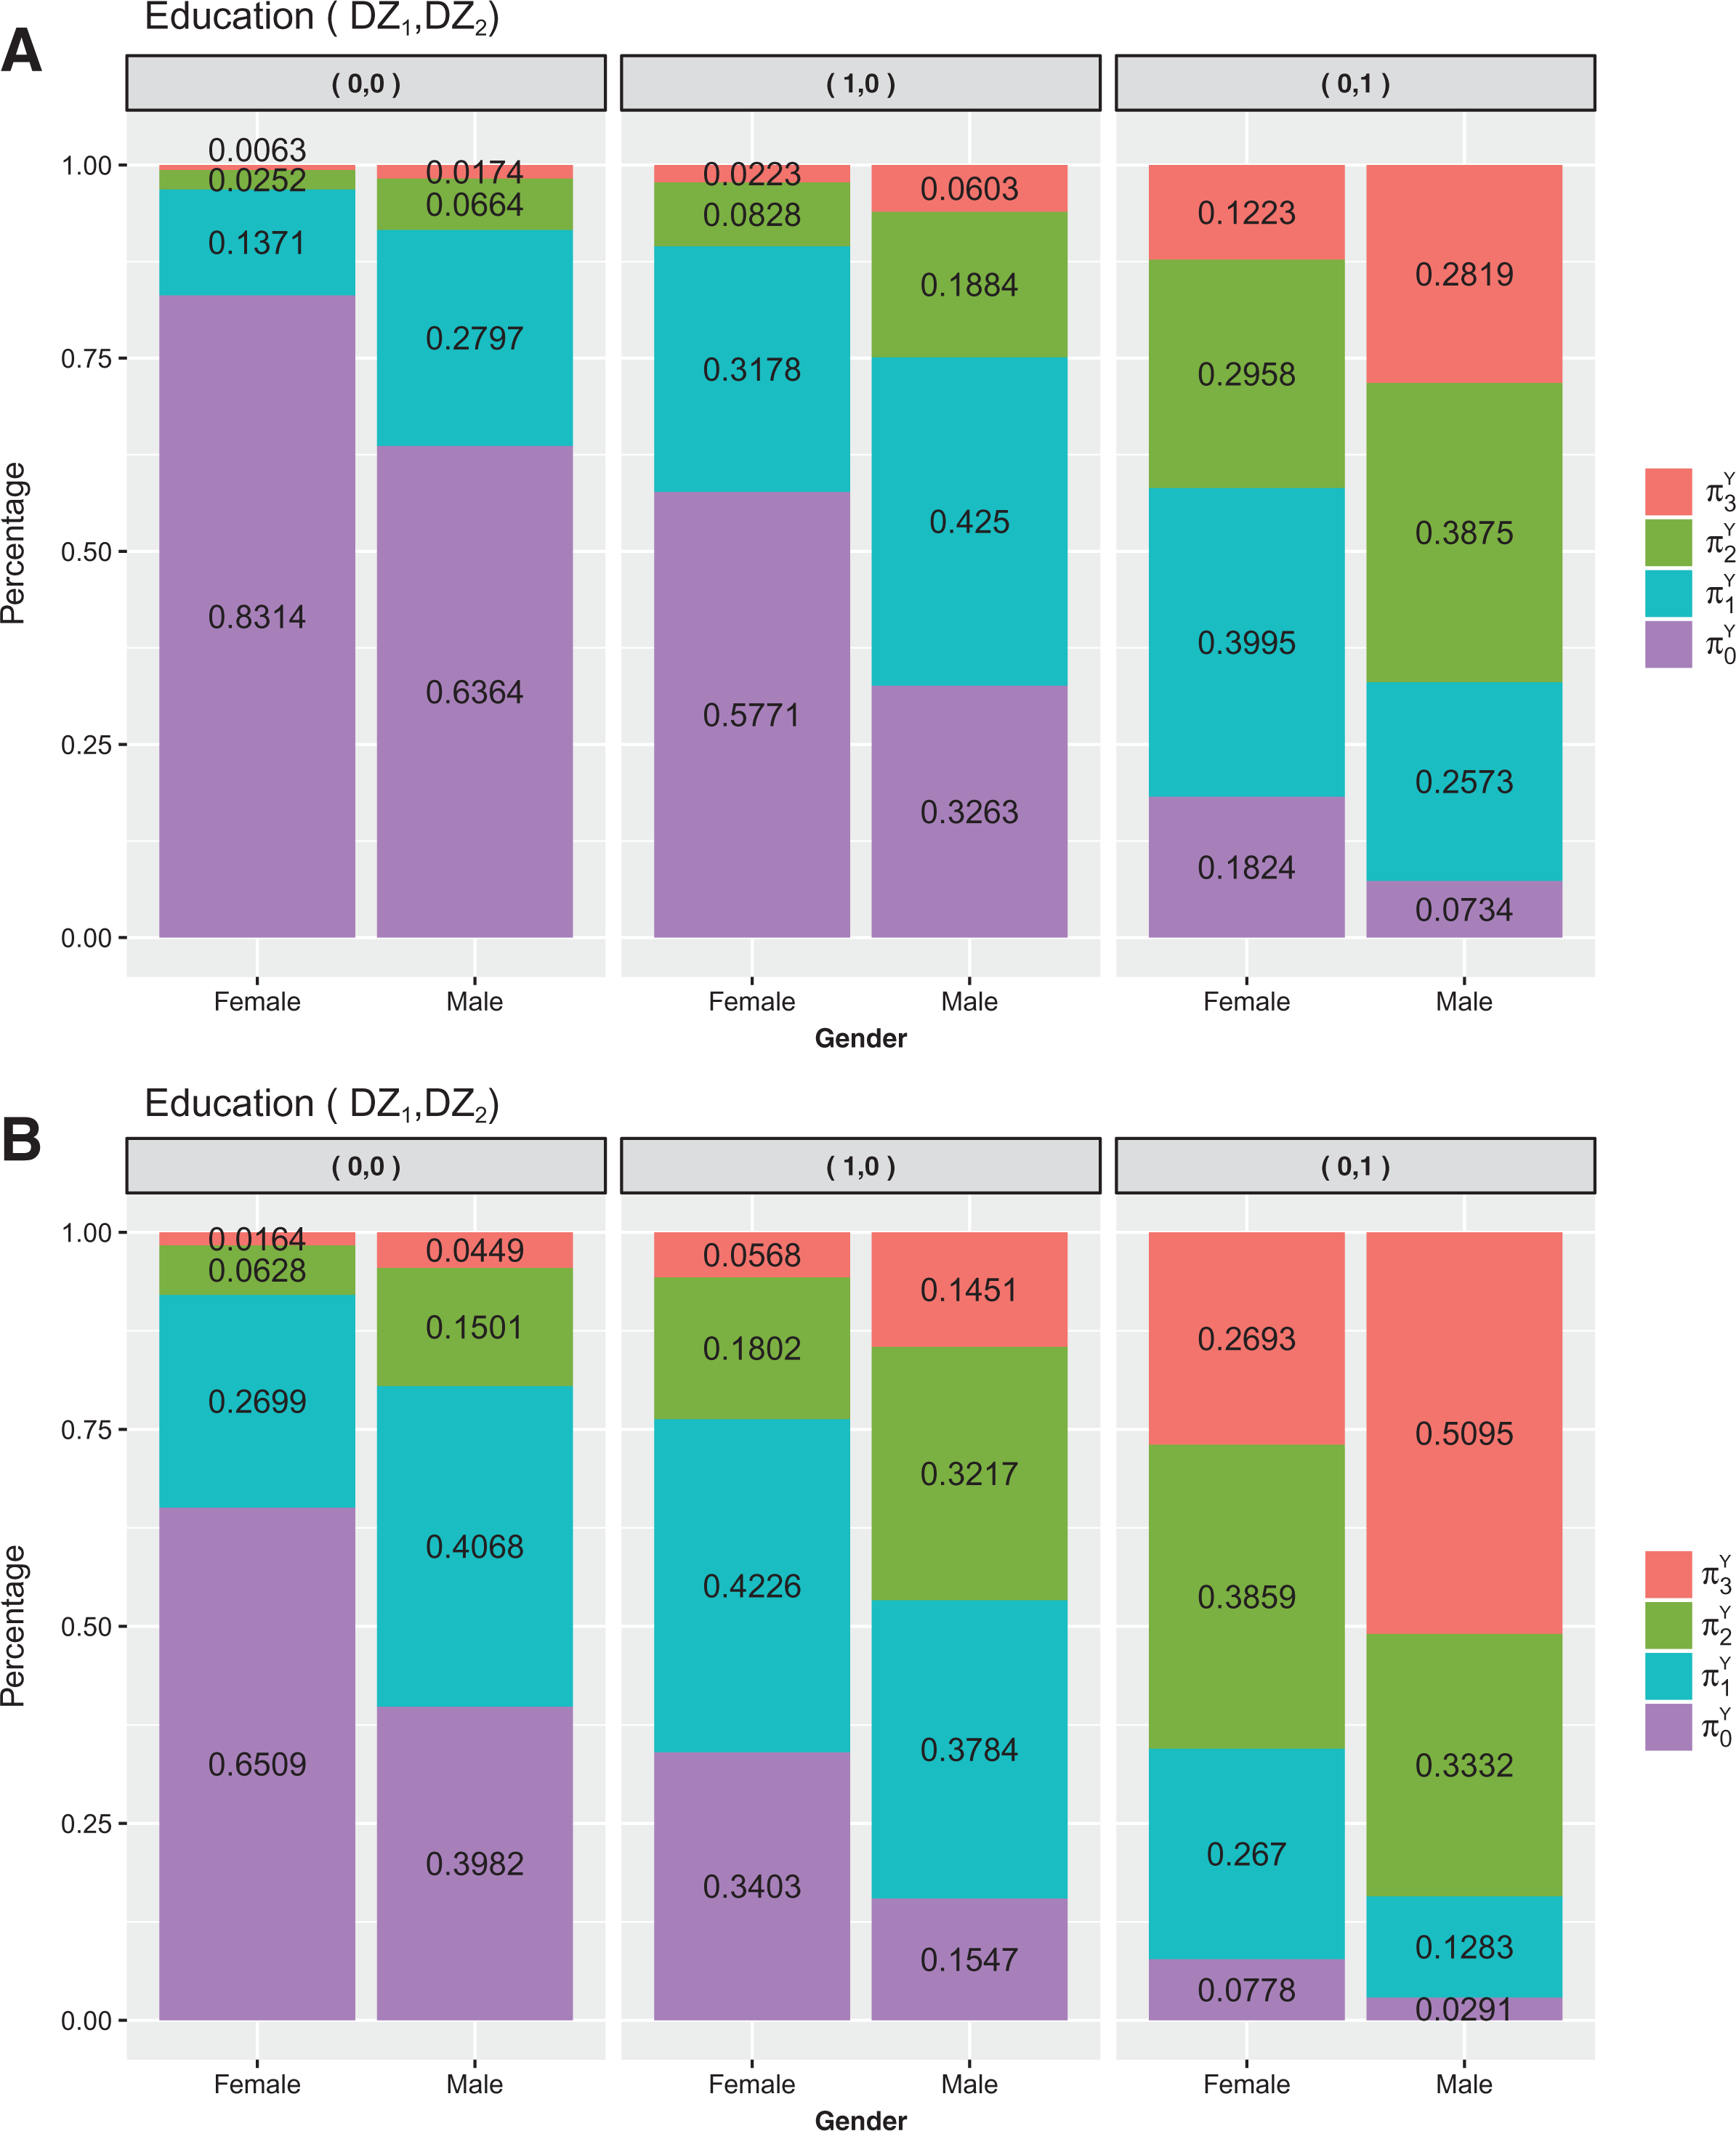
Predicted probabilities for income. (A) Working experience less than 14.5 years. (B) Working experience greater than or equal to 14.5 years.
Estimation of Personal Mean Income
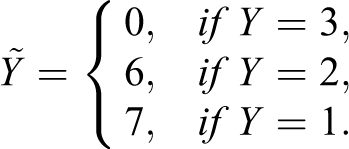
We conceptualize income as a measure of the per capita income. To this end, we produced income data according to
For all analyses we let the midpoints of the first m income category (coded as
The delta method is used to approximate the variance of

where
We use
Results of Personal Mean Regular Monthly Income.
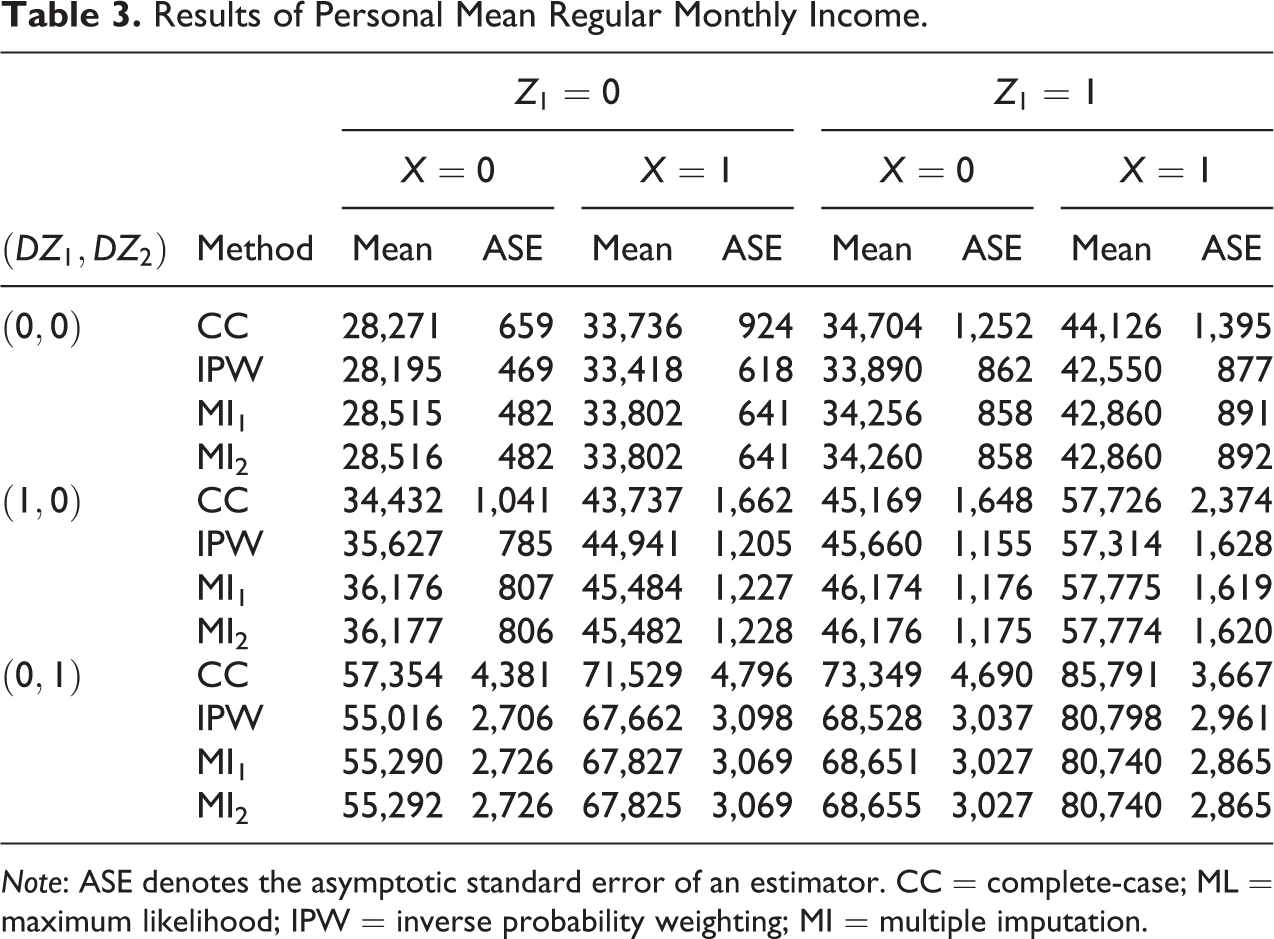
Note: ASE denotes the asymptotic standard error of an estimator. CC = complete-case; ML = maximum likelihood; IPW = inverse probability weighting; MI = multiple imputation.
Conclusion
Income is a sensitive topic for most people, and some researchers have even ranked income as one of the hardest-to-ask questions. The literature documents a large variety of imputation methods for missing values in income (e.g., Aßmann et al. 2017; Frick and Grabka 2005). Nonetheless, it is possible to develop and apply statistical modeling approaches that provide more accurate measures of income. Motivated by this awareness, we provide a two-stage MRR technique to investigate the true level of income as well as to protect the privacy of income information. To the best of our knowledge, it is the first time that the two-stage MRR design is applied in a large-scale survey. The goal is to contribute our work to the applied statistics literature and to propose a regression model that can be used for a wide range of applications. We do this through a POM for a two-stage MRR variable and fit the model to the income data to study its relationship with a set of covariates. Regression models with missing data have been actively studied in practical applications for decades. It has been shown that a naive CC analysis method yields inaccurate results for estimating regression coefficients in general. As shown in our simulation study, the large bias due to missing data cannot be ignored.
We have presented three estimation approaches, IPW and two types of nonparametric MI, to account for two-stage MRR with covariate data MAR. The two MI estimation approaches are easy to implement and give consistent results, but they are more computationally intensive compared with the IPW method because they involve repeatedly imputing the missing data. The two MI estimation methods have been shown to be asymptotically equivalent, but we recommend using the second MI estimation method to lessen the computational burden because it is an easy-to-use procedure. The IPW approach is asymptotically equivalent to the two MI estimation approaches and can be calculated very quickly. An important feature of the IPW approach is that it is unnecessary to make an additional assumption for the nuisance components such as the selection probability. However, if the missing rate is high, we cannot obtain enough information about questions of interest, which can result in divergence when estimating the model parameters. The other problem of the IPW method is that very small estimated selection probabilities give very large weights. To deal with this issue, it is customary to collapse classes by certain criteria (e.g., Eltinge and Yansanch 1997; Haziza and Beaumont 2007; Little 1986; Thomsen 1973).
Although the information of
Supplemental Material
SupplementaryMaterial_SMR_041719 - A Two-stage Multilevel Randomized Response Technique With Proportional Odds Models and Missing Covariates
SupplementaryMaterial_SMR_041719 for A Two-stage Multilevel Randomized Response Technique With Proportional Odds Models and Missing Covariates by Shu-Hui Hsieh, Shen-Ming Lee and Chin-Shang Li in Sociological Methods & Research
Supplemental Material
SupplementaryMaterial_SMR_20180621 - A Two-stage Multilevel Randomized Response Technique With Proportional Odds Models and Missing Covariates
SupplementaryMaterial_SMR_20180621 for A Two-stage Multilevel Randomized Response Technique With Proportional Odds Models and Missing Covariates by Shu-Hui Hsieh, Shen-Ming Lee and Chin-Shang Li in Sociological Methods & Research
Footnotes
Acknowledgments
The authors are grateful to an associate editor and two referees for their helpful comments that improved the presentation.
Declaration of Conflicting Interests
The author(s) declared no potential conflicts of interest with respect to the research, authorship, and/or publication of this article.
Funding
The author(s) disclosed receipt of the following financial support for the research, authorship, and/or publication of this article: The research of S.H. Hsieh and S.M. Lee was supported by the Ministry of Science and Technology (MOST) of Taiwan (106-2118-M-001-005 and 107-2118-M-035-004-MY2).
Supplemental Material
Supplemental material for this article is available online.
Notes
References
Supplementary Material
Please find the following supplemental material available below.
For Open Access articles published under a Creative Commons License, all supplemental material carries the same license as the article it is associated with.
For non-Open Access articles published, all supplemental material carries a non-exclusive license, and permission requests for re-use of supplemental material or any part of supplemental material shall be sent directly to the copyright owner as specified in the copyright notice associated with the article.