




Abstract
Survey interviewers can negatively affect survey data by introducing variance and bias into estimates. When investigating these interviewer effects, research typically focuses on interviewer sociodemographics with only a few studies examining the effects of characteristics that are not directly visible such as interviewer attitudes, opinions, and personality. For the study at hand, self-reports of 1,212 respondents and 116 interviewers, as well as their interpersonal perceptions of each other, were collected in a large-scale, face-to-face survey of households in Germany. Respondents and interviewers were presented with the same questions regarding their opinions and mutual perceptions toward social and political issues in Germany. Analyses show that interviewer effects can be largely explained by how an interviewer is seen by respondents. This indicates that some respondents adjust their answers toward anticipated interviewer opinions. Survey practitioners ought to acknowledge this in their survey design and training of interviewers.
Interviewers play a major role in social science data collection. In fact, the majority of social science surveys still rely on telephone or face-to-face interviewers to collect data (see Arbeitskreis Deutscher Markt- und Sozialforschungsinstitute e.V. [ADM] 2018, for Germany). Interviewers can positively contribute to survey data quality by performing a variety of tasks such as gaining cooperation, motivating respondents to provide complete and accurate answers, helping to clarify questions, and handling complex data collection instruments and questionnaires (Loosveldt 2008). Thus, in personal interviews, the interviewer plays a key role in the data collection process. This is why many social scientists still prefer to rely on interviewers, despite their high costs when compared to other modes of data collection such as web surveys (Groves 2004).
However, it is well known that interviewers can also negatively influence respondents’ answering behavior through their presence, interviewing behavior, and interaction during personal interviews. In this regard, extant research shows that responses collected by the same interviewer tend to be more homogeneous than responses collected by different interviewers. Usually termed “interviewer effects,” the interviewers’ influence on responses generally threatens the reliability and validity of the survey data collected.
Although the presence of interviewer effects is long-standing knowledge in survey research (see Schaeffer, Dykema, and Maynard 2010; West and Blom 2017, for an overview), rather little is known about the exact mechanisms underlying the occurrence of these effects. Thus far, research on interviewer effects largely focuses on the effects of interviewer sociodemographics (e.g., gender) on answers to related questions (e.g., gender equality). This is—at least in part—because typically little information about the interviewers is recorded and available to researchers. Nonetheless, past research also shows that interviewer effects are present across all types of questions (both factual and nonfactual; Groves and Magilavy 1986; Schnell and Kreuter 2005). This is true even in cases where there is no obvious relationship between the topic of the survey question and a visible (sociodemographic) characteristic of an interviewer, for instance, in questions on political or religious beliefs (Lipps and Lutz 2010).
This article examines interviewer-related measurement error in questions about topics not directly relatable to visible interviewer characteristics. To do so, a unique database was created. The data combine respondents’ and interviewers’ opinions about selected topics. Moreover, for the first time, interpersonal perceptions of respondents and interviewers were collected and added as well. The database thus contains both self-reports as well as interpersonal perceptions of respondents and interviewers, offering new research opportunities for explaining the occurrence of interviewer-related measurement error in face-to-face surveys.
The article at hand is structured as follows. The upcoming section summarizes the state of research and motivation for this project. The theoretical background and hypotheses are presented afterward followed by the discussion of data, variables, and methods. The subsequent section presents the results, covering both the nature of self-reports and perceptions as well as their influence on the occurrence of interviewer-related error. Finally, the conclusion summarizes the article, provides practical implications for survey fieldwork, and discusses starting points for further research.
Motivation and Objectives
A vast literature has arisen on interviewer effects (see West and Blom 2017), showing that interviewers can introduce error at all stages of the survey process. This includes the selection of sample elements (sampling error), the ability to motivate respondents to participate or not (nonresponse error), obtaining responses (measurement error), and storing/processing responses (processing error). Similar to the majority of existing studies, the focus of this research is on interviewer-related measurement error. When seeking to explain its occurrence, scholars usually refer to three main mechanisms.
First, it is known that interviewers vary in their interviewing skills as well as to the extent they deviate from a standardized interviewing behavior (see Schaeffer 2018, for an overview on the topic). In this regard, interviewer effects are conceptualized as the result of systematic (correlated) deviations of interviewers from standardized interviewing behavior. For instance, some interviewers may probe some questions heavily, while others do not, which results in more homogeneous responses within than across interviewers. This introduces variance and potentially bias into survey estimates.
Second, it is known that the presence, appearance, and characteristics of interviewers can affect respondents’ answering behavior (Cannell 1977). Respondents may make inferences about interviewers based on visible characteristics and “use these inferences, in conjunction with general cultural stereotypes, to tailor (or edit) their answers to elicit interviewer approval” (Fendrich et al. 1999:1014). Such “socially desirable answering” (see Krumpal 2013; Kühne 2018) is a classic form of an interviewer effect: Some respondents tend to adjust their answers toward social norms or anticipated interviewer characteristics to give positive self-descriptions and to seek approval from the interviewer (“impression management”). The majority of studies in this strain of the literature focuses on the question of whether visible interviewer characteristics affect responses to thematically related questions. In this regard, many study the effects of interviewers’ race/ethnicity (e.g., Athey et al. 1960; Schuman and Converse 1971; Weeks and Moore 1981; Williams 1964, 1968) and gender (e.g., Catania and Binson 1996; Kane and Macaulay 1993; Webster 1996) on responses to thematically related questions and surveys.
In contrast, few studies focus on the effects of “not visible” interviewer characteristics such as attitudes, opinions, or traits on responses to related questions. 1 In part, this is because information about interviewers beyond sociodemographics is simply not available in many studies. Katz (1942:267), using face-to-face interview data, reveals that, for instance, middle-class and white-collar interviewers obtain a greater incidence of conservative attitudes compared to working-class interviewers. Nybo Andersen and Olson (2002) find negligible interviewer effects when investigating the effects of computer-assisted telephone interviewing (CATI) interviewers’ health beliefs and personal habits on response data on smoking and alcohol consumption in a study of pregnant women. And Healy and Malhotra (2014) find no evidence of an effect of interviewers’ partisan leanings on responses to related questions in CATI interviews. In contrast, based on a CATI panel, Lipps and Lutz (2010) show that responses to four political questions are associated with the respective interviewers’ opinions on the topics. Moreover, based on face-to-face interview data, Himelein (2016) finds that interviewers’ opinions about political/social issues such as corruption and women’s rights strongly affect the responses of interviewees to questions on these topics. Finally, Hilgert, Kroh, and Richter (2016) analyze whether the interviewers’ personality traits (Big Five Inventory) affect respondent answers to the same Big Five Inventory items, revealing positive effects of the interviewers’ scores on openness, conscientiousness, and agreeableness on the respective respondents’ scores.
Third and finally, so-called priming effects (Tulving and Schacter 1990)—the preactivation due to a stimulus that itself affects the processing of further stimuli—may explain the interviewers’ influence on responses that are formed rather spontaneously, as for instance, attitudinal questions. In this regard, interviewer characteristics or their behavior may activate certain memory systems and thereby influence respondent answers (as hypothesized by Schuman and Converse [1971] in their investigation of race-of-interviewer effects).
While scholars repeatedly refer to these social/psychological mechanisms to explain their observed effects, they are usually not able to truly test them. This is largely due to a (general) lack of experimental data in survey research. One aspect that has been almost completely neglected by researchers is the role of interpersonal, mutual perceptions of interviewers and respondents in the occurrence of interviewer effects. This is surprising since, in many studies, researchers make implicit assumptions about the nature of respondents’ perceptions of the interviewer. For instance, in the literature on race-of-interviewer effects, it is the respondents' perception of the race of an interviewer (e.g., Black, White, or Hispanic) that is expected to affect response behavior rather than the ethnicity of the interviewer itself. The author could not identify a single study that investigates effects of the respondents’ perception of not directly visible interviewer characteristics such as interviewer opinions or attitudes. 2
This article investigates (competing) mechanisms in the social interaction between respondent and interviewer potentially underlying interviewer effects. For the first time, effects of the interpersonal perceptions of respondents and interviewers are systematically investigated: How does what respondents and interviewers think of each other concerning a survey question or topic affect the answers provided by respondents?
Theoretical Background and Hypotheses
The article at hand aims at analyzing and explaining interviewer-related measurement error in opinion and attitudinal questions and focuses on how responses are shaped by (1) the respondent’s perception of an interviewer, (2) the interviewer’s perception of a respondent, and (3) the interviewer’s own opinion/attitude on/toward a topic.
The Respondent’s Perception of the Interviewer
Scholars often refer to social desirability when explaining interviewer effects: Some respondents adjust their “true” answers toward social norms or, in case of face-to-face/telephone interviews, toward anticipated expectations of the interviewer to appear in a good light. “Respondents, in the absence of strong convictions of their own, may provide answers that they perceive as compatible with those that the interviewers themselves would give” (Groves and Fultz 1985:49; see also Cannell, Miller, and Oksenberg 1981). For instance, in questions about gender equality, female interviewers—on average—obtain more egalitarian gender-related attitudes than their male colleagues (Kane and Macaulay 1993). Thus, respondents seem to adjust their answers toward what they think their interviewer’s opinion is and what he or she wants to hear.
How can respondents infer what their interviewer thinks? In many existing studies, scholars (implicitly) assume that there is a direct connection between a visible interviewer characteristic, gender for instance, and (a range of) answer options that most likely represent what the respective group of interviewers thinks: “If an interviewer is female, she is most likely associated with feminist opinions.” However, a similar mechanism is also applicable to questions on topics that are not directly related to a visible interviewer characteristic. In this regard, the question arises of how respondents can form expectations and make judgments about interviewer characteristics, such as opinions, in cases where a question topic is not (mainly) related to a visible sociodemographic interviewer characteristic? As Sudman and Bradburn (1974:10) note, “there is some pressure in the interview situation toward agreeing with the interviewer insofar as one can determine her opinion.”
Research in social psychology suggests that humans continuously detect and employ cues made available by others to categorize them (Brunswik 1956; Nestler et al. 2012). Humans use verbal and nonverbal cues and hints, such as overall appearance, gestures, and facial expressions, to make judgments about others, for instance, regarding their personality. Judgments (or estimates) of such characteristics that are not visible are proven to be astonishingly accurate. Even at “zero acquaintance”—which is the near-complete lack of information on another person, except hints and information obtained in the first encounter—interacting partners can produce quite accurate estimates of each other (Ambady, Hallahan, and Rosenthal 1995; Levesque and Kenny 1993). This is verified, for instance, in the case of personality traits (Nestler and Back 2013), intelligence (Borkenau and Liebler 1993), and political orientation (Samochowiec, Waünke, and Fiedler 2010).
Applying these findings to face-to-face interviews, it appears plausible that respondents and interviewers can use verbal and nonverbal cues available in the social interaction to (accurately) infer opinions or attitudes (Hypothesis 1).
Furthermore, I argue that respondents use these inferences, that is, their perception of their interviewer, to adjust their answers toward the interviewer for impression management (Hypothesis 2).
The Interviewer’s Perception of the Respondent
It seems plausible that an interviewer also forms certain expectations about the respondent’s attitudes and opinions before an answer is given by the respondent. Such expectations about respondents may influence an interviewer’s verbal and nonverbal behavior, which, in turn, could affect the actual answer given by the respondent. Some interviewers may even communicate their expectation of an answer.
These “expectancy effects” are well-known to (social) psychologists (e.g., Rosenthal and Rubin 1978). They have been also addressed by early studies in survey research (see Boyd and Westfall 1955; Hyman 1954; Smith and Hyman 1950). As Hyman (1954:36) notes, “Consideration of such a plausible source of bias—the interviewer’s beliefs about the opinions of his respondent—seems to have been wholly neglected in more than a decade of methodological work on the problem. Why, when it is so obvious?” Based on an experimental research design, Smith and Hyman (1950:491) show that interviewers tend to “record the answer they expect to hear, rather than the answer which is actually given.” Other studies in survey research, however, have mainly focused on interviewers’ general (prior) expectations rather than their perceptions of individual respondents and specific answers. Sudman et al. (1977:174) ask interviewers about their general prior expectations regarding potential difficulties in measuring sensitive behaviors in a face-to-face survey. For instance, interviewers were asked which groups (if any) they expect to “feel at least moderately uneasy about answering the questions in each section” and whether they think the behaviors are going to be over-, under-, or correctly reported. The authors only found small effects. In line with this, Singer, Frankel, and Glassmann (1983) investigate expectation effects on response rates, item nonresponse, and response quality in a telephone survey, revealing no significant effects on data quality.
Hypothesis 3 states that the interviewer’s perception of likely respondents’ opinions affects respondents’ actual answering behavior.
Concerning the accuracy of interpersonal perceptions of respondents and interviewers, it seems plausible that working as an interviewer, and thus interacting with a wide assortment of different people, increases the ability to infer others’ opinions and attitudes accurately. Moreover, in comparison to respondents’ inferences about interviewers, interviewers can use additional information about respondents to infer opinions including characteristics of the neighborhood, building, apartment, furnishing, and decor. Thus, interviewers are expected to infer respondent opinions more accurately than vice versa (Hypothesis 4).
Interviewers’ Own Opinions/Attitudes
Finally, the interviewers’ attitudes and opinions may lead them to deviate from standardized interview behavior, which then affects responses, either through persuasion or through priming processes. 3 In the former case, interviewers may (sub)consciously “manipulate” respondents to answer in a way that reflects their own attitudes on a topic or issue, for instance, by probing suggestively (Smit, Dijkstra, and van der Zouwen 1997). In the latter case, an interviewer’s opinion may be reflected by verbal and nonverbal cues that in turn “trigger” (subconscious) priming mechanisms (Tulving and Schacter 1990) on the side of the respondent or influence respondents’ “belief-sampling” (for an overview, see Tourangeau, Rips, and Rasinski 2000) when forming an answer to a survey question.
Accordingly, the interviewer’s own opinion on a topic may affect respondents’ answers to related questions (Hypothesis 5).
Data
The Socio-economic Panel Innovation Sample (SOEP-IS)
Survey data for this study were collected in the context of the SOEP-IS Wave 2015 (see Richter and Schupp 2015). The SOEP is an ongoing longitudinal survey of households in Germany (Goebel et al. 2018). Conducted annually since 1984, the study covers a variety of topics such as household composition, employment and family biography, health, education, personality, and attitudes. In 2015, there were 37,315 individuals in 19,236 households participating in the study (Kroh et al. 2018). The SOEP Innovation Sample is part of the SOEP and offers researchers the possibility to implement innovative questionnaire modules and survey methods.
The SOEP-IS consists of five random subsamples that were drawn using the German ADM-sample approach (ADM 2009). The ADM-sample approach is a multistage clustered sample method in which regional clusters are drawn from a list of about 53,000 German regional districts. Starting from a random address in each cluster, the random route technique is used to identify the gross sample’s addresses. The initial (first wave) response rates vary between the subsamples ranging from 54.2 percent in 1998 (Sample E) to 26.5 percent in Supplementary Sample I4 in 2014 (American Association for Public Opinion Research [AAPOR] RR 2, see AAPOR 2016). In the SOEP-IS wave 2015, 307 different interviewers interviewed a total of 5,897 individuals in 3,758 households between September 2015 and February 2016. All interviews were conducted via personal, computer-assisted, face-to-face interviews (computer-assisted personal interviewing [CAPI]). Due to financial limitations, a random subsample of 125 interviewers was drawn for this research project. The data collected for this research are part of the 2015.1 SOEP-IS release (doi:10.5684/soep.is.2015.1).
Data Collection
Four types of data were collected for this research project (see Table 1). First, interviewer self-reports were obtained utilizing an interviewer survey. Prior to the survey, an interviewer training session was carried out in which regional team leader interviewers were informed about the research project. A total of 121 of the 125 sampled interviewers participated in the interviewer survey. Interviewers answered several questions about themselves based on a questionnaire installed on their fieldwork laptops. A small incentive of 5€ was offered for taking part in the interviewer survey. However, participating in the project itself, that is, being judged by respondents and also provide inferences about respondents, was not additionally compensated with an extra payment.
Data Collected on Respondents and Interviewers.
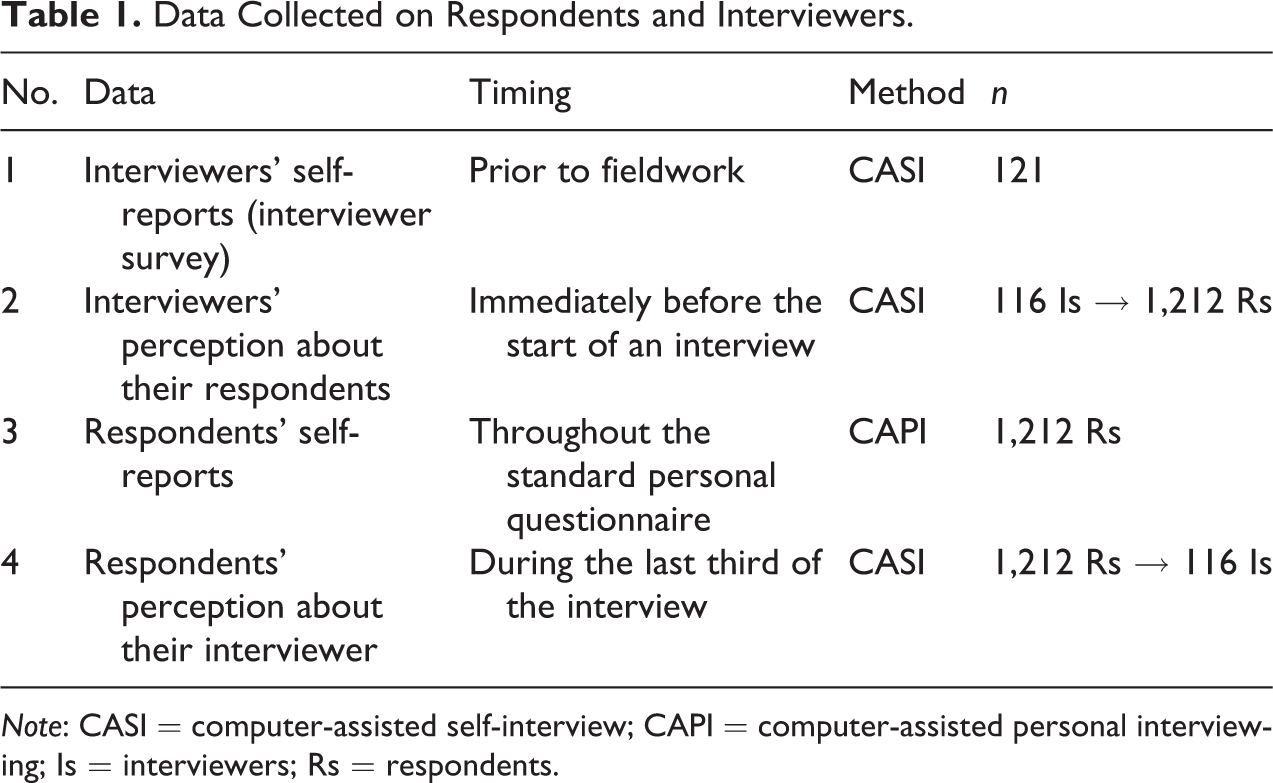
Note: CASI = computer-assisted self-interview; CAPI = computer-assisted personal interviewing; Is = interviewers; Rs = respondents.
Second, during the actual fieldwork, interviewers were asked to provide their inferences about a given respondent immediately before the beginning of each personal interview using the CAPI fieldwork computer system (see the Online Appendix [which can be found at http://smr.sagepub.com/supplemental/]). For organizational reasons, the fieldwork agency, Kantar Public, did not assign all 121 participating interviewers to work in the SOEP-IS survey field; thus, the number of interviewers participating in the research project is reduced to 116. Interviewers were supposed to answer the questions about a respondent during the process of setting up the computer/software system for the actual personal interview. Thus, if interviewers followed the protocol correctly, respondents were not aware of the interviewer making inferences about them.
Third, respondents’ self-reports were collected as part of the regular computer-assisted personal questionnaire during the first half of the survey interview.
And fourth, the respondents’ perceptions of their interviewers were collected during the last third of the interview. To minimize socially desirable response behavior, the questions were integrated into a computer-assisted self-interview (CASI) module that also included other sensitive questions, for instance, on mental health conditions. Respondents were asked to provide their perceptions of their interviewer’s opinions on a variety of topics as part of a research project interested in how individuals perceive each other (see the Online Appendix [which can be found at http://smr.sagepub.com/supplemental/]). All respondents assigned to the 116 participating interviewers were included in this experiment. As the SOEP is a longitudinal study, interviewers and respondents did not necessarily saw each other for the first time, and some have met each other in previous waves already.
The final sample for the upcoming analyses consists to 1,212 respondents in 756 households interviewed by 116 interviewers.
Variables
Research suggests that “attitudinal, sensitive, ambiguous, complex, and open-ended questions are more likely to produce variable interviewer effects” (West and Blom 2017:11). For this study, interviewer effects are investigated in answers to five opinion statements regarding social and political issues in Germany (see Table 2). The statements were specifically designed and purposely worded for this research project so that they are perceived as controversial by many. They cover topics that were highly discussed in Germany at the time of the data collection. Thus, at best, the items provoke the occurrence of interviewer-related measurement error while simultaneously showing substantial variation in self-reports and interpersonal perceptions.
Items Used in the Data Collection.

Note: Translated from the original German version. Scale from 1 (do[es] not agree at all) to 7 (totally agree[s]).
Methods
Self-reports and Interpersonal Perceptions
In a first step, interviewer and respondent self-reports, as well as interpersonal perceptions, are analyzed using measures of central tendency and variation. Bar charts provide visual comparisons of response distributions.
Accuracy and Consensus of Perceptions
The accuracy of interpersonal perceptions (Hypotheses 1 and 4) is investigated employing Spearman’s (1904) rank correlations coefficients of self-ratings versus interpersonal perceptions. The correlation coefficients reflect the extent to which perceptions relate to self-reports. For instance, large correlation coefficients would indicate that how an individual is seen largely matches what they report for themselves. In addition, multivariate linear regression analysis is used to test whether interviewer characteristics can explain the variation in consensus and accuracy of respondent perceptions about them.
Interviewer Effects
From a statistical perspective, interviewer-related measurement error includes both the bias and the variance that an interviewer contributes to the measurement of a variable. Bias and variance result in the total error or “mean squared error” (MSE) of a survey statistic with MSE = variance + bias
2
. Interviewer variance refers to the variable interviewer-related error. Usually, scholars refer to the concept of “intra-interviewer correlation” (or intra-class correlation, ICC,
One of the challenges of using intra-interviewer correlation estimates to identify and quantify interviewer effects (in face-to-face surveys) is that these effects are difficult to separate from “area effects.” As interviewers are often allocated to single or few clusters of geographically nearby households or individuals (the consequence of sampling regional clusters at a first sampling stage), values of intra-interviewer correlation may be confounded with area effects (Campanelli and O’Muircheartaigh 1999; Durrant and D’Arrigo 2014). In other words: Responses collected by a single interviewer might be more homogeneous compared to responses to other interviewers not because of the interviewer’s influence on answers but because individuals are more alike since they live in the same geographical area. To unequivocally separate interviewer from area effects in face-to-face surveys, specific research designs, so-called interpenetrated survey designs, are needed. Different types of interpenetrated designs are historically applied (see West and Blom 2017). In a fully 4 interpenetrated design, respondents are randomly allocated to interviewers (Mahalabonis 1946). Due to high travel costs, these designs are only very rarely implemented in cluster sample–based, face-to-face surveys. Thus, researchers have implemented partially interpenetrated designs that allow separating interviewer effects from area effects but minimize the costs due to interpenetration. For instance, O’Muircheartaigh and Campanelli (1998) applied a design in which addresses of geographic pools consisting of two or three primary sampling units (PSUs) were randomly allocated to multiple interviewers assigned to a given pool of addresses. Another example is Schnell and Kreuter (2005), who assigned multiple interviewers to each geographic area. In cases where deliberate interpenetrated designs cannot be implemented, researchers have used a “natural” crossing of interviewers and areas in order to separate interviewer effects from area effects. For instance, in many panel surveys, (some) interviewers work in multiple areas over time and multiple interviewers work in a given area. Given a cross-classification of interviewers and areas, one can make use of hierarchical models that include crossed random effects of interviewers and areas (Brunton-Smith, Sturgis, and Leckie 2017; West and Blom 2017; West, Kreuter, and Jaenichen 2013).
For this article, a similar approach is used by applying hierarchical cross-classified models that make use of the cross-nesting of interviewers and areas in the SOEP database, thereby separating the interviewers’ and the areas’ contribution to the variance of a survey measure. On average, interviewers are allocated to 2.6 PSUs (Min. = 1, Max. = 6). On average, 1.5 interviewers are working in each PSU (Min. = 1, Max. = 4). Besides, rich information about the geographic areas is added into the regression models to counteract further confounding due to the potential endogeneity of area/interviewer selection effects. This includes socioeconomic structural data at German county, municipality, and neighborhood levels. Table A.2 in the Online Appendix (which can be found at http://smr.sagepub.com/supplemental/) provides a list of all the variables added as area-level fixed effects into the models. Finally, respondent sociodemographics are added, including gender, age, and school education.
The respondents’ self-reported opinions function as the dependent variable. For each of the five items, a multivariate hierarchical regression model is estimated (see Brunton-Smith et al. 2017:5):


Three models are estimated for each item. The first model seeks to retrieve an unbiased estimation of the interviewer variance
In a second step, this study seeks to quantify the potential bias introduced by interviewers and investigates how individual responses are shaped by (a) how respondents see their interviewers (Hypothesis 2), (b) how interviewers see their respondents (Hypothesis 3), and (c) what interviewers think about the topics themselves (Hypothesis 5). Again, multivariate hierarchical regression models are estimated. The hierarchical data structure is represented by individuals nested in households and households nested in interviewers. 5 To allow for a more straightforward interpretation of results, I choose to estimate logistic regression models and analyze accompanying odds ratios rather than ordinary least squares estimators. A single model is estimated for each item. The dependent variable is a binary taking the value 1 if a respondent disagrees with a statement (values 1 and 2 on the seven-point scale) and 0 if he or she agrees or is neutral (values 3– 7 on the seven-point scale). Three main explanatory variables were recoded into dummies analogously: (1) the respondent’s perception of his or her interviewer, (2) the interviewer’s perception of the respondent, and (3) the interviewer’s own opinion on a topic. Respondent and interviewer sociodemographics (gender, age, school education) are added as controls. Finally, a proxy for opinion strength—interest in politics—is added as a control.
Results
Variation in Self-reports and Interpersonal Perceptions
Figure 1 displays the variation in responses as well as the mean and standard errors for all five items and across the four types of data. Relating to the self-reports of respondents and interviewers (columns 1 and 2), two things are noteworthy. First, respondent and interviewer answering behavior is highly comparable, reflected by the similarity of the response distributions. Second, although some of the distributions are skewed, there is substantial variation in responses to all items. In other words, in all cases, there are some respondents/interviewers who totally agree with a statement and others who totally disagree. Moreover, there are differences in response behavior across items. For instance, while the majority of respondents and interviewers disagree with making fun of religious topics (item 2), many agree with legalizing euthanasia (item 4).

Distributions, means, and standard errors of (1) respondent self-reports, (2) interviewer self-reports, (3) respondent perceptions about their interviewers, and (4) interviewer perceptions about their respondents. T tests for each item investigates whether respondents and interviewers differ in their average responses. No statistically significant differences were observed (α = 10 percent) for any of the five items.
Turning to the variation in interpersonal inferences (columns 3 and 4), respondents and interviewers similarly show a highly comparable response pattern. And again, there are also substantial differences across items. Comparing these interpersonal perceptions with the self-reports in columns 1 and 2, it is notable that when making inferences, respondents and interviewers are more likely to make use of the middle category on the scale. This seems highly plausible since inferences about others are associated with uncertainty and choosing the middle category is a reasonable strategy in the absence of clear cues and hints.
Interpersonal Perceptions: Accuracy and Consensus
In the next step, the interpersonal perceptions were analyzed in terms of their accuracy. Are respondents able to estimate their interviewer’s opinions on the topics accurately and vice versa? In this regard, accuracy is defined as the extent to which an inference matches the respective self-report. Figure 2 displays Spearman rank correlation coefficient estimates along with 95 percent confidence intervals based on a bootstrapping procedure (1,000 replications).
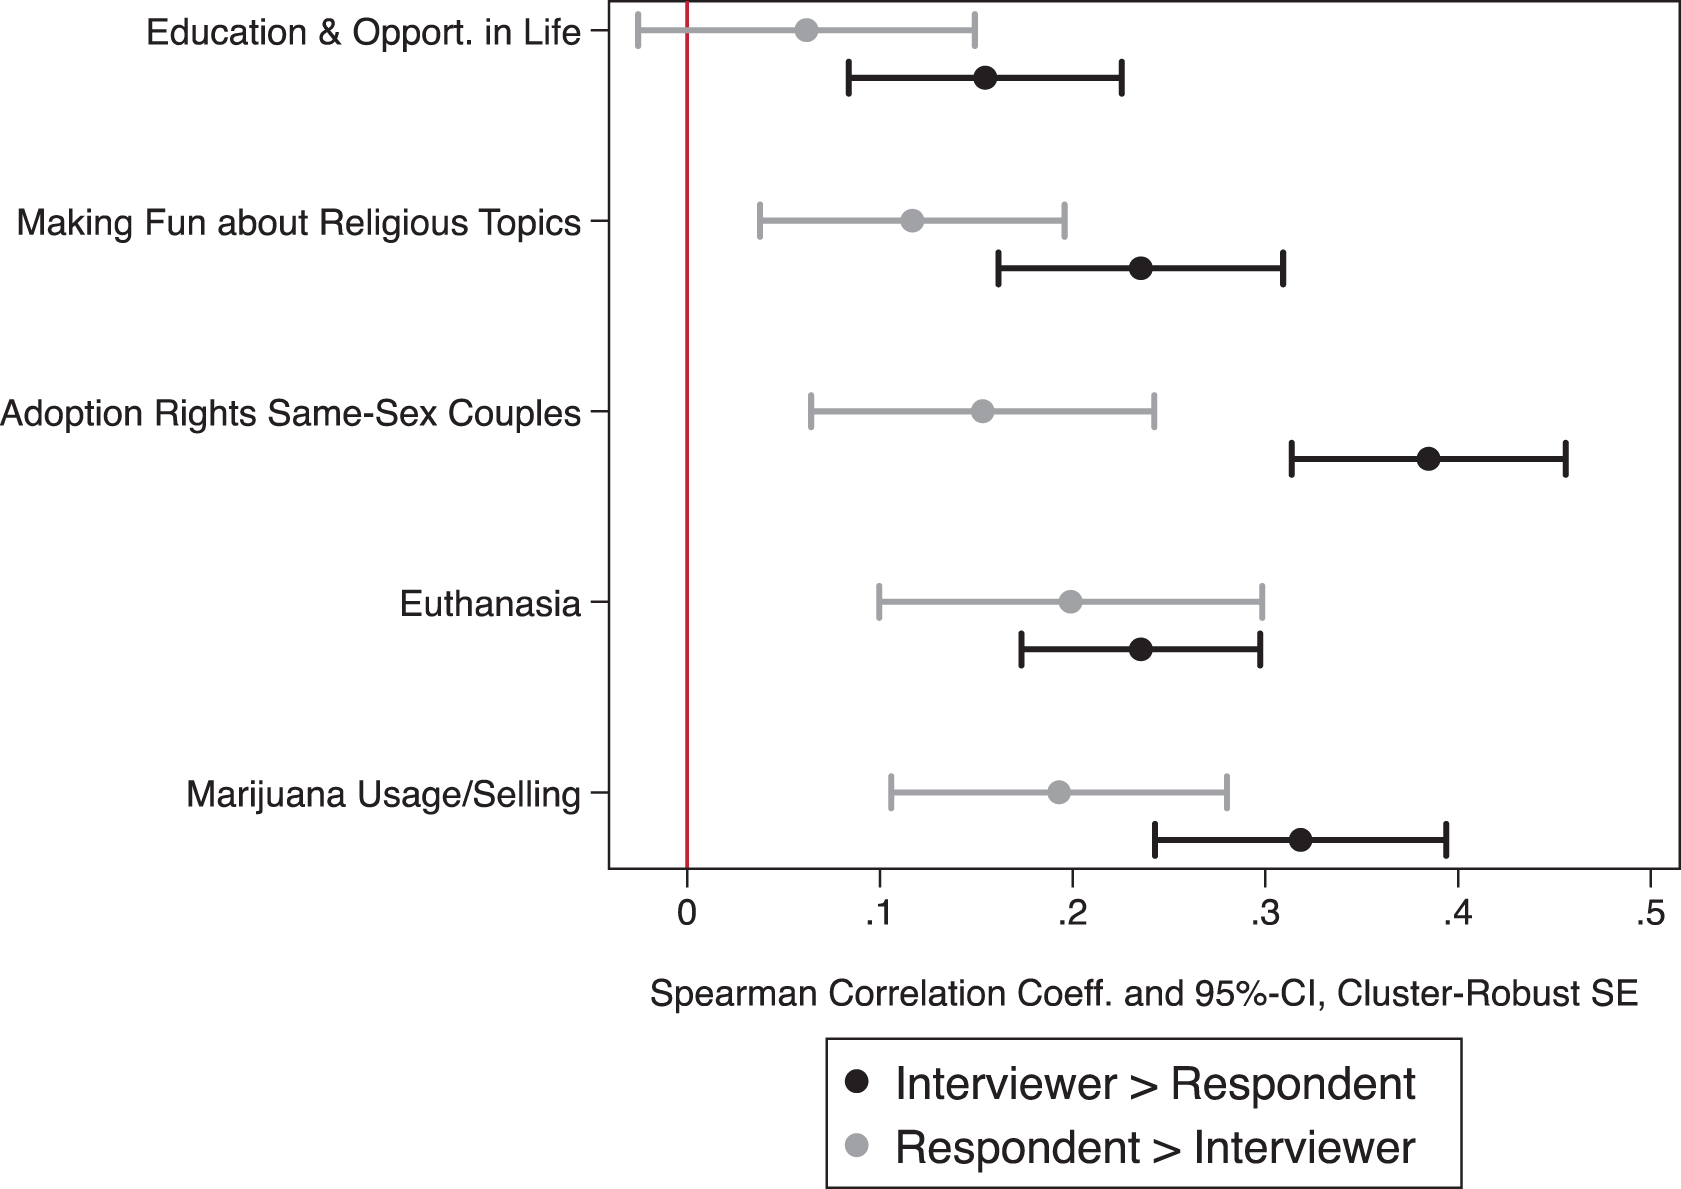
Accuracy of interpersonal perceptions using Spearman rank correlation.
The correlation coefficients range from 0.06 for item 1 (respondent → interviewer, education and opportunities in life) to 0.38 for item 3 (interviewer → respondent, adoption rights same-sex couples). All except for one coefficient reach statistical significance (
Even though most differences do not reach statistical significance, interviewers perform better in accurately inferring respondent opinions than vice versa (Hypothesis 4). This seems plausible given the fact that their job as an interviewer allows them to get to know the opinions and attitudes of many, thereby likely improving their ability to infer opinions. Moreover, as interviewers visit respondents at their homes, they can incorporate numerous additional cues in the process of forming a perception. 6
Analyzing the accuracy of respondent perceptions allows assessing the overall quality of respondent judgments about interviewers. However, it does not warrant any conclusion about whether respondents agree in their perceptions of an individual interviewer or not. Hence, in a next step, the consensus of respondent perceptions of their interviewers is analyzed based on the variance of respondent perceptions for each interviewer (that was judged by at least five respondents). Given the seven-point answer scale, the variance amounts to zero if all respondents agree in their perception of a given interviewer. It amounts to the maximum of nine if exactly half of the respondents choose the lowest value on the scale (= 1) and the other half chooses the highest (= 7). Figure 3 displays the variance of respondent perceptions across interviewers in ascending order for all five items.

Consensus—Variance in respondent perceptions across interviewers.
Each dot represents an interviewer. As one can see, there is a large variation in the variances of respondent perceptions across interviewers. In some cases, respondents disagree strongly in their perceptions of some interviewers, resulting in large variances. In other cases, respondents’ perceptions of interviewers largely coincide. However, most interviewers are located in between with the majority on the lower side of the variance distribution. In general, the consensus in respondent perceptions of their interviewers is rather low. This is reflected by the low values of Cohen’s (1960) Kappa κ, a global measure of interrater agreement, ranging from .07 to .11.
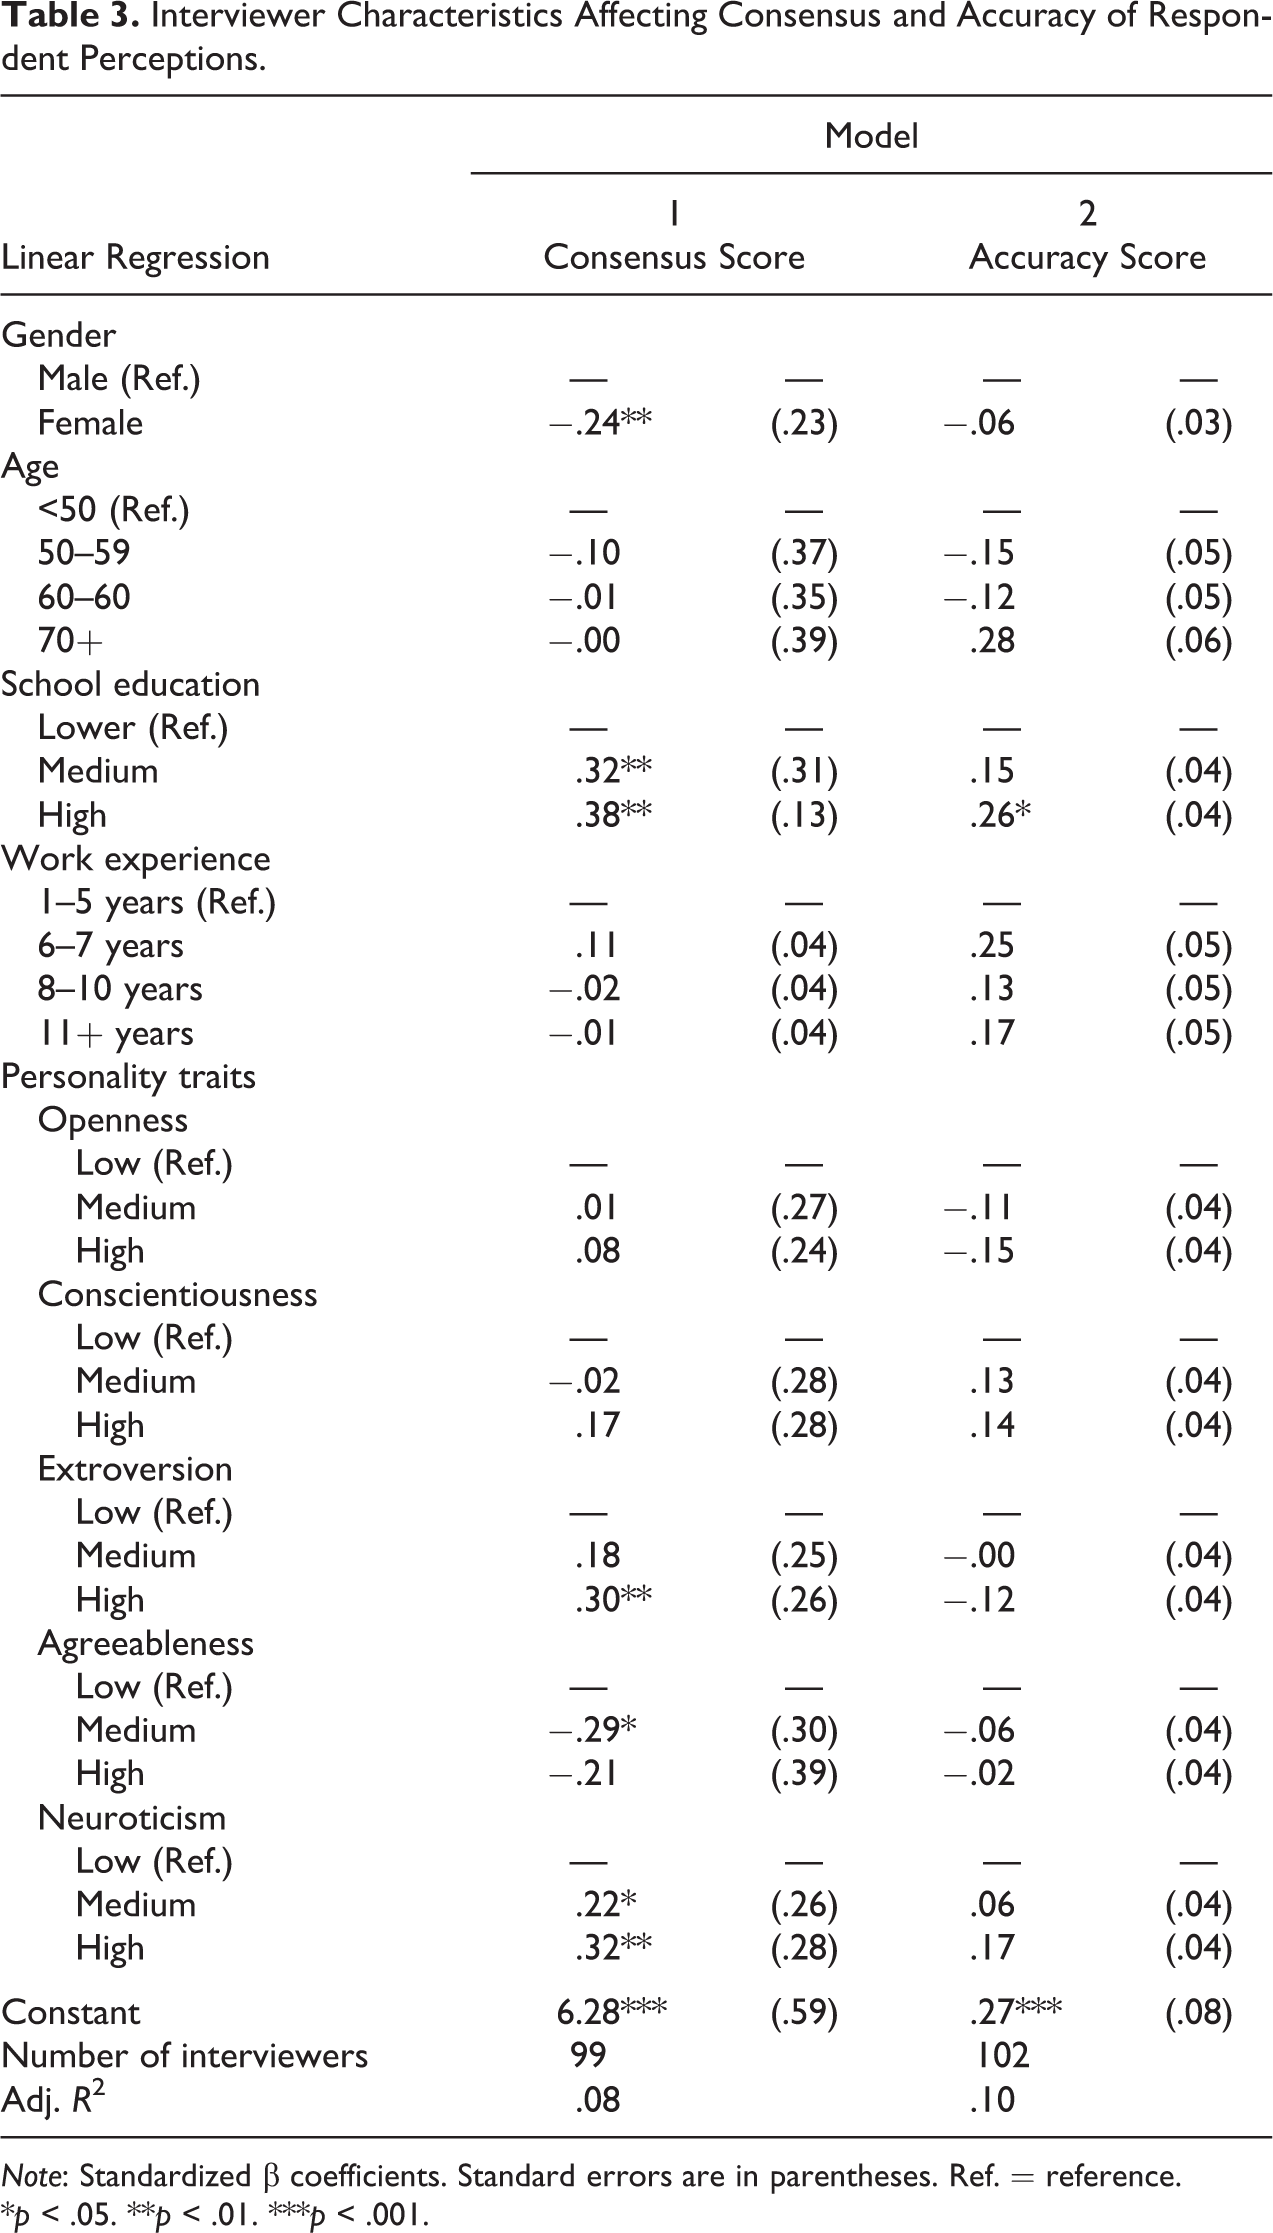
Are there certain types of interviewers for whom (a) respondents’ perceptions agree and (b) whom respondents judge accurately? As a measure of overall consensus, average variance in respondent perceptions across the five items for each interviewer is used and transformed so that larger values represent more consensus in the perceptions (
Interviewer Characteristics Affecting Consensus and Accuracy of Respondent Perceptions.
Note: Standardized β coefficients. Standard errors are in parentheses. Ref. = reference.
*p < .05. **p < .01. ***p < .001.
Several interviewer characteristics can be related to the consensus of perceptions (model 1). Respondents are less likely to agree in their perceptions when interviewed by a female interviewer compared to male interviewers (β = −.24, p < .05). Moreover, respondents are more likely to agree when interviewed by an interviewer with a medium or higher school education compared to a lower education (β = .32 and β = .38, p < .05). Finally, the interviewers’ personality is associated with the consensus of perceptions. A positive effect is observed for the extroversion personality dimension. Interviewers that describe themselves as very outgoing and energetic are more likely to achieve agreeing perceptions (β = .30, p < .05). This seems plausible as interviewers who are socially outgoing may also provide more information about themselves and their opinions. Moreover, an outgoing personality may generally be associated with more liberal opinions on the topics. In addition, interviewers scoring higher on the neuroticism dimension—reflecting emotional instability—are more likely to be judged consistently (β = .22, p < .10 and β = .38, p < .05). Low emotional stability is often associated with emotionally reactive and dynamic individuals, thus, again, possibly offering more cues and hints throughout the survey interview interaction.
Turning to determinants of the accuracy of perceptions (model 2), only one coefficient reaches statistical significance. Interviewers with a higher school education are judged more accurately by their respondents (β = .32, p < .05). While not statistically significant, there is a consistent positive effect of the interviewers’ work experience, with more experienced interviewers being judged more accurately. A possible explanation is that more experienced interviewers are—on average—also more familiar with their respondents and vice versa, as interviewers are repeatedly allocated to the same respondents in the SOEP. And indeed, respondents who are more familiar with their interviewer are more likely to provide an accurate inference (see Table A.3 in the Online Appendix [which can be found at http://smr.sagepub.com/supplemental/]).
Interviewer Effects
Interviewer variance in the items is analyzed using Kish’s

Explaining interviewer variance in the five items.
Three different model specifications were estimated for each opinion statement. In the first set of models (basic model, represented by gray squares), the interviewer variance is estimated adding area covariates only. The coefficient estimates reveal a substantial impact of interviewers on the total variance for four of the five items tested. Kish’s
The interviewers’ own opinions about the topics may explain these effects (Hypothesis 5). On the one hand, the interviewer’s opinion about a given topic may lead them to (sub)consciously probe and react such that respondents answer in a certain way. On the other hand, respondents may accurately infer the interviewer’s own opinion and adjust their answers accordingly. If the observed intra-interviewer variance is actually due to the interviewer’s own opinions about the topic, adding their opinions into the models would substantially decrease the
In a third step, the respondents’ perceptions of their interviewers are added. How do respondents—on average—see their interviewers? Do they think an interviewer agrees, disagrees, or is neutral toward a statement and can this explain the observed intra-interviewer correlation? Including how each interviewer is seen by the respondents substantially decreases the interviewer variance estimates (represented by dark gray dots). For items 1, 2, 4, and 5, the estimated interviewer variance drops to almost zero. Thus, the variance in responses that is due to the interviewer can be explained almost entirely by how the interviewers are perceived—on average—by their respondents. Only for item 3 (adoption rights for same-sex couples) does the intra-class coefficient remain above zero, at .04, however, having also decreased substantially.
Taken together, these findings provide novel empirical evidence that establishes for the first time that it is not the interviewers’ own opinion that causes a clustering (homogeneity) of responses within interviewers but how an interviewer is perceived by respondents.
Effects of Individual Inferences on Responses
Thus far, the analysis focused on interviewer variance and average perceptions of respondents about their interviewers. Next, the effects of the individual perceptions of respondents about their interviewers (and vice versa) on survey answers are analyzed, thereby allowing to assess the potential for interviewer bias. To do so, a multilevel mixed effects logistic regression model for each of the items is estimated. A binary variable taking the value 1 if a respondent answered that she or he disagrees with a statement (scale categories 1–2) and 0 otherwise (scale categories 3–7) is used as the dependent variable. The key explanatory variables are also binaries and reflect the same response categories (i.e., the value 1 reflecting disagreement). This includes the respondent’s perception of the interviewer, the interviewer’s perception of a respondent, and the interviewer’s own opinion on a topic.
Table 4 displays odds ratios and corresponding standard errors for all five models. Turning to the respondents’ inferences about their interviewers, strong effects are observed: In cases where respondents think that their interviewer disagrees with a statement, they are much more likely to state that they also disagree with a statement. For instance, in item 1 (education and life opportunities), the chance (odds) of respondents to state that they disagree with the statement is increased by a factor of about 7 (OR = 7.23, SE = 1.42) if they think that their interviewer also disagrees with the statement compared to respondents who think their interviewer agrees/is neutral. Respondents are also more likely to disagree with making fun about religious topics (OR = 8.82, SE = 1.49), same-sex couple adoption rights (OR = 4.39, SE = 0.81), euthanasia (OR = 5.49, SE = 1.08), and marijuana usage/selling (OR = 4.93, SE = 0.76). As a robustness check, alternative model specifications were tested including (a) different categorization of dependent and independent variables and (b) switching to a linear regression approach. However, the strong effects do not disappear in these models. Moreover, the binary variables are not associated with rare categories (i.e., cells with a very small number of observations) that sometimes can cause such large coefficients (and usually large standard errors).
Multilevel Mixed Effects Logistic Regression Models: Disagreeing With a Statement (= 1) Versus Agreeing With/Neutral Toward a Statement (= 0).

Note: Values denote odds ratios. Standard errors are in parentheses. Individuals nested in interviewers. Ref. = reference.
*p < .05. **p < .01. ***p < .001.
In addition, there is a significant effect of the interviewers’ perception of their respondents on their responses to all five items. Interviewers who state that a given respondent is likely to disagree with an item indeed obtain more disagreeing responses.
Finally, for four of the five items, the interviewers’ own opinions about the topic do not significantly affect the respondent answers. Only for item 2 (making fun of religious topics), a significant effect is observed (OR = 1.60, SE = 0.31). These results match the previous findings on interviewer variance.
Finally, even though not in the focus of this article, there are some interesting (and plausible) differences in response behavior across sociodemographic groups: Older respondents are more likely to answer conservatively, for instance, by disagreeing with making fun of religious topics, disagreeing with adoption rights for same-sex couples, and disagreeing with the legalization of marijuana.
Conclusion
Summary
This article aimed at identifying underlying mechanisms causing interviewer-related measurement error in face-to-face surveys. A unique and innovative database was created to investigate the phenomenon. In this regard, not only interviewer and respondent self-reports of opinions about topics were combined but also, for the first time, their interpersonal perceptions of each other.
The results show that respondents and interviewers perform quite well in inferring each other’s opinions on a number of topics. Interviewers generally perform better in doing so, which seems plausible given their job experience and extent of information available in the interview situation. The consensus in respondent perceptions about their interviewers is highly variable. First analyses show that respondents are more likely to agree in their perceptions when interviewed by a male interviewer, an interviewer with higher school education, and interviewers describing themselves as more extraverted and neurotic. Further research is needed to better understand under what conditions respondents agree in their perceptions about an interviewer and why they are accurate or not.
The results reveal comparatively large interviewer effects in the data. Turning to interviewer variance, how an interviewer is seen (on average) by his or her respondents explains almost all of the variation that is associated with the interviewers. Contrary to existing findings, the interviewers’ own opinions do play a less important role in explaining the homogeneity of responses within interviewers. Turning to the effects of the individual inferences on respondent answers (interviewer bias), again, strong effects are observed. Respondents who think that their interviewer disagrees with a statement are also much more likely to state that they disagree with the statement.
Finally, the interviewers’ perceptions of their interviewees are positively related to their responses as well: When interviewers think that respondents are more likely to (dis)agree with a statement, this assessment often shows to be accurate.
Insights on Underlying Mechanisms
Which underlying mechanisms may cause the observed effects? The empirical evidence presented in this article suggests several possible avenues by which the effects unfold.
Social desirability
The results strongly point to an adjustment of responses toward anticipated interviewer opinions. Some respondents seem to modify their answers to meet anticipated interviewer expectations and thus appear in a good light in front of the interviewer. This is not necessarily lying in a strict sense. Expecting that many respondents may not have strong, crystallized, and immediately available opinions on the topics, taking into account an anticipated interviewer opinion and (slightly) adjusting an answer accordingly is a plausible and rational answering behavior in an interview situation. The results provide first empirical evidence for an underlying mechanism causing interviewer effects that has been implicitly assumed by many researchers in the past but has been never actually tested before.
Priming
In principle, the strong influence of respondent perceptions on answers can also be explained by a priming mechanism. Respondents may be subconsciously “primed” by their perception of an interviewer and thus access only certain information from memory to form an answer. However, this seems rather implausible. In addition, no evidence was found for a “global” priming through interviewer characteristics as the interviewers’ own opinions did only play a minor role in explaining response behavior.
Manipulation/suggestive probing
It was hypothesized that the interviewers’ attitudes and opinions may lead them to deviate from a standardized behavior. They may (sub)consciously “manipulate” respondents to answer in a way that reflects their own opinions, for instance, by probing suggestively. However, as the interviewers’ own opinions do not significantly affect response behavior, there is no empirical evidence for manipulation or suggestive probing.
Expectancy effects
Respondents are more likely to (dis)agree with a statement if their interviewer thinks that they do so. This finding may indicate expectancy effects. Interviewers may (sub)consciously communicate their expectation of an answer and thereby affect respondent answering behavior.
Implications for Survey Fieldwork
The observed results suggest a number of implications for survey practitioners and researchers. First, researchers should be aware of the fact that some respondents adjust their responses to all kinds of anticipated interviewer opinions, attitudes, and traits—and not only in case a question topic is related to a visible interviewer sociodemographic such as gender or age. Therefore, survey practitioners may choose to switch to an alternative survey mode (e.g., CASI) or survey technique (e.g., randomized response) when asking questions likely being perceived as sensitive or controversial. This hopefully increases the respondents’ motivation to answer truthfully and decreases the subjective costs associated with providing answers perceived as undesired by others.
While the survey questions under study are rather controversial, and thus, more likely to provoke interviewer effects such as socially desirable responding, the observed effects and mechanisms apply to other types of questions as well. Even in case a question does not include clear socially desirable connotations, respondents can anticipate what their interviewer thinks, and some may answer accordingly. This is a plausible cognitive mechanism for respondents that face survey questions for which they do not have a crystallized and immediately available answer.
The results also point to the importance of interviewer staff composition. In case the interviewer staff is rather heterogeneous (at best itself representing a random sample of the population), the overall bias in an estimate (a mean for instance) would be rather low as biasing effects of individual interviewers cancel each other out: Some interviewers are perceived as likely agreeing with a statement and others are not. However, the potential for bias increases with the homogeneity of the interviewer staff. For instance, if all interviewers are being perceived as very conservative, biased estimates in related questions are likely. And indeed, for instance, face-to-face interviewers in the SOEP are rather old (M = 62, Mdn = 64). Thus, to minimize the overall potential for interviewer bias, fieldwork management should increase the heterogeneity of their interviewer staff.
The results also point to the necessity of extensive interviewer training with a special focus on verbal and nonverbal communication. Interviewers should be aware of the fact that respondents infer opinions (accurately) and that their own (non)verbal behavior—driven by their own opinions and expectations—can affect the answers they obtain.
Limitations and Further Research
This article also faces some limitations. First, the study is observational in nature and not experimental. Although common and suitable techniques to identify interviewer effects are applied and many potential confounders are controlled for, interviewer effects may still be overestimated (and confounded by area effects to some degree).
Second, since there is no video or audio material available to analyze the actual interview situation and communication, it is not possible to rule out that some interviewers shared their actual opinions with their respondents, thereby violating the interview protocol and script. However, if this were the case, respondents’ perceptions of their interviewers should be more accurate than vice versa, which is not the case. Moreover, rating other individuals is likely perceived as an interesting and quite easy task as humans are used to doing so in their daily lives. Thus, the propensity to violate the interview protocol is expected to be rather low.
Furthermore, the study faces limitations with respect to the identification and causal direction of underlying mechanisms and effects. While it seems highly plausible that respondents adjust their answers toward anticipated interviewer opinions, some may also adjust their anticipations toward their own (true) opinions on a topic (“social projection”), potentially causing an overestimation of the observed effects. In addition, the effects of the interviewers’ perceptions of their respondents may not be due to a causal relationship (an expectancy effect) but simply reflect an interviewer’s ability to infer opinions accurately (“correlation rather than causation”).
This article provides novel insights on the underlying mechanisms in the occurrence of interviewer-related measurement error. Nonetheless, further research is needed to unequivocally determine the causal direction of the effects. Unfortunately, such research is very costly, as experimental designs and new data types such as audio/video recordings are needed. In light of these constraints, this study presented an innovative approach to survey research, which it applied in the context of an ongoing social survey, that is, a survey not specifically conducted to test survey methodological questions.
The article also offers several starting points for future research projects. First, it seems plausible that respondents differ in their tendency to incorporate perceptions of their interviewers while taking a survey. What type of respondent is especially likely to adjust their answers toward anticipated interviewer characteristics? Future work should examine these “heterogeneous interviewer effects.” Second, collecting (experimental) panel data on interpersonal perceptions over time will aid in identifying the causal relationship between interpersonal inferences and potential adjustments of answers. Third, researchers may collect audio and video recordings of interviewers in order to analyze the role of physical appearance as well as verbal and nonverbal communication (cues and hints). Fourth, future research should analyze the potential moderating role of the strength and consistency of opinions/attitudes in the occurrence of interviewer effects. For instance, it seems reasonable to assume that strong and stable opinions are less likely to be adjusted toward the interviewer compared to weak and volatile opinions. Finally, future research should further address the interplay of respondent and interviewer characteristics. For instance, their personality traits may affect how they perceive each other and whether respondents tend to adjust their answers toward the interviewer.
Supplemental Material
Supplemental Material, Appendix_SMR_926215 - Interpersonal Perceptions and Interviewer Effects in Face-to-Face Surveys
Supplemental Material, Appendix_SMR_926215 for Interpersonal Perceptions and Interviewer Effects in Face-to-Face Surveys by Simon Kühne in Sociological Methods & Research
Footnotes
Declaration of Conflicting Interests
The author(s) declared no potential conflicts of interest with respect to the research, authorship, and/or publication of this article.
Funding
The author(s) disclosed the receipt of the following financial support for the research, authorship, and/or publication of this article: The Charles Cannell Fund in Survey Methodology, Institute for Social Research, University of Michigan (funding period 2015/2016).

Supplemental Material
Supplemental material for this article is available online.
Notes
References
Supplementary Material
Please find the following supplemental material available below.
For Open Access articles published under a Creative Commons License, all supplemental material carries the same license as the article it is associated with.
For non-Open Access articles published, all supplemental material carries a non-exclusive license, and permission requests for re-use of supplemental material or any part of supplemental material shall be sent directly to the copyright owner as specified in the copyright notice associated with the article.
