



Abstract
Individual religiosity measures are used by researchers to describe and compare individuals and societies. However, the cross-cultural comparability of the measures has often been questioned but rarely empirically tested. In the current study, we examined the cross-national measurement invariance properties of generalized individual religiosity in the sixth wave of the World Values Survey. For the analysis, we used multiple group confirmatory factor analysis and alignment. Our results demonstrated that a theoretically driven measurement model was not invariant across all countries. We suggested four unidimensional measurement models and four overlapping groups of countries in which these measurement models demonstrated approximate invariance. The indicators that covered praying practices, importance of religion, and confidence in its institutions were more cross-nationally invariant than other indicators.
Keywords
Religion is an integral part of societies and is associated with multiple variables, such as mental or physical health-related outcomes (Koenig 2015; Tarakeshwar, Stanton, and Pargament 2003). The unceasing scientific discussions on secularization and globalization have increased the need for valid research instruments to measure and compare religiosity across individuals and countries. Scholars have attempted to capture individual religiosity in recent decades. While they agree on its complexity and multidimensionality, there continues to be a considerable debate about the very possibility of a universal measure of the construct. At the same time, a number of scales for its measurement have been developed, which cover various dimensions of religiosity, including beliefs, practices, or communal involvement (Cutting and Walsh 2008; Hill and Edwards 2013; Hill and Hood 1999).
The availability of data from multinational surveys such as the World Values Survey (WVS) provides opportunities for the empirical study of the construct from a comparative perspective. Such research requires measurement invariance (MI) to be able to make a valid inference on differences and similarities in individual religiosity across countries (Davidov et al. 2014; Jowell 1998). MI is “a property of a measurement instrument, implying that the instrument measures the same concept in the same way across various subgroups of respondents” (Davidov et al. 2014:58). However, as indicated above, the assumptions of universality of religiosity and its valid cross-national measurement have been questioned (Fichter 1969; Hill 2005; Tarakeshwar, Stanton, and Pargament 2003). Moreover, contemporary surveys have been criticized for the use of questionnaires developed in Western countries, which can make them inappropriate to be applied in contexts outside of Christian tradition.
The WVS covers more than 80% of the world population (Norris 2009) and explores countries with multiple religious, cultural, and social backgrounds. For many scholars engaged in comparative research, these data are the main source of information on global modernization processes (Inglehart and Welzel 2005), religiosity (Norris and Inglehart 2004), and various aspects describing individuals and societies, such as satisfaction with life and happiness (Lun and Bond 2013), health (Lu and Yang 2020), attitudes (Glas, Spierings, and Scheepers 2018), moral values (Tausch 2019), or political behavior (Arikan and Bloom 2019). However, contextual differences across countries can lead to diverse conceptualizations of religiosity and varying understandings of the corresponding survey questions. If measures work better for some populations and not for others, conclusions about group differences related to religiosity may be incorrect (Chen 2008).
Despite the popularity of the comparative assessment of religiosity, the invariance of its measures used in cross-national surveys has usually been implicitly assumed rather than empirically investigated. Previous attempts to address the issue are scarce and focused on the evaluation of a limited number of indicators and samples of predominantly European Christian populations (Bechert 2018; Lemos et al. 2019; Meuleman and Billiet 2011; Siegers 2011).
The current research aims to bridge this gap by examining the invariance properties of the measurements of religiosity in the WVS. Using data from the 6th wave of the survey, we looked for a meaningful model of religiosity across countries and tested the invariance of this model with multiple group confirmatory factor analysis (MGCFA) and alignment optimization to evaluate the degree of MI. Overall, we devised instruments that can be used by researchers for a valid examination of religiosity across groups of countries.
The paper is structured as follows. The next section begins with a brief overview of the concept of MI, its importance, and how it may be tested. Next, we outline existing approaches to operationalize religiosity and address challenges for its cross-national invariance. Then, we describe the design of the current empirical study. The subsequent sections present the results of MGCFA and alignment evaluations of invariance of the measurement of religiosity. Finally, we discuss the main findings and implications for future research.
Background
Measuring Religiosity
Since the 1950s, researchers have paid considerable attention to how religiosity can be best defined and measured across different traditions and cultures. However, the only consensus achieved in the ensuing 70 years is that a general theory of religiosity (and consequent measurement) is highly problematic (Finke and Bader 2017). Theorists implemented the construct in their analytical frameworks differently and were focused on its different aspects, such as beliefs or behaviors (e.g., Durkheim [1912] 1995; Weber [1905] 2001). Due to the lack of common theoretical grounding, the measurement of religiosity has also remained a debatable issue. Over two hundred instruments have been developed to assess various dimensions of religiosity (Cutting and Walsh 2008; Hill and Edwards 2013; Hill and Hood 1999). However, very few of them claimed to be applicable across different religions, and barely any provided actual evidence of invariance (for an exception, see, e.g., Lemos et al. 2019; Meuleman and Billiet 2011).
To evaluate the possibility of the common conceptualization of religiosity, we reviewed the available approaches and investigated the typical conceptualizations of religiosity. Religiosity is sometimes combined with the spirituality concept; however, these terms are not identical and can differ in their functions and the context in which they are expressed (Pargament et al. 2013). Specifically, religiosity is primarily associated with the institutional structures of a particular religion while spirituality often emphasizes indifference or even opposition toward institutionalized context and defines its own nontraditional expressions (Johnson et al. 2018; Pargament et al. 2013). A merged religiosity/spirituality construct may be useful for individuals who identify themselves as “both spiritual and religious” (Zinnbauer et al. 1997), although it can have limited generalizability when applied to heterogeneous populations relative to their spiritual and/or religious identification, such as those covered in the WVS. Moreover, the WVS questions mainly address traditional religious expressions held in a theistic context; thus, they may be unsuitable for assessing alternative expressions of spirituality. Therefore, we focused on religiosity in the current study.
Generally, researchers agree that religiosity is a multifaceted phenomenon, and they examine the construct by decomposing it into several dimensions and using multiple indicators to measure each of these dimensions. We focused on the widely used multidimensional instruments that were not specific to only certain aspects of religiosity and covered at least three distinct dimensions of the construct. These approaches were general enough and might be suitable to assess “generalized religiosity”. Moreover, we selected scales that measured religiosity and not its possible correlates or outcomes, such as coping with stressful life situations (Billiet 2002; Cornwall et al. 1986; Dejong, Faulkner, and Warland 1976; Faulkner and Dejong 1966; Glock 1962; Hilty, Morgan, and Burns 1984; Huber and Huber 2012; King and Hunt 1972; Lenski 1961; Rohrbaugh and Lessor 1975; Saroglou 2011; Saroglou et al. 2020; Tarakeshwar, Stanton, and Pargament 2003; Voas 2007). The number, label, and specific content of dimensions vary across approaches. We specified six categories that represent the most commonly distinguished dimensions: individual practices, feelings, beliefs, community, knowledge, and values. The practices center on actions that are expected of people who identify themselves with a certain religion, such as participation in religious services or private worship. The feelings of individuals pertain to the mental and emotional facets of religiosity, such as religious experiences that inspire a feeling of being close to the Divine or the sense of well-being that people derive from beliefs and practices. The third aspect captures beliefs, such as beliefs in God, afterlife, or other religious principles. The community reflects individuals’ self-identification with their denomination and participation in religious groups. Finally, knowledge refers to the knowledge of faith or sacred scriptures, and the values dimension relates to attitudes that people hold as a consequence of their religiosity and behavior in accordance with specific norms and moral rules (e.g., attitudes toward abortion or lying).
While many researchers analyzed the six dimensions of religiosity separately, some scholars combined specific aspects into one dimension. For example, Billiet (2002) distinguished the religious involvement factor that covers practices and communal affiliation. Voas (2007) included beliefs, knowledge of creeds, and affective experiences of individuals in the beliefs aspect. In the current study, we focused on the four separate dimensions of religiosity that can be found in many instruments and can be covered with WVS indicators: practices, feelings, beliefs, and community. We further renamed the “feelings” dimension as the “orientation” dimension because the latter label better corresponds to the specifics of the WVS indicators, which are specifically focused on their orientation to religion rather than on different religious experiences (see Figure 1 in the Methods section). The values and knowledge dimensions were problematic to generalize since every religious tradition has its own set of specific knowledge and prescribes an endorsement of different values.
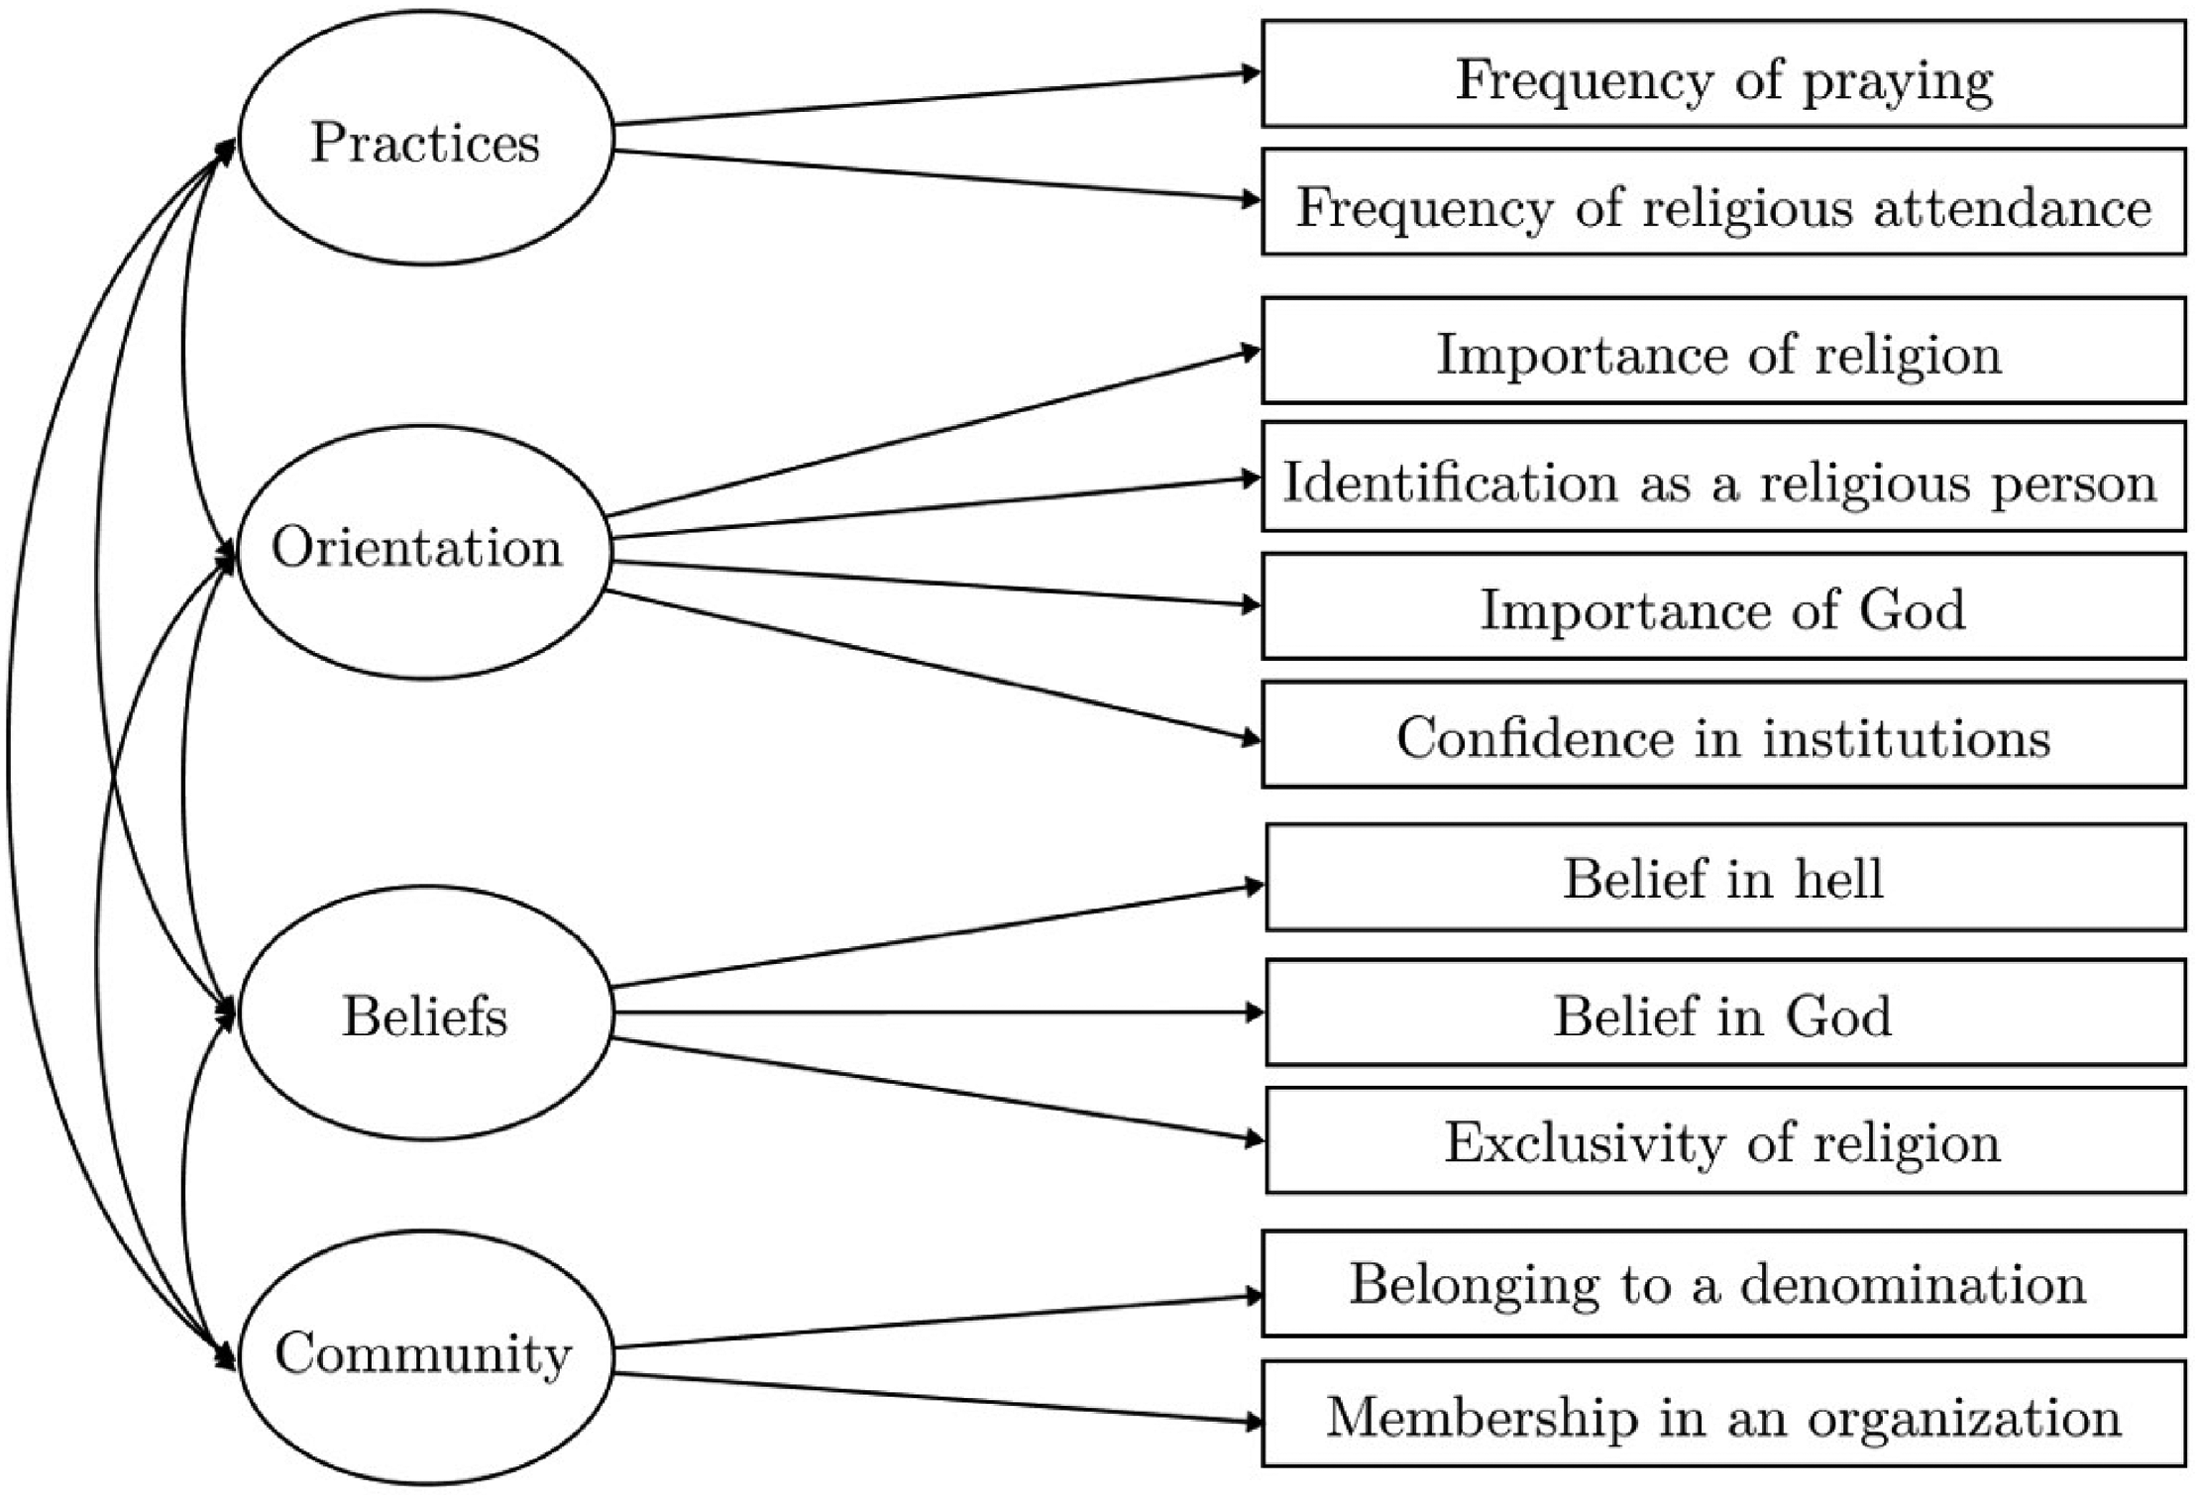
Theoretical measurement model of religiosity with WVS indicators.
Cross-National Invariance of Measurement Scales
Measurement invariance (or measurement equivalence) implies that the same concept is measured similarly in all groups (Davidov et al. 2014). In other words, MI means that individuals with the same level of the construct being assessed respond similarly to the indicator questions used to measure it. If MI is not given, data may not be comparable. The observed differences between groups might represent not only true differences but also variations in response patterns. They may be a function of either individual characteristics or may be explained by contextual variations across countries related to culture, religion, language, or methodological factors such as the mode of data collection.
The sources of noninvariance bias are usually organized into three main categories: construct, method, and item (Van de Vijver 1998). Construct noninvariance implies that the theoretical construct does not have the same meaning across respondents. Consequently, the content of the instrument used to measure it is perceived differently in different groups. Method bias is related to the incomparability of sampling procedures, response styles of respondents, or issues associated with survey administration or data collection modes. Item noninvariance results from bias occurring at the level of indicators, for example, when respondents dissimilarly react to or understand a particular question from an instrument, which measures the construct.
MI is typically assessed by testing a sequence of confirmatory factor analysis models with certain measurement parameters increasingly constrained to be equal across groups (Vandenberg and Lance 2000). Configural invariance implies that the pattern of factor(s) and factor loadings is similar and indicates that the latent variable has the same meaning across groups. If it is supported, one can compare the directions of correlations involving the construct. Metric invariance additionally requires the equality of factor loadings and means that the latent variable is measured on a scale with the same units. It allows the comparison of factor covariances or unstandardized regression coefficients (Steenkamp and Baumgartner 1998). Scalar invariance guarantees that both factor loadings and intercepts of items are the same. It ensures a similar origin of the scale across groups and the comparability of factor means. If the indicators are measured with fewer than five categories, it has been recommended to constrain thresholds rather than intercepts to examine scalar invariance (Flora and Curran 2004; Millsap and Yun-Tein 2004; Muthén and Asparouhov 2002; Wu and Estabrook 2016).
There are a variety of statistical approaches for evaluating the MI of latent variables (Millsap 2011). MGCFA is one of the most commonly used methods (Davidov et al. 2014). However, it has been criticized as being too strict because it requires the exact equality of parameters, which is almost never the case when analyzing survey data (e.g., Marsh et al. 2018; Muthén and Asparouhov 2013; Zercher et al. 2015). When samples are large and include diverse social, cultural, and religious groups, as is the case in the WVS, small and substantively irrelevant measurement differences may often lead to the undesired conclusion that MI cannot be established.
An alternative to MGCFA is the alignment approach, which has been recently introduced (Asparouhov and Muthén 2014). It replaces exact equality constraints across groups with the requirement that the measures are only approximately similar. In the beginning, the best-fitting configural model is estimated with factor means fixed at zero and variances fixed at one in all groups. The further optimization procedure using a simplicity function frees them and computes their most optimal values in a way that minimizes the total amount of noninvariance in a model. Alignment allows a few large noninvariant parameters and many approximately invariant parameters. This is particularly advantageous with multiple differentiated countries in the analysis because small and potentially noncrucial dissimilarities in measurement parameters are preprogrammed. After all, the goal is to identify a model that is sufficiently invariant to draw meaningful conclusions about similarities and differences across groups rather than to establish a measurement where all parameters are necessarily exactly the same. Once estimating a model, the alignment procedure also detects those groups deviating from the common measurement pattern and provides information on the level of invariance for every item parameter and in each group.
There are several other approaches to the tests of measurement invariance, such as Bayesian approximate invariance (Muthén and Asparouhov 2013) or Procrustes rotation (see Fischer and Karl 2019). However, we opted for the alignment because it is based on a well-established MGCFA framework, allows for approximate invariance, provides very detailed information on the location of the noninvariance, reports several invariance indices, and is computationally feasible.
Challenges for Comparability of Religiosity in Multinational Research
While measures of religiosity are used in many international surveys, most researchers agree that the meaning of the construct is, to a certain extent, culture-specific rather than universal (Finke and Bader 2017; Fitzgerald 2000; Hill and Pargament 2003). This implies that a measurement instrument that could be validly applied in diverse societal contexts is difficult to develop. There are different expressions of religiosity, and their understanding varies across countries.
First, religions reflect diverse philosophical viewpoints and do not attribute the same importance to various elements. For example, Christianity and Islam are monotheistic religions focused on following God's requirements, performing strictly defined rituals, often within a communal context, and adhering to specific beliefs (Abu-Raiya 2013; Beck and Haugen 2013). Religiosity in Buddhism and Hinduism, in contrast, is not strongly theistic and can emphasize adherence to moral rules and individual courses of action rather than following the rigid set of religious requirements of worship, public conduct, and beliefs (Kristeller and Rapgay 2013; Tarakeshwar 2013). As a result, Buddhists and Hinduists can be considered less religious by Christian or Muslim standards.
Beyond the dissimilarities between religions, religiosity also widely differs due to the local cultural, social, or political characteristics of countries (Hill and Pargament 2003; Loewenthal 2013; Saroglou and Cohen 2013; Tarakeshwar, Stanton, and Pargament 2003). All these substantive differences shape individuals’ understanding of religiosity, thus affecting the meaning of the construct and jeopardizing its MI. As a result, indicators measuring individual religiosity might not “travel” successfully across countries in cross-national surveys, especially those with heterogeneous samples such as the WVS.
The problem of designing and identifying valid measurements of religiosity from a comparative perspective is highly debatable. In recent studies, the measures have focused on formalized versions of the religiosity of individuals affiliated with Protestantism or Catholicism in Western geographies (Hill 2005; Hill and Pargament 2003; Norris and Inglehart 2004). As a result, they might not capture religious expressions in non-Western cultures invariantly. Thus, the understanding of indicators, which are usually assumed to be relevant for many religions, such as questions on worship, beliefs, communal life, or self-perception as religious, was noted to vary across cultural contexts (e.g., Bechert 2018; Meuleman and Billiet 2011; Siegers 2011; Smith 2017).
To overcome the West-centered approach, a few scales have been adopted or developed to measure religiosity among Muslims (for an overview see Abu-Raiya and Pargament 2011 or Abu-Raiya and Hill 2014; see also El-Menouar 2014; Hassan 2007; Huber and Huber 2012; Saroglou et al. 2020) or followers of some non-Abrahamic religions (e.g., Huber and Huber 2012; Jayakumar and Verma 2020; Saroglou et al. 2020; Tarakeshwar, Pargament, and Mahoney 2003). These instruments share similar dimensions to those mentioned above, which were developed and approbated on Christian samples. Therefore, we suggest that religiosity can be discussed in terms of our four dimensions not only within Christianity but also across different religions and cultures.
While both theoretical considerations and previous empirical studies suggest that religiosity measures may not be strictly invariant across all WVS countries, only a few previous studies systematically explored the degree of MI of indicators, which are used in cross-national surveys, in a large sample of culturally diverse countries, such as those covered in the WVS. It could well be the case that some indicators are more invariant, thereby allowing valid comparisons in a broader context. Moreover, several countries could share an understanding of religiosity depending on their denominational structure, cultural heritage, or other characteristics. In the following sections, we investigate whether the measures of religiosity included in the WVS are approximately invariant and try to identify groups of indicators and countries demonstrating a high degree of MI.
Data and Methods
Data
We employed data from 60 countries that participated in the 6th wave of the WVS 2010–2014 (Inglehart et al. 2014). The sample for each country is nationally representative of all populations aged 18 and older. The main method of data collection was face-to-face interviews with a common questionnaire for all countries. It was translated into all languages, which serve as the first language for at least 15% of the population. The omission of no more than 12 questions in a country was allowed.
The samples varied between 841 observations in New Zealand and 4,078 in India. The sample size and religious composition by country can be found in Table 1 in the Supplementary Materials. The R codes that reproduce the analyses are provided online at https://osf.io/ru4sh. The data are available on the WVS website: www.worldvaluessurvey.org.
Measures
There are 19 items related to religion that are included in the 6th WVS wave questionnaire. The theoretical structure of religiosity with the six dimensions described above was not sufficiently covered by the WVS indicators. For this reason, we reduced it to the four factors measured by 11 items. Figure 1 schematically represents the measurement model:
Religious practices were measured by questions inquiring about collective and individual practices: frequency of attendance of religious services and frequency of praying. The beliefs dimension was covered by three items about personal beliefs: belief in God, in hell, and in the exclusivity of religion. The orientation dimension was represented by indicators about the importance of religion, identification as a religious person, importance of God, and level of confidence in churches or religious leaders. Finally, two items measured the community factor: membership in a church or religious organization and affiliation with a certain denomination. Table 2 in the Supplementary Materials provides the formulation and response categories of each indicator.
For ease of interpretation, the coding of all original variables except membership in an organization and importance of God was reversed so that higher values corresponded to a higher level of religiosity. The belonging to a denomination indicator was recoded from 64 categories into a binary variable, which reported whether one was (2) or was not (1) affiliated with a denomination. Likewise, in the identification as a religious person item, two response categories, nonreligious and atheist, were collapsed into a single category, contrasting religious (2) and not religious (1).
Analytical Strategy
The analysis included four stages. First, we examined the descriptive statistics of 11 indicators across countries, inspecting the presence of items with high shares of missing values or highly skewed distributions in certain countries that might challenge MI. We also analyzed polychoric intercorrelations at the individual level across countries, which were used in further confirmatory factor analysis (CFA), as most indicators were ordinal (Jöreskog 2005). Next, we reconsidered our measurement if necessary.
Second, in line with Byrne’s (2010) recommendation, we performed separate CFA for each country to examine whether the same items may measure religiosity. Three global fit indices were used to assess the model fit: the comparative fit index (CFI) and the two close fit measures, the root mean square error of approximation (RMSEA) and the standardized root mean square residual (SRMR). CFI values larger than 0.90 and RMSEA and SRMR values smaller than 0.08 were indicative of an acceptable fit (Browne and Cudeck 1992; Hu and Bentler 1999; Marsh, Hau, and Wen 2004). We also examined whether the standardized factor loadings were larger than 0.3 (Brown 2015). Due to the measurement level of indicators, eight of them were considered ordered categorical, and the other three (frequency of religious attendance, frequency of praying, and importance of God)—continuous. We applied the means and variance adjusted weighted least squares (WLSMV) estimator, as suggested for the analysis of categorical variables (Flora and Curran 2004). The WLSMV estimator was also applied for the estimation and further evaluation of invariance of thresholds rather than intercepts for these indicators (Muthén and Asparouhov 2002). For identification purposes, the factor loadings of marker variables were fixed to 1 (Johnson, Meade, and DuVernet 2009), and intercepts of polytomous items were fixed to 0 and scaling factors to 1 (see Wu and Estabrook 2016, for an overview).
Third, multiple group confirmatory factor analysis (MGCFA) was performed to assess the exact similarity of measurement parameters across countries. We began with the examination of configural invariance. No constraints were placed on parameters except those needed for the model identification. For the polytomous indicators, two thresholds were additionally fixed to be equal across groups. Then, we tested for scalar invariance, constraining to equality the factor loadings, thresholds of categorical indicators, and intercepts of continuous indicators, as it is recommended to constrain all these parameters in a single step when ordinal categorical variables are included in the analysis (Muthén and Asparouhov 2002). We evaluated models with an absolute fit and assessed MI with the cutoff criteria for the change in the fit of the models assuming MI. A deterioration in the CFI when moving from configural to scalar invariance larger than 0.008 and in the RMSEA larger than 0.06 indicated the absence of scalar invariance (the sum of the cutoff values for the metric compared to the configural model and for the scalar compared to the metric model; see Rutkowski and Svetina 2017). The chi-square difference test was not used to evaluate the model fit because it is oversensitive to minor violations of MI, especially for categorical measurements and large samples. All analyses were carried out using the software R with the lavaan package (Rosseel 2012).
Fourth, we assessed approximate invariance and performed the alignment procedure (Asparouhov and Muthén 2014). We began with the estimation of a configural model with free factor loadings, intercepts, and thresholds, factor means fixed to 0, and factor variances fixed to 1. Then, by minimizing a simplicity function, the procedure estimated factor means in a way that the noninvariance of measurement parameters was kept to a minimum. The optimization process was performed using the free approach when no latent means were constrained to zero (in contrast to the fixed alignment, which required the mean to be zero in one country). We accounted for the nonnormality of indicators and used a robust maximum likelihood estimator. 1
Alignment provides detailed invariance information for each model parameter and in each country. We focused on two indices to evaluate the degree of (non)invariance of parameters—the R2 and the fit function contribution. R2, which ranges between 0 and 1, indicates the degree of invariance by reporting the proportion of variance of a parameter that was explained by the variation in the factor means and variances across countries (Muthén and Asparouhov 2018). Lower R2 values indicate lower invariance, with values below 0.90 suggesting noninvariance (Flake and McCoach 2018). The fit function contribution, in turn, highlights potential noninvariant indicators: The higher the value of the fit function is, the more likely the parameter is noninvariant. We also examined groups where indicators could not be considered invariant, such as in countries where a parameter differed significantly from its average value in invariant countries. Previous work recommended to keep the number of noninvariant parameters below 25% (Muthén and Asparouhov 2014). We performed a Monte Carlo simulation study to determine whether the factor means and measurement parameters could be reliably recovered with alignment. The final estimates of aligned models were used as starting values for the data generation process. Correlation values of 0.98 or higher between the generated and estimated latent means would imply that the alignment results are trustworthy. Mplus software (Muthén and Muthén 1998–2019) was employed for the alignment analyses. Missing cases were excluded listwise for all methods—correlation analyses, CFA, MGCFA, and alignment optimization.
Results
Descriptive Analysis
Tables 3 to 12 in the Supplementary Materials display the frequencies and means and standard deviations of 11 indicators of religiosity per country, and Table 14 displays the cross-country means and standard deviations of correlations of items. We detected some variables containing more than 10% missing values and having a highly skewed distribution in many countries, with 90% and a higher share of responses concentrated in a particular category (or categories). 2 Moreover, while there was a significant positive association between most indicators with the highest value of 0.67, some correlations were lower than 0.30, as low as 0.10 or negative. In addition, several countries did not include all 11 questions and thus did not cover all four religiosity dimensions (see Table 13 in the Supplementary Materials). On the basis of this overview of the patterns of distributions and associations of items, we concluded that the following five indicators were the most problematic and not adequate for the measurement of religiosity across a large set of WVS countries: belief in God, belief in hell, belonging to a denomination, membership in an organization, and exclusivity of religion. They had missing values, skewed distributions, and correlations with other items outside of a plausible range to belong to the same construct in more cases compared to other variables. To be able to reach a model that can be supported by the data in as many countries as possible, we began the analysis with the measurement without these five items. As a result, our four-factor model was reduced to only two dimensions, practices and orientation, and did not cover the communal identification and beliefs of respondents. Figure 2 presents the revised instrument with two dimensions. The frequency of praying and the importance of religion items were selected as marker variables of their corresponding factors, as they were expected to be more invariant than other indicators. Countries with omitted questions, empty response options, or negative correlations of items were excluded from the analysis of the two-factor model, resulting in a selection of 43 countries.

Theoretical measurement model of religiosity with WVS indicators: revised. The dotted line indicates the reference indicator of a factor.
Measurement Invariance
CFA
We began by running the two-factor model with six indicators within each of 43 countries. This factor solution resulted in a good fit to the data in 28 countries (see Table 15 in the Supplementary Materials for the fit measures by country). Modification indices suggested adding cross-loadings and error correlations in 11 countries with all factor loadings higher than 0.30 to achieve an acceptable fit of the model to the data. To avoid overcomplicating the model with cross-loadings and residual covariances across different factors, we merged the orientation and practices dimensions into a single factor. Indeed, a unidimensional strategy could be justified as an alternative theoretical approach when the measurement of religiosity is applied to heterogeneous samples (Schwartz and Huismans 1995). This one-factor solution had an acceptable fit in 30, mainly Christian countries. Thus, it was not possible to estimate a model that worked across all 43 WVS nations. As the main criterion guiding our analytical strategy was to balance the better model fit, higher number of countries, and, at the same time, broader content coverage of religiosity (more indicators), we tried to find sets of countries where a measurement operated well. The strategy was as follows. In addition to our two factor solutions that were previously estimated, we specified three models that included the same six initial items as well as other three indicators (i.e., belonging to a denomination, belief in God, and membership in an organization). The next three models had the same items but excluded importance of God indicator due to its low correlation with other variables in several countries. The residuals of religious practices indicators were allowed to covary. In addition, the residual covariance of importance of God and frequency of praying was released in the first three models. These six models were fit within each country, and then we excluded the countries that showed an unacceptable model fit. As a result of this exploratory strategy, we detected four overlapping groups of countries ranging in size between 20 and 30, in which the corresponding models demonstrated an acceptable fit (see Figure 3 for indicators and Tables 16–20 in the Supplementary Materials for the country- and model-specific fit indices and the list of countries where each factor solution fit sufficiently well). Some countries (e.g., Brazil) were included in more than one group. Further analysis applied these models in combination with their specific sets of countries. The other four models that we estimated were not further evaluated because they worked across relatively smaller samples. A more detailed description of the selection of the four final models can be found under the Model selection strategy in the CFA section of the Supplementary Materials.
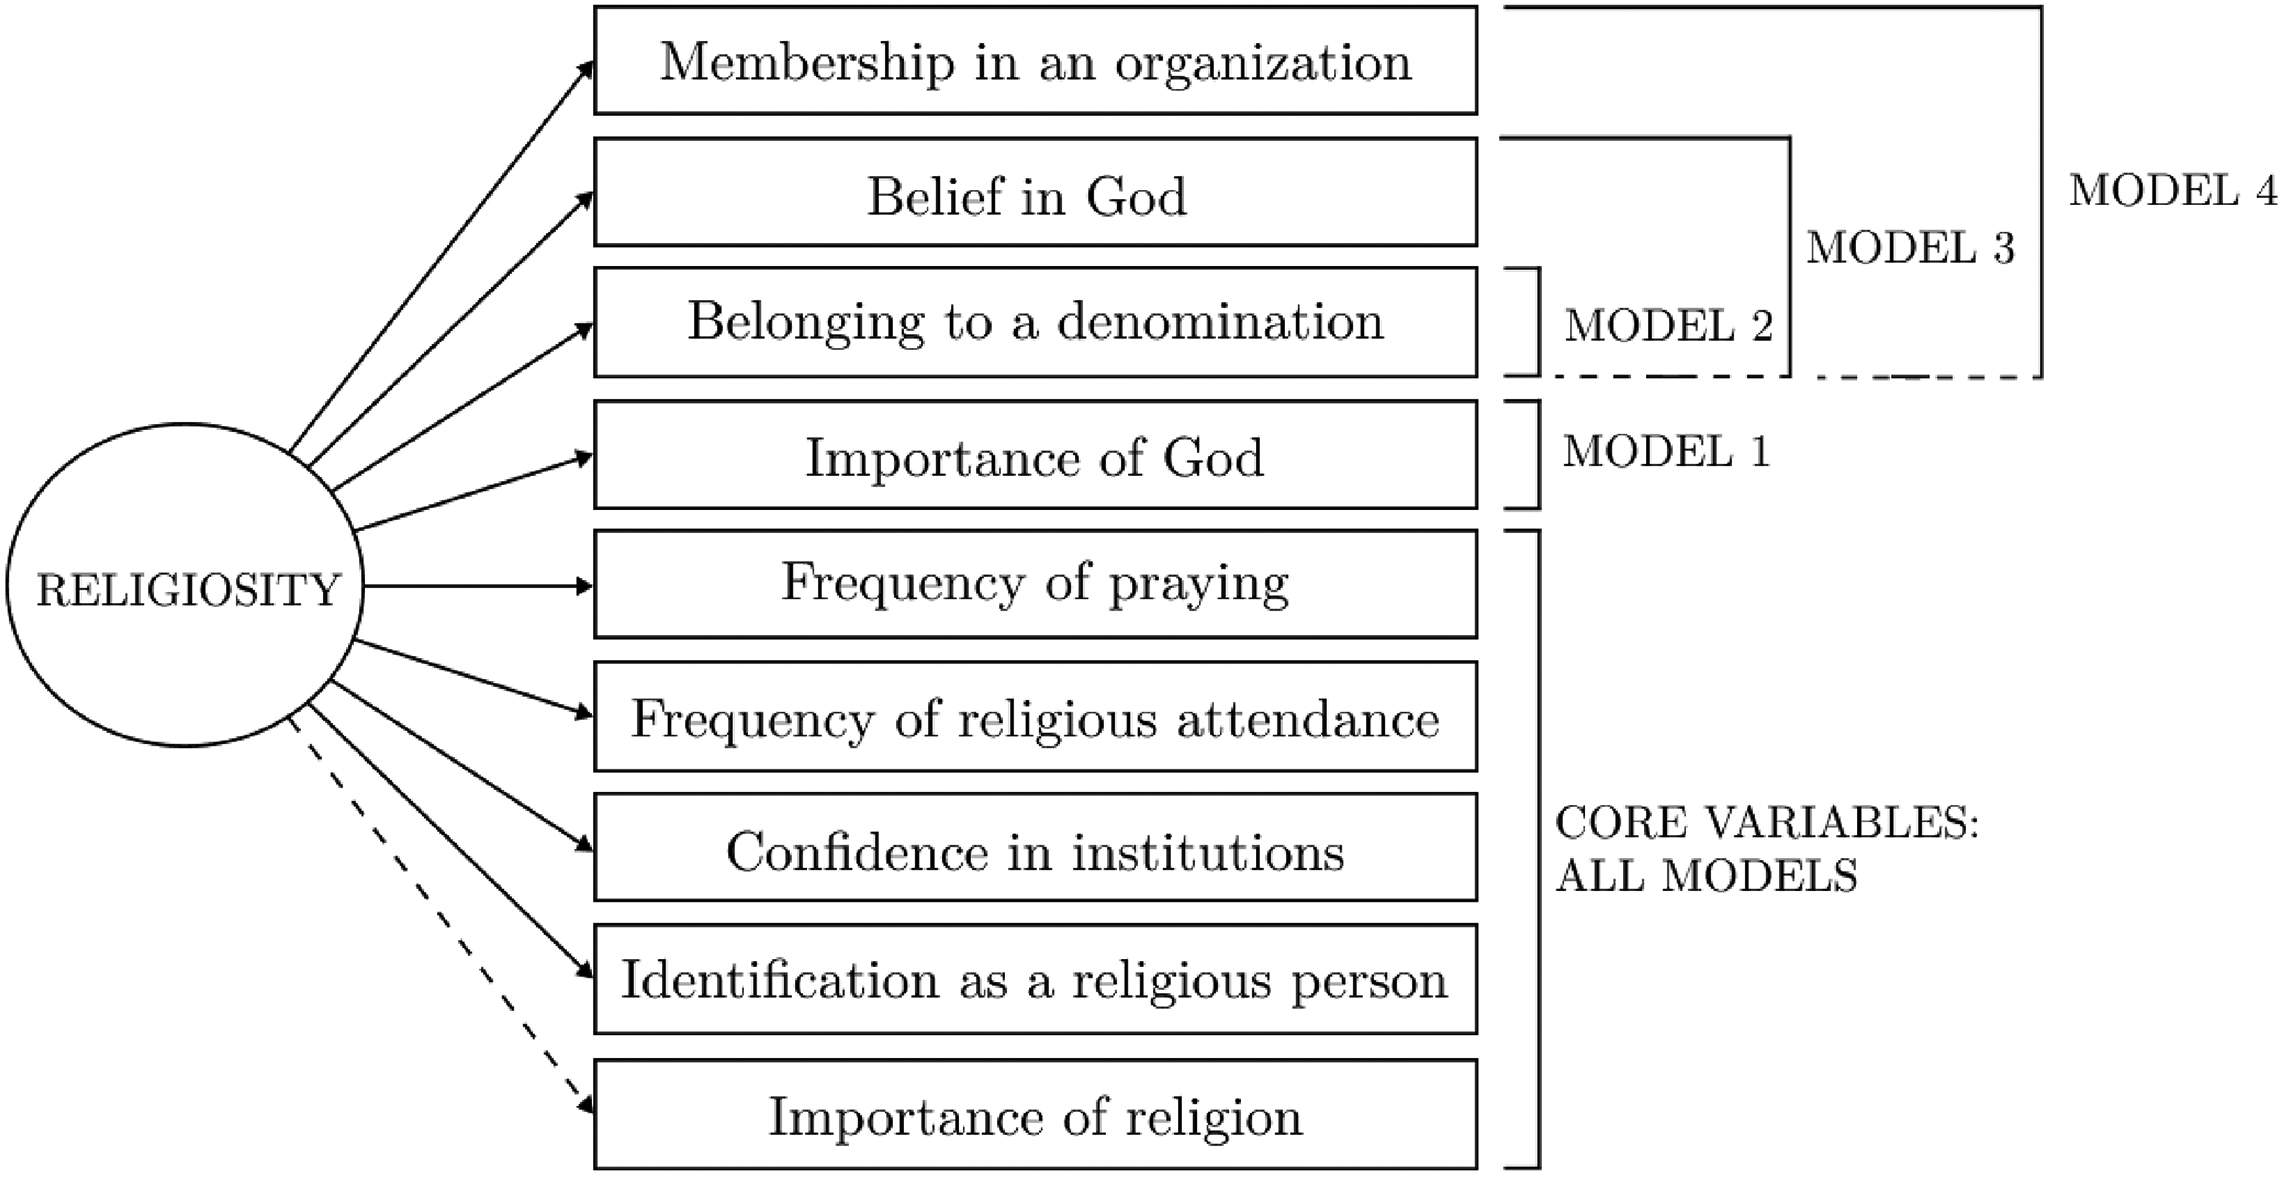
Measurement structure of four final models of religiosity. The residual of the frequency of praying item was allowed to covary with the residuals of the frequency of religious attendance and importance of God items. The dotted line indicates the reference indicator of a factor.
MGCFA
Table 1 provides the results of MGCFA invariance tests for the four models on their corresponding samples. On the basis of fit indices, we concluded that all configural models were supported by the data. However, the strong invariance assumption could not be met—the global fit of the scalar models was poor in accordance with almost all fit criteria. 3
Fit Measures for Configural and Scalar Models.
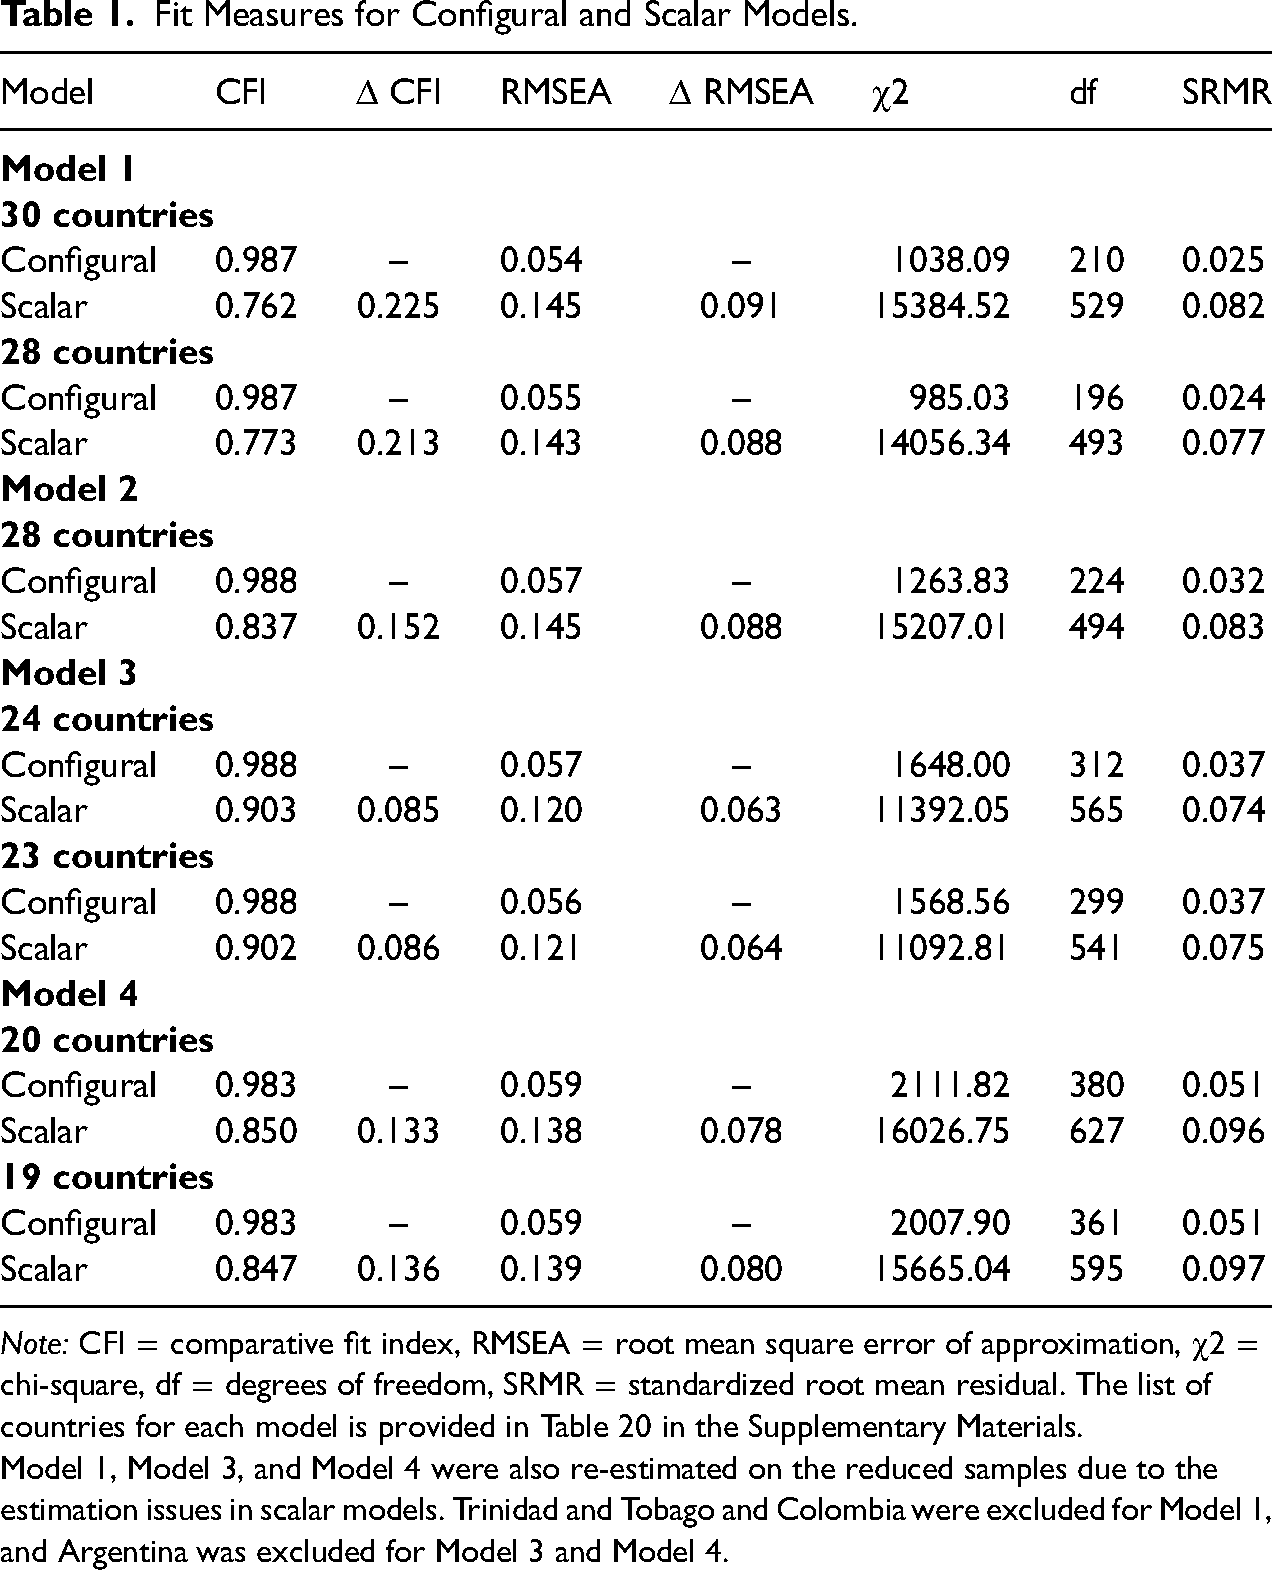
Note: CFI = comparative fit index, RMSEA = root mean square error of approximation, χ2 = chi-square, df = degrees of freedom, SRMR = standardized root mean residual. The list of countries for each model is provided in Table 20 in the Supplementary Materials.
Model 1, Model 3, and Model 4 were also re-estimated on the reduced samples due to the estimation issues in scalar models. Trinidad and Tobago and Colombia were excluded for Model 1, and Argentina was excluded for Model 3 and Model 4.
We also tested MI for each pair of countries to find groups where it holds. It turned out that the full MI could be achieved only for pairs or triads of predominantly Christian countries, ranging from three pairs for Model 2 and Model 4, for example, New Zealand and Australia, to six groups for Model 1. We next performed alignment analysis for each of the four models.
Alignment optimization procedure
The alignment optimization was carried out on the same set of countries that was used for each of the four models when performing the exact MI. First, we ran a preliminary “free-mode” alignment analysis, which helped identify an optimal reference country. Next, we adopted the fixed alignment approach by constraining the mean to zero in the reference country.
The overall share of noninvariant countries ranged from 42% to 47% across models and therefore was considerably above the threshold of 25% (Muthén and Asparouhov 2014). To examine whether the aligned estimates were reliable for substantive interpretations and comparative analyses of factor means despite the high number of noninvariant parameters, we conducted Monte Carlo simulations. We specified 500 replications for each simulation for all models with four sample sizes per group, 100, 500, 1,000, and 1,500 observations. The results showed that the correlations of the true and estimated means were too low for the smallest sample (ranging between −0.093 and 0.934) but increased for samples 500 and higher (ranging between 0.571 and 0.998), which were more similar to the actual WVS country samples. Nevertheless, only the correlations produced for Model 1 and Model 4 were sufficiently high (ranging between 0.980 and 0.998). Next, we inspected the simulation outputs and detected a few countries with the least accurately estimated parameters for Model 2 and Model 3. We excluded Ghana and Turkey from the sample for Model 2 and Trinidad and Tobago for Model 3 and reran the alignment and corresponding simulations on the reduced samples. The results of the simulations showing correlations between the estimated and replicated factor means are provided in Table 2. The simulations demonstrated that excluding these countries allowed us to reach satisfactory correlations (on samples of 500 or higher) for these two models, suggesting that the means of religiosity as well as parameter estimates produced with the alignment were reliable. Figure 4 presents the final samples of the four models. The shapes represent the groups of countries that demonstrated approximate invariance for the specific model. Some countries are part of more than one group, which means that they showed invariance across different groups and the corresponding models. For instance, religiosity in Brazil could be compared to that in Chile using Model 4 and to that in Japan using Model 2.

The groups of countries for which the measurement invariance of the corresponding models was found. For the models’ structures, see Figure 3.
Averaged Correlations of Estimated and Replicated Factor Means in Monte Carlo Simulations.

To compare the invariance of different items, we examined the detailed results of the alignment (see Tables 24 to 26 in the Supplementary Materials for the results for each item's parameter). There were very few completely invariant parameters in any of the models. The R2 values ranged between 0 and 0.95 (e.g., the R2 of the loading of frequency of religious attendance in Models 2, 3, and 4 was 0, whereas the R2 of the second threshold for importance of religion in Models 1 and 2 was 0.95). The share of noninvariant countries (per parameter) was between 0% and 85%. For example, the loading of confidence in institutions in Models 2 and 3 was invariant across all countries, whereas the second threshold of membership in an organization in Model 4 was noninvariant in 85% of countries. To detect the most and the least invariant indicators, we used the R2 value of each item and the share of noninvariant countries averaged across all item parameters and the four models. For items with more than one threshold, we calculated the means R2 and the share of noninvariant countries for all thresholds and then the means R2 and the share for loading and averaged threshold value. The results are presented in Table 3.
Results of Alignment Optimization, Averaged by Indicator.
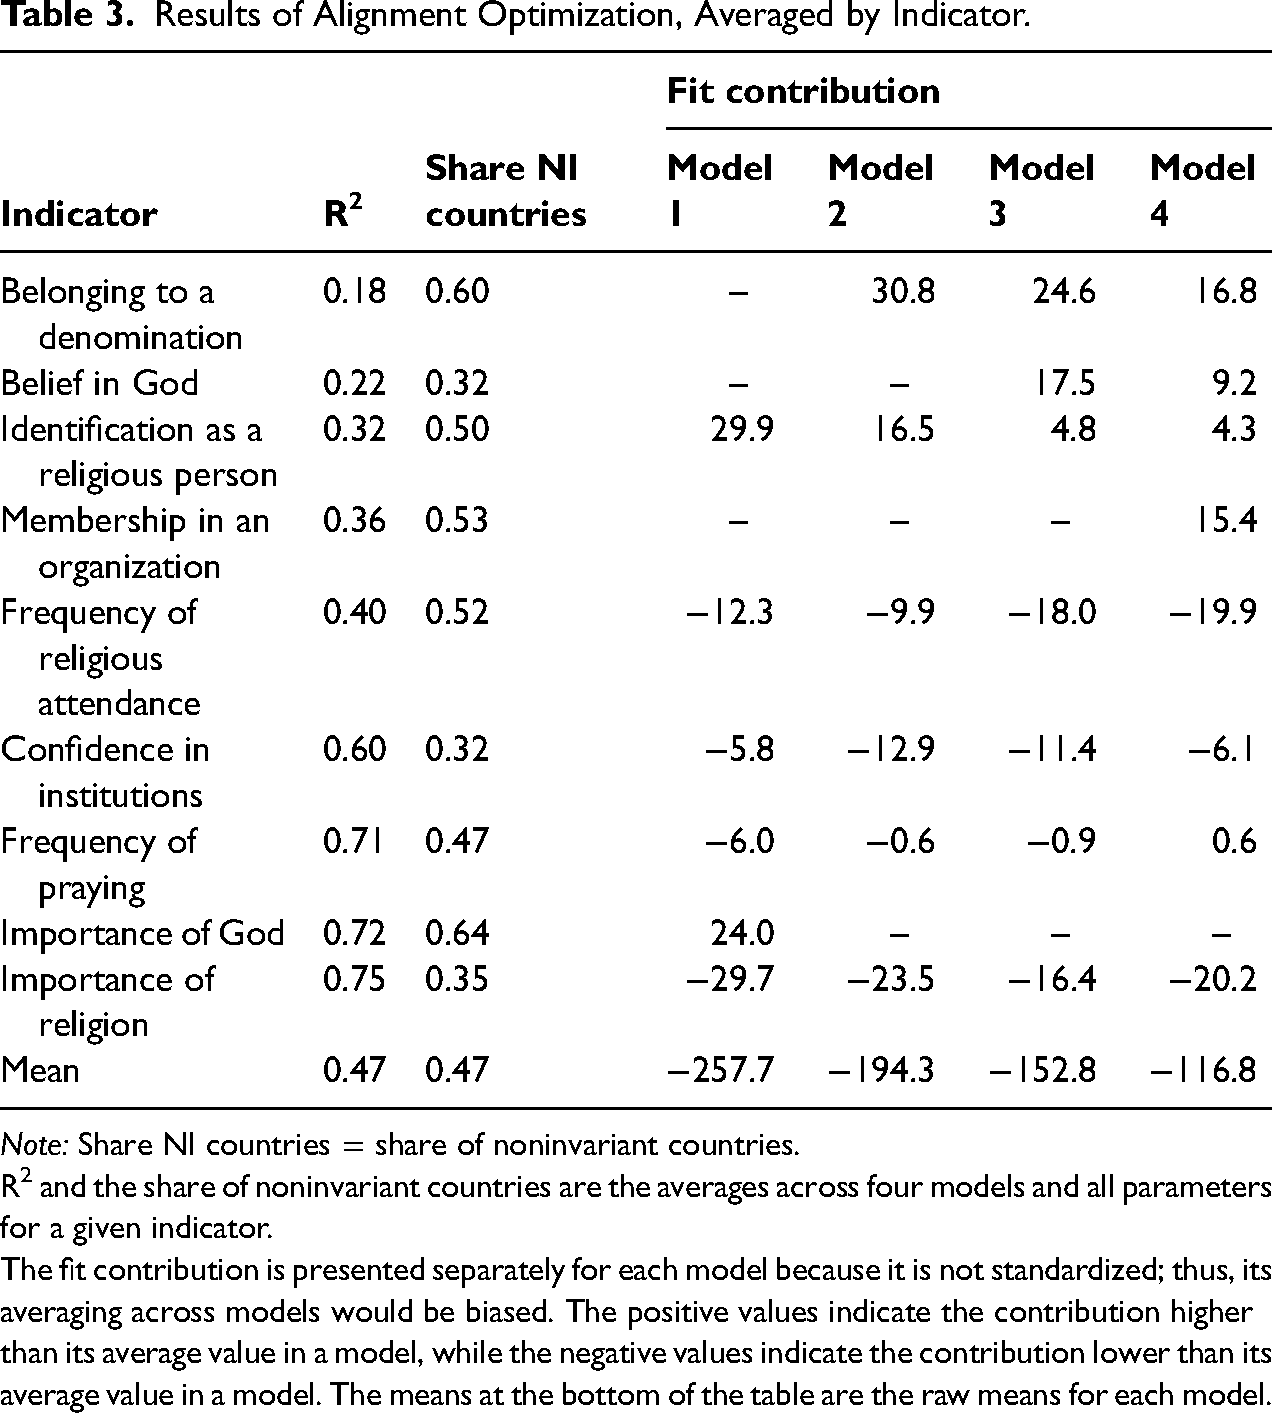
Note: Share NI countries = share of noninvariant countries.
R2 and the share of noninvariant countries are the averages across four models and all parameters for a given indicator.
The fit contribution is presented separately for each model because it is not standardized; thus, its averaging across models would be biased. The positive values indicate the contribution higher than its average value in a model, while the negative values indicate the contribution lower than its average value in a model. The means at the bottom of the table are the raw means for each model.
Virtually all R2 values were below the recommended 0.90, and all indicators showed noninvariance in more than the recommended 25% of countries. We specified a new threshold of 50% for invariant countries and an R2 value of 0.50 as an indicator of items with higher invariance. The higher invariance was also evidenced by the fit function contribution that was lower than its mean value in a model, as this index is model-specific.
On average, the highest R2 values (above 0.50) were observed for the importance of God, importance of religion, frequency of praying, and confidence in institutions across the models. The latter three items as well as belief in God were also invariant across more than 50% of countries. The importance of religion, confidence in institutions, and frequency of religious attendance indicators contributed to the total optimized simplicity function less than its average values in all four models. We concluded that frequency of praying, importance of religion, and confidence in institutions were the most invariant items, as suggested by at least two out of three fit indices, with importance of religion appearing to be the most promising item and presenting the highest average R2, the lowest fit function contribution, and almost the smallest share of noninvariant countries. Other variables had lower potential for equivalent assessment of religiosity.
From the findings of the alignment optimization it was also possible to derive in which groups certain items were rather invariant across the models. The pattern may be attributed to the cultural specifics of countries (Welzel 2013). For example, parameters of frequency of religious attendance item were invariant in more than 50% of Sub-Saharan African (e.g., South Africa) and Latin American (e.g., Chile) countries included in the sample, but were noninvariant in other populations (see Table 27 in the Supplementary Materials). The belief in God item was invariant mainly across Latin American and Christian Western countries including European (e.g., Poland) and New West (e.g., New Zealand) regions. The importance of God indicator was invariant only in Sub-Saharan African nations.
The means of the religiosity factor for each country and each model are provided in Figure 5. Countries at the top of Figure 5 have lower values of factor means and are less religious than countries at the bottom with higher means. The means in the United States in Model 1, Ukraine in Model 2, Germany in Model 3, and Spain in Model 4 were fixed to zero because these countries were specified as reference groups in the fixed alignment optimization. All correlations of factor means across the models were greater than 0.96 (N ranged from 15 countries to 23 countries).
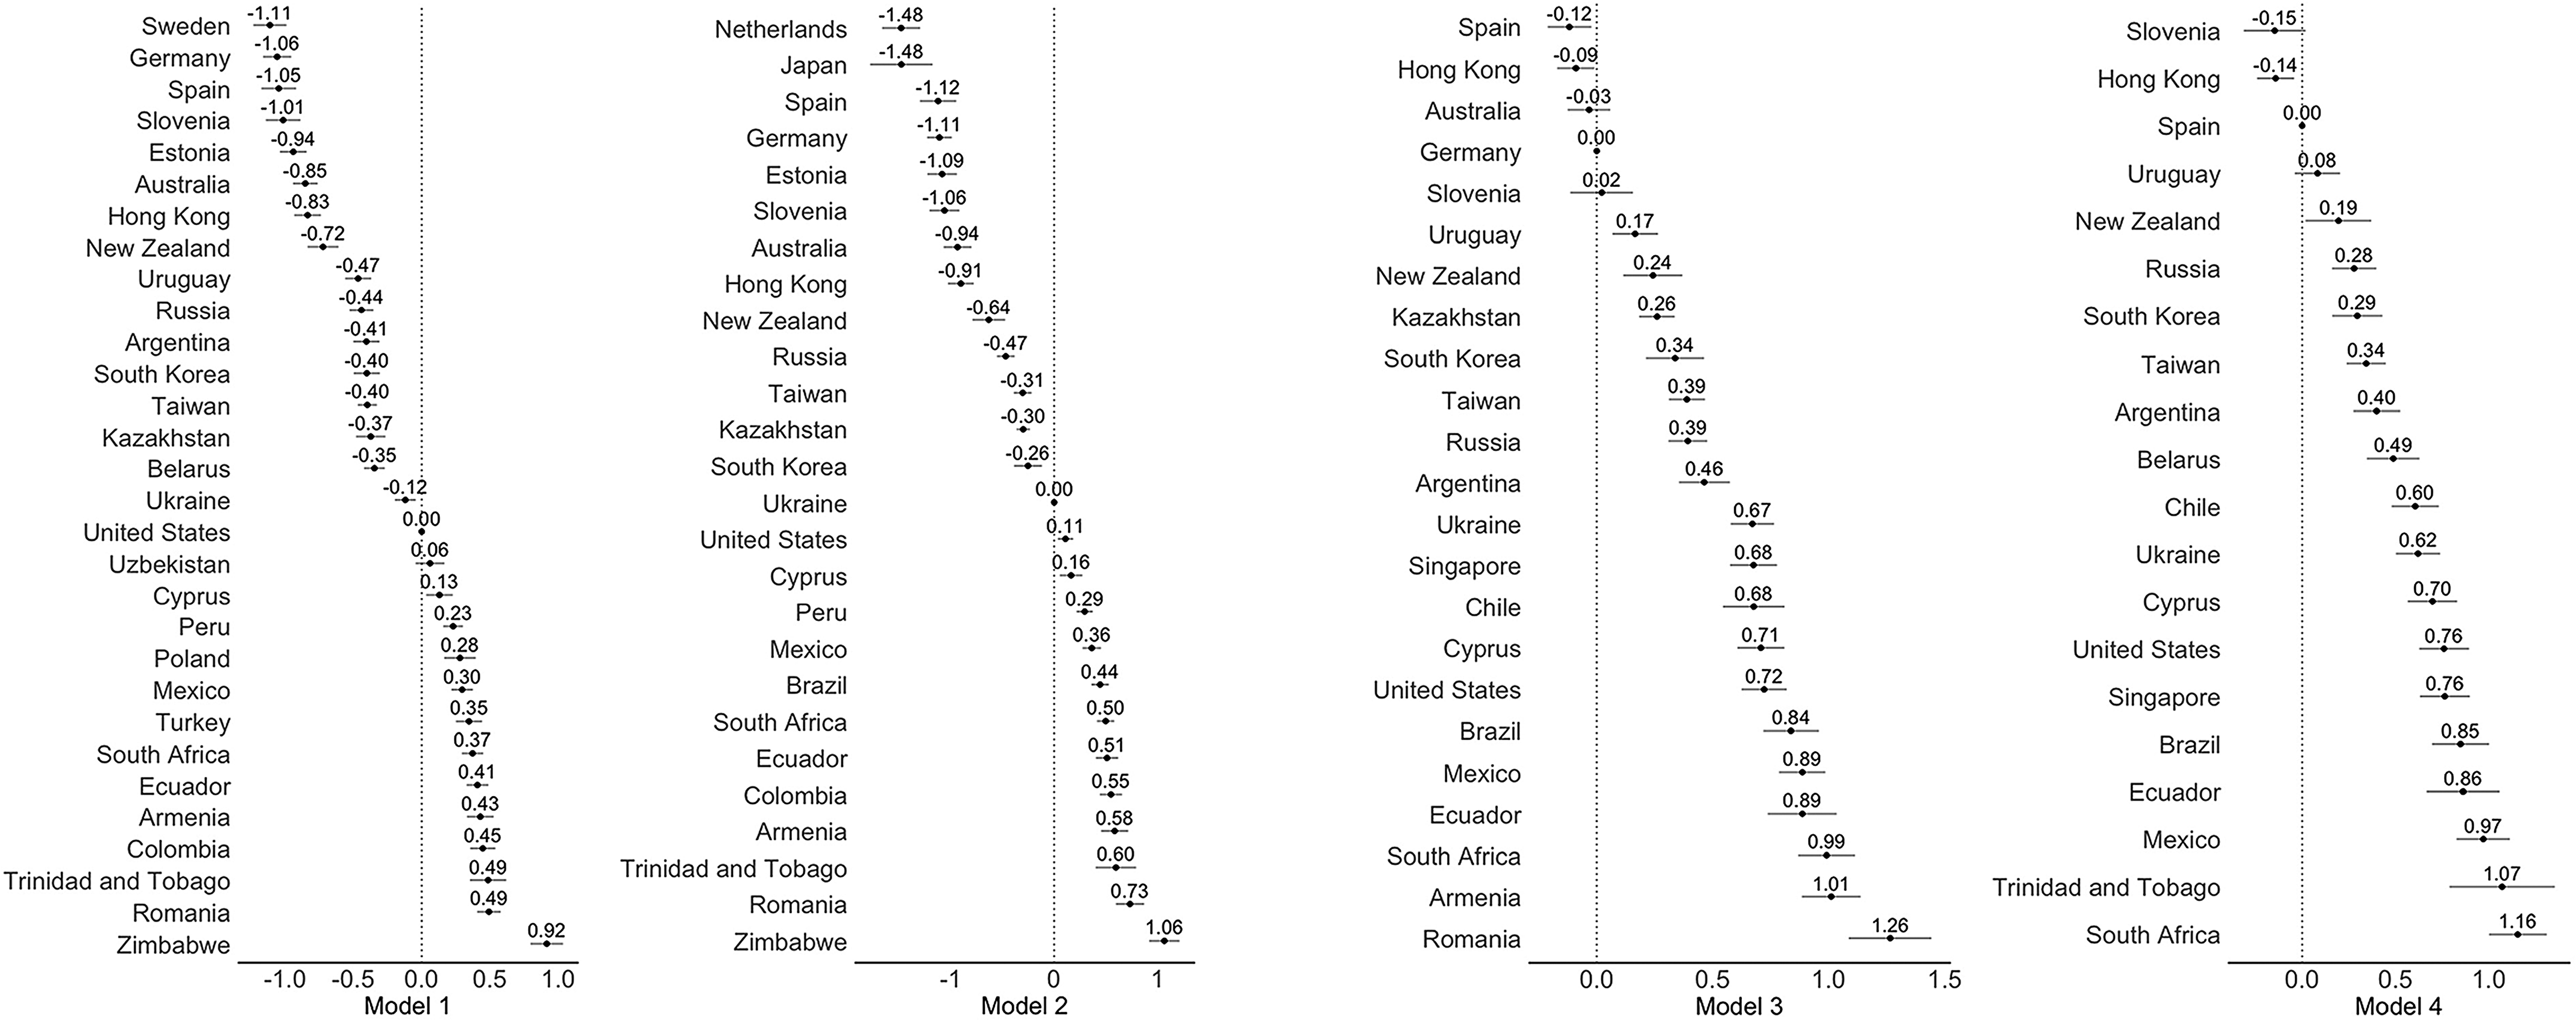
Latent means of religiosity across four models using alignment.
Robustness Analyses
As we used a mostly exploratory approach to arrive at the four models described above, there was a danger of overfitting, meaning that the factor solutions might not replicate for samples other than the 6th WVS wave. To assess the robustness of our models, we checked whether they worked in other data as well.
We used the joint dataset of the WVS and the European Values Study (EVS) 2017–2021 (EVS/WVS 2021), as it was the only data with the same indicators of religiosity. The released data partially covered the countries included in our main analysis. Model 1 was tested on the sample of 26 out of 30 countries in our main analysis, Model 2 was tested on the sample of 23 out of 28 countries, Model 3 was tested on the sample of 21 out of 24 countries, and Model 4 was tested on the sample of 17 out of 20 countries. Models 1 to 4 demonstrated an acceptable fit in 69%, 78%, 71%, and 59% of available countries, respectively. As found for WVS 6, the models displayed configural invariance on the full corresponding samples but not scalar invariance. The alignment procedure followed by a simulation study demonstrated that according to the criteria listed in the Methods section, the models were approximately invariant in their corresponding subsets of countries The correlation for aligned factor means between two survey waves was 0.92 (N countries = 18) in Model 1, 0.84 (N countries = 15) in Model 3, and 0.95 (N countries = 10) in Model 4. After excluding Slovenia, which had very different latent means in the two surveys, the correlation of means based on Model 2 reached 0.82 (N countries = 17).
Based on these robustness analyses, we conclude that our models were replicated with other data. A more detailed discussion of the robustness checks, the global fit measures of the EVS/WVS models by country, the results of configural and scalar invariance testing, and the correlations of estimated and replicated factor means in the Monte Carlo simulations are presented in the Robustness Analyses section in the Supplementary Materials.
Discussion
Cross-national differences in the level of religiosity and spirituality as well as in its associations with various variables of theoretical interest are well documented. However, few studies have investigated the comparability of the corresponding scores across countries. In the current research, we aimed to fill this gap and systematically examined the invariance of the measurement of generalized religiosity in the 6th wave of the WVS. The results demonstrated a different degree and patterns of invariance of religious measures across countries.
On the basis of the previous theoretical considerations, we constructed a four-factor model for the assessment of generalized religiosity with WVS items. It included religious practices, orientation, beliefs, and community. However, the model did not fit the data well in the full WVS sample. The differences between nations resulted in four different single-factor models of religiosity for the overlapping groups of countries.
Although exact invariance could only be established for a few pairs and triads of countries, the findings based on the alignment optimization procedure indicated that the measurement parameters were approximately invariant for all models and specific subsets of countries. As a consequence, the estimated means of religiosity may be compared with confidence across groups of populations that were included for each of the factor solutions. The models consisted of six to eight indicators from the set of nine items. The items importance of religion, confidence in institutions, and frequency of praying demonstrated invariance more consistently compared to the other variables. Consistent with our results, the importance of religion item was previously suggested to be the most universal and suitable indicator to measure religiosity across nations in this research (e.g., Norris and Inglehart 2004). The remaining six WVS items should be used cautiously in the separate analysis of the corresponding expressions of religiosity across countries.
In particular, our first model consists of six indicators (identification as religious person, importance of religion, confidence in institutions, frequency of praying, frequency of religious attendance, and importance of God) and can be applied to the largest sample compared to the other three models we propose. Thus, it can be employed for the analysis of religiosity across 30 countries, most Western, Orthodox East, Latin American, and Sinic East countries included in the WVS. However, our analyses demonstrated that this measurement model is invariant in only a few Sub-Saharan African and Islamic East societies and covers no Indic East region. The second model with six items (identification as religious person, importance of religion, confidence in institutions, frequency of praying, frequency of religious attendance, and belonging to a denomination) fits in 26 countries; the third model with seven items (identification as religious person, importance of religion, confidence in institutions, frequency of praying, frequency of religious attendance, belonging to a denomination, and belief in God) fits in 23 countries. Models 2 and 3 showed invariance across the same cultural zones as Model 1. At the same time, Model 2 cannot be used for the comparison of these groups of countries with Islamic and Indic East countries, while Model 3 cannot be used for their comparison only with Islamic East societies. Our fourth model with eight items (identification as religious person, importance of religion, confidence in institutions, frequency of praying, frequency of religious attendance, belonging to a denomination, belief in God, and membership in an organization) is invariant in 20 countries, including the majority of Latin American and Sinic East WVS countries. This final model covers most aspects of religiosity compared to the other three measurements.
The four religiosity models demonstrated their robustness on additional data examined in the robustness analyses. They were confirmed in most countries participating in the 6th wave of the WVS as well as in the 7th wave of the WVS or in the 5th wave of the EVS, and their factor means estimated by the alignment were strongly correlated with those of the WVS 6. Finally, based on the aligned means, the ten most religious countries were Zimbabwe, Romania, South Africa, Trinidad and Tobago, Singapore, Brazil, Armenia, Ecuador, Chile, and Mexico, and the ten least religious nations were Japan, the Netherlands, Sweden, Estonia, Germany, Australia, Spain, Slovenia, Hong Kong, and New Zealand.
The analysis illuminated that the denominational and cultural specificities of countries may matter when one decides how religious items could be applied cross-nationally. In line with these results, it seems that the concept of cultural zones (Welzel 2013) is particularly relevant for the comparative study of religiosity. While the same measurement cannot be employed across all countries, it is possible to come up with different sets of items to be used in different cultural groups. Thus, our elaborated models more or less stably reflect the conceptualization of religiosity in Christian and Sinic East WVS countries. However, this was not the case for almost all Islamic East, Indic East, and a few highly traditional societies independent of the cultural zone to which they belong. Moreover, the ways of being religious varied across Latin American, Western, Orthodox East, and some Sub-Saharan African countries, although these regions share Christian background. The hypothesized multidimensional structure of religiosity based on existing theories only weakly corresponded to the empirical evidence from non-Western countries and even to populations of the Western region. This finding stresses the generalization limitations of the Western theoretical model of religiosity. Although generalizability is often taken for granted, the Western interpretation of individuals’ religiosity is only a special case of how it is expressed. The four models we propose help to address this variability in the conceptualization of religiosity across countries. While it is often postulated to have distinct dimensions, our evidence supports the view that the measures corresponding to different components of religiosity are interrelated and can form a unidimensional scale that can be applied to data from populations that differ according to their religious affiliation (e.g., Schwartz and Huismans 1995; see also Saroglou 2011).
This study is not without limitations. First, it became clear that we are still lacking a universal measure of religiosity, particularly for non-Christian societies. While it was possible to identify specific models for specific sets of countries, they did not include the majority of Muslim and South and Southeast Asian countries. This implies that we do not know the level of religiosity of these populations and how it compares to religiosity in other nations. Future research should attempt to develop measures that are more comparable across diverse cultures.
Along with this, the cross-country comparability of religiosity can depend on the procedures for data collection, translation of indicators, or differences in response styles. We cannot rule out the possibility that method bias was responsible for the similarities or differences in measures across countries to a certain extent. At the same time, we found cultural patterns of the functioning of indicators and models that suggest the non-critical impact of the method factors on the comparability of measures.
Second, we considered WVS countries as homogenous units. However, they include diverse religious and social groups. This issue can be further addressed, and the comparability of religiosity could be examined not only across but also within countries.
Third, although our analyses suggested patterns of noninvariance, we did not focus on their systematic explanation. Indeed, methods such as multilevel structural equation modeling may allow the introduction of contextual country-level variables to explore, in a theoretically driven way, why certain measurement parameters are noninvariant (see, e.g., Davidov et al. 2012). Future studies may try to dig more deeply into such possible explanations and determine whether cultural, historical, or social particularities of countries may render certain items noncomparable.
Notwithstanding these limitations, the current study is, to the best of our knowledge, the first attempt to shed light on the cross-country comparability of religiosity measures across as large a heterogeneous sample as that included in the WVS. Our findings suggest that certain items are comparable across specific sets of countries, and the aligned estimates of the corresponding models may be used with confidence for meaningful cross-national research on religiosity for several groups of populations.
Supplemental Material
sj-docx-1-smr-10.1177_00491241221077239 - Supplemental material for In Search of a Comparable Measure of Generalized Individual Religiosity in the World Values Survey
Supplemental material, sj-docx-1-smr-10.1177_00491241221077239 for In Search of a Comparable Measure of Generalized Individual Religiosity in the World Values Survey by Alisa Remizova, Maksim Rudnev and Eldad Davidov in Sociological Methods & Research
Footnotes
Acknowledgments
The authors would like to thank Lisa Trierweiler for the English proof of the manuscript. Eldad Davidov would also like to thank the University of Zurich University Research Program “Social Networks” for their support during work on this paper.
Author’s Note
The R codes that reproduce the analyses are provided online at https://osf.io/ru4sh. The data are available on the WVS website:  .
.
Funding
The work of Maksim Rudnev is an output of a research project implemented as part of the Basic Research Program at the National Research University Higher School of Economics (HSE University).
Declaration of Conflicting Interests
The author(s) declared no potential conflicts of interest with respect to the research, authorship, and/or publication of this article.
Supplemental Material
Supplemental material for this article is available online.
Notes
Author Biographies
References
Supplementary Material
Please find the following supplemental material available below.
For Open Access articles published under a Creative Commons License, all supplemental material carries the same license as the article it is associated with.
For non-Open Access articles published, all supplemental material carries a non-exclusive license, and permission requests for re-use of supplemental material or any part of supplemental material shall be sent directly to the copyright owner as specified in the copyright notice associated with the article.
