
Abstract
Adaptive survey design refers to using targeted procedures to recruit different sampled cases. This technique strives to reduce bias and variance of survey estimates by trying to recruit a larger and more balanced set of respondents. However, it is not well understood how adaptive design can improve data and survey estimates beyond the well-established post-survey adjustment. This paper reports the results of an experiment that evaluated the additional effect of adaptive design to post-survey adjustments. The experiment was conducted in the Detroit Metro Area Communities Study in 2021. We evaluated the adaptive design in five outcomes: 1) response rates, 2) demographic composition of respondents, 3) bias and variance of key survey estimates, 4) changes in significant results of regression models, and 5) costs. The most significant benefit of the adaptive design was its ability to generate more efficient survey estimates with smaller variances and smaller design effects.
The general population is increasingly reluctant to respond to survey requests and costs of collecting survey data are continuously rising. An important challenge facing surveys is to develop methods that encourage participation under budget constraints. Responsive and/or adaptive survey design (RASD) is a recruitment method that operates with these goals (Chun, Heeringa, and Schouten 2018; Groves and Heeringa 2006; Tourangeau et al. 2017). This paper reports the results of an experiment that evaluated the effect of adaptive survey design on selected survey outcomes and estimates.
Generally speaking, RASD refers to changing and tailoring recruitment procedures and protocols for different sample cases (Tourangeau et al. 2017). One example strategy is differential incentives – higher incentives are assigned to sample cases that are more reluctant to respond (Brick and Tourangeau 2017; Jackson, McPhee, and Lavrakas 2020; Link and Burks 2013; Peytchev, Pratt, and Duprey 2020; Singer, Groves, and Corning 1999; Singer and Ye 2013). To identify reluctant cases, survey practitioners rely on auxiliary information known for the entire sample and the outcomes of previous surveys (Tourangeau et al. 2017). Some other strategies include offering different modes to different cases, following up with different contact efforts, assigning better interviewers to harder-to-recruit cases, and prioritizing the pursuit of some cases over others (Bergmann and Scherpenzeel 2020; Brick and Tourangeau 2017; Coffey, Reist, and Miller 2019; Luiten and Schouten 2013; Rosen et al. 2014; van Berkel, van der Doef, and Schouten 2020; Wagner et al. 2012; West, Chang, and Zmich 2021).
The practices of RASD are grounded in leverage-salience theory (Groves, Singer, and Corning 2000; Schouten, Peytchev, and Wagner 2017). This theory posits that people are heterogeneous in their interests in survey attributes. For any particular survey, some like the topic, some value the opportunity of sharing their opinions, and others are motivated by incentives. People are swayed to participate when the survey request is presented in a way that matches the particular interests of the person. Under this theoretical framework, a standardized and homogeneous recruitment protocol is not optimal. Instead, survey practitioners should take active steps to tailor and adapt recruitment procedures to cater to the interests of different sample cases. This is the crux of RASD.
RASD is also regarded as a budget-friendly technique to reduce survey biases during recruitment (Brick and Tourangeau 2017; Groves and Heeringa 2006). In an ideal world, nonresponse error may be minimized if expensive methods are used on the entire sample to maximize response rates 1 (Brick and Tourangeau 2017); but in practice this is often cost-prohibitive. Working with a budget, RASD aims to cost-effectively reduce biases by distributing more resources to where they are more needed. RASD recognizes that some cases are more valuable to survey estimates than others because they are more likely to be under-represented in the response data, and their under-representation risks introducing biases into survey estimates (Brick 2013; Luiten and Schouten 2013; Schouten et al. 2017).
Taken together, RASD is a recruitment method that aims to improve survey data and survey estimates. Successful implementations of RASD increase the response rate and balance response propensities across sample subgroups. The former may contribute to reducing variances and the latter to minimizing biases of survey estimates (Brick and Tourangeau 2017; Schouten et al. 2016).
These potential benefits of RASD on survey estimates, however, are not unique. They overlap with well-established post-survey adjustment methods (Kalton and Flores-Cervantes 2003). For example, adjustment methods like calibration can correct for biases by matching the distributions of adjustment variables of the response dataset to those of the target population (Kish 1995). Calibration also potentially reduces variances if the adjustment variables are highly correlated with the survey variables of interest (Little and Vartivarian 2005). The overlapping objectives of RASD and post-survey adjustment raise an important question (Beaumont, Bocci, and Haziza 2014; Brick and Tourangeau 2017; Särndal and Lundquist 2019; Tourangeau et al. 2017):
What is the added benefit of RASD above and beyond post-survey adjustment?
Additional Benefits of RASD Beyond Post-Survey Adjustment
In the current literature, evidence of the additional benefits of RASD mostly comes from theoretical and simulation studies (Särndal and Lundquist 2014, 2017, 2019; Schouten et al. 2016). These studies suggest that combining RASD and post-survey adjustment can lead to smaller biases and variances of survey estimates than post-survey adjustment alone (Särndal and Lundquist 2014, 2017, 2019).
In terms of variance, if RASD promotes sample representativeness during recruitment, it would diminish the reliance on weighting and reduce variation in the final survey weights, which in turn would lower estimated sampling variances. In terms of bias, RASD can supplement post-survey adjustment because the latter is limited for only addressing biases that are related to observable auxiliary variables 2 . In contrast, sample balancing during recruitment has the potential of correcting biases under the missing not at random (MNAR) situations (i.e., nonignorable nonresponse) (Brick and Tourangeau 2017; Särndal and Lundquist 2014, 2017, 2019).
To illustrate, suppose that men are less likely to participate than women if recruited with a standard protocol. Post-survey adjustment fixes the gender imbalance by assigning large weights to male respondents, but a likely side-effect is inflated sampling variances. Additionally, the small number of male respondents means that the data are less likely to capture a full range of variation in other unobserved characteristics related to men. This corresponds to an MNAR situation and is out of the scope of typical applications of post-survey adjustment. Implementing RASD during the recruitment may be useful for compensating both limitations. By proactively recruiting men with more intensive effort, RASD may increase the proportion of male respondents. With a more balanced dataset, the nonresponse adjustment weights are less extreme, reducing the risk of inflated variance. With a larger number of male respondents, the data may have a better chance of balancing the distributions of the unobserved features, reducing the risk of biases.
These theories and simulation studies have laid the foundation for the value of RASD. However, they mostly assumes that RASD has been efficiently designed and implemented, which may not always be true in practice. The auxiliary information available for RASD may be incomplete, resulting in recruitment effort being used on the “wrong” cases (Burger, Perryck, and Schouten 2017; Zhang 2022). Also, the strategies designed to motivate respondents may be ineffective and, therefore, not leading to any changes in the data composition (Lavrakas, Jackson, and McPhee 2018). Under these practical constraints, RASD may not be able to deliver its theoretical benefits. In fact, adding inadequate RASD into the data production may backfire and exacerbate biases, as shown by a simulation study (Zhang 2022).
The discussion of the additional benefits of RASD needs to be settled by empirical evidence based on real surveys (Chun et al. 2018). However, such evidence is scarce in the current literature because several key elements are needed to address this issue. First, the focus should be on whether RASD is useful in addition to post-survey adjustment, but to the best of our knowledge, research in real surveys has only investigated whether RASD is useful by itself, for good reasons. Systematic research on RASD has only started in the recent decades (Groves and Heeringa 2006; Wagner 2008), so naturally an initial step was to establish whether tailoring recruitment procedures could have the direct results as intended. But as the technique has matured, it has become important to incorporate RASD as a link in the production process and evaluate its performance against well-established post-survey adjustment methods (Brick and Tourangeau 2017; Särndal and Lundquist 2019; Tourangeau et al. 2017).
Second, an experimental design is needed to compare the results of combining RASD and post-survey adjustment with the results of post-survey adjustment alone. Unfortunately, this experimental design can be in conflict with the practical goal of achieving the best survey outcomes. Survey organizations often opt for implementing RASD on the full sample to improve the recruitment, rather than holding out a control group to be recruited by the theoretically less efficient standard protocols (Axinn, Link, and Groves 2011; Bergmann and Scherpenzeel 2020; Peytchev et al. 2020; Rosen et al. 2014; van Berkel et al. 2020). Without a control group, even though researchers may still be able to analytically tease out the effect of RASD on biases (Peytchev et al. 2020; van Berkel et al. 2020), it is no longer possible to study the effect of RASD together with post-survey adjustment.
Third, to assess the results of combining RASD and post-survey adjustment, the evaluation metrics need to focus on errors in survey estimates. However, much research has used response rates and sample representativeness (e.g., the R-indicator; Schouten, Cobben, and Bethlehem 2009) to evaluate the performance of RASD (Bergmann and Scherpenzeel 2020; Coffey et al. 2019; Jackson et al. 2020; Luiten and Schouten 2013; Lynn 2016; Wagner et al. 2012). While these survey-level indicators succinctly communicate the general quality of the response data, they fall short of capturing the quality of survey estimates, especially after post-survey adjustment 3 . To examine the combined effect of RASD and post-survey adjustment, the evaluation metrics should be the bias and variance of survey estimates.
The Current Research
Motivated by these gaps in the literature, we conducted an experiment where all key elements needed to evaluate the added benefits of adaptive design were assembled. The experiment enabled comparisons of survey outcomes and weighted survey estimates between the data collected with and without the adaptive design. Notably, our study context also differs from the previous application of RASD in two important respects.
First, the current adaptive design was implemented in a low-budget survey. This is an important difference from many other applications in large-scale well-funded surveys, which typically yield high response rates and leave limited room for improvement by RASD (Peytchev et al. 2020). For example, a 2016 subsample of the National Household Education Survey experimented with an adaptive design on incentives; its total sample contained 206,000 addresses, and the final response rate was about 64% (Jackson et al. 2020). The 2015 National Survey of College Graduates tested a dynamic adaptive design on modes and contact effort; it has a rotating panel design with 124,000 cases for any given round, and the final response rate was between 65–71% (Coffey et al. 2019). In contrast, lower-budget surveys work with smaller sample sizes and commonly have less than 30% response rates (Link and Burks 2013; Mercer et al. 2015). The literature has called for broadening the audience of RASD and researching its application on surveys with limited budgets.
Second, our operationalizations of RASD differ from many other strategies that are viable mostly in well-funded surveys. For example, because we were working with a short fielding period and a small staff, we were not able to dynamically adjust the recruitment protocols in response to the data composition in real-time (e.g., Axinn et al. 2011; Coffey et al. 2019; Murphy, Biemer, and Berry 2018; Wagner et al. 2012; West et al. 2021). Instead, we experimented with a set of strategies that were designed before the recruitment started. We combined the strategy of differential incentives with the strategy of tailoring invitation materials in mailings. The former is quite common (e.g., Han, Montaquila, and Brick 2013; Jackson et al. 2020; Link and Burks 2013; Peytchev et al. 2020; Singer et al. 1999; Singer and Ye 2013), but the latter is a relatively novel technique (Lynn 2016).
The tailored mailings highlighted different aspects of the survey for sample cases who have different characteristics. This strategy mirrors a classic technique used by experienced interviewers. Just like interviewers adapt their behaviors and languages to the perceived features of sample units (Groves and McGonagle 2001), the mailings adapt the text and images. Of course, the adaptive mailings are less flexible than interviewers because the decisions have to be made for subgroups of samples based on limited auxiliary information. Nonetheless, the strategy of tailoring invitation content was found to be effective in motivating reluctant respondents in a panel survey in UK (Lynn 2016). Other evidence indirectly suggests that tailored mailings can be a viable option for attracting respondents (Fumagalli, Laurie, and Lynn 2013; Liu et al. 2016; Lynn 2017; Christensen, Lynn, and Tolstrup 2019), but the technique has not been widely tested.
To experimentally evaluate the added benefits of adaptive design beyond post-survey adjustment, we compared the survey outcomes and survey estimates in five ways:
Methods
Wave 12 of the Detroit Metro Area Communities Study (DMACS) is the vehicle of the current experiment. Launched in 2016, DMACS is a panel survey of representative samples of adult residents in Detroit. Wave 12 was fielded between January and March 2021. The questionnaire asked about experiences with the COVID-19 pandemic, perception of neighborhoods, assessment of city services, health and healthcare, and employment.
Overview of the DMACS Survey
DMACS used address-based samples. Wave 12 included a refreshment sample (
The established panelists were invited to participate in the current wave by emails, text messages, and mailings; the new cases were invited only by mailings. The timing of the contact attempts is summarized in Table 1. Sampled individuals could participate through a self-administered web survey or an interviewer-administered telephone interview. About 13% of responses were collected by the telephone mode; the mode choice did not differ between the experimental and control group (
Timing of Contact Attempts for the Panel Sample and the Refreshment Sample.
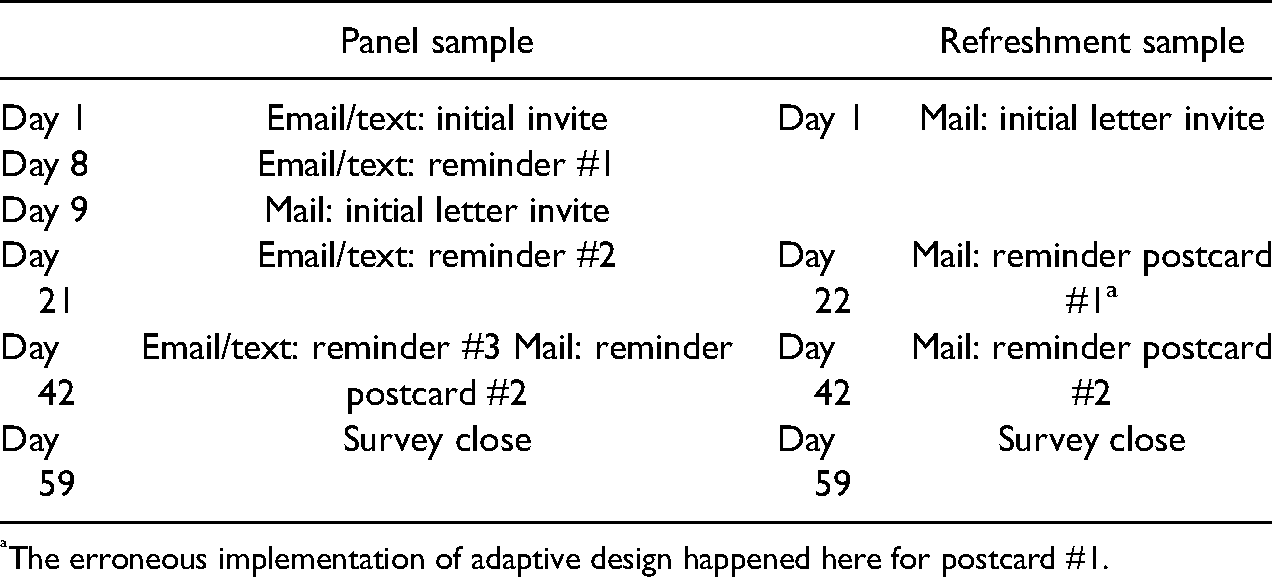
The erroneous implementation of adaptive design happened here for postcard #1.
Experiment
The panel and the refreshment sample were separately randomized into an experimental group and a control group with a 70%/30% split 4 . Cases in the experimental groups were recruited with an adaptive design, and cases in the control groups were recruited with a homogeneous design. Below, we first describe the experiment on the refreshment sample. The experiment on the panel sample was largely the same with minor modifications.
Promising a higher incentive to sample cases who have lower predicted response propensities (extra $5). This strategy aims to differentially encourage cases that are less likely to respond. The goal is to reduce biases by smoothing response propensities across sample subgroups. Highlighting different aspects of the DMACS survey to different groups of sample cases in the invitation materials; and Providing region-specific COVID information to motivate responses by putting the survey request in context. Strategy 2 and 3 both try to frame the survey in a way that is likely to be relevant to the different sampled individuals. The goal is to increase the overall response rates by making the survey request attractive.
These three strategies were bundled in the adaptive design, meaning that we estimated their combined effect but not the individual effect of each strategy.
The key to implementing the three strategies is the ability to categorize sampled cases into subgroups based on distinguishable characteristics prior to the recruitment. We performed the categorization at the areal level and divided the city of Detroit into four regions (Figure 1).
- The Southwest (purple) has a high proportion of Hispanic population. - Downtown (blue) is the commercial area including Wayne State University. - Both the East (green) and the West (yellow) are general residential areas.
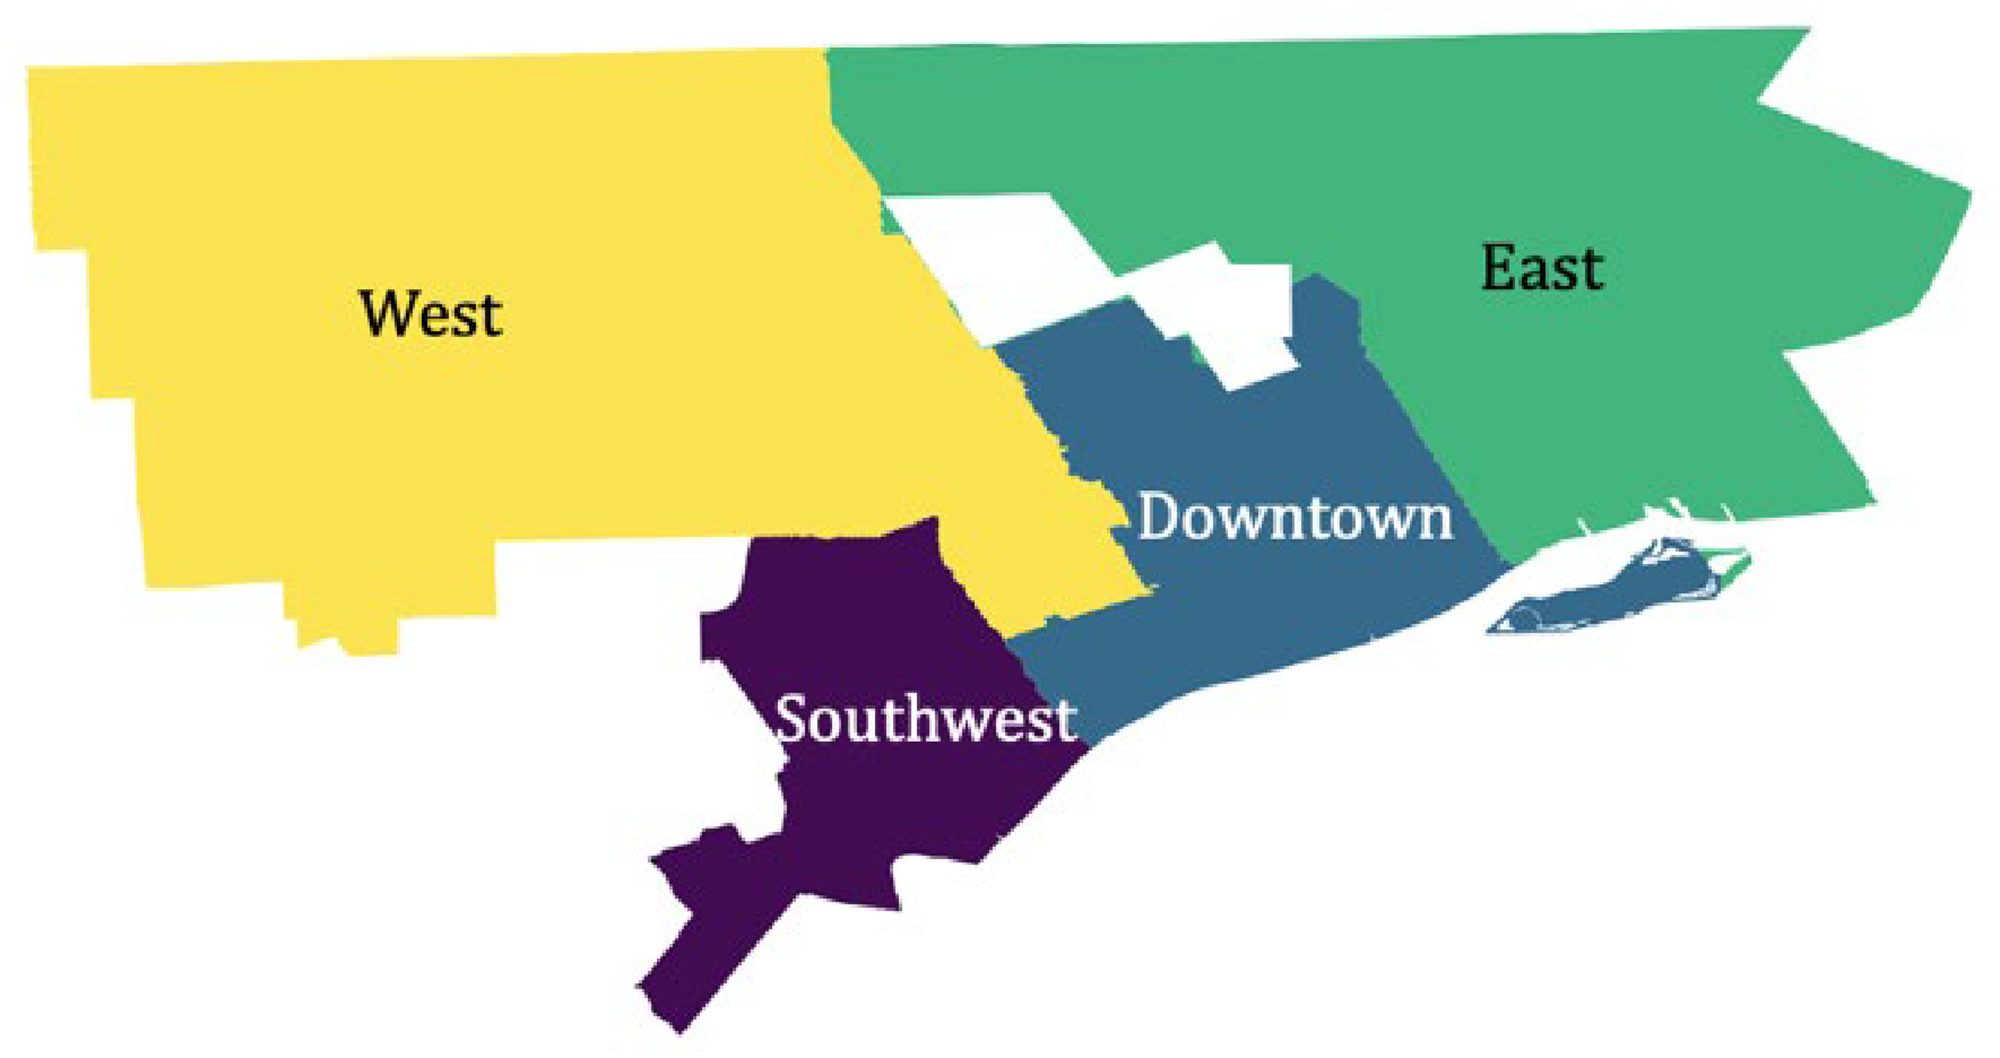
Dividing the city of detroit into four regions for adaptive design.
The areal division was based on two criteria. First, the regions need to have distinguishable features. We use variables from the Census Planning Database 5 (e.g., percentage of population with no high school diploma) and the National Neighborhood Data Archive 6 (e.g., proportion of high-density developed areas) to cluster Detroit block groups into different types of neighborhoods. Second, the regions need to be geographically homogenous and meaningful because we use the division to develop region-specific COVID messages (strategy 3). We reorganize the block group clusters to become geographically contiguous. Appendix II explains the analysis and steps we took in detail.
In the adaptive design, sample cases in the four regions received letters and postcards with different languages and images. The key design elements and their adaptive objectives are listed in Table 2. For example, cases in the Southwest were offered an increased incentive ($30 instead of $25) because the region had a lower than average response rate in a previous DMACS wave (strategy 1). Then, because the Southwest region is distinguishable for its high concentration of ethnic minorities, we described DMACS as “an ongoing survey that asks residents how the city can best meet the needs of people of many races and ethnicities who live in Detroit” in the invitation letter mailed to cases in this region (strategy 2). We also designed the postcard fronts to reflect the multicultural feature of the region (strategy 2). Further, we analyzed data on health-related topics from a previous DMACS wave and discovered that residents in the Southwest had a significantly lower insurance coverage rate. We included this result together with a map highlighting the region as a COVID-relevant message at the bottom of the invitation letter (strategy 3). Appendix III explains the analysis we performed and the design of the recruitment protocols in each region in detail.
Design Elements of the Adaptive Design in the Experimental Group and the Homogeneous Design in the Control Group.
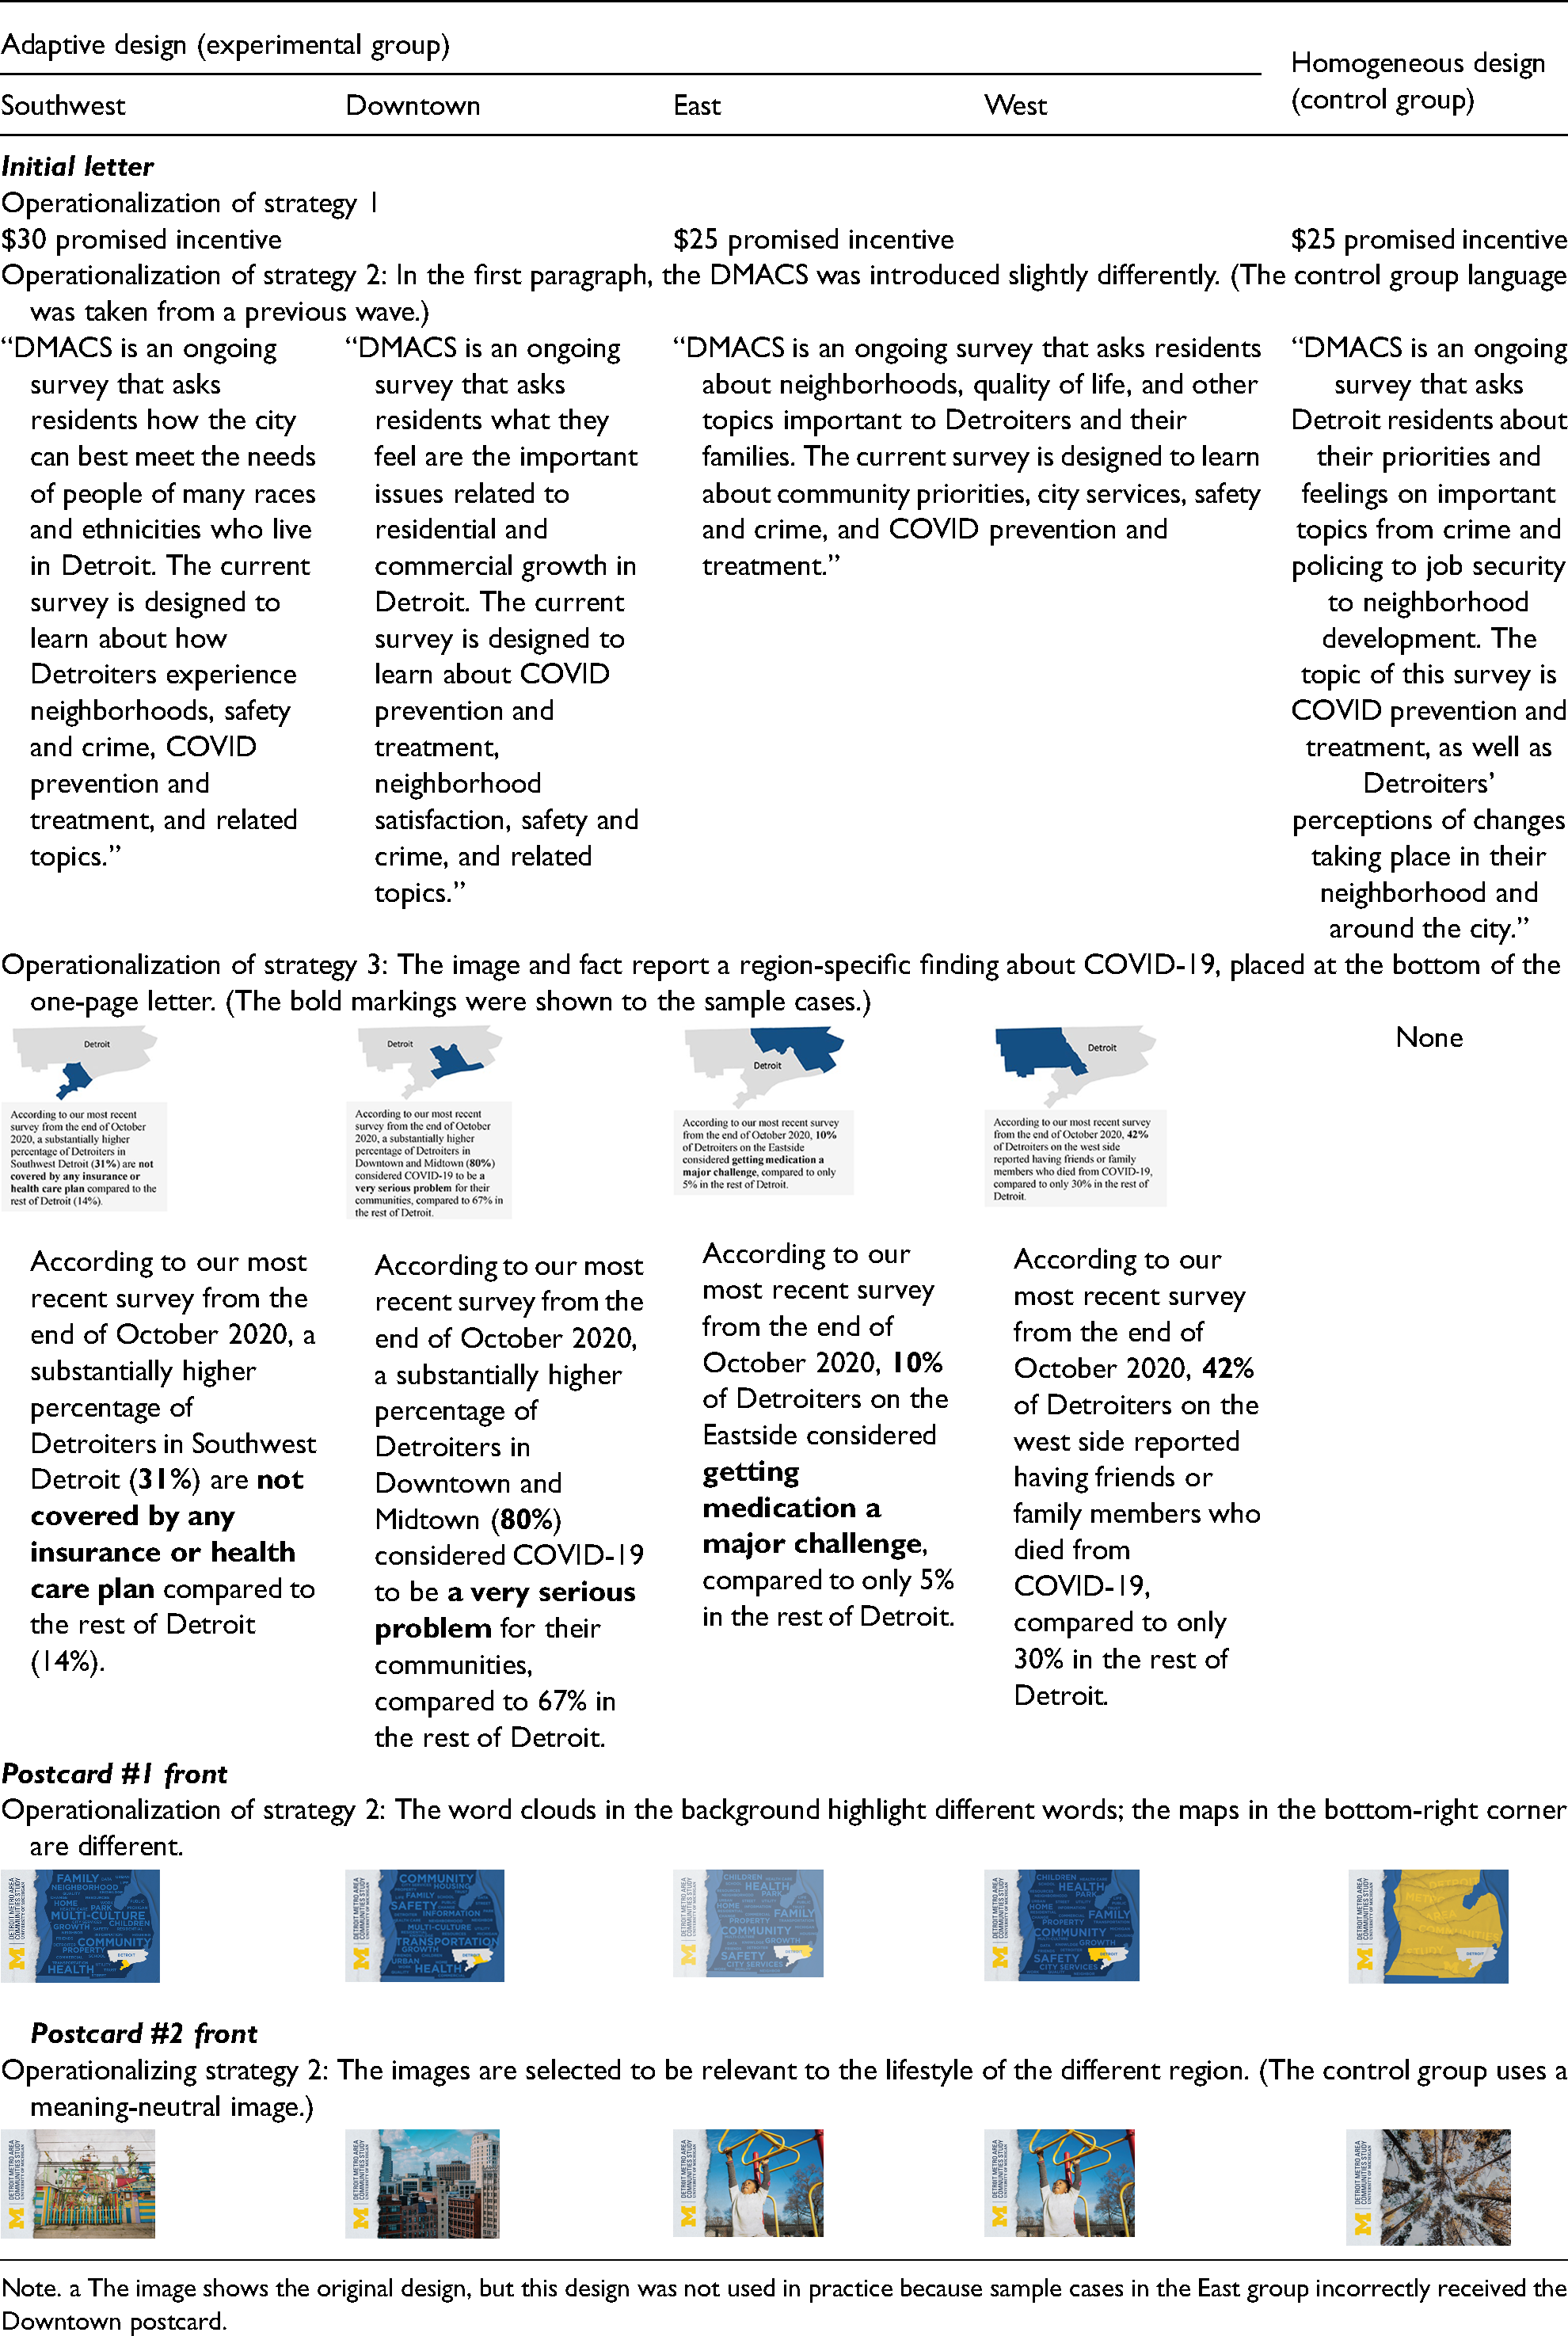
Note. a The image shows the original design, but this design was not used in practice because sample cases in the East group incorrectly received the Downtown postcard.
We note a mistake that happened during the fielding of the adaptive design for the refreshment sample. The printing company mistakenly used the Downtown template for the East group in reminder postcard #1. Appendix III provides more details on this mistake. The wrong postcard was mailed to 1,954 addresses.
The sample size breakdown by experimental grouping and region is reported in Table 3.
The Sample Breakdown by Experimental Grouping and Regions.
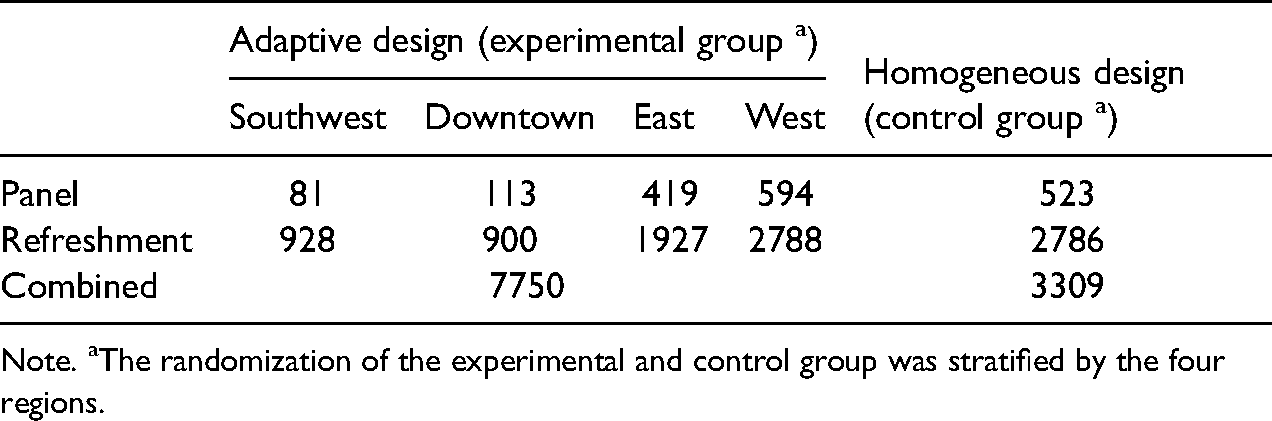
Note. aThe randomization of the experimental and control group was stratified by the four regions.
Post-Survey Adjustment
The goal of the current research is to evaluate the impact of adaptive design on survey data beyond the effect of post-survey adjustment. To this end, we performed post-survey adjustment separately on the data collected under the adaptive design and the homogeneous design. We then computed survey estimates based on the two weighted samples.
We adopted the post-survey adjustment procedure from the DMACS data production. The adjustment includes two stages. The first stage uses the technique of post-stratification to account for the over-/under-sampling and the uneven response rates across geographic areas (strata). Specifically, respondents of the thirteen geographic areas are calibrated to the corresponding population sizes. The second stage uses raking to weight the respondent samples to match with the 2019 ACS-based population distributions on gender and age, education, race and ethnicity, and household income.
Analytical Plan
The adaptive design experiment was evaluated in terms of five outcomes: 1) response rates, 2) demographic composition, 3) bias and variance of key survey estimates, 4) changes in significant results of regression models, and 5) costs.
First, we compared the unweighted response rates of the experimental and control group for the refreshment sample and the unweighted conditional response rates 7 of the experimental and control group for the panel sample (AAPOR Response Rate 1; AAPOR 2016).
Second, we compared the experimental and the control data in their representativeness in demographic features. The data collected from the panel and the refreshment sample are combined because the two samples were designed to be used together for representing the Detroit population. The analyses of sample representativeness are based upon the first stage weights; that is, weights that are post-stratified to geographic-area population totals.
Specifically, the representativeness was evaluated on five demographic variables: gender, age, education, race and ethnicity, and household income. The distributions of these variables based on the experimental and the control data were separately compared with the population distributions based on the 2019 American Community Survey (ACS). The unrepresentativeness is captured as deviation in the sample distribution through an imbalance (IMB) score (Brick et al. 2021; Särndal and Lundquist 2019):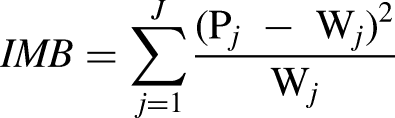
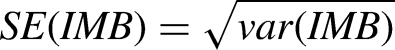
To compare the experimental group IMB with the control group IMB, we derived a variance estimator of IMB with a first degree Taylor polynomial linear approximation. The detailed derivation of the variance estimator is included in Appendix IV. The standard error of IMB is then computed as the square root of the estimated variance.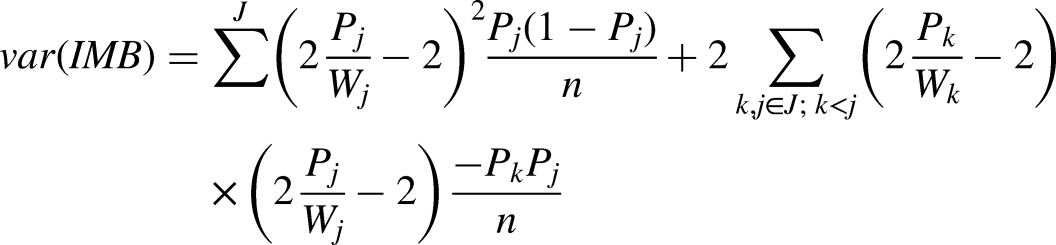
To estimate the variance of the mean estimates and the variance of the sampling variance estimates, we draw 5,000 bootstrapping samples on the experimental data and the control data separately. (For the analysis presented here, bootstrapping is more straightforward than analytically derived variance estimator for accounting for the unequal sample sizes of the experimental and control data for estimating the variance of variance estimates, and comparing the results of multivariate analysis. Details are explained below.) The bootstrapping was stratified by the four Detroit regions. On each of the bootstrap samples, we conducted post-survey adjustment and computed weighted survey estimates. We then pooled the estimates across repetitions to get distributions of mean estimates and sampling variance estimates.
To evaluate the biases in DMACS mean estimates, we used 2015–2019 ACS estimates as benchmarks. We emphasize that the ACS estimates are only for reference. They are not a gold standard comparison because ACS differed from DMACS in time, item wording and, sometimes, target populations (see Appendix V for details).
Other than biases, we also compared variances estimates based on the experimental data and the control data. Recall that the experimental group got 70% of the total sample and the control group got 30%, so the experimental data naturally have smaller sampling variances. To account for the influence of the unequal sample sizes, we took the ratio between the variances estimated on the experimental data and the control data. Across the bootstrap replicate samples, if the ratios were consistently smaller than
An alternative way to compare sampling variances is through design effects. For an estimator
Fourth, besides univariate estimates, we evaluated whether the adaptive design affected multivariate analysis. We focused on three regression models, predicting 1) the intention of getting the COVID-19 vaccine, 2) neighborhood satisfaction, and 3) the likelihood of being a personal owner of the current residence, respectively. These outcome variables were important topics in the DMACS survey. The goal of the model building is methodological. The predictors are chosen to capture relationships of different magnitudes, not to answer substantively significant and unexplored questions. In each model, two types of predictors were included—the ones that intuitively should be related to the outcome variables, and the ones whose associations with the outcome variables are uncertain. We investigated how conclusions change for the predictors that are related or unrelated to the outcome variables.
Because social scientists often use statistical significance to draw conclusions from regression analysis, we compared whether the data collected under the adaptive design and the homogeneous design led to different conclusions about the significance of the predictors. Because the adaptive design was implemented on the larger portion of the sample than the homogeneous design (70% vs. 30%), the former has more power to detect significant results. To account for the influence of the unequal sample sizes, we created pseudo standard errors (SE) for the homogeneous design data by dividing the estimated SE by the square root of the sample size ratio (i.e., pseudo-SE =
We relied on the bootstrap samples to estimate variations in the conclusions of the regression models. The significances of the predictors were pooled across repetitions to indicate how stable the results were.
Finally, we compared the costs of the adaptive design and the homogeneous design. We report the monetary cost per respondent. We also discuss some factors that cannot be easily distinguished between the two designs but influenced the total survey costs (Olson, Wagner, and Anderson 2020).
Findings
Response Rates
Overall, DMACS collected responses from 2,237 Detroit residents. The panelists responded at a much higher rate than the new cases. Table 4 reports the (conditional) response rates and the corresponding confidence intervals. For the panel sample, the conditional response rate of the experimental group has a small but non-significant edge over the control group (0.739 vs. 0.706). For the refreshment sample, the difference between the experimental and the control group is negligible (0.105 vs. 0.103).
AAPOR Response Rate 1 a of the Panel and the Refreshment Sample by Experimental Randomization.
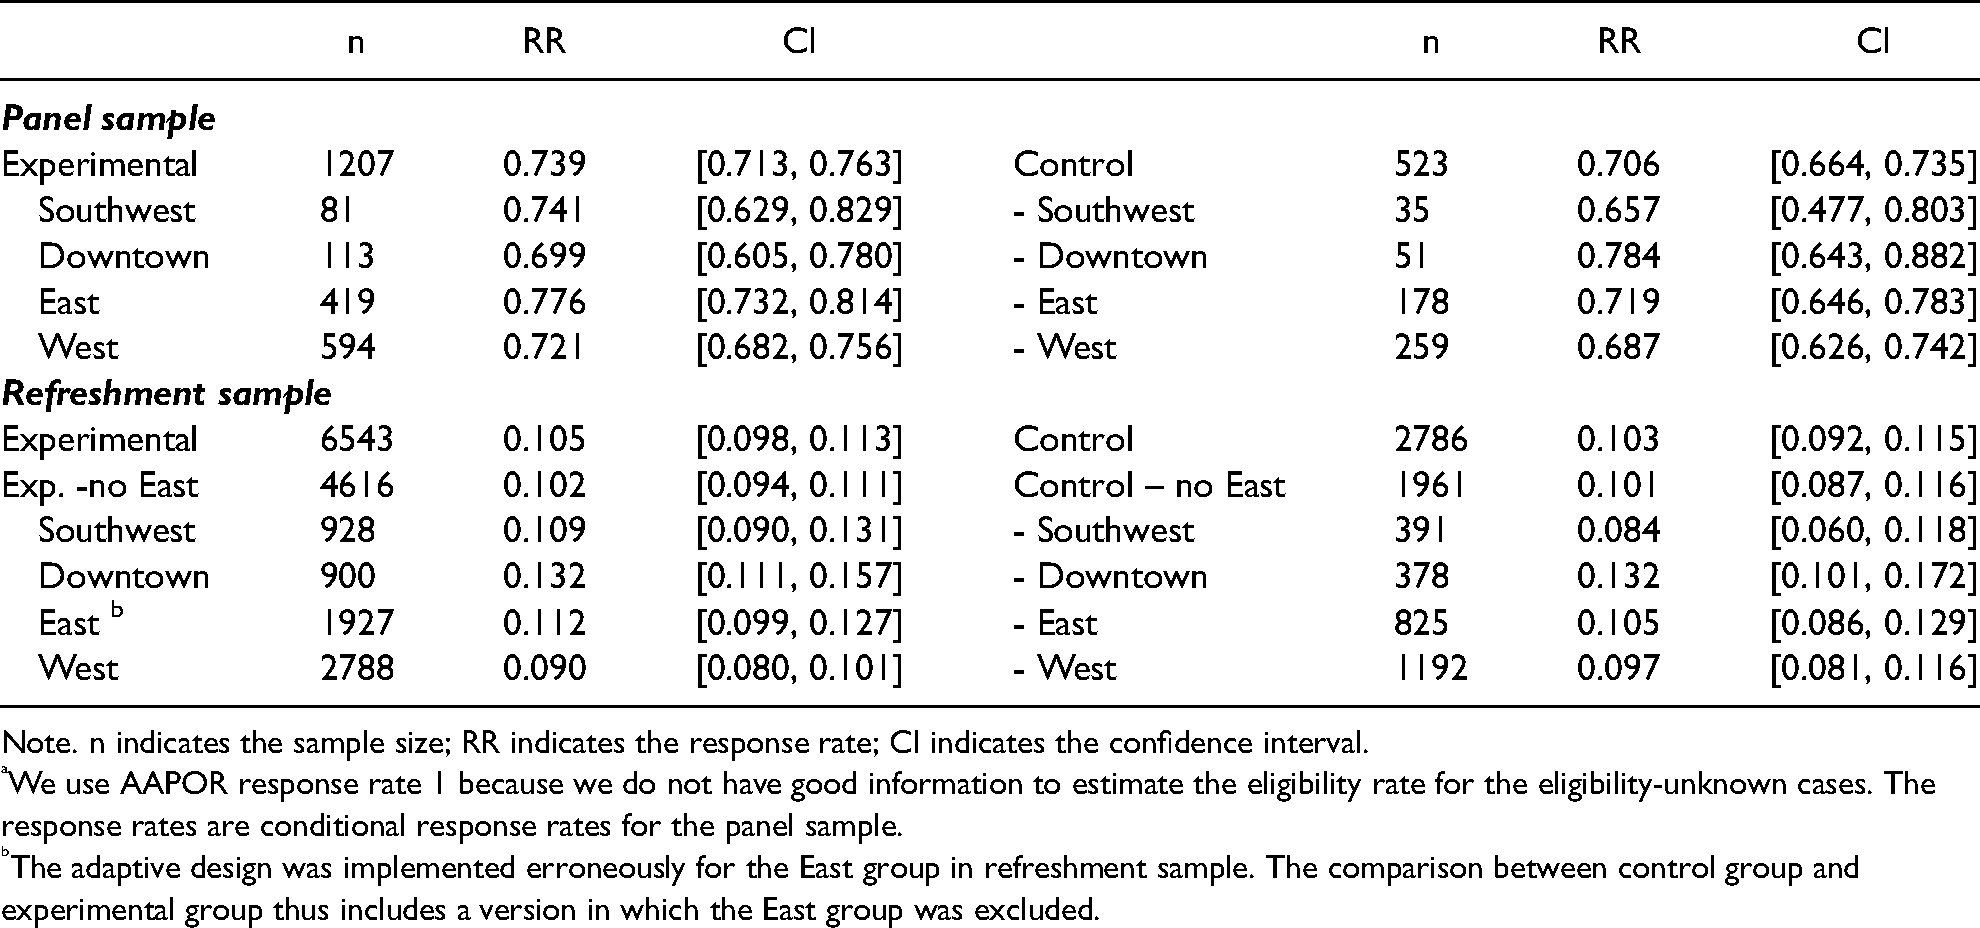
Note. n indicates the sample size; RR indicates the response rate; CI indicates the confidence interval.
We use AAPOR response rate 1 because we do not have good information to estimate the eligibility rate for the eligibility-unknown cases. The response rates are conditional response rates for the panel sample.
The adaptive design was implemented erroneously for the East group in refreshment sample. The comparison between control group and experimental group thus includes a version in which the East group was excluded.
Except for the overall response rates, Table 4 also breaks down the survey outcomes by region. The adaptive design achieved slightly higher response rates than the homogeneous design, with three exceptions—the Downtown panel, the Downtown refreshment, and the West refreshment samples. However, no differences in response rates were statistically significant, as shown by the largely overlapping confidence intervals of the experimental and the control conditions. Particularly for the panel samples in the Southwest and the Downtown region, the point values of the response rate are not very informative because of the small sample sizes.
Demographic Composition
Another purpose of adaptive design is to improve the representativeness of the respondent sample. Table 5 reports the imbalance (IMB) scores of the demographic variables based on the experimental and the control data.
Imbalance (IMB) Scores of Demographic Variables Based on the Experimental Data and the Control Data.
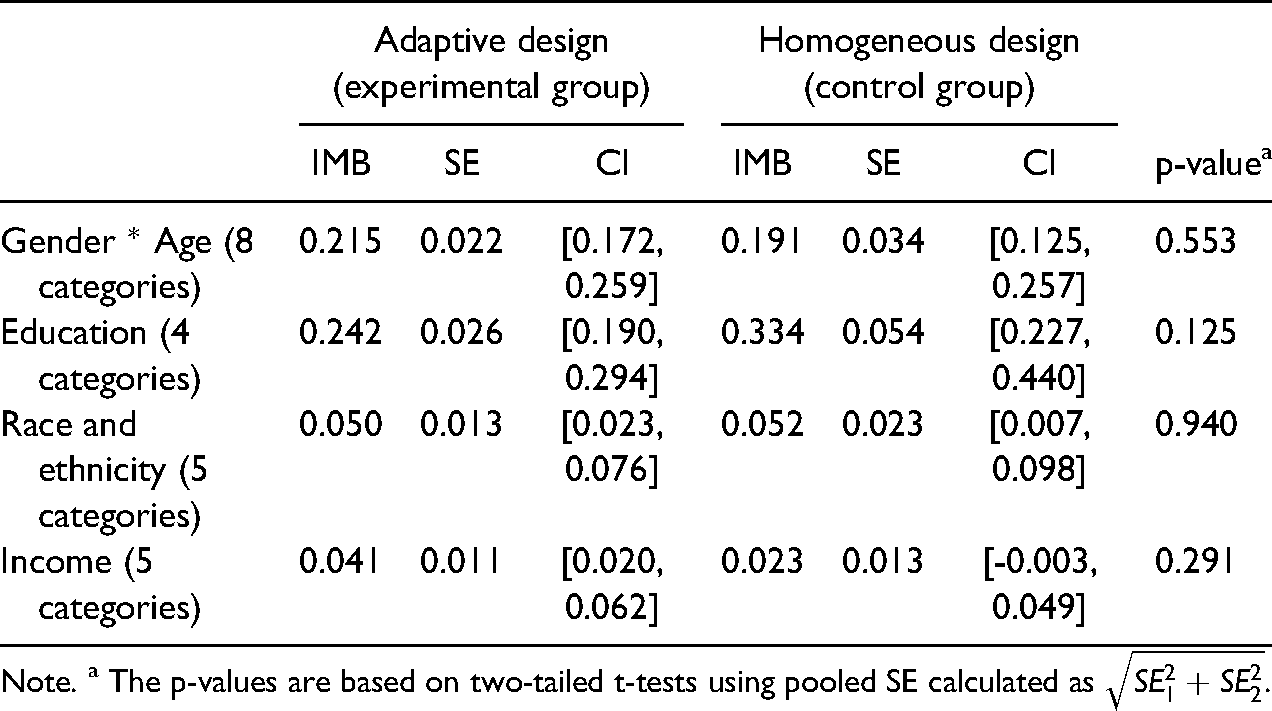
Note. a The p-values are based on two-tailed t-tests using pooled SE calculated as
One noticeable difference in IMB is in the education distribution. The data collected under the adaptive design had a smaller IMB than the data collected under the homogeneous design (0.242 and 0.334), though this difference is not statistically significant (p = 0.125). That is, based on the currently realized samples, the adaptive design produced a more balanced distribution in education than the homogeneous design. This balance is likely to have a favorable impact on the later weighting step because less variable weights are needed for the adaptive design. However, because the difference in IMB is not statistically significant, the current evidence cannot reject the null hypothesis that the difference was due to chance.
Key Survey Estimates (Univariate Analysis)
Figure 2 illustrates the bootstrapping results of the weighted estimates based on the experimental data (collected with the adaptive design) and the control data (collected with the homogeneous design). The left column of Figure 2 shows the distributions of weighted estimates across the
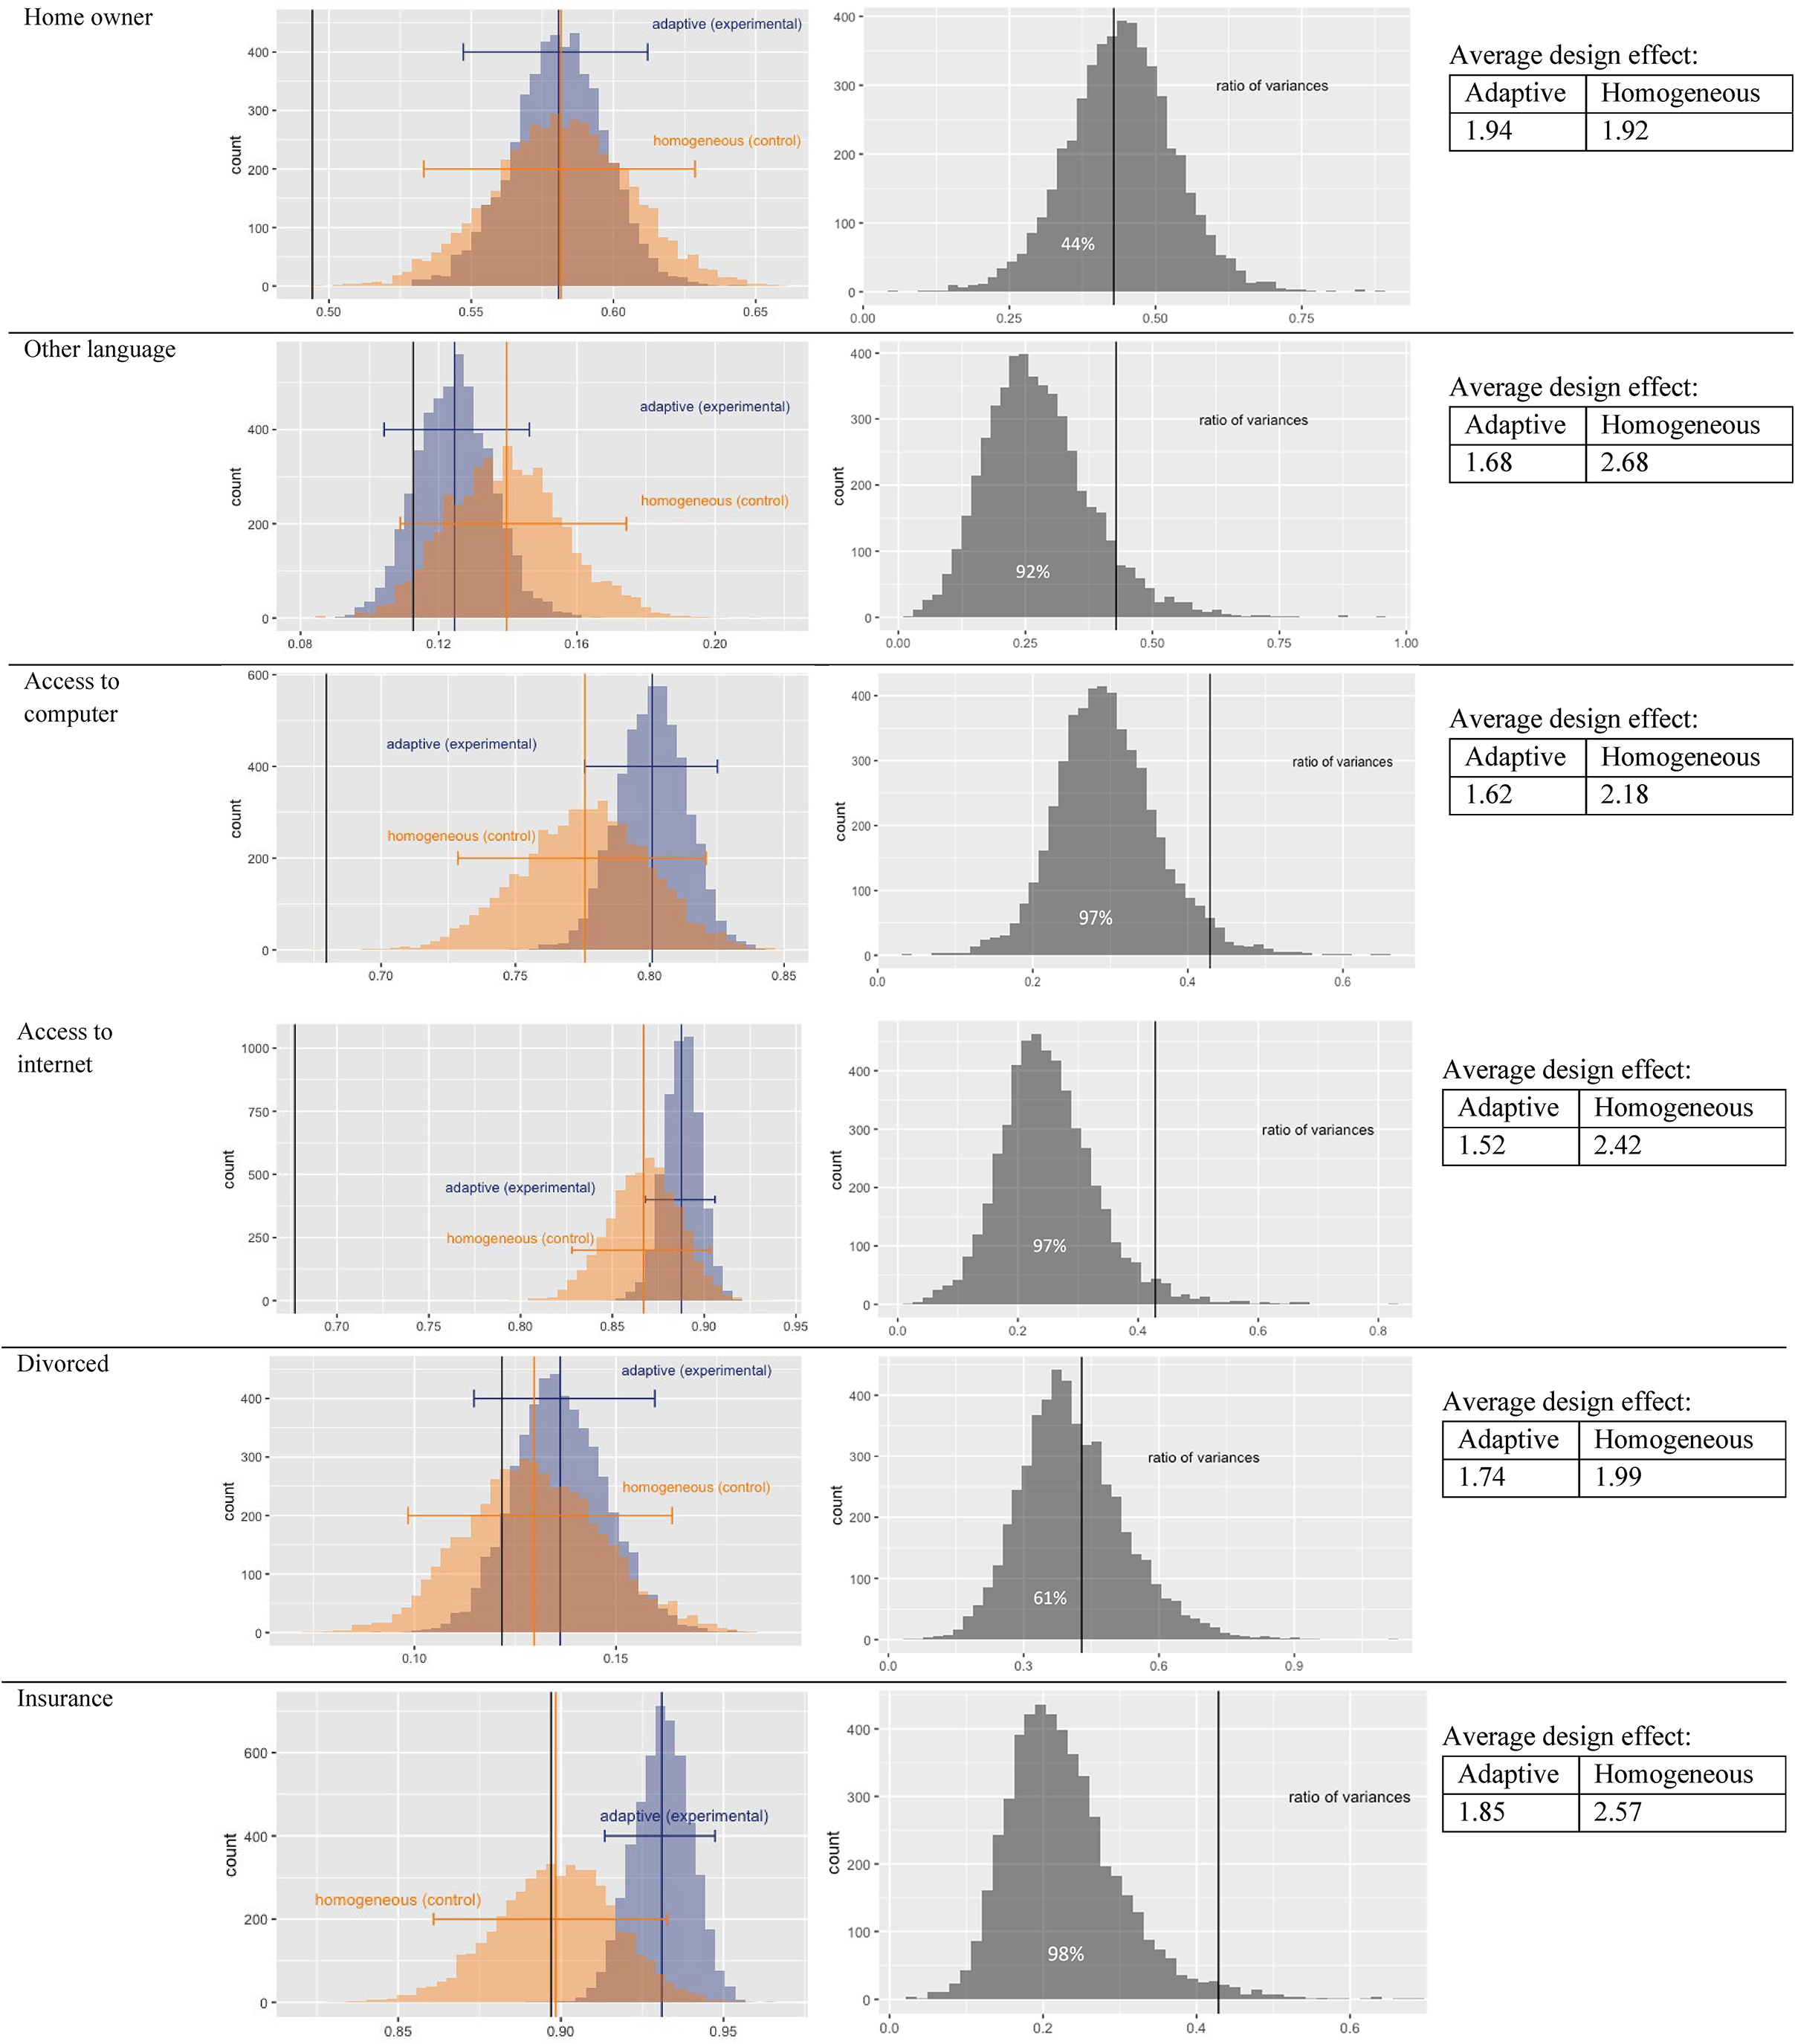
Left: weighted mean estimates of survey variables based on bootstrapping the experimental data and the control data. Middle: Ratio of estimated variances based on bootstrapping the experimental data and the control data. Right: Design effects.
The middle column of Figure 2 shows the ratios of the experimental variances and the control variances across repetitions. The vertical line is at
The right column of Figure 2 reports variable-level design effects. Smaller design effects indicate larger effective sample sizes, as well as less variance inflation due to the complex sample design. The design effects of the experimental data are generally smaller than those of the control data. Thus, the results echo the pattern drawn from the variance ratios in the middle column—the adaptive design tended to result in more efficient estimates than the homogeneous design. Alternatively, the differences in design effects can be interpreted in terms of effective sample sizes (i.e.,
Coefficients of Regression Models (Multivariate Analysis)
Three multiple/logistic regression models were fitted to the weighted experimental data and weighted control data, separately. In each model, two types of predictors were included—the ones that intuitively should be related to the outcome variables (i.e., intuitive predictors), and the ones whose associations with the outcome variables are uncertain (i.e., uncertain predictors).
For the outcome variable on COVID-19 vaccine intention (7-point Likert scale), the predictors include demographic variables and trust of information from different sources. Three variables are considered intuitive predictors: Older residents should express a higher intention of getting vaccinated because COVID-19 is more lethal to the older population. People who distrust doctors and the U.S. government should be less inclined to get vaccinated because the vaccine is a medical product and is authorized by the U.S. Food and Drug Administration. On the other hand, the uncertain predictors include other demographic features, trust in faith leaders, trust in co-workers, schoolmates, and other acquaintances, and trust in contacts on social media; their associations with vaccine likelihood are less clear.
For the outcome variable on neighborhood satisfaction (7-point Likert scale), the intuitive predictors are perceived neighborhood reputation and how safe one feels to walk in the neighborhood. The uncertain predictors are homeownership and whether one has access to a computer at home.
The last outcome variable on personal homeownership (binary variable) was constructed by matching panelists’ names with taxpayer names of the panelists’ addresses listed in property tax records. If a panelist's name is included as a taxpayer in the records, he/she is considered a personal owner of the residence. The intuitive predictors are income and age: Higher income and older people should be more likely to be a personal owner of their home than lower-income and younger people. The uncertain predictors are gender and race and ethnicity.
Table 6 reports the results of the regression models across repetitions. The Average Coefficient and the Average SE columns report the coefficients and standard errors averaged across bootstrap samples. The % of Significance columns report the percentage of the 5000 bootstrap samples whereby the predictors emerged as significant. The intuitive predictors are bolded.
Results of Multiple Regression Models Based on the Experimental Data and the Control Data.
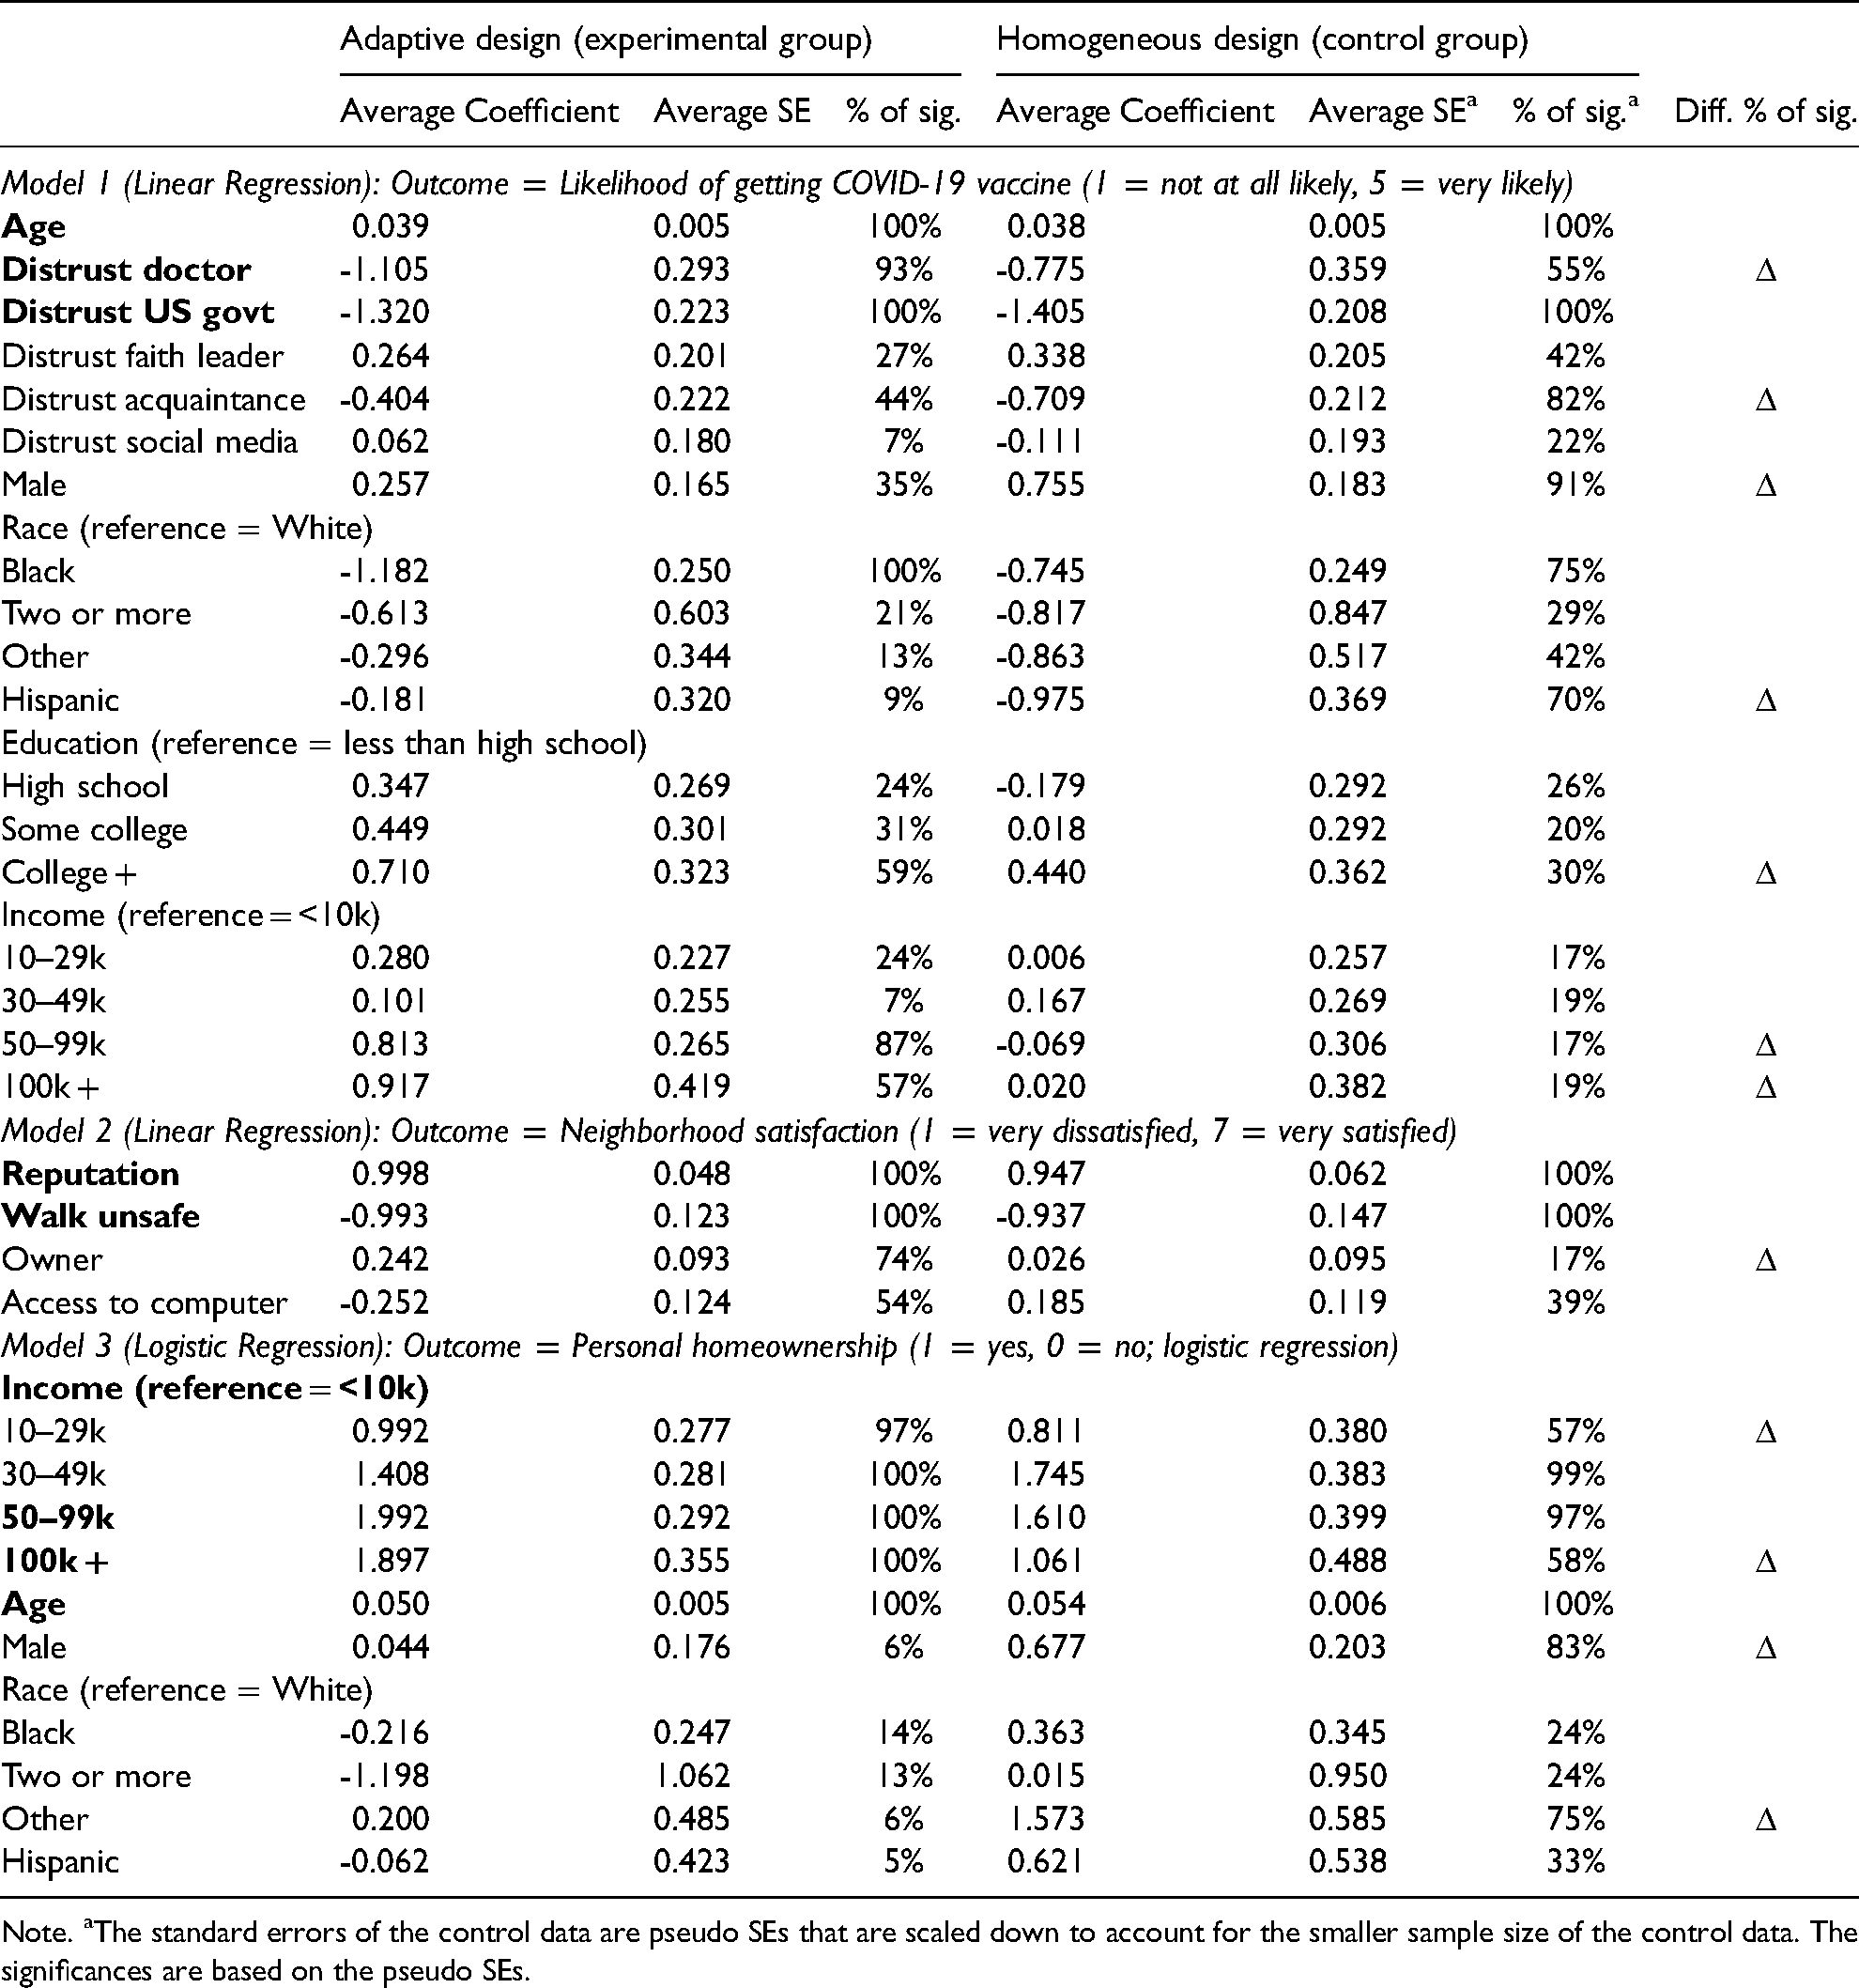
Note. aThe standard errors of the control data are pseudo SEs that are scaled down to account for the smaller sample size of the control data. The significances are based on the pseudo SEs.
We focus on comparing the % of Significance 8 based on the experimental data and the control data. To summarize the results, for a somewhat arbitrary threshold, we consider the two percentages to be “notably different” if the ratio between them is larger than 1.5 and the difference between them is larger than 30 percentage points. We use Δ to mark the notable differences in the rightmost column of Table 6. The Δ shows that the conclusions can be unstable depending on whether they are based on the adaptive design data or homogeneous design data. The unstable results are mostly from uncertain predictors with two exceptions:
Two intuitive predictors led to different conclusions based on the experimental and control data. One is the association between distrust of doctors and vaccine intention, and the other is between 100k+ income and homeownership status. In both cases, the coefficients based on the control data are smaller than those based on the experimental data (−0.775 and 1.061, as opposed to −1.105 and 1.897). Correspondingly, the control-data coefficients are less likely to reach significance than the experimental-data coefficients (55% and 58%, as opposed to 93% and 100%). Of course, we do not have benchmarks to know which set of coefficients is closer to the true values. But it is not unreasonable to expect these two associations to exist. Thus, we suggest that the performance of the adaptive design on these two predictors is better than the homogeneous design because the adaptive data capture the associations in a more stable manner.
Costs
The most obvious difference between the adaptive design and the homogeneous design is the amount of incentives. The cost of incentives per respondent is $26.7 9 and $25 for the adaptive and the homogeneous design, respectively. To put these numbers in context, incentives accounted for roughly half of the total fielding cost. (However, the total fielding cost of DMACS is not generalizable to cross-sectional surveys because more than half of the respondents were established panelists and collecting data from established panelists is much cheaper than recruiting new cases.)
Besides incentives, we cannot quantify other sources of costs in monetary or nonmonetary units (e.g., hours) because the operations of the adaptive and homogeneous design were not separated. Nonetheless, we are aware that the adaptive design added to the total survey costs in a few ways. First, the adaptive design clearly increased the staff workload. The managers needed to carefully manage different versions of documentations and materials, one for each adaptive subgroup. Second, there is a cost in designing and translating multiple versions of invitation materials, though this is a relatively small part of the total costs. Third, printing several templates is more expensive than printing a single template because the smaller batches did not reach the threshold for discounted prices like the overall sample would. These factors are not unimportant for a small survey with a small staff.
Discussion
In the current literature, there is a debate about the added benefits of implementing responsive and adaptive recruitment (Brick and Tourangeau 2017; Särndal and Lundquist 2019; Schouten et al. 2016; Tourangeau et al. 2017). Responsive and adaptive design is worth the effort only if it improves survey estimates beyond the capacity of the standard practice of post-survey adjustment. Evidence of this discussion has been limited to theoretical and simulation studies (Brick and Tourangeau 2017; Särndal and Lundquist 2014, 2017, 2019; Schouten et al. 2016). The literature has called for extending the analysis and gathering empirical evidence from real surveys.
In this paper, we report the results of an experiment implemented in a real survey that evaluated the benefits of an adaptive design additional to post-survey adjustment. The analysis focused on five outcomes: response rates, sample composition, univariate survey estimates, conclusions drawn from multivariate analysis, and survey costs.
The adaptive design yielded slightly higher response rates in the panel subsample, obtained a more balanced distribution in education, captured some multivariate associations more stably and, most importantly, generated more efficient survey estimates with smaller variances and smaller design effects. But the adaptive design did not further reduce survey biases. Overall, at the cost of a more troublesome fielding, the performance of the adaptive design had a small edge over the homogeneous design.
We make a few remarks based on the current results. First, in terms of response rates, the adaptive design had a small benefit (though non-significant) in the panel sample but not in the refreshment sample. The increased response rate among the established panelists is consistent with the effect of tailored letters in the Understanding Society Innovation Panel (Lynn 2016). We do not have a clear explanation for why the adaptive design was not successful in the refreshment sample. One possibility is that the established panelists paid closer attention to the invitation materials because they are more interested and have established trust in DMACS. Since tailored materials affect responses only if people read the content, the materials may not be effective on a potentially disinterested population in the refreshment sample. This is only speculation. More research is needed to understand how applicable the technique of tailoring invitation materials can be for a panel sample and a new sample.
Second, the adaptive design reduced the variances but not the biases of the univariate survey estimates. Interestingly, such results echo a recent simulation study, which demonstrated that the benefit of adaptive design on variances is more robust than on biases (Zhang 2022). The simulation was motivated by a concern that adaptive designs are not perfectly designed and implemented. In suboptimal scenarios where input information is inadequate, adaptive design may lose its ability to reduce biases beyond post-survey adjustment, but may still lower variances. This reasoning provides a potential explanation for the current results. The adaptive design in DMACS was far from ideal. The strategy development was at the regional level because auxiliary information on the entire sample was thin. The limited input information might have curbed the benefit of the adaptive design on bias reduction.
Third, conclusions drawn from regression models are not always the same based on the data from the adaptive design and the homogeneous design. The models were set to include intuitive and uncertain predictors. For the intuitive predictors, data from both designs were generally able to identify the associations as significant, though the adaptive design captured some associations more stably than the homogeneous design. For the uncertain predictors, the regression results based on the two designs are different. Though we do not know which results are more accurate, the differences have interesting practical implications. Social scientists typically do not study associations that obviously exist (like the intuitive predictors) but instead investigate relationships that have a certain degree of uncertainty (mimicked by the uncertain predictors). The current data show that conclusions about uncertain relationships can be influenced by the recruitment design. This observation is not uncommon. Axinn and colleagues (2011) have documented that the differences in coefficients based on the regular and the responsive design data can be so large that the signs of the coefficients were reversed. Understanding how research conclusions can be substantively influenced by RASD is an important topic for future research.
Fourth, this research contributes to the literature by extending the application of adaptive design to a small-budget survey. Since small surveys often cannot afford expensive data collection methods to improve survey outcomes, developing cost-effective RASD techniques could make important contributions to improving the data quality of small surveys.
Fifth, since the benefits of the adaptive design are small compared to the homogeneous design, one may opt for the adaptive design if it is mostly cost neutral. The adaptive design raised the cost of incentives per respondent from $25 to $26.7 (a 6.8% increase) and it increased the workload of the staff. On the bright side, the additional costs in human resources may decrease once the survey establishes an infrastructure to implement the adaptive strategies. In fact, after this experiment, DMACS has continued using adaptive strategies to retain underrepresented panelists.
Sixth, the adaptive design was implemented with an error. One of the subgroups received the wrong reminder postcard due to a mistake that happened during the mail merge. Fortunately, 69% of respondents in that subgroup responded before the mistake occurred and thus we do not expect it to have a major impact on the results. However, this incident shows how adaptive design can complicate survey implementation and increase the cost of testing and quality control.
We note that the current study design and outcomes are limited by a few additional factors. The adaptive design bundled three strategies because the sample size was not large enough to support a full factorial design on the strategies. This bundled design was sufficient for our objective. We intended to assemble the best adaptive design (of course, under practical constraints) to evaluate whether the design could benefit survey estimates beyond post-survey adjustment. However, as a result, we were not able to tease apart the effect of each adaptive strategy on the panel and the refreshment sample. Future research with a larger sample can test different strategies individually. The results would be constructive for developing the technique of tailoring invitation materials.
Next, since the current adaptive design was implemented in the city of Detroit, the target population was relatively homogeneous. There is limited room for strategy development in a homogeneous population because adaptive strategies depend on distinctive features of sample subgroups. RASD may achieve better results in a heterogeneous population. It would be interesting for future research to extend the application to a national context, where the sample, for example, might be distinguished by rural and urban features.
Finally, the current research question was addressed by comparing the results of combining adaptive design and post-survey adjustment with those of post-survey adjustment alone. Answers to this question are influenced by the choice of the post-survey adjustment method. We used calibration adjustments. For other surveys, if additional steps like propensity-score nonresponse adjustment are included in the weighting procedure, we caution that the efficacy of post-survey adjustment may change, which would in turn influence the added benefits of adaptive design.
Despite these caveats, our experiment is among the first to provide real-survey evidence on the utility of adaptive design, while accounting for the effects of post-survey adjustment. We investigated the effect of adaptive design along multiple dimensions. The adaptive design produced modest improvements in data quality and estimates, but also raised costs slightly. These findings are an important first step for understanding the cost and benefit tradeoffs of implementing adaptive survey design.
Supplemental Material
sj-docx-1-smr-10.1177_00491241221099550 - Supplemental material for The Additional Effects of Adaptive Survey Design Beyond Post-Survey Adjustment: An Experimental Evaluation
Supplemental material, sj-docx-1-smr-10.1177_00491241221099550 for The Additional Effects of Adaptive Survey Design Beyond Post-Survey Adjustment: An Experimental Evaluation by Shiyu Zhang and James Wagner in Sociological Methods & Research
Footnotes
Acknowledgments
We thank the Detroit Metro Area Communities Study (DMACS) for supporting the current experiment. We are grateful to the DMACS team, Dr. Elisabeth Gerber, Dr. Jeffrey Morenoff, Sharon Sand, Caroline Egan, and Lydia Wileden.
Authors’ Notes
Declaration of Conflicting Interests
The author(s) declared no potential conflicts of interest with respect to the research, authorship, and/or publication of this article.
Funding
The author(s) received no financial support for the research, authorship, and/or publication of this article.
Supplemental Material
Supplemental material for this article is available online.
Notes
Author Biographies
References
Supplementary Material
Please find the following supplemental material available below.
For Open Access articles published under a Creative Commons License, all supplemental material carries the same license as the article it is associated with.
For non-Open Access articles published, all supplemental material carries a non-exclusive license, and permission requests for re-use of supplemental material or any part of supplemental material shall be sent directly to the copyright owner as specified in the copyright notice associated with the article.