
Abstract
Introduction
Since 2000 performance-based financing (PBF) made its way to sub-Saharan health systems in an attempt to improve service delivery. In Rwanda initial experiences in 2001 and 2002 led to a scaling up of the initiative to all health centres (HC) and district hospitals (DH). In 2008 PBF became national strategy.
Methods
PBF was introduced in Rwanda in 2006 at the DH level. Evaluation on their service delivery was carried out quarterly in the following areas: hospital management, support to the health centres and clinical activities. We studied four DHs.
Results
After 5 years, an improvement in the quantity of clinical activities was observed, as well as quality in hospital management, in HC support and in clinical activities.
Conclusion
PBF proves to be a promising approach in strengthening and maintaining quality service delivery in the sub-Saharan district hospitals.
Keywords
Introduction
Poor service delivery has long been a major concern in the health sector. In 1995, resolution AFR/RC45/R3 of the WHO Regional Committee for Africa introduced a multitude of initiatives to improve the quality of care. This resolution urged member states: (1) to establish a national quality assurance programme; (2) to introduce in the training programmes of all health workers competencies required to deliver quality care; and (3) to give ‘incentives’ at all levels for the development of programs to improve the quality of care. 1
Rwanda responded to this resolution by institutionalising Quality Assurance (QA) in all health structures in the country. In addition, in 1997, Belgian Cooperation installed a system to motivate staff by allocating fixed premiums to health staff in its intervention zones. Unfortunately, this system did not improve the staff motivation or the quality of services, because all benefited of an equal and fixed premium regardless of performance. In 2001 and 2002 PBF at Butare and Cyangugu HC, with flexible premiums linked to performance, led to an increased volume of activities as well as to an improvement in the quality of services delivered.2,3
Owing to positive results seen in these pilot experiments, the Ministry of Health (MoH) decided gradually to introduce PBF in HC in 2005 and in DH in 2006. In 2008, the Government of Rwanda (GoR) adopted PBF as a national strategy to improve the quality of care and decided to open a specific budget line for PBF within the government budget. When in February 2008 GoR signed with the World Bank its fourth Poverty Reduction Support Grant for a total amount of US$70 million, 12% was allocated to PBF in the health sector and to the development of policy and regulations relating to health insurance.4–6
Several authors described PBF and its effects in HC, but few data are available on the introduction of PBF in DH.3,7–9
The objectives of this study are to describe how PBF was set up in four DHs between 2006 and 2010, to evaluate the impact on the quantity and quality of services provided, and to document the lessons learned.
Methodology
Intervention zone, study period and design
After the genocide in 1994, Rwanda gradually recovered to become a stable nation with laudable achievements. Over the last 10 years, development in the country’s health system has seen the most impressive improvements to date. Of all sub-Saharan countries, Rwanda is on track to meet the highest number of the Millennium Development Goals. The health system consists of a pyramidal system. It counts more than 430 HCs, 42 DHs and four national referral hospitals.
Our study includes four rural DHs: Ruli (150 beds); Nyamata (170 beds); Rutongo (100 beds); and Kabgayi (400 beds) – with a total catchment population as indicated by the MoH of 1.5 million in 2006. PBF was implemented in these hospitals from 2006 with financial support of BTC. These four hospitals together employed 41 medical doctors, 369 nurses and 97 other staff (administrators, logistics staff and support workers).
This study is a retrospective descriptive study covering 1 January 2006 to 31 December 2010.
There is no ‘control’ group for two reasons. First, the methods used for quality control and evaluation as described further on are labour-intensive, participative, resource-consuming and difficult to duplicate, without bringing in extra financial resources. Second, a control group was impossible after 2008, because PBF was scaled up to all DH in 2008.
Setting up PBF in DH
In PBF, health facilities are partially financed on the basis of delivered services or outputs. This is most often complementary to the input-based, line-item financing approach (e.g. of drugs, personnel). In Rwanda a special emphasis was put on ‘quality’ by only remunerating thoroughly verified, quality-assured services, defined as services performed in full compliance with national norms and guidelines. This may be called a ‘carrot and stick’ approach.
PBF was formalised through a contract between MoH and the service providers.
Example of performance indicators for clinical activities as developed in the Rwandan PBF for the DHs.
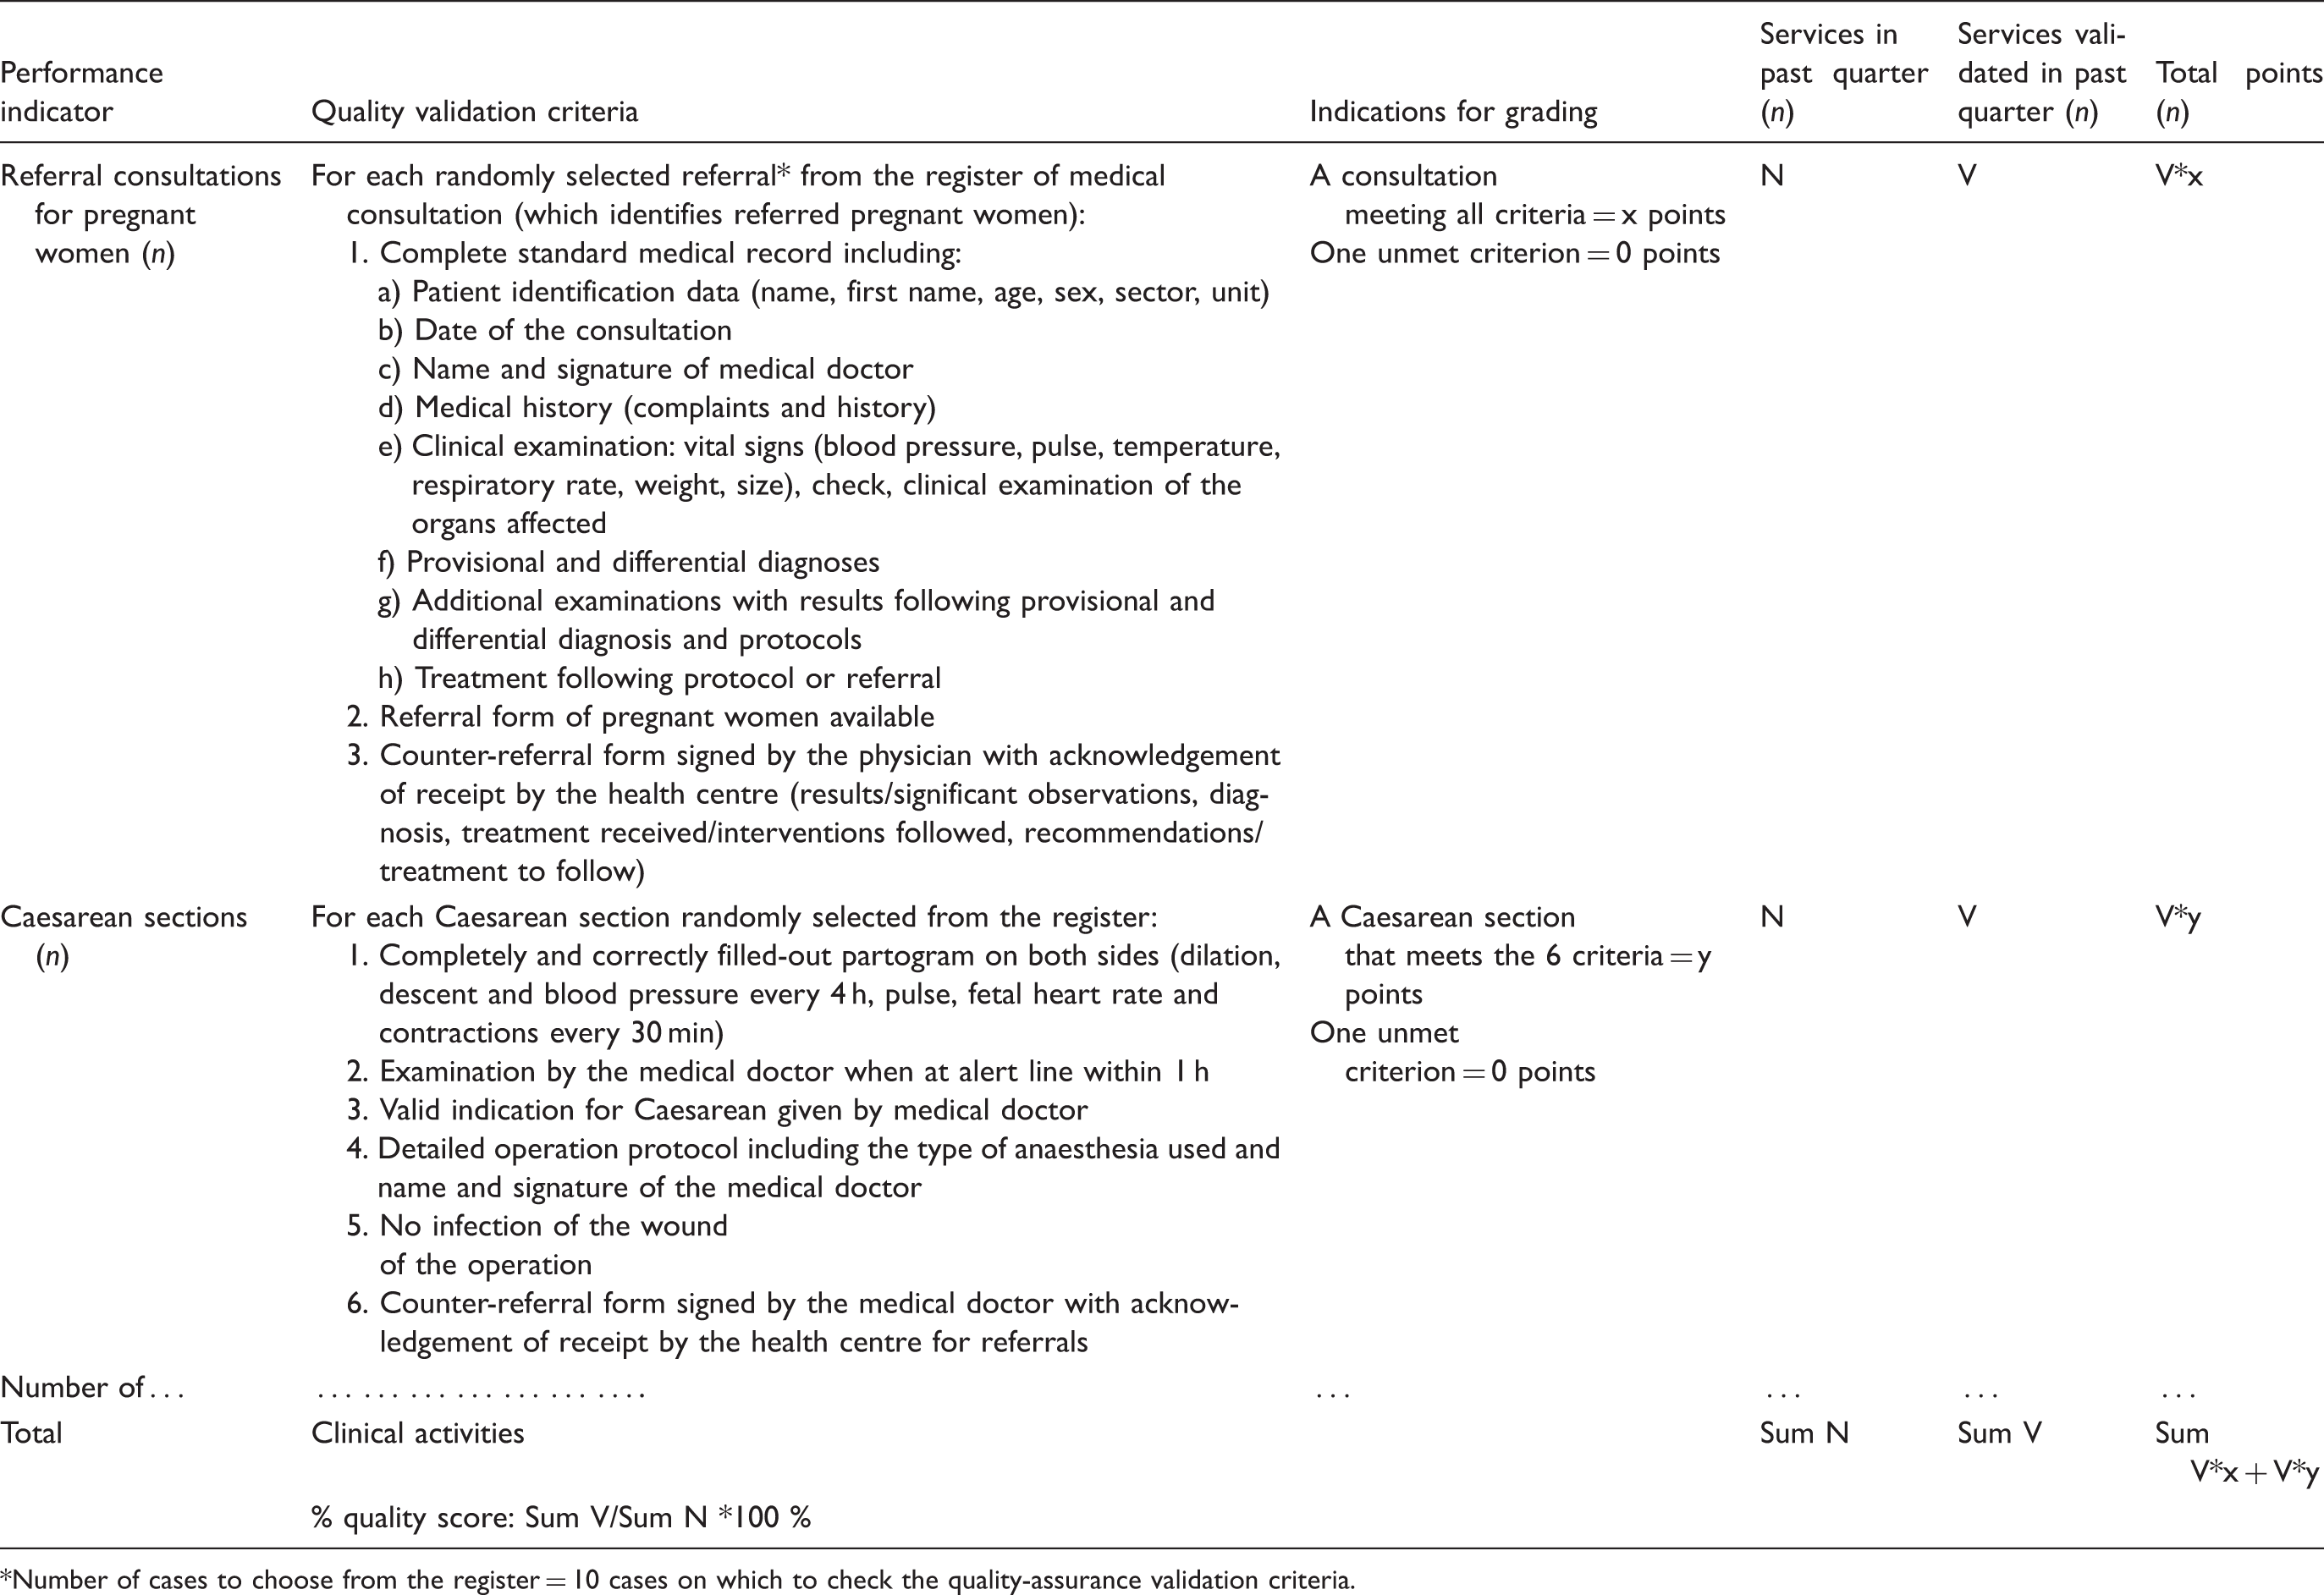
Number of cases to choose from the register = 10 cases on which to check the quality-assurance validation criteria.
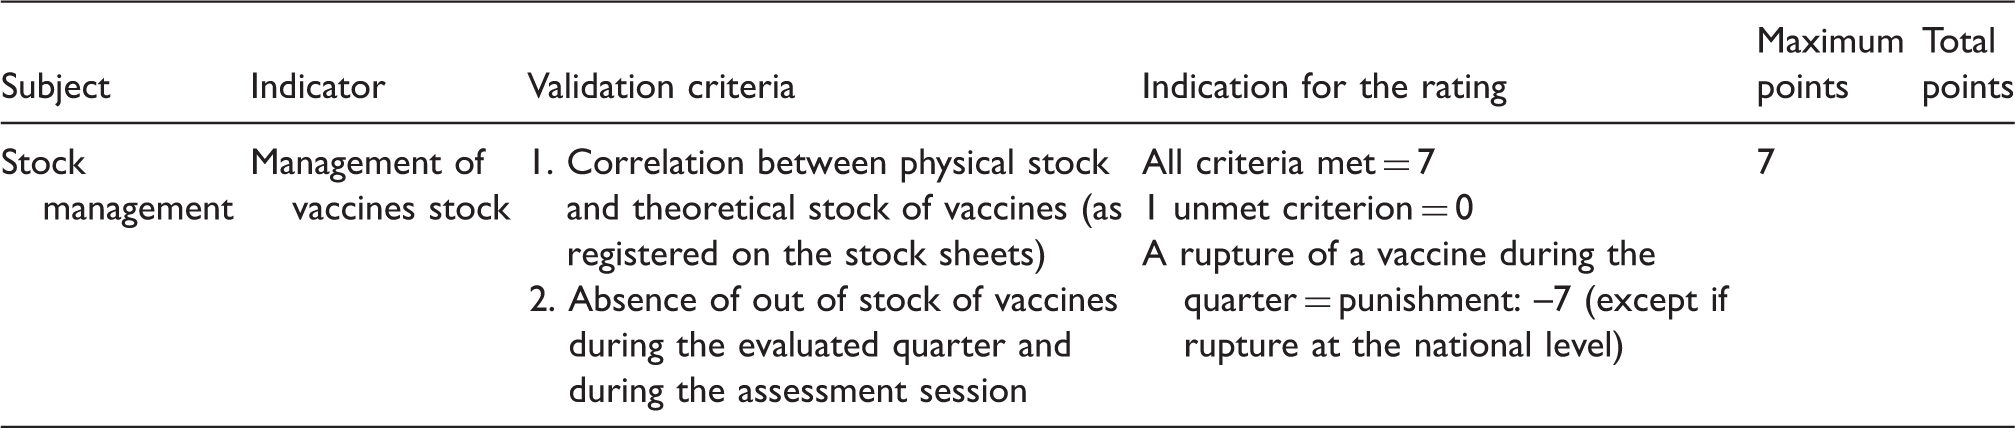
Example of performance indicator for hospital management as developed in the Rwandan PBF for the DHs: management of drugs, consumables and vaccines.
Example of performance indicator for HC support as developed in the Rwandan PBF for the DHs.

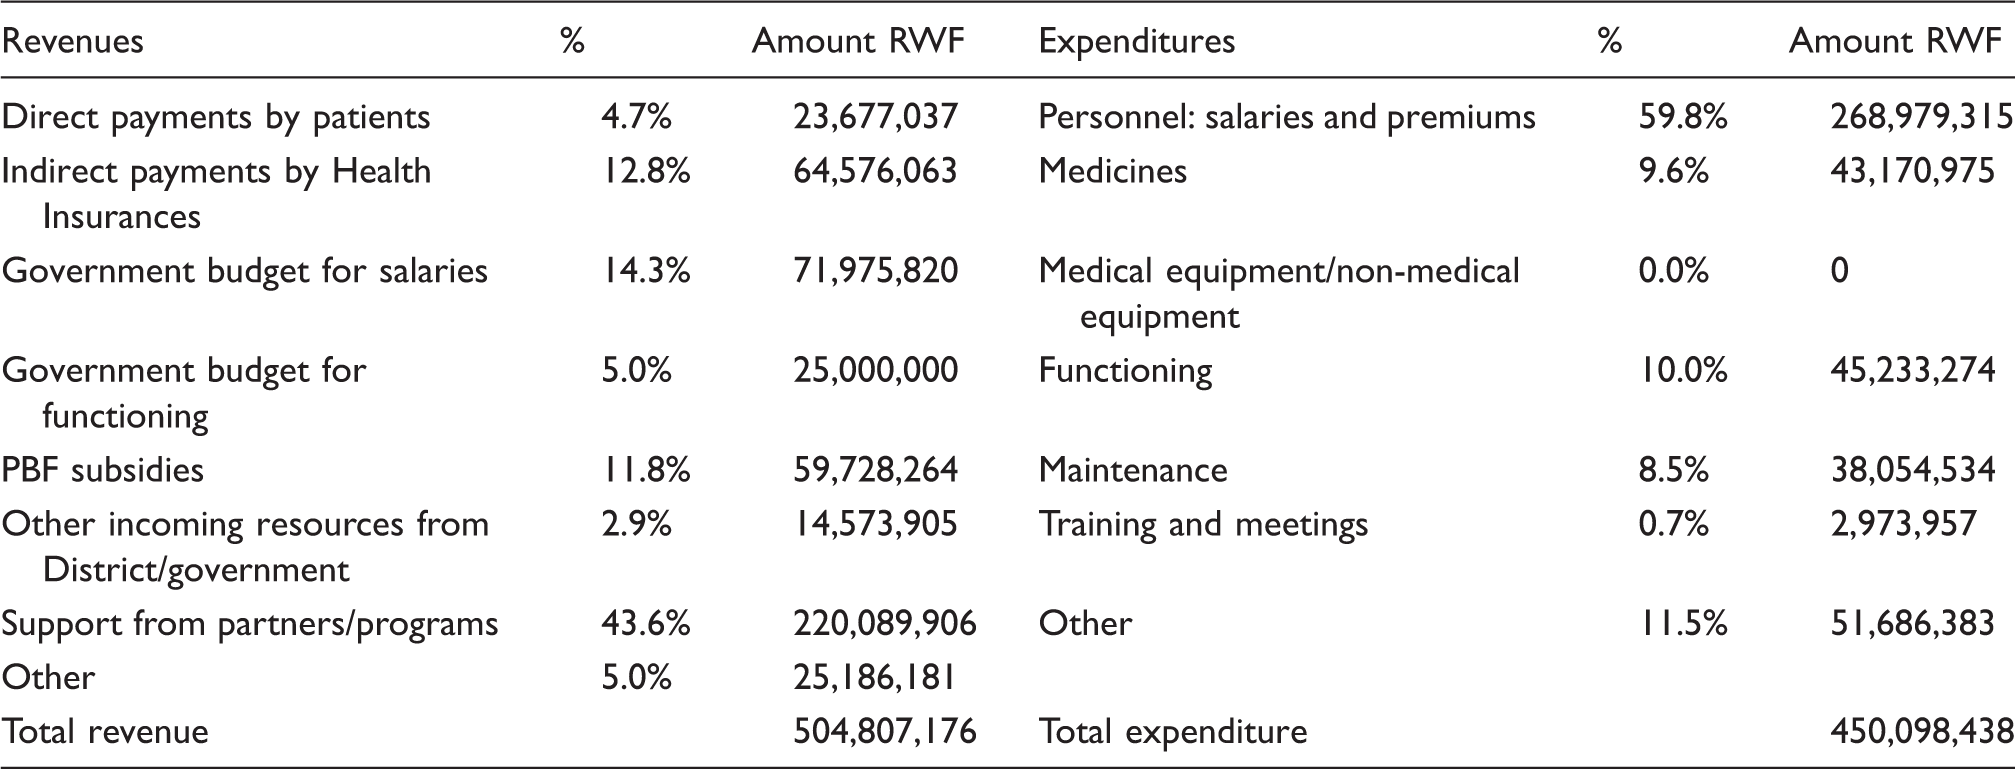
Income and expenditure of the Hospital of Nyamata, fiscal year 2007–2008.
The hospital management component covered the following: human resource management and capacity development; management of drugs, consumables and vaccines; equipment management; quality assurance; self-assessment activities; archiving and hygiene at the hospitals (Table 2).
HC support covered the quarterly evaluation of HC in the catchment area of the hospital, namely HC supervision, analysis of their health data, training, quality control of thick smear and sputum examinations, and HC supervision by medical doctors (Table 3).
The clinical component covered referral consultations by medical doctors, including pregnant women, family planning, imaging and complementary examinations, inpatient hospital activities (internal medicine, paediatrics, surgery and the maternity ward), physical therapy and dental surgery, and daily staff meetings.
The evaluation grid was the same for all hospitals. A total of 52 composite indicators were followed up. The grid was revised twice during the study period, in 2008 and 2010. Those revisions aimed at improving the indicators to make the evaluation criteria more specific, precise and measurable. These revisions also permitted PBF to be adapted to changing needs observed at the hospital level or to higher quality standards. For example, dental care indicators were added later to reflect the change in hospital norms. Such changes automatically resulted in lower scores, owing to higher quality requirements after the revision. Nevertheless changing an indicator for the same service in general led to initial lower scores, the hospital teams not being familiar from the start with the changes.
The performance evaluation process
In 2006, in the start-up phase of PBF in Rwanda, a ‘monthly’ performance evaluation was conducted, run by a team of MoH evaluators. In 2007, MoH opted for ‘quarterly’ assessments by peer-evaluation teams from other hospitals, supported by technical coaches of the MoH coordination unit for PBF. Each team of peer evaluators was composed of the hospital director, administrator, head of nursing and chief HC supervisor. The evaluated hospital initiated the process with a self-assessment, using the evaluation grid for the three components. The next step was peer evaluation, where the peer evaluators worked together with heads of services on the basis of information made available. In general, the peer review took a whole day. Peer evaluators gave immediate feedback. Self-assessment was compared with peer evaluation. Each evaluation ended with a summary of observations and recommendations for each component, signed by the peer-evaluator’s team leader and the hospital director.
Data collection
During the study period, all data were collected on a quarterly basis for the 52 composite indicators: number of services performed, quality score per service, total points per indicator, total score per component, total amount of the quarterly attributed financial subsidy. In the graphs, median values for the quality score (%) were used.
Financing of PBF
A maximum of 20% of the PBF budget went to hospital management, a maximum of 25% to support to health centres and up to 55% to clinical activities.
For the hospital management and for the support to the health centres, the maximum budget depended on the profile of the hospitals: staff, volume of activities and number of health centres to be supported. For these components, PBF did not pay for quantity but only for quality, in order to avoid multiplication of the number of meetings or supervisions to obtain more subsidies. For clinical activities on the other hand, the budget was awarded to each hospital according to the level of performance (quantity + quality) respecting the principle that the same activity was paid similarly in all hospitals in the country.
Depending on its performance, the hospital received its collective subsidy at the end of each quarter. Every hospital management team autonomously decided on the utilisation of the subsidy.
Results
Quantity of clinical services
Only for clinical activities was quantity taken into account to score points. Figure 1 shows the quantitative and qualitative evolution of the number of Caesarean sections per quarter (one of the indicators in the clinical activities component) for Ruli Hospital between 2006 and 2010. The total number of Caesarean sections more than doubled from 60 to 140 in these 5 years, whereas the numbers of validated Caesarean sections rose from 55 to 100.
Evolution of the number of caesarean sections in quantity and quality, Hospital of Ruli, 2006–2010.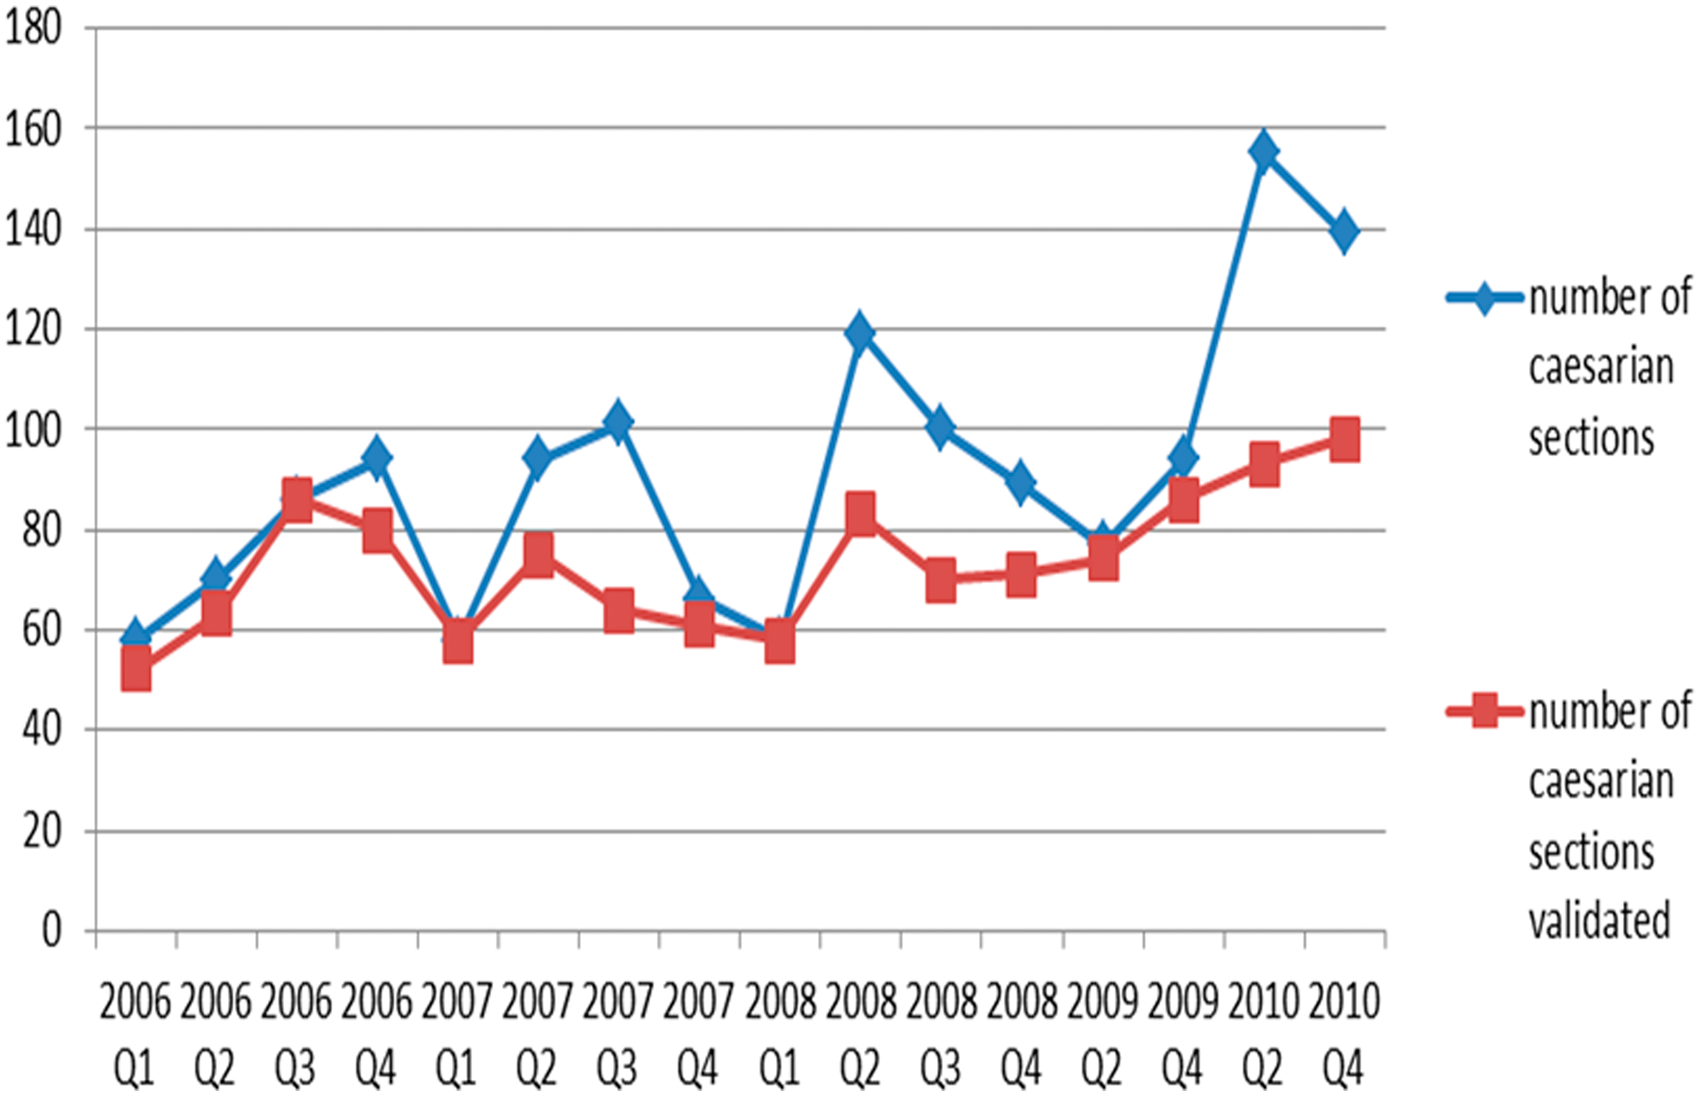
Quality of services
The general trend for the quality of hospital management (Figure 2), of health centre support (Figure 3) and of clinical activities (Figure 4), was that the hospitals achieved a level of quality score between 70% and 95% already in 2007. This success was achieved in approximately 12–24 months after PBF was set up. In 2008, a downward trend of the quality score was noted owing to changes made in the quality criteria in the new evaluation grid as explained in the methodology. In 2009, quality achieved again a level comparable to 2007. In 2010, a new revision of the evaluation grid brought about a new drop in quality scores comparable to the 2008 level.
Evolution of the quality score for the hospital management component in the 4 district hospitals (2006–2010). Evolution of the quality score for the component support to the Health Centers by the 4 district hospitals (2006–2010). Evolution of the quality score for the clinical activities component in the 4 district hospitals (2006–2010).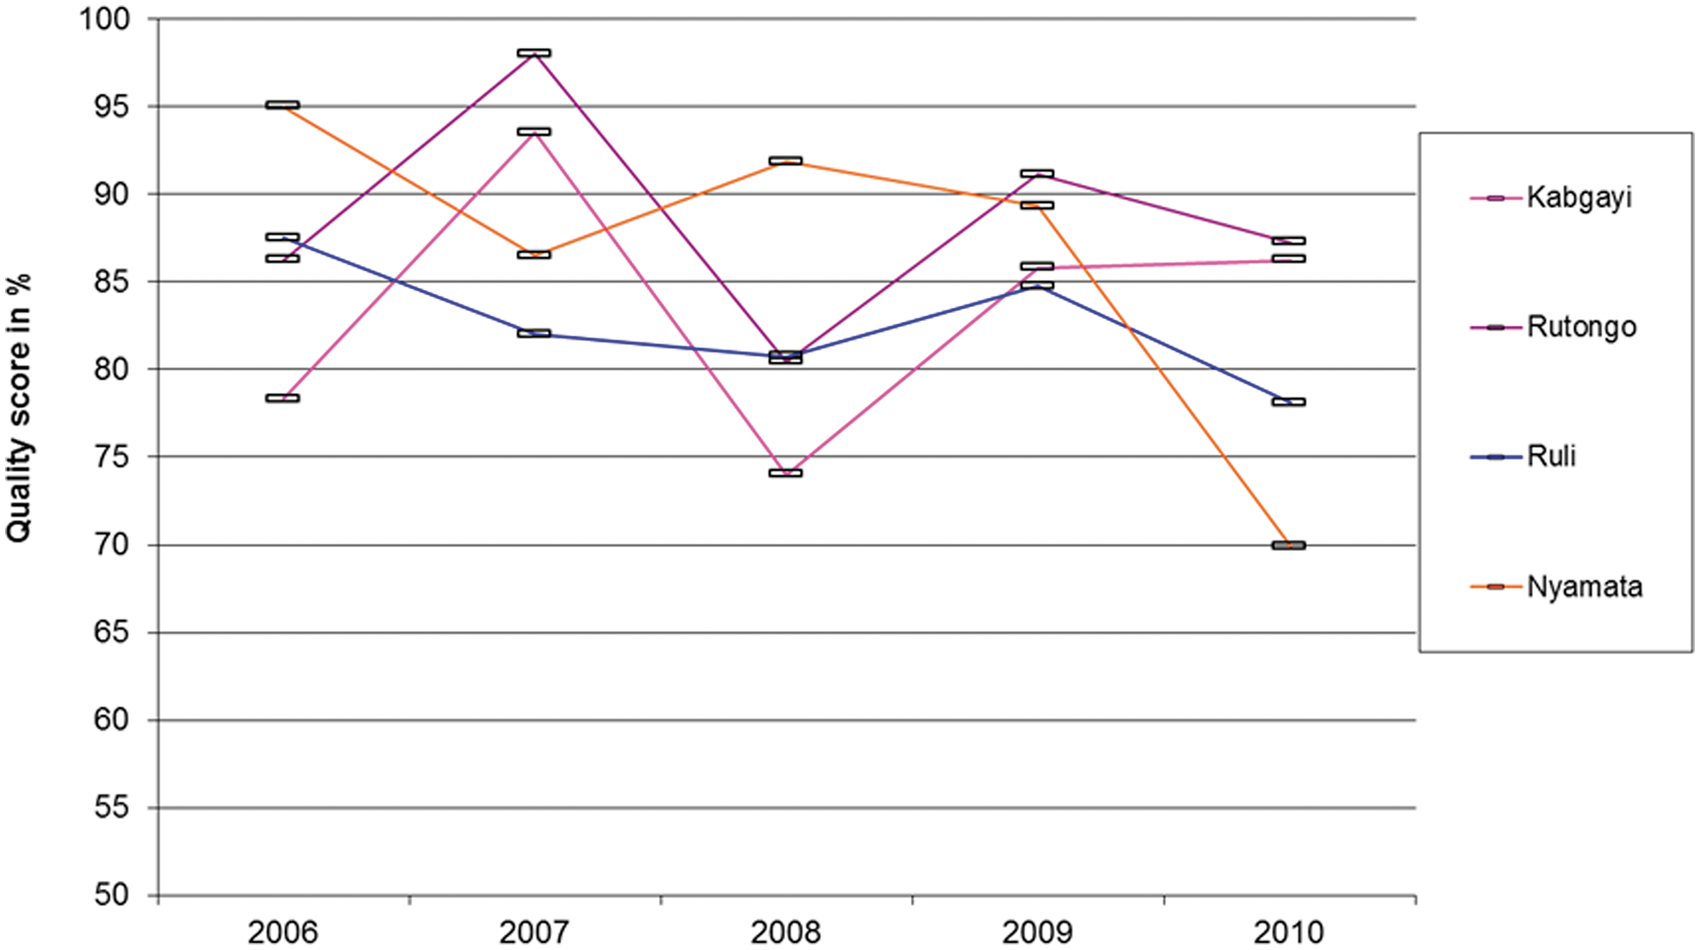


For hospital management, there was a global trend towards improvement in three of the four hospitals after 2008. Nyamata Hospital showed a severe drop after 2008 of 20% between 2008 and 2010. HC support improved between 2006 and 2010 in all studied hospitals, stabilising at 90% for all four hospitals. For clinical activities, an upward trend was confirmed in three of the four hospitals. Nyamata hospital again dropped between 2008 and 2010 by 20%.
As well as the observed results, PBF was noted to induce a behavioural change in the studied sites by introducing mechanisms to take initiatives, resulting in better performance (appropriate archiving, additional staff recruitment, improved welcoming conditions for patients.) or developing new services (installation of a dental surgery, physiotherapy services). During the 5 years of implementation, encouraging results were achieved.
Nonetheless certain difficulties were noted: the interpretation of indicators and their targets, especially at the start, was open to confusion; the non-standardisation of medical files and forms in the hospitals complicated the gathering and uniform interpretation of information; the evaluation grids were initially too complex; the attitude of certain evaluators was not systematically focused on the learning process for the evaluated district health teams; subsidies were considered insufficient in relation to the efforts made; there was a multiplication of administrative meetings sometimes compromising other important clinical work; activities that were not included in PBF evaluation were relatively neglected by health staff.
Financing hospital performances
For the four hospitals studied, the allocation for the 2006–2008 period amounted to US$0.51 per capita per year, with US$0.39 for the payment of PBF subsidies and US$0.12 for the implementation of PBF (training, verification costs for the hospital staff and MoH supervision). The PBF subsidies represented between 11% and 13% of the total hospital revenue in 2008, 7 and allowed staff salaries to be increased by 23% to 37%. For the fiscal year 2007–2008, Table 4 demonstrates this with the example of Nyamata hospital. Subsidies were distributed among staff following criteria of qualification and seniority that captured their relative contribution. Some of the subsidies were used for the operational costs of the hospital, but this proportion remained relatively low in Rwanda and varied between hospitals (between 2% and 20% of subsidies).
Discussion
Before starting the PBF approach in DH in 2006, guidelines, manuals, norms and standards had to be developed as well as the evaluation grid pertaining to quality and quantity. Procedures for monitoring and supervision were agreed upon. Subsequently, PBF effectively started in a dynamic way.
Quarterly DH screening of the three components, covering all essential hospital activities, made regular monitoring and evaluation possible in a standardised fashion. Quality was followed up as well as the problem-solving capacity of the hospital management teams. The quarterly self-assessment exercise by hospital staff appeared to be crucial in the learning process, especially when submitted to the peer evaluators and compared with their own external observations. This induced a continuous and dynamic learning process. Peer evaluation was probably one of the most important innovations in the Rwandan approach, because it offered a vital opportunity for shared learning and of initiating improvements, and confirmed that simple dissemination of written guidelines is often ineffective but supervision and audit with feedback is generally effective. 10
The analyses conducted on the quality of services showed that the continuity of care for patients improved, with better interactions between all levels of care through improved referral and counter referral mechanisms. HC technical support, which in Rwanda was under the responsibility of the DH, was effective. The frequency and quality of supervision conducted by the hospitals were guaranteed. It was observed that PBF brought new dynamism to the continued interaction between DH and HC, and that HC support was regularly provided thanks to PBF. Informative supervision and feedback certainly gave HC a mechanism to improve the quality of their services.
PBF brought a net improvement in the hospital management in three of the four DHs in terms of regular meetings, improved archiving, sound reporting on health data as well as rigorous management of the pharmacy to avoid a breakdown in stocks of essential medicines. For the fourth hospital, the changes in the hospital management team, with high staff turnover, led to lower performances. This indicates that good leadership and stable, committed management teams are a critical success factor for PBF.
The quantity and quality of clinical activities based on documentary evidence and verified by peer review considerably improved.
However, the question arises whether these results achieved only because of financial incentives? Literature identifies these as key elements in triggering motivation among health workers but they are neither the most important nor sufficient to achieve substantial improvements in service delivery or a change in behaviour. 11 Strengthening other components of the health system, such as data collection, monitoring and supervision, self-assessments and peer review contributed in our opinion in an important way to the results. Moreover, PBF helped to clarify the responsibilities and roles of all parties involved in the production, monitoring and evaluation of health services. This was achieved through the introduction of contracting-in mechanisms with clear definitions of the roles and the responsibilities of all parties, the monitoring system used, the outputs to be purchased, financial incentives provided and the conditions for payment to the health facility.
Given the multiplicity of health initiatives in Rwanda, in particular the community health insurance schemes covering all levels of healthcare, implemented since 2002 in all districts with an increasing adherence of the population, and other national health sensitisation campaigns, it was difficult in this study setting without a control group, to isolate the effects linked exclusively to PBF. Given the continuous quality improvement of delivered health services (outputs) at the level of the studied DH, we assume that there was a real impact on morbidity and mortality.
For the future, challenges remain. The dynamism of PBF will require continuous consideration about mechanisms to avoid system ‘sclerosis’ and the appearance of perverse effects, such as neglect of non-monitored activity or the overproduction on non-justified services. Moreover, regular revision and adaptation of the evaluation grid, and regular rotating hospital peer evaluations across the board are needed to avoid cronyism. Finally, optimisation of the articulation between PBF, health insurance schemes and accreditation programmes remain a key element for further successful development of the health systems.
Footnotes
Conflict of interest
None declared.
Funding
This research received no specific grant from any funding agency in the public, commercial, or not-for-profit sectors.