
Abstract
Chronic hepatitis C (HCV) patients commonly have insulin resistance which is a risk factor for disease progression. Oesophageal varices may bleed with high mortality. We aimed to assess the relationship between insulin resistance and oesophageal varices. HCV-related compensated liver cirrhosis patients (n = 146) underwent gastroscopy and homeostasis model assessment (HOMA)-IR, HOMA-β and HOMA-S calculations. Their average age was 54.98 years; most (84.9%) patients were men and non-diabetic (60.3%). Patients with oesophageal varices had higher median Model for End-Stage Liver Disease (MELD) scores and comparable Child-Pugh class. Patients with and without oesophageal varices had comparable (P > 0.05) HOMA scores and insulin resistance percentage of 82.9% versus 85.5%. We therefore conclude that insulin resistance is unrelated to the presence of oesophageal varices.
Introduction
Portal hypertension is a consequence of liver cirrhosis and is associated with various complications such as ascites, hepatic encephalopathy, portopulmonary hypertension and oesophageal varices. 1 There are many theories concerning their development including increased intrahepatic vasoconstriction, fibrous deposition around the intrahepatic portal venules, splanchnic vasodilation and, recently, chronic inflammatory status.1,2
There is interplay between insulin resistance (IR) and liver disease. IR was accused of producing a decreased response to pegylated interferon-ribavirin therapy in patients with chronic hepatitis C virus (HCV), although this is not the case with newer direct acting antiviral drugs. 3 It is also linked to liver steatosis and fibrosis, and is thought to be a risk factor for oesophageal varices and hepatocellular carcinoma.4,5
Patients and methods
Our study was conducted at the National Liver Institute Hospitals, Menoufia University, Egypt between 2016 and 2018. All patients signed an informed consent after approval of the institutional review board. All patients with HCV-related compensated liver cirrhosis were included (n = 146). Non-HCV-related liver disease, Child-Pugh B and C patients, ascites, hepatocellular carcinoma, patients on beta-blockers, prior variceal endoscopic management and history of HCV treatment were all excluded.
A full history was taken and a complete physical examination was performed. With a full blood count, liver and renal function tests, and coagulation screen, the Model of End-Stage Liver Disease (MELD) score was calculated. Liver cirrhosis was diagnosed according to clinical, radiological and transient elastography values measured by FibroScan 6 and liver biopsy, if not contraindicated. 7
All patients underwent diagnostic gastroscopy for oesophageal varices screening. They were divided into two groups according the presence of oesophageal varices, described as risky and non-risky, according to the presence of the red colour sign (viz. red wales, cherry red, haematocystic or telangiectatic spots). 8
All were tested for IR measured by the homeostasis model assessment of insulin resistance (HOMA-IR), HOMA-β% and HOMA-S%, according to standard calculations (Footnote A ).
Data were statistically analysed using SPSS Statistics® version 21 for Windows (IBM Corporation, Armonk, NY, USA). Data are expressed as mean ± standard deviation for normal distributed data, median (interquartile range) for data lacking normal distribution and n (%) for nominal data. All P values are two-tailed, with values < 0.05 considered statistically significant. Comparisons between two groups were performed using the Student’s t-test for parametric data and Mann–Whitney test for non-parametric data. χ2 and Fisher’s exact test were used for categorical data analysis.
Results
Comparison of patients with and without oesophageal varices.

Data are expressed as mean ± standard deviation for normal distributed data, median (interquartile range) for data lacking normal distribution and n (%) for nominal data.
The average age was 54.98 years (age range = 27–70 years) and most patients were men (84.9%) and non-diabetic (60.3%). The median BMI was 28.7 kg/m2. Patients with oesophageal varices had higher median MELD scores: 9 (range = 2–16) vs. 7 (range = 2–12). Those with and without oesophageal varices had comparable (P > 0.05) HOMA scores (Figure 1): HOMA-IR = 3.68 (2.88) vs. 3.76 (2.32); HOMA-β = 11,196.5 (10,786.5) vs. 12,093.5 (9148.75); HOMA-S = 31.55 (3.58) vs. 31.45 (2.68); and IR percentage (82.9% vs. 85.5%). There was neither any statistically significant difference (P > 0.05) with or without risky oesophageal varices as regards HOMA-IR, HOMA-β and HOMA-S, MELD and Child-Pugh scores.
Comparison of the HOMAs in patients with and without oesophageal varices.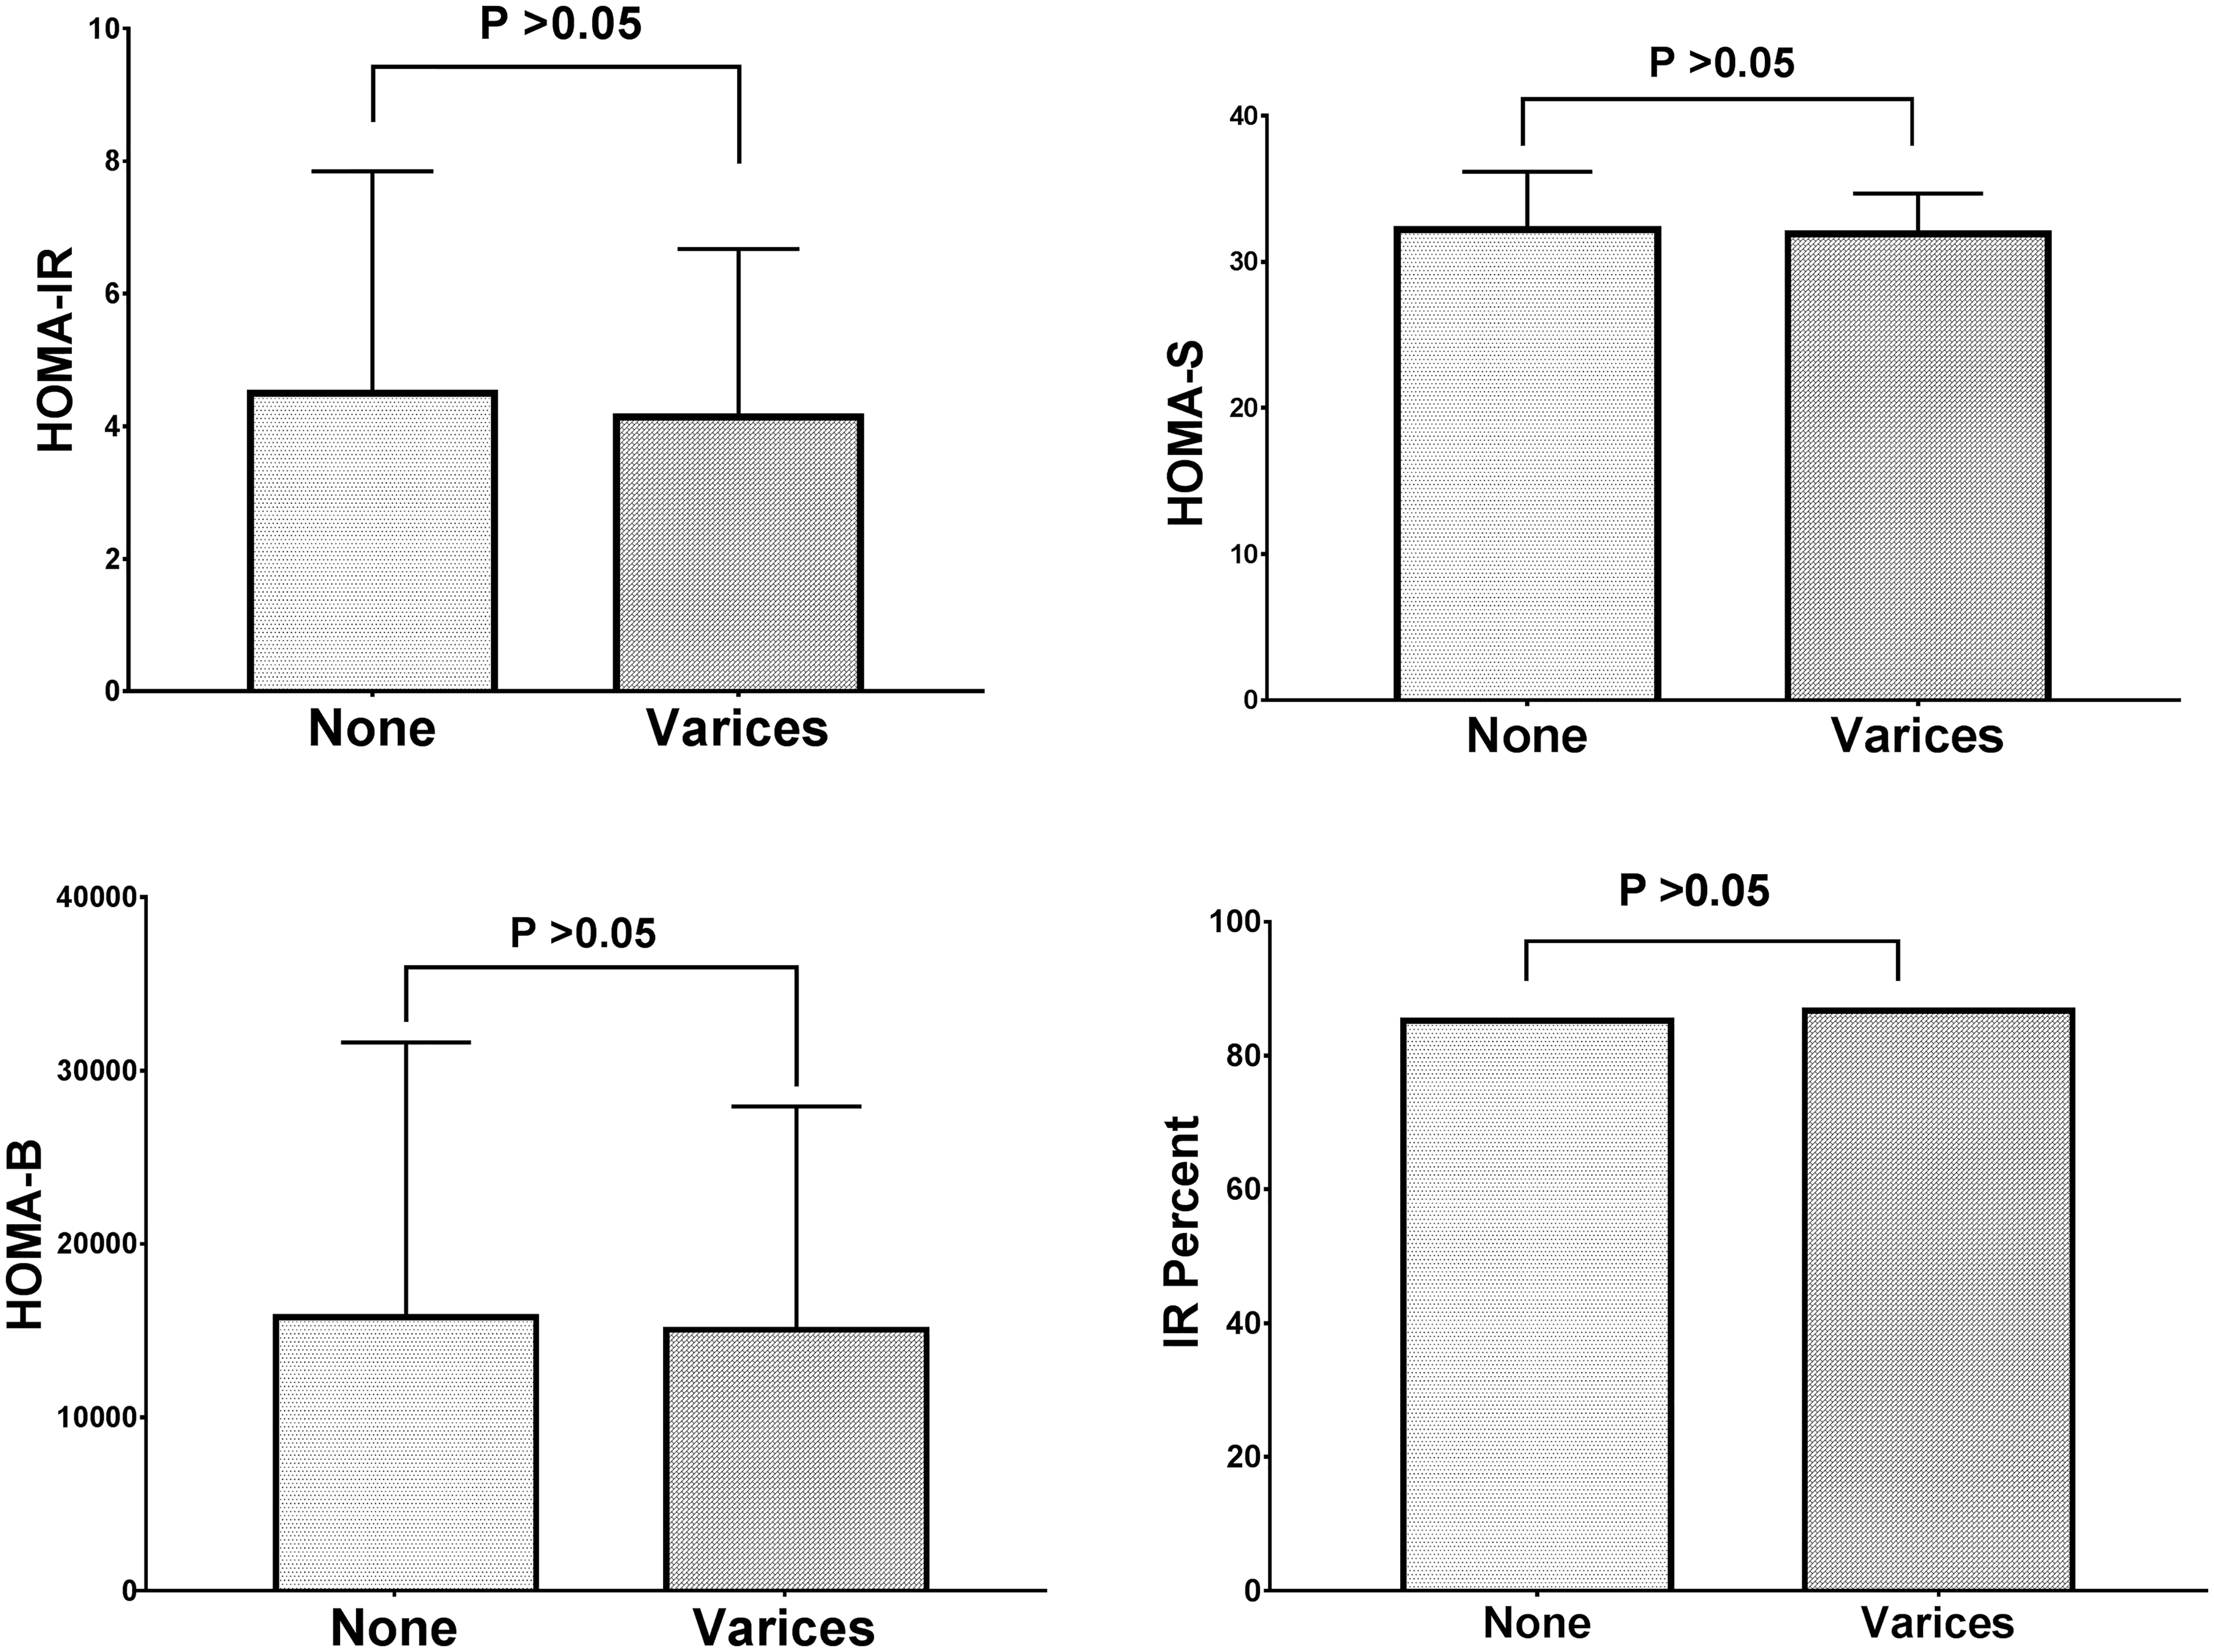
Discussion
The pathogenesis of portal hypertension is complex. There is increased intrahepatic resistance due to both static component and dynamic components (increased intrahepatic vasoconstrictors and decreased vasodilators), splanchnic vasodilation, bacterial translocation and volume overload. New theories of pathogenesis are being elaborated, such as the inflammatory theory, in which cirrhosis is considered a systemic inflammatory multi-organ disease owing to the release of the pathogen-associated molecular patterns from the intestine and a deranged immune response with an excessive inflammatory response. 2
Few reports have discussed the impact of IR on oesophageal varices development. The first study 12 included 104 patients with HCV genotype 1 compensated cirrhosis. Most patients were Child-Pugh A and few were diabetic (26%). Patients with oesophageal varices (60.6%) had higher liver stiffness values and HOMA-IR. A HOMA-IR > 3.5 had 61% sensitivity and 76% specificity for oesophageal varices discrimination although the area under the receiver operating characteristic curve is 0.671, which is of poor statistical discrimination.
A small (n = 53) Japanese study 13 evaluated the correlation of IR and the portal hypertension haemodynamics assessed by Doppler and hepatic vein catheterization. IR was defined as HOMA-IR > 3. In fact, the study was heterogeneous for the aetiology of the liver disease (30% had HCV) and the degree of liver dysfunction (Child-Pugh C > B > A). Some patients were ascitic and some had gastric varices. He excluded diabetic patients. Patients with HOMA-IR > 3 had higher MELD scores, wedged hepatic venous pressure, hepatic venous pressure gradient and portal flow volume. On application of the HOMA2-IR, only the portal flow volume was statistically significant; therefore, the authors reported that IR is mainly associated with collaterals formation.
In a study that included patients (n = 106) with alcoholic liver disease, 14 the hepatic venous pressure gradient was measured and HOMA2-IR was used for IR definition. Most patients were decompensated (73.8%, 26% Child-Pugh A), 72.3% had varices, 56.7% were ascitic and 42.3% had history of hepatic encephalopathy. Only in patients with compensated cirrhosis did the IR correlate weakly with hepatic venous pressure gradient (r = 0.42). HOMA2-IR was higher in patients with oesophageal varices 2.10 (range = 1.39–3.20) vs. 1.48 (range = 0.76–2.48).
Another small study 15 (n = 60) recorded IR measured by HOMA-IR in HCV patients. HOMA-IR was higher in patients with oesophageal varices compared to those without. Furthermore, HOMA-IR was higher in patients with large varices than small varices.
To our knowledge, our study is the first to refute the association of IR and oesophageal varices (n = 146). The number of enrolled patients (n = 146) in our study was higher than in others.12–15 We used the HOMA-IR model in accordance with other studies,12,13,15 unlike others13,14 who used the HOMA2-IR model. All our patients had HCV and compensated cirrhosis while other studies had a mixed aetiology, 13 alcoholic hepatitis 14 or decompensated cirrhosis.13,14 In addition, we used other models for IR assessment as the HOMA-β and HOMA-S.
We uniformly found comparable HOMA-IR, HOMA-β, HOMA-S and IR percentage; moreover, no HOMA value could statistically reliably differentiate the presence of risky signs in those patients with oesophageal varices.
The limitations of our study are the relatively small number of patients, a single-centre experience, absence of invasive haemodynamics measurement and exclusion of patients with advanced liver disease (Child-Pugh C) or mixed aetiology.
Nonetheless, we maintain that IR is not a risk factor for oesophageal varices in patients with HCV.
Footnotes
Abbreviations
HOMA: Homeostatic Model Assessment IR: insulin resistance MELD: Model of end stage liver disease.
Declaration of conflicting interests
The author(s) declared no potential conflicts of interest with respect to the research, authorship, and/or publication of this article.
Funding
The author(s) received no financial support for the research, authorship, and/or publication of this article.