




Abstract
In many situations, data are available at some aggregate level, but one wishes to estimate the individual-level association between a response and an explanatory variable (or variables). Unfortunately, this endeavor is fraught with difficulties because of the ecological level of the data. The only reliable approach for overcoming the inherent identifiability problem associated with the analysis of ecological data is to supplement the ecological data with individual-level data. In this article, the authors illustrate the benefits of gathering individual-level data in the context of a Poisson modeling framework. Additionally, they derive optimal designs that allow the individual samples to be chosen so that information with respect to a particular model is maximized. The methods are illustrated using Robinson’s classic data on illiteracy rates. The authors show that the optimal design, if used with an appropriate model, produces accurate inference with respect to estimation of relative risks, with ecological bias removed.
1. Introduction
Ecological inference, the attempt to make inferences about individuals with aggregate data, is well known to be problematic, with ecologically biased estimates being the usual consequence of relying on aggregate data. As we will subsequently discuss, there are many difficulties with the analysis of ecological data, a major problem being that ecological data do not directly supply information on associations of interest and that so many different explanations are consistent with the observed data; it is this identifiability problem we address in this article. The description of the ecological inference problem has a long history, with an early influential article in the social sciences literature being that of Robinson (1950) and continuing with Duncan and Davis (1953), Goodman (1953, 1959), and Selvin (1958). A famous early example of the potential pitfalls of the analysis of ecological data was provided by Durkheim (1897); for an interesting substantive discussion of Durkheim’s hypothesis on the association between religion and suicide, see van Poppel and Day (1996). There is now a vast literature on characterization of the different forms of ecological bias (Piantadosi, Byar, and Green 1988; Greenland and Morgenstern 1989; Greenland 1992; Richardson 1992; Greenland and Robins 1994; Wakefield and Salway 2001). The shortcomings of ecological inference have been well-documented (Achen and Shively 1995; Cho 1998; Freedman et al. 1998). The generic problem of the distortion of associations by aggregation is closely related to Simpson’s paradox (Simpson 1951), and this aspect was explored by Wakefield (2004). In the geography literature, a closely related problem to that of ecological inference goes under the name the modifiable areal unit problem; see Gelfand (2010) for a discussion of this literature. Anselin and Cho (2002) provided a discussion of the links between spatial effects and ecological inference as well as describing a range of plausible spatial models.
The most reliable approach to the identifiability problem of ecological inference is to obtain individual-level data, though combining these data with ecological data requires care, because the two data sources may not be comparable. One possible route of analysis would be to make inference on the basis of individual data alone. However, it is inefficient to ignore ecological data during analysis, because such data are usually aggregated from a large number of individuals and therefore provide a great deal of information. This information can often be incorporated in an analysis through multilevel modeling (Hox 2010; Snijders and Bosker 2011) and other techniques that model the aggregations directly. Furthermore, ecological data may inform the sampling of individual-level data, effectively reducing the cost of data collection. In this article, we consider these issues in the context of a Poisson modeling framework that is widely applicable for a rare binary response; many binary disease outcomes may be modeled within this framework.
We specifically address two questions:
How can we reduce ecological bias by combining ecological data and subsample data?
If ecological data are readily available, as is frequently the case, can we design an optimal subsample of individual-level data to maximize the information about parameters?
In its most inclusive definition, ecological inference is usually an attempt to estimate individual-level parameters with data that have been aggregated from the individual level (to give ecological data). Not surprisingly, this is a difficult inference problem, and within the research community, two extreme positions have often been taken with respect to the identifiability issues: those who disdain to use any ecological inference and advocate inference based on the sampling of individuals (Freedman et al. 1991) and those who attempt ecological inference through model assumptions or a description of the possible biases (King 1997). With respect to this latter stance, many models have been proposed for inference (Goodman 1953; King 1997; Cho and Gaines 2004; King, Rosen, and Tanner 2004; Wakefield 2004), though it has been recognized that the assumptions required for valid ecological inference are not checkable from the available ecological data (Freedman et al. 1991; Achen and Shively 1995; Cho 1998; Wakefield 2004). A position between these extremes is to recognize that individual-level data can be used to unlock the ecological information, and a number of different approaches have been suggested (Prentice and Sheppard 1995; Judge, Miller, and Cho 2004; Wakefield 2004; Jackson, Best, and Richardson 2006, 2008; Glynn et al. 2008; Haneuse and Wakefield 2008; Wakefield and Haneuse 2008).
In this article, we extend this literature on the benefits of gathering individual-level data in the context of a Poisson modeling framework. We develop a likelihood approach to combined inference with ecological data and small samples of individual-level data, and we derive optimal designs that allow the individual samples to be chosen so that information is maximized. This will be particularly useful with rare binary outcomes, when case-control sampling is not possible. Given the intrinsic lack of identification and lack of reliability associated with the use of ecological information on its own, the methods developed in this article provide a low-cost approach to more credible inferences.
Finally, much of the current sociological literature avoids the problems of ecological inference by using a few very large surveys, often analyzed within a multilevel model framework; for example, see some of the recent literature on wages and employment (Kalleberg 2009; Brand and Xie 2010; Kim and Sakamoto 2010; Mouw and Kalleberg 2010; Western and Rosenfeld 2011). The techniques we discuss in this article demonstrate that additional avenues for research might be opened when small surveys of individuals can be effectively combined with ecological data to make reliable inferences, if one is careful to check the appropriate assumptions. The use of population-level information to improve survey estimation is common, with particularly popular techniques being poststratification and raking (Lumley 2010, chap. 7). We now describe a motivating example.
2. Ecological Bias in the Estimation of the Effect of Jim Crow Laws
We consider the canonical example of ecological bias in the data on black illiteracy rates in the United States in the 1930s. More specifically, we consider the effect of Jim Crow laws on black illiteracy using the original data from Robinson (1950). These data contain a binary illiteracy indicator and race and nativity (coded as foreign-born white, black, or native-born white), at the level of the individual, across the United States, along with the presence or absence, in each state, of Jim Crow segregation laws for education. In the original article, Robinson demonstrated the very different correlations that result between illiteracy and race depending on the level of spatial aggregation of the data. The data have generated a great deal of interest, including the recent set of articles reanalyzing the data set in the International Journal of Epidemiology (Firebaugh 2009; Oakes 2009; Subramanian et al. 2009a, 2009b; Wakefield 2009), as well as an article in the same journal reporting errors in Robinson’s data (Grotenhuis, Eisinga, and Subramanian 2011).
The estimation of the association between illiteracy and Jim Crow laws is an example of an association at the level of the group (area). Such associations are often of interest, with a particular example being a contextual effect. It has been shown (Greenland 2001) that the ecological inference problem persists even when the goal is to estimate the association between an outcome and a contextual variable. A contextual variable represents a characteristic of individuals in a shared neighborhood or group, and the estimation of the associations with multiple levels of variable is important in many disciplines, including epidemiology (Greenland 2001), public health (Diez-Roux 1998), and sociology (Blalock 1984).
We first observe that even with the full individual-level data, estimating the effects of Jim Crow laws on black illiteracy is difficult because the Jim Crow states tended to be quite different from the non–Jim Crow states. For example, the Jim Crow states had an average black population proportion of 20 percent, whereas the average black population proportion among the non–Jim Crow states was only 1.5 percent. Similarly, the average population proportion of foreign-born whites was quite different between the Jim Crow and non–Jim Crow states (3.4 percent and 17 percent, respectively). These discrepancies could prove problematic for inference about the effect of Jim Crow laws, because they may reveal important differences between the states that would have existed even if there had been an earlier attempt by the federal government to rein in these laws. As in the article by Oakes (2009), we will attempt to minimize these observed discrepancies (and also unobserved discrepancies) by limiting the Jim Crow states under analysis to those that were not part of the Confederacy during the Civil War: Kansas and Wyoming.
To estimate the effects of Jim Crow laws in Kansas and Wyoming, we match these states to non–Jim Crow states on the basis of the sizes of the black population and of the foreign-born white population. By matching on these variables, we are effectively adjusting for any differences in the literacy of an individual that might be due to the contextual associations of the sizes of the black and foreign-born white populations in that individual’s state of residence. We emphasize that the matching is not part of our proposed method, in which we supplement ecological data with individual data, but it is carried out for adjustment purposes. This is one way of achieving this objective, with another approach being to include, not to match, these variables within a regression model. In other words, for the discussion in this article, we assume that this has been done properly in order to focus on methods of subsampling. If we do not know all of the confounding variables, or if some of these cannot be measured, or if there is a lack of overlap, then the matching exercise will not be successful. Additionally, we risk losing information by using a matching approach that leaves out data, instead of using modeling techniques to adjust for confounders. These issues are considered in the discussion.
On the basis of the matching variables, Indiana is the only reasonable match for Kansas. Both Kansas and Indiana have black populations of 3.5 percent and foreign-born white percentages of 4.6 percent and 4.9 percent, respectively. All other non–Jim Crow states with black populations of about 3.5 percent have much higher percentages of foreign-born whites (e.g., Michigan is 20.9 percent foreign-born white). Additionally, Nevada is the best match for Wyoming. Both states have black populations of 0.6 percent and foreign-born white percentages of 15.6 percent and 13.1 percent, respectively. Nebraska and Colorado would also be reasonable matches for Wyoming, having foreign-born white populations of 10.8 percent and 10.4 percent, respectively, but they both have slightly higher black populations (1.0 percent and 1.1 percent, respectively). This restriction to the data from four states limits only the generality of the results but maximizes the internal validity of the analysis. Also, to the extent that we expect the effects of Jim Crow laws to be larger in the Confederate states, an analysis of Kansas and Wyoming may provide a lower bound on the effect for those states. Appendix A contains the full data for these four states.
In an ecological analysis, only the state-level illiteracy rates would be available, but with the individual-level data, we can break down the illiteracy rates by race. Figure 1a presents the results of a straightforward empirical analysis using only the ecological data on illiteracy rates (without the racial breakdown). In the figure, we plot the logarithm of the state illiteracy rate on the vertical axis, with the Jim Crow state indicator on the horizontal axis. The log rates are used to align this empirical analysis with the Poisson model used later. Because we have matched the Indiana-Kansas pair and the Nevada-Wyoming pair on percentage black and percentage foreign-born white (the ecological covariate data), we simply compare state (log) illiteracy rates within the pairs. (Model-based estimates would be very similar because of the matching.) From Appendix A, the illiteracy rates are 1.5 percent and 1.3 percent for Indiana and Nevada (the states without Jim Crow laws) and 0.9 percent and 0.8 percent for Kansas and Wyoming (the states with Jim Crow laws). Surprisingly, Jim Crow laws appear to decrease illiteracy rates for both the Indiana-Kansas pair and the Nevada-Wyoming pair.

Analysis of the effect of Jim Crow laws on black illiteracy rates using ecological and individual data. (a) Analysis using the ecological (i.e., state-level) data. In this analysis, Jim Crow laws appear to decrease (log) illiteracy for both the Indiana-Kansas (matched) pair (3.5% black) and the Nevada-Wyoming (matched) pair (0.6% black). (b) Analysis using the individual-level data. With the data at this level, it is possible to measure black illiteracy for each state and also to use native-born white illiteracy as a baseline for each state. For this example, we perform the analysis by taking the (log) ratio between black and white illiteracy for each state, and Jim Crow laws now appear to increase black illiteracy. Note that as with partial regression plots (also known as added variable plots), the definition of the
We now move to an analysis with the individual-level data. With such data, an analyst can calculate the log of the black illiteracy rates that are the outcome of interest. Furthermore, the analyst can also calculate the native-born white illiteracy rates to use as a baseline or control for the overall level of illiteracy in the state. An intuitive approach to this control that allows presentation on a single plot involves adjusting the log of the black illiteracy rates by subtracting the log of the native-born white illiteracy rate. Model-based approaches that control for native-born white illiteracy will arrive at qualitatively similar conclusions. Figure 1b presents this analysis, and the relationship between Jim Crow laws and black illiteracy is reversed in comparison with Figure 1a. Note that as with partial regression plots (also known as added variable plots), the definition of the
In this more reliable individual-level analysis, Jim Crow laws appear to increase black illiteracy rates in both the Indiana-Kansas and Nevada-Wyoming pairs. 1 Note that although our interests are confined to the black and native-born white illiteracy rates, we must consider all three rates because the foreign-born white rates are included in the ecological data (the state-level illiteracy rates). Examination of the raw data in Appendix A clarifies why we have an example of the ecological fallacy in this example. In the states with Jim Crow laws, the illiteracy rates of the three races are smaller than the illiteracy rates in the matching states without Jim Crow laws in five of six cases (the only comparison for which this is not true is for blacks in Wyoming, for which the illiteracy rate is 4.2 percent compared with 1.5 percent in Nevada). The state illiteracy rates are dominated by the white illiteracy rates, and these are much greater in the states without Jim Crow laws. To summarize, the aggregation has obscured the within-state information on race-specific illiteracy rates.
We conclude that attempts to estimate group-level associations using only ecological data can produce biased results, agreeing with previous discussions (Greenland 2001). Fortunately, although using only ecological data can lead to inaccurate inference, using ecological data in combination with a sample of individual-level data can provide efficiency gains. As we demonstrate in the remainder of this article, (1) the ecological data can be combined with sampled individual data to improve precision with respect to a particular model, and (2) the existence of the ecological data allows efficient sampling designs to be constructed.
3. Combined Inference and Optimal Subsample Design
Within each generic ecological unit (e.g., state), we denote the individual binary outcome as
To analyze the combined ecological and individual data, we use likelihood inference to estimate the regression parameters, which we write as

where
If
Given the combined data likelihood, it is sometimes possible to derive the optimal design of the sample, conditional on the ecological data and on a particular model. The qualification is that we require knowledge of the

The form of the expected information from this likelihood has previously been derived when
4. Application: Estimating the Effects of Jim Crow Laws
In Section 2, we showed that using ecological data to estimate the effects of Jim Crow laws results in ecologically biased estimates. In this section, we use combined inference on the basis of equation (1) and optimal sampling design on the basis of equation (2) to demonstrate that small samples of individual-level data can produce the accurate estimates summarized in Figure 1b.
To reproduce the results in Figure 1b, we need to estimate the ratio between black and white illiteracy rates within each state. This would be possible by taking large random samples of size

where
If we attempt to estimate
Both the combined approach (sample plus ecological) and sample-only approach are based on likelihood inference, and therefore we know that when the standard conditions hold and the samples are large, both will produce accurate estimates of the quantities in Figure 1b. However, it is useful to compare the efficiency of both approaches in small samples. Table 1 compares the combined approach with the sample-only approach by presenting the ratio of standard errors under the two approaches for the estimation of
Ratios of Standard Errors for Estimators of Log Relative Risks in Each of Four States,
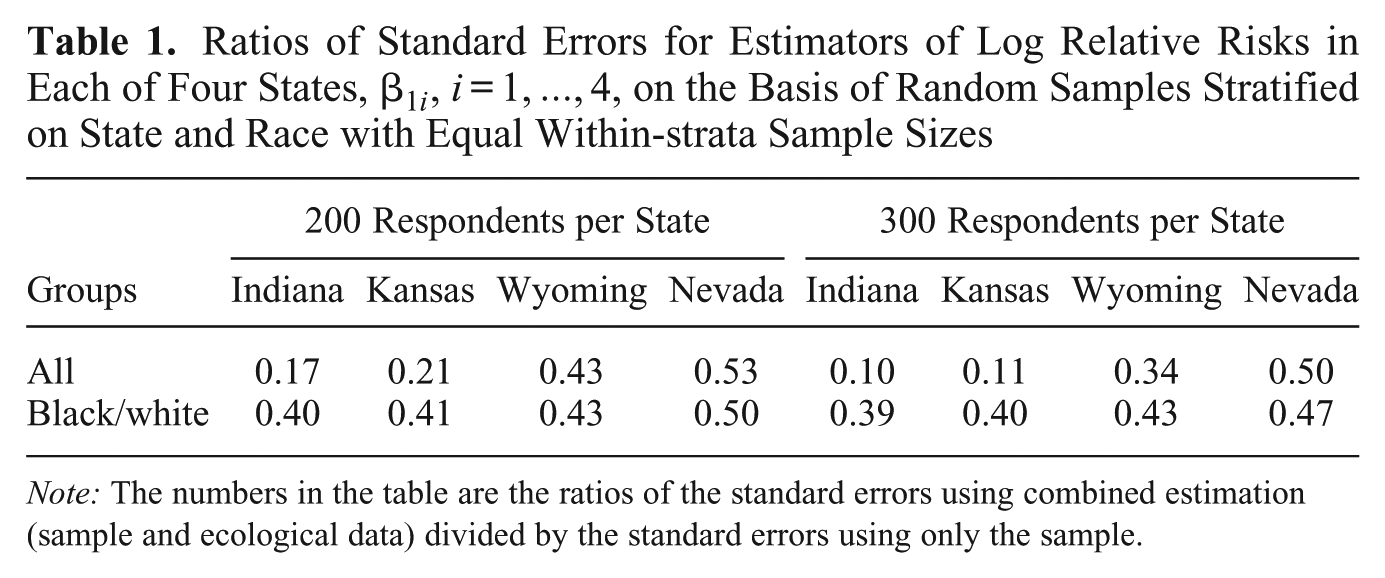
Note: The numbers in the table are the ratios of the standard errors using combined estimation (sample and ecological data) divided by the standard errors using only the sample.
We have illustrated that combined estimation with ecological data reduces the variance for these two types of stratified samples. When ecological data are used to inform the sampling design, the improvement can be more dramatic. To derive the optimal sampling design, we must consider the expected information contained in any sample, conditional on the ecological data. The closed-form expression for expected information in the sample conditional on the ecological data is presented in Appendix B as equation (B4).
We make two observations about the expected information in the sample, conditional on the ecological data. First, the information quantity does not include an intercept term, because conditioning on the ecological data (the state illiteracy rate and the proportion of the population that is white, black, and foreign-born white) has removed this from the expression. This has important consequences for our sampling design, because it means that we need to sample from only two of the three racial categories to estimate the illiteracy rates for all three categories. Second, as in other nonlinear design problems, the expected information is a function of the parameters to be estimated: the parameter of interest (the log ratio between black and native-born white illiteracy rates) and a nuisance parameter (the log ratio between foreign-born white and white illiteracy rates). Therefore, we can determine a range of only optimal designs, and each is dependent on the ratios in illiteracy rates between racial groups.
To pick the optimal design for this example, we first specify a range of likely values for
Optimal Sampling Design to Estimate the Log Ratios between Black and Native-born White Illiteracy Rates within Each

Note: As the log ratios in illiteracy rates approach 0, the percentage of the sample foreign-born white approaches the ecological proportions: Indiana 5%, Kansas 5%, Wyoming 13%, and Nevada 16%. Moderate associations (log ratios between 0 and 2.5) produce allocations between those presented at the extremes.
As we reduce the sizes of the log rates
To assess the benefits of optimally designed combined inference, we compare its performance with combined inference using the native-born white and black samples used in the second row of Table 1, with 300 observations in each state and 50 percent of the sample allocated to native-born white individuals and 50 percent to black individuals. Standard errors from this combined analysis are presented in the first row of Table 3. For combined inference with optimally chosen samples, the design presented in the first two rows of Table 2 was used. Standard errors from this analysis are presented in the second row of Table 3.
Comparison of Standard Errors Using Designs with 300 Observations per State and Using the Ecological Data

Note: Each row shows standard errors for a combined ecological and individual sample. In the first row, 50% black and 50% native-born white samples are sampled within each state. In the second row, the samples are optimally chosen (assuming
The benefit of the optimally designed samples over the random samples is clear. There is improvement for all states, but the benefits are most apparent for the Indiana-Kansas pair, for which the standard errors for the optimal approach are 6 to 7 times smaller than in the random sample case. It is important to note that small changes to all of the estimators considered in this section (e.g., forcing each racial sample to have at least one illiterate individual) can reduce mean square error at the cost of bias, and such changes in the allocation imply that the design considered here may not be optimal (a topic that is explored in detail in the online supplementary material). Therefore, as usual, the benefits of optimal design will have to be weighed against the need for flexibility in the analysis. The equations in Appendix B allow these trade-offs to be partially quantified.
5. Discussion
In this article, we have shown that a small amount of individual-level data can alleviate the identifiability problem of ecological inference that arises when within-area risks are being estimated, as long as an appropriate model is fitted. Furthermore, we have demonstrated that in this context, the ecological data both allow an optimal design to be developed and are beneficial to estimation. Within-area sampling to remove ecological bias is not a new idea. An elegant method to deal with ecological bias on the basis of samples of covariates was described by Prentice, Sheppard, and coauthors in the context of a dietary study (Prentice and Sheppard 1995; Sheppard and Prentice 1995; Sheppard, Prentice, and Rossing 1996). A rationale for this aggregate data design was that when random samples are taken, it is likely that few, often zero, disease cases will be sampled. Hence, the individual covariate information is only used in the analysis, along with the ecological outcomes. Many authors have subsequently suggested ways in which inference from combined samples can be carried out (Jackson et al. 2006, 2008; Glynn et al. 2008; Haneuse and Wakefield 2008; Wakefield and Haneuse 2008). Little work is available on optimal design, however, though for a Gaussian outcome, results have been derived (Glynn et al. 2008). In this article, we have extended this work to the Poisson framework, which is applicable in many social science and epidemiological situations.
In the illiteracy example we considered, we illustrated the benefits of both optimal, as opposed to random, sampling and supplementing individual-level data with ecological information. In this example, it was necessary to sample only two of the three race groups at the individual level. For categorical covariates, this result is true in general, which may be useful when one of the groups of interest is difficult to sample or reach.
We have derived optimal designs in the situation in which the covariate distribution is known in each area, which will often be the case if the covariates consist of demographic variables such as gender, age, and race. In other situations, one may have more limited information (such as the average of a covariate and a measure of the spread). In this situation, one may posit a distribution for the covariate and derive the optimal design on the basis of this assumed form. The optimality of the subsequent design obviously depends on the closeness of the assumed distribution to the true distribution. One would expect that a reasonably informed choice would lead to improved efficiency over random sampling, but this requires further investigation.
All of the discussion in this article has rested on a number of key assumptions, including knowledge of an appropriate individual-level model, random nonresponse, and the Poisson approximation to a rare outcome. These assumptions will clearly be violated for many applications. For example, voting rights litigation often depends on the results from ecological inference (Greiner 2006). Any attempt to randomly sample voters (such as in Greiner and Quinn 2009) will undoubtedly result in nonrandom nonresponse. Therefore, missing data models will need to be appended to the approach discussed here. Furthermore, the outcomes in a voting rights case (turnout and vote choice) are not particularly rare, so analysis based on a Poisson model would not be advisable. Additionally, the analysis considered here depends on choosing appropriate matching variables and appropriate matches. If we believed that matching geographically might be appropriate (in which case geography is being used as a proxy for other variables that are important), then we might have matched Iowa to Kansas and Montana to Wyoming. This would have resulted in a negative estimated effect of Jim Crow on the black/white ratio of illiteracy (see the online supplementary material). Additionally, if we had not left out the states that were part of the Confederacy during the Civil War (i.e., ignoring the mismatch on this variable), this also would have resulted in a negative estimated effect of Jim Crow on the black/white ratio of illiteracy (see the online supplementary material). Hence, it is important to note that the procedure discussed here for sampling individual-level data does not remove the inherent need for modeling choices, such as which matching variables to choose or which variables to include in the regression model.
Furthermore, in regression settings in which the aim is to understand causality, selecting a relevant individual level is a key requirement. This was summed up well by Diez-Roux (1998), who in the abstract of her article on multilevel analysis stated that contextual or multilevel analyses “raise a series of methodological issues, including the need to select the appropriate contextual unit and contextual variables, to correctly specify the individual-level model, and, in some cases, to account for residual correlation between individuals within contexts.” To conclude, although the approach described in this article can alleviate ecological bias due to nonidentifiability, this endeavor will be successful only if an appropriate model is fitted, and no method can remove the need to think carefully about this aspect.
Footnotes
Appendix A
Appendix B
Funding
Dr. Wakefield was supported by grant R01 CA095994 from the National Institutes of Health.