



Abstract

We thank the commenters for thoughtful, constructive engagement with our paper (this volume, pp. 1–33). Throughout this discussion, there is strong consensus that model robustness analysis is essential to sociological research methods in the twenty-first century. Indeed, both O’Brien (this volume, pp. 34–39) and Western (this volume, pp. 39–43) identify examples of sociological research that is plagued by uncertainty over modeling decisions and how those decisions can change the results and conclusions of the analyses. The goal of model robustness analysis is to offer transparent and systematic reporting of alternative results that a researcher could obtain from other plausible model specifications. To take Western’s example, how does age affect the risk of reincarceration? We advocate using prior theory and research to specify a preferred regression model, though as Western notes, prior theory and research are insufficient to confidently guide us to a one true model. Accordingly, we believe researchers need to consider that they may be wrong about their preferred model specification, possibly in multiple ways, and show readers how the results would change under different assumptions about model specification. Our method considers all possible combinations of plausible model inputs and shows the distribution of estimates that can be found. We have treated each of the alternative models as equally valid when displaying model robustness statistics and distributions. Both O’Brien and Western raise the issue of weighting models—recognizing that some reasonable models are more compelling than others. This involves a tradeoff between transparency and model selection. However, we agree that weighting models is a promising path forward, and we focus our response on the difficult matter of how to choose model weights.
1. Measuring the Probability of a True Model/Unbiased Estimate
When considering many possible models, one ideal approach is to weight each model by the probability that it is the “true model.” From a treatment effects perspective, we can simplify this to weight by the probability that the model yields an unbiased parameter estimate for the variable of interest (in Western’s [this volume] example, the impact of age on reincarceration). The challenge is that no one knows what these probabilities are—which is the essence of model uncertainty. At best, we have some broad intuitions about how the model should be specified, and then we begin an exploratory search of the model space. Still, we agree that not all plausible models are equally plausible so that a more fine-grained weighting of models, in principle, would provide a modeling distribution that is closer to the estimates that serious scholars would consider most valid. The challenge is how to develop credible weights.
From a Bayesian approach, Western writes that “the posterior model probability can be approximated by a function of the Bayesian information criterion” (this volume, p. 41). We respectfully disagree with the approach of weighting by this function of the BIC on two fronts. First, the BIC is not a measure of the probability that a model is correct (or offers an unbiased estimate). Second, the function that the posterior probability uses is ill suited to a robustness analysis and is in practice used for model selection.
The BIC is a measure of how well the model fits the outcome variable, Y. In linear models, the BIC is near perfectly correlated with the
Neither the
There is a seemingly subtle difference between prediction and treatment-effects estimation. But in essence, this is the difference between maximizing the
2. Model Selection versus Model Robustness
A deeper problem for the posterior probability is not just that it is based off the BIC but that it is fundamentally not a method for model robustness analysis. It is worth remembering that the title of the classic paper by Raftery (1995) is “Bayesian Model Selection in Social Research,” not model robustness (italics added). The function for the posterior exponentiates the BIC, making small differences in model fit very large and giving virtually all models except one a zero probability. As Andrew Gelman and coauthors note, Bayesian model averaging (BMA) “will asymptotically select the single one model” that maximizes the fit statistic (Yao, Simpson, and Gelman 2018:2). It is called model averaging, but in practice, it is model selection. It averages over all models but only after giving virtually all candidate models a weight of zero. In the CPS data we used as an empirical illustration, the posterior formula gives 83.4 percent of the weight to one model out of the 256 plausible model specifications. In other empirical testing, we often see 95 percent of the weight going to one model while effectively deleting all others. The posterior probability recreates the problems with transparency that we are trying to address—it chooses a preferred model based on objectionable criteria and never shows analysts or readers the alternative estimates.
3. Weighting by Model Influence
Nevertheless, as O’Brien notes, these problems with BMA do not mean that there is no way to weight models by their degree of plausibility. What might be a better approach? O’Brien offers an example of weighting the plausibility of models being true in a treatment effects scenario based on the “proportion of diverse social scientists who think that a particular independent variable should be included in a model” (p. 37). This is a compelling way to think about weights and, though obviously difficult to implement in practice, sets a goalpost for empirically derived weights. We also believe that for a robustness analysis, weights proportional to model plausibility are more appropriate than the exponential approach of the posterior. It is not a robustness analysis if we simply select the single model that receives the highest number of votes from diverse social scientists and weight all other models at approximately zero.
In our paper, we informally put forth a strategy for evaluating models:
Maximizing model fit is the wrong criteria for selecting control variables in a treatment effects analysis because it reflects only a control variable’s correlation with y. Young and Holsteen (2017) use the computational robustness framework to show how much a control or other model ingredient empirically changes the estimated treatment effect (β1). These influence scores would be better criteria for model selection than fit statistics such as the R2 or the Bayesian information criterion (BIC) when the goal is to understand treatment effects. (p. 9)
Here, we briefly outline and apply a method we call “influence weighting” of possible models. Young and Holsteen (2017) introduce influence metrics as a central part of model robustness analysis. More formal statements of influence weighting and other reasonable alternatives will be left for a future publication, and for now, we offer an intuitive discussion. In a treatment effects study, a control variable is “influential” when including the control variable changes the estimate of the treatment effect (
Models can be evaluated/weighted based on how well they incorporate influential variables. Does a given model omit any observed control variables that substantially influence the results? Is the model filled with control variables that do not influence the results? “Influence weighting” gives higher weight to models when they include more influential controls and less weight when they include noninfluential controls. Unlike the BIC, this effectively incorporates omitted variable bias as central to how models are evaluated. 2
Influence weighting does not exponentiate the influence metric to arrive at one single “winning” model. Rather, the weights are proportional to the model influence of each control variable. 3 We apply influence weighting to our empirical CPS data set on the effect of job training programs on wages to demonstrate how influence weighting would shift the distribution of estimates.
As shown in Figure 1, weighting model estimates by the influence scores of the model shifts the distribution to be more concentrated on a positive coefficient. Whereas the BIC weighting of the 256 estimates yielded one model with about 85 percent of the total weights, 4 the same model received a weight of .7 percent when weighted by the influence scores (while the least influential models received a weight of .1 percent). Nevertheless, as O’Brien predicted, a sensible weighting strategy does indeed narrow the distribution of estimates without effectively selecting a single model. Specifically, the weighted distribution shows more clearly that the large negative estimates (i.e., “training reduces wages”) are knife-edge estimates that depend on an implausibly exact constellation of controls. Nevertheless, it is hard to rule out zero as a plausible estimate in this case without knowing the “true” effects from experimental research.
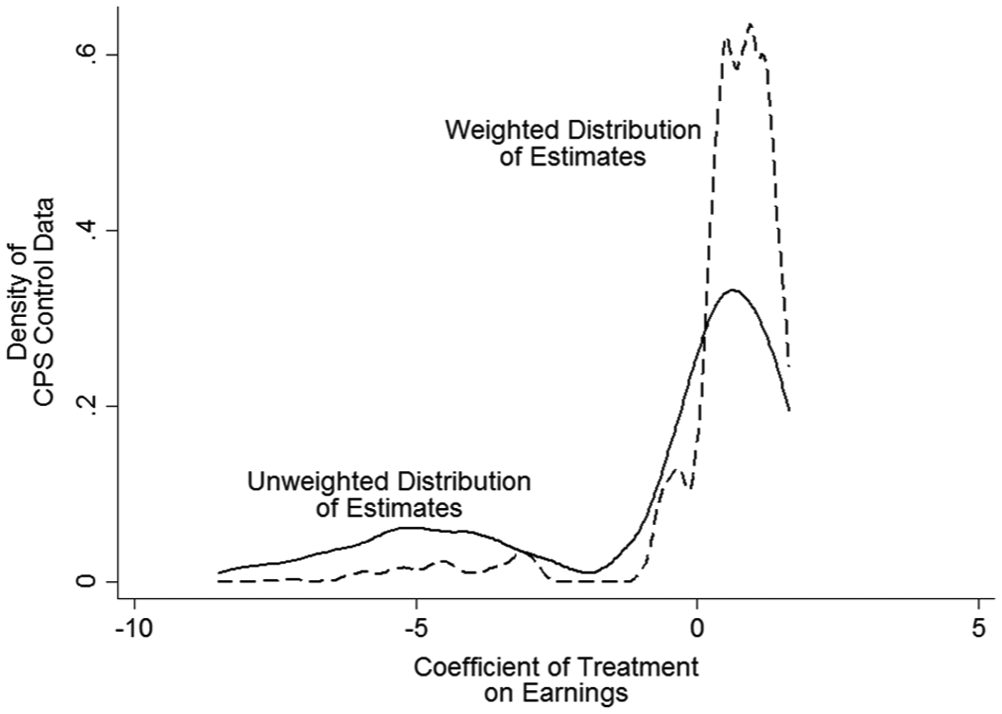
CPS data, unweighted and influence-weighted distributions.
There is an inherent tradeoff between model robustness and model selection approaches. Do we want to show readers what other plausible estimates could be obtained from alternative reasonable model specifications (i.e., what another author might report)? Or do we want an algorithm that chooses for us which estimate is reported based on optimization criteria? Pure robustness gives equal weight to plausible models and simply and transparently reports what estimates can be found given plausible model ingredients. Pure model selection, on the other hand, considers all plausible models but effectively chooses one single estimate. Thus, model robustness estimators will always be in some tension with model selection algorithms. Neither approach is flawless. Model robustness has the shortcoming that it allows attention to be given to models that have plausible ingredients but arguably have an overall lower probability of being true (or yielding unbiased estimates). Model selection algorithms are problematic because they impose assumptions about model validity that are often neither transparent nor appropriate—such as using the R2/BIC to select a single model in a treatment effects framework. In our view, influence weighting of models seems to be a reasonable tradeoff—though more research and evaluation are needed.
4. Beyond Weighting
Western and O’Brien make a series of other insightful comments that contribute to the dialogue of model robustness. Western argues that readings such as Leamer’s (1983) classic article “Let’s Take the Con out of Econometrics” should be required reading in every graduate methods sequence in sociology. We agree, but we note that simply reading Leamer is not enough. We also need to incorporate the inspiration from Leamer into everyday research practice. That goal, of putting ideas into practice, has been our mission—to be doing model robustness.
O’Brien underscores how even our best empirical solutions (e.g., testing analyses on multiple samples) can be flawed (the model that works on both data sets may well be misspecified). Thus, in treatment effects research, we advocate using prior theory and research to inform analyses and focus attention on the author’s best approximation of the true model (not the model with the highest
Western and O’Brien both mention the limiting conditions of our simulations. Our simulations illustrate the case with no true causal relationships and no systematic multicollinearity. With the case of no true causal relationships, this means we cannot assess concerns about false negative errors. Because journals rarely publish null findings (Gerber et al. 2010), there is already an abundance of motivation to eliminate false negatives. A credible null finding seems, in effect, to require a higher standard of evidence and analysis. Indeed, the “crisis in science” today is not that too many good theories are rejected on the basis of weak evidence but rather that many dubious propositions are publishable once a statistically significant estimate can be found (Young 2018b). For this reason, our focus has been on false positives. The issue of multicollinearity in simulations subjected to analysis of robustness, we agree, would be a valuable contribution and is a fruitful line of further inquiry.
Nevertheless, our simulations highlight three important findings: (1) Even when there are no true effects in a data set, significant results still show up with alarming frequency; (2) higher degrees of model uncertainty lead to more false positives; (3) model robustness analysis corrects for excess false positives that arise during model refinement, especially when model uncertainty is high and sample size is small. Moreover, we live in an age where it is possible to run 9 billion regressions prior to publishing a paper—this simple fact needs to be confronted by applied researchers claiming to have a significant result. Model robustness analysis is our way of addressing this reality.
Rather than a citing a few informal “robustness checks” in a footnote or selecting a single model to base inference of a treatment effect based on a model maximizing
Footnotes
Acknowledgements
The authors thank Gary King and Sheridan Stewart for helpful discussion while preparing this rejoinder.
Notes
Author Biographies
The author biographies can be found on page 33 of this volume.