



Abstract
Protest event analysis is an important method for the study of collective action and social movements and typically draws on traditional media reports as the data source. We introduce collective action from social media (CASM)—a system that uses convolutional neural networks on image data and recurrent neural networks with long short-term memory on text data in a two-stage classifier to identify social media posts about offline collective action. We implement CASM on Chinese social media data and identify more than 100,000 collective action events from 2010 to 2017 (CASM-China). We evaluate the performance of CASM through cross-validation, out-of-sample validation, and comparisons with other protest data sets. We assess the effect of online censorship and find it does not substantially limit our identification of events. Compared to other protest data sets, CASM-China identifies relatively more rural, land-related protests and relatively few collective action events related to ethnic and religious conflict.
1. Introduction
Protest event analysis is an important method for social movement research (Earl et al. 2004; Hutter 2014; Koopmans and Rucht 2002; Olzak 1989) and has played a key role in the development of political process theory (Jenkins and Perrow 1977; McAdam 1982), theories of resource mobilization (Jenkins and Eckert 1986), the study of new social movements in Europe (Kriesi 1995), and comparative studies of global and transnational activism (Tarrow 2005). Protest event analysis requires the creation of event data sets so that researchers can systematically assess the occurrences and features of collective action events across geographic boundaries and over time.
The main data source, or target source, for the creation of collective action data sets for protest event analysis has been traditional media, in particular, newspapers and newswire press releases. Compared to other types of data, such as government records, newspapers are a readily accessible source and allow researchers to quantitatively assess the occurrence of these events across geographic boundaries and over time as well as their features and characteristics. Well-known examples of newspaper-based collective action data sets include the U.S.-focused Dynamics of Collective Action (DoCA), which draws from the New York Times between 1960 and 1995 (McAdam and Su 2002); the PRODAT project, which uses German newspapers from 1950 to 2001 (Rucht, Koopmans, and Neidhardt 1999); and the European Protest and Coercion Data, which identifies events based on newspapers in 30 European countries. 1
Despite the many benefits, biases in media coverage of collective action events limit the use of traditional media for protest event analysis (McCarthy, McPhail, and Smith 1996; Ortiz et al. 2005). Newspapers are more likely to report on larger and more sensational protests. Certain news outlets are more likely to report on some types of protest than other types. Research shows that selection bias in newspaper coverage of protests can lead to bias in data sets that are constructed based on newspaper data (Earl et al. 2004). To ameliorate some of these biases, researchers use multiple newspapers as target sources (Azar et al. 1972; Nam 2006; Oliver and Maney 2000). Scholars also have augmented newspaper-based data sets by using other forms of media and nonmedia content, such as television transcripts, activists’ websites, Google search records, and government archives (Almeida and Lichbach 2003; Earl and Kimport 2008; Gamson and Modigliani 1989; McCarthy et al. 1996).
It is particularly challenging to use traditional media as a target source to study collective action in authoritarian regimes. This is unfortunate because collective action is especially important for understanding social, political, and economic processes in countries where opportunities for many forms of expression and representation are limited. Independent measures of collective action would be highly valuable for numerous scientific and public policy purposes, but authoritarian regimes impose strict controls on news reporting through state ownership of media outlets (Egorov and Sonin 2011; Qin, Strömberg, and Wu 2018; Stockmann 2013), repression and co-optation of private media outlet owners (McMillan and Zoido 2004), and intimidation and surveillance of domestic and foreign journalists (Bourgault 2015; Freedom House 2017; Hem 2014). As a consequence, many collective action and protest events that happen in authoritarian regimes are not reported in traditional media, either by local or foreign news outlets, and answering even basic factual questions about collective action events is a challenge.
Digital technologies provide new opportunities for scholars to learn about collective action and complement what we already know about collective action from traditional media reporting. The Internet, social media, and mobile platforms allow individuals to act as broadcasters and disseminate information on a much larger scale (Diamond 2010; Earl and Kimport 2011; Edmond 2013; Ferdinand 2000). Social media has become an important venue for protesters to speak out and mobilize, and it reflects participants’ own accounts of collective action events, which allows us to capture how participants describe their motives for mobilization. Social media data are digitized and relatively accessible for large-scale collection. Researchers have already used social media to study substantive topics in contentious politics and social movements (Barberá 2015; Budak and Watts 2015; González-Bailón et al. 2011; Steinert-Threlkeld 2017; Steinert-Threlkeld et al. 2015), but the digital traces left by protesters, bystanders, and commentators also provide us with new ways of identifying collective action events.
In this article, we create CASM (collective action from social media)—a system that uses social media data to identify collective action events occurring in the real world. CASM is intended to identify events that happen outside the Internet, that is, events with a public physical presence; CASM is not focused on identifying online mobilization or online collective action (Bennett and Segerberg 2012; Castells 2015; Romero, Meeder, and Kleinberg 2011). Whenever we refer to collective action events, we are referring to offline events.
CASM identifies collective action events from social media posts by applying deep-learning algorithms, using image and textual data, in a two-stage classifier. CASM uses convolutional neural network (CNN) for image classification and a combination of convolutional and recurrent neural networks with long short-term memory (CNN-RNN) for textual analysis. These deep-learning algorithms jointly model the data representation (how to represent raw data as features) and perform classification, and they allow for transfer learning, reusing models based on large data sets as a starting point for our task of identifying collective action events. The two-stage classifier helps us overcome the challenge of distinguishing between social media posts that describe offline collective action events and posts that discuss similar topics but do not manifest as offline events. We test our system through extensive internal and external validation, which we hope offers a template for how computer science methods can be made more practical and usable for social science research.
We implement CASM for China (CASM-China) using social media data from Sina Weibo, a popular Chinese microblogging platform. We identify 508,707 posts that likely discuss offline collective action between January 1, 2010, and June 30, 2017. From these posts, we identify 136,330 likely collective action events located in over 96 percent of counties in China. CASM-China does extremely well in identifying posts, as assessed through cross-validation and out-of-sample validation. We find that despite the fact that online censorship in China suppresses discussion of collective action in social media, censorship does not have a large impact on the number of collective action posts identified through CASM-China. In assessing the external validity of CASM-China, we find the system will miss collective action taking place in ethnic minority regions, such as Tibet and Xinjiang, where social media penetration is lower and more stringent Internet controls (e.g., Internet blackouts) are in place.
We proceed in five sections. Section 2 describes the advantages and limitations of using social media as a target data source for identifying collective action events. In Section 3, we describe the details of CASM and its implementation on Chinese social media data. We define collective action, discuss how we collect and preprocess data, describe the architecture of the CNN and CNN-RNN models, detail how these models are trained, describe performance of the first-stage and second-stage classifiers, and show how we identify unique events from posts. Section 4 presents a description of the output of CASM for China, a data set we call CASM-China, along with an assessment of its external validity through comparison with other event data sets and evaluation of the impact of censorship. Section 5 discusses how CASM can be implemented beyond China, and Section 6 concludes.
2. Social Media as a Target Data Source
Using social media as target data has unique advantages but also important limitations. The characteristics of social media data that provide unique advantages for protest event analysis include (1) scale, (2) unmediated channel, and (3) diversity.
2.1. Scale
More than half of the world’s population are on the Internet, and social media is used in every country with Internet access (Rainie et al. 2012). 2 The scale of social media vastly exceeds that of traditional media: An average of 31 million messages are sent every minute on Facebook, and nearly 350,000 tweets are made every minute. 3 Social media gives every individual the power to broadcast, and even if only a small minority of social media users talk about offline collective action, the number of collective action events reported on social media will still vastly outstrip what can be reported by traditional media sources.
2.2. Unmediated Channel
From the Arab Spring to Occupy to the MeToo movement, social media has become an important venue for protesters to speak out (Barberá 2015; Budak and Watts 2015; González-Bailón et al. 2011; Steinert-Threlkeld 2017; Steinert-Threlkeld et al. 2015). Social media reflects participants’ own accounts of collective action events and allows us to capture how participants describe their motives for mobilization. We gain a direct understanding of the grievances, problems, and issues that mobilize rather than one mediated by news organizations (Koopmans 2004).
2.3. Diversity
Social media data also give researchers access to a more diverse set of collective action events, including events of widely varying scale. Traditional media are more likely to report on larger and more sensational protests (Earl et al. 2004). Individuals on social media will no doubt talk about large-scale protests, but they will also report small- and medium-scale protests, and they may report collective action events that are not violent or shocking.
These characteristics of social media allow us to detect events that otherwise might go unnoticed and learn about collective action from the perspective of protesters. This advantage is especially crucial in authoritarian regimes where social media has become an important channel for dissent when traditional media is silent (Smith 2013; Trentham et al. 2015; Yang 2003).
However, characteristics of social media data can also generate biases, gaps, and errors in social media-based data sets. These include (1) nonrepresentativeness, (2) online censorship, (3) fast-paced technology change, and (4) brevity of content.
2.4. Nonrepresentativeness
Using social media as a target source will only uncover collective action in places and among populations that use social media (or the particular platform from which data are being collected). We know that users of social media platforms constitute a nonrandom sample of the population (Mislove et al. 2011), which means individuals who use social media to talk about offline collective action may not be representative of everyone who engages in offline protest. For example, we would identify few collective action events from social media data in countries such as Iraq, Libya, or Turkmenistan, which have low social media penetration, because protesters are unlikely to use social media to talk about their activities. We may identify more collective action events involving younger, wealthier, more educated, and more urban protesters who have higher rates of social media adoption. How protesters who post on social media compare to the overall population of protesters will vary by country. Social media’s bias toward younger people might be less problematic for identifying collective action events in a country such as Saudi Arabia, where nearly 50 percent of the population is under 25, than in countries such as Germany or Japan, where less than 25 percent of the population is under 25. 4
2.5. Online Censorship
Social media is subject to censorship, especially in authoritarian regimes that use a range of strategies to limit online expression. These range from blocking users in a country from accessing certain websites (e.g., China’s Great Firewall, Iran’s Intranet; Deibert 2008) to filtering search results (Bamman, O’Connor, and Smith 2012) to removing content after it has appeared online (King, Pan, and Roberts 2013; Zhu et al. 2013) to using physical repression to induce self-censorship (Pan and Siegel 2018; Stern and Hassid 2012). As a result of government censorship strategies, individuals may self-censor and avoid discussions of collective action online. Individuals who try to express themselves may be unable to do so, and in general, people may be less likely to engage in collective action because the diffusion of information about these events is constrained. In addition, even if protesters talk about collective action on social media, governments can make it difficult for scholars to systematically gather social media data about collective action.
2.6. Fast-Paced Technology Change
Social media changes rapidly. Topics of discussion change. Language and norms are fluid. Social media platforms routinely change their features and algorithms, which can change what data are available and make it difficult to compare data over time. In addition, new social media platforms can emerge and displace existing platforms. This means more collective action events may be detected in social media data gathered soon after an event rather than in data gathered long after posting. Moreover, social media data may not be available for long periods of time, depending on the lifecycle of social media platforms.
2.7. Brevity of Content
Social media messages are often short. When discussing offline collective action, key pieces of information that would appear in a news article (e.g., who, when, what, where, how) may be missing. This means detailed information on the features and characteristics of protest may not always be available.
3. CASM: Collective Action from Social Media
We draw from McAdam, Tarrow, and Tilly (2003:5) and define collective action as an episodic, collective event among makers of claims and their targets when
targets are political and economic power-holders;
claims, if realized, affect the interests of at least one of the claimants;
claimants’ action is a contentious event with a public physical presence involving three or more people.
By requiring the event to be episodic, we exclude regular meetings. By defining the targets of protest to include both political and economic actors, we include collective action events where the government is either a target or a mediator. By requiring the action to be contentious—boycotts, demonstrations, marches, sit-ins, strikes—we exclude events such as fundraisers. By requiring an event to have a public physical presence, we exclude events that are not visible to others, such as private group discussions, and events that take place only online. By requiring at least three people, we are setting a low threshold. 5
This definition of collective action is similar to classical protest event studies in that our primary focus is on identifying events. This definition is also related to the concept of contentious performance—“learned and historically grounded ways of making claims” (Tilly 2008:4)—because we focus on a subset of contentious performances. Our definition differs from the theoretical focus of contentious performance, however, because our primary aim is not to capture the varied ways in which claims can be made.
3.1. Collecting and Preprocessing Social Media Data
We use social media data from Sina Weibo (hereafter Weibo), China’s biggest microblogging platform. 6 Weibo allows messages up to a maximum of 140 characters. Users can mention or talk to other users, use hashtags, follow other users, and repost. Weibo is like Twitter in that it is an open platform where users do not have to follow another user to read their posts. 7
The quantity of social media posts is vast, and in relation to the universe of social media posts, posts containing discussions of collective action events are extremely rare. Out of a random sample of 20,000 geocoded posts from Weibo that we coded by hand, we identified one post discussing a real-world collective action event. This implies that less than 0.01 percent of social media posts in China discuss protest. Thus, instead of collecting a random sample of all posts, we collect posts, TK, that contain one or more keywords (K) related to collective action. Note that most posts TK will not relate to real-world collective action events. 8 For example, the term protest (抗议) is the most frequent keyword in our keyword set for China, but many posts containing this keyword (e.g., “My stomach is protesting; I’m so hungry,”“I wish Chinese people had the same right to protest as people in democratic countries,” and “The US government should focus on their own protests first before paying attention to the protests in China”) do not meet our definition of collective action.
The set of keywords K used to collect posts TK can be curated by experts, or it can be calculated by identifying frequently occurring or differentiating keywords from social media posts known to discuss collective action. We created the set of protest-related keywords K from an existing data set of social media discussions of protest in China—the Wickedonna data set created by activists Yuyu Lu and Tingyu Li. Between June 2013 and June 2016, Lu and Li gathered a daily list of protests in China from social media reports on Sina Weibo, Tencent Weibo, Qzone, and other online platforms, and they published this list on their blog. 9 Each protest is associated with a number of related social media texts, images, and sometimes videos. In total, the Wickedonna data set contains 67,502 protests described by 240,521 text-based posts and 233,288 images and videos. The Wickedonna data set has strong spatiotemporal resolution, but we do not know Lu and Li’s methodology for gathering these data or their criteria for inclusion. 10 We chose the 50 most frequently occurring words, excluding stopwords, to balance the trade-off between coverage of posts about collective action with the cost of data collection and the performance of our classifier (see the supplemental online appendix for our validation of the size of K).
We collected all Weibo posts published between January 1, 2010, and June 30, 2017, that contain at least one of the words in K. 11 Our set of posts TK includes approximately 9.5 million posts from Weibo. 12 For each post, we collected the text, images (if there were any), and available meta data, such as time of posting, number of reposts, and latitude/longitude of the post (when the account was geolocation enabled).
Chinese text does not require preprocessing steps of stemming or lowercasing common to English-language data. Instead, Chinese text is presented without whitespaces, so we preprocess posts by segmenting characters to delineate words. Our segmentation algorithm, Jieba, uses a preset dictionary structure to support word graph scanning. 13 We use the largest dictionary available for Jieba and add in approximately 1,000 frequently used words (excluding stopwords) from the Wickedonna data set. The segmenter builds a directed acyclic graph for all possible word combinations and uses a hidden Markov model with the Viterbi algorithm to identify words. Because we are using deep-learning models, it is not absolutely necessary to conduct word segmentation; however, we segment because incorporating well-defined boundaries of the text (here, words) helps accelerate models’ feature learning process. We remove punctuation and only keep posts that have at least eight segmented words. Among the retained posts, we remove stopwords and emojis. 14
For images, the default upload file format on Weibo is JPEG. We keep all JPEG files and exclude GIF files, which represent less than 1 percent of the images we encountered. Each JPEG file is rescaled to a 100 × 100 pixel image in color, which means image files are represented as arrays where three values—for red, green, and blue (RGB)—are associated with each pixel.
3.2. Identifying Collective Action Posts
Existing methods of building collective action data sets have used human coding and automated rule-based approaches. Social media data present challenges for these approaches. The scale of social media data makes human coding impractical when the goal is to capture overall trends rather than study specific cases. The brevity and changing nature of social media posts—in terms of language, style, slang—challenge automated rule-based approaches, which often rely on the applicability of predefined rules (based on either keywords, parts of speech tagging, or predefined grammatical phrases) to find matching content (Saraf and Ramakrishnan 2016). 15
We use supervised machine learning algorithms where humans code training data, and algorithms are “trained” with this human-coded data to generate a collective action event data set. Supervised-learning approaches are more adaptive to different data sources and more flexible than rule-based approaches (Croicu and Weidmann 2015; Hanna 2017; Nardulli, Althaus, and Hayes 2015). 16
Specifically, we use deep-learning algorithms in two-stage classification to identify posts related to collective action, which we call Tprotest. Deep-learning algorithms are a class of machine-learning algorithms based on the framework of artificial neutral networks (Bengio, Goodfellow, and Courville 2015; LeCun, Bengio, and Hinton 2015). Deep-learning algorithms have helped make significant advances in many machine learning tasks, especially tasks related to the analysis of images and text, such as image classification (He et al. 2016; Simonyan and Zisserman 2015), multiple object detection (Ren et al. 2015), automated image captioning (Shin et al. 2016), voice recognition (Dahl et al. 2012; Hinton et al. 2012), machine translation (Bahdanau, Cho, and Bengio 2014; Sutskever, Vinyals, and Le 2014), and parts of speech tagging (Santos and Zadrozny 2014). Deep-learning algorithms are just beginning to be used in social science research, in particular in research using image data (Torres 2018; Won, Steinert-Threlkeld, and Joo 2017). Our work expands on this emerging strand of social science research by using deep learning for image and textual classification.
Deep-learning algorithms differ from conventional machine classification methods in two main ways. First, conventional machine classification methods require users to decide how to transform data from their raw form (pixel values in images, words in documents) into numerical representations (subregions of images relevant to a specific problem, vector of count of words). In contrast, deep-learning algorithms “discover” optimal data representation for a classification task to determine how data should be transformed into numerical values. Second, deep-learning algorithms allow for transfer learning, where a model developed for one task can be reused as the starting point for a model on a different task. For instance, transfer learning can boost performance when there is limited training data available for a specific task.
In the following, we describe the convolutional neural network we use for image classification and the combined convolutional and recurrent neural network with long short-term memory we use for text classification. 17 We use the same CNN and CNN-RNN classifiers—in terms of architecture, transfer learning, and training method—in the first- and second-stage classifiers. 18 We then describe the first-stage classifier, followed by the second-stage classifier.
3.2.1. Convolutional Neural Network for Image Classification
We use a CNN for image classification. A CNN is a model that consists of a series of operations, called layers, where each layer takes the output of the previous layer as input and, after performing some operation on it, passes the output to the next layer. CNNs get their name from the operation of convolution—element-wise multiplication between matrices followed by summation. The output of convolution is called a feature map, and each layer can contain multiple feature maps. After each convolution, an activation function is applied to introduce nonlinearity because most real-world data are nonlinear, yet convolution is a linear operation. The most common activation function for CNNs is rectified linear unit (ReLU), an element-wise operation applied per pixel to replace all negative pixel values with zero, producing a rectified feature map. Feature maps and rectified feature maps are high dimensional, so spatial pooling is often applied to reduce dimensionality and so features can be identified regardless of their position in an image (translation invariance). Generally, multiple convolution layers are used to extract useful features from the raw data. After these layers, one or more fully connected layers, often a type of neural network called a multilayer perceptron, learns nonlinear combinations of the features generated from the convolutional layers and uses all features to classify the image. 19 The final fully connected layer typically uses a softmax activation function, or normalized exponential function, to generate the output value.
There are many variants of CNNs, which differ based on the architecture of the network as well as parameters such as the number of filters, the filter size, and stride. The architecture we use is called VGGNet, also known as VGG or VGG-16, which we chose based on its conceptual simplicity, ease of implementation, and wide-ranging applications (Simonyan and Zisserman 2015). 20 VGGNet uses 16 convolutional layers to extract features and three fully connected layers to perform classification. VGGNet uses small filter sizes (3 × 3) and more layers (16) instead of larger filter sizes (7 × 7) and fewer layers, as was common in previous models (Krizhevsky, Sutskever, and Hinton 2012). 21 In VGGNet, a ReLU operation follows each convolutional layer, and max pooling is performed after the 2nd, 4th, 7th, 10th, and 13th convolutional layers.
VGGNet was trained on a set of 1.2 million images, classified into 1,000 categories. We do not use the entire pretrained VGG model because human faces and crowds (not to mention collective action events) are not included among the 1,000 categories VGGNet was originally trained for. Instead, we trained and fine-tuned the last four convolutional layers with our own data, as illustrated in Figure 1. 22
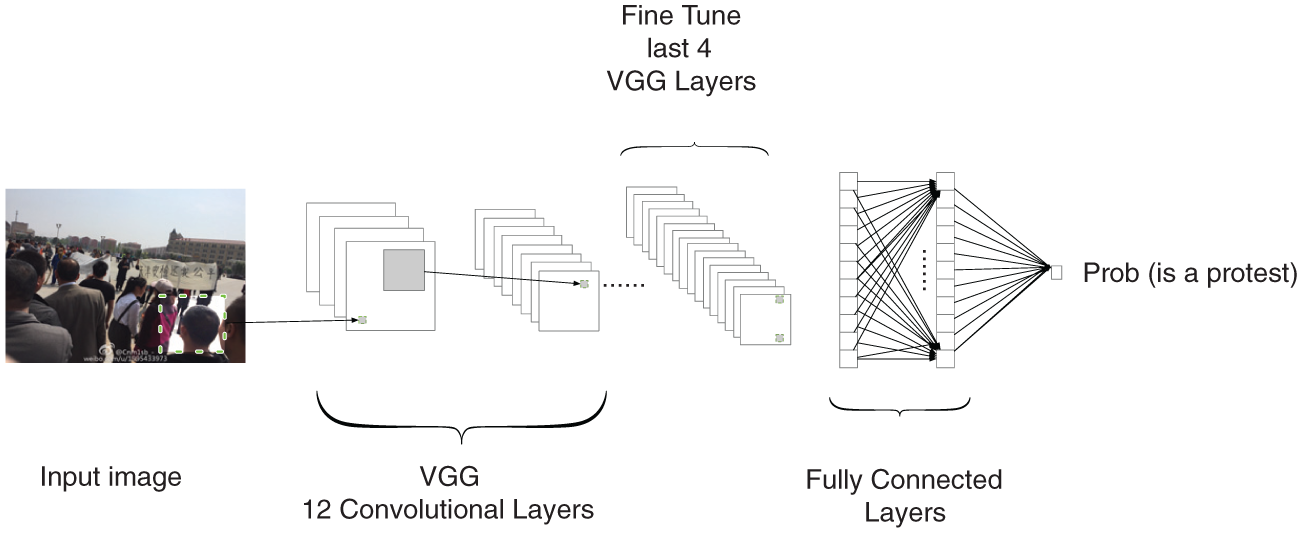
Illustration of our convolutional neural network architecture for image classification.
We do not change the first 12 convolutional layers of VGGNet because they identify more basic features of images (e.g., edges, circles); subsequent layers use these basic features to learn more complex features (e.g., human faces, signs, placards) specific to our task. The structure of the last four layers we use is consistent with the original VGG architecture in terms of filter size and stride. After the convolutional layers, we added a fully connected layer with ReLu activation and dropouts and a second fully connected layer with logistic sigmoid function to output the binary-class probability. 23 The final CNN output is a probability between 0 and 1, where 1 means the image is certain to represent offline collective action and 0 means the image does not represent offline collective action.
We train this model to minimize cross entropy loss because our output is binary:

where p is the output of predicted probability, y is the labels of the training data, and N is the number of images; pn is the nth output, and yn is the nth ground truth label. We minimize cross-entropy loss by using an adaptive gradient-based optimization algorithm (Kingma and Ba 2014). 24
3.2.2. Convolutional and Recurrent Neural Network for Text Classification
To classify our text data, we use a model that combines convolutional layers with a recurrent neural network (RNN) with long short-term memory (LSTM) architecture. Recurrent neural networks are used extensively in dealing with sequential data, and they have set the standard for performance on natural language processing tasks such as speech recognition and machine translation (Bahdanau et al. 2014; Mikolov et al. 2010; Sak, Senior, and Beaufays 2014). RNNs are a type of model that performs the same operation repeatedly on sets of sequential inputs. Central to an RNN is a state vector that accepts an input and the previous state to produce a new state and output. The shortcoming of “vanilla” RNNs is they are difficult to optimize due to the effect of vanishing gradients (Pascanu, Mikolov, and Bengio 2013). LSTMs were created as a special kind of RNN that can learn long-term dependencies in a computationally tractable manner with cell vectors that control what information from the previous sequence of operations is retained (Hochreiter and Schmidhuber 1997).
The architecture we use combines an embedding layer, convolutional layers, an LSTM layer, and two fully connected layers (Sainath et al. 2015; Wang, Jiang, and Luo 2016; Xiao and Cho 2016; Zhou et al. 2015). Figure 2 shows this architecture.
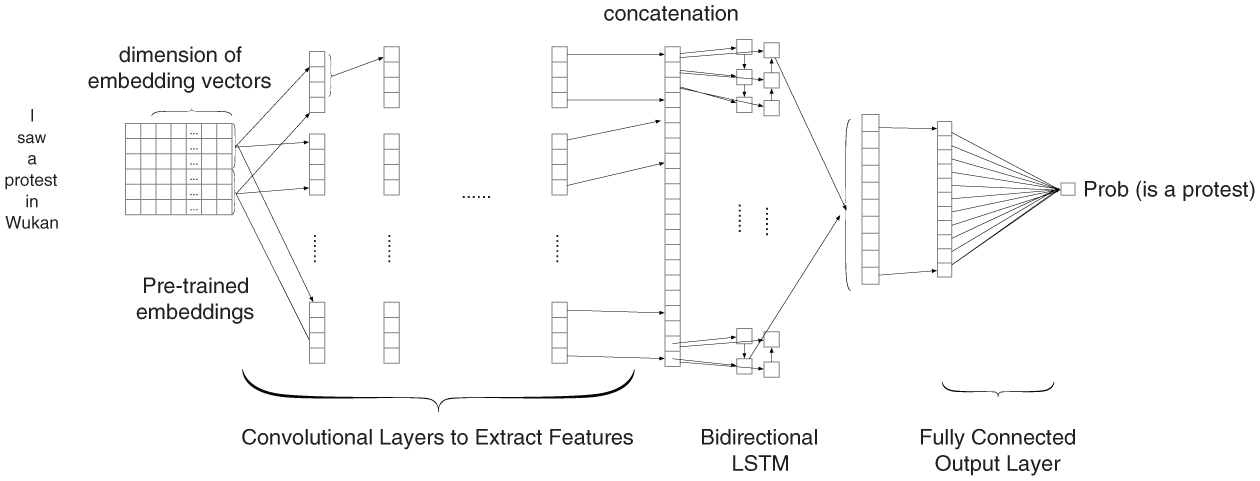
Illustration of our convolutional and recurrent neural networks with long short-term memory architecture for text classification.
The embedding layer, shown on the left of Figure 2, is an operation to provide each word in our text data with a dense representation of the word and its relative meanings (Peters et al. 2018). Although social media text is short, the set of words, or vocabulary, used in social media is large. This means that when social media texts are represented as a bag-of-words—an unordered set of words—not only is word ordering lost, but the vector that represents the text is exceptionally sparse. With word embeddings, words are represented by dense vectors, where a vector represents the projection of the word into a continuous vector space and the position of the word in that space is learned based on other words that surround it in the text. In our case, each word is represented by a 128-dimension word vector we trained with a continuous skip-gram model using 20 million Weibo posts (Mikolov et al. 2013). 25 This embedding layer can be thought of as a type of transfer learning, where we use the word vector model to add information about each word in our data.
The convolutional layers in the CNN-RNN extract features just like the convolutional layers of the CNN. 26 For image analysis, the matrices where convolution is performed are subregions of the image’s pixels. For text analysis, convolution is performed on subregions of a matrix of words of fixed dimension. We use an n×n matrix, where n is the length of the vector that represents each word (128), because no Weibo post exceeds 128 words and 128 has nice mathematical properties (128 = 27). If the number of words in the text is less than n, extra rows of zeros are added as part of a process called padding, which is standard when implementing CNN for text classification. For example, the very left of Figure 2 shows a short text, “I saw a protest in Wukan,” which in our case results in a matrix of size 6 × 128. An additional 122 rows of zeros are added to generate a 128 × 128 matrix. Then, as with image data, subregions are defined by filter size and stride. 27 Here, we also use a ReLu activation function, add max pooling after each convolution layer, and apply dropout.
Instead of using convolutional layers for feature extraction, we could have defined features ourselves, such as using bag-of-words or n-grams as features. We use convolutional layers for feature extraction rather than bag-of-words features to avoid losing word order and information about grammatical syntax. For example, CNNs can capture as features phrases such as “defend my rights” that are meaningful beyond the words that compose the phrase, even when such phrases appear across diverse social media posts: “I protest to defend my rights,”“Why should I defend my rights?,” or “Company X can defend my rights as a consumer.” We use convolutional layers rather than n-grams because n-grams exponentially increase the size of the vocabulary, introducing a high level of noise (Tan, Wang, and Lee 2002).
We use LSTM on top of the convolutional layers because LSTMs perform better in preserving long-range dependencies within sentences and short texts (Sutskever et al. 2014). Long-range dependencies matter because meaning in a sentence or social media post is often determined by words that are not very close together. For example, a social media post such as “The people in the square were wearing ponchos during the protest because of the heavy rain” is about people protesting, not about people wearing ponchos, and LSTM is more likely to capture the long-range dependence between people and protest. Our LSTM layer is fixed to a bidirectional LSTM, which scans the inputs in forward and reserve order, preserving the proceeding and following features (Schuster and Paliwal 1997). 28
Finally, similar to the CNN model, there are two fully connected layers: The first applies the ReLU activation function and dropouts, and the second is a logistic sigmoid function that outputs the binary-class probability of whether the post’s text is discussing real-world collective action. To train this model, we again minimize cross-entropy loss with an adaptive gradient-based optimization algorithm.
3.2.3. First-Stage Classifier
The first-stage classifier uses the CNN model described in Section 3.2.1 to classify image data and the CNN-RNN classifier described in Section 3.2.2 to classify text data. In this first stage, we train the CNN model using a random sample of 230,000 images 29 from the Wickedonna data set as our positive training data (i.e., examples of images that pertain to collective action events). We use a random sample of 230,000 images from geolocated Weibo posts as the negative training data (i.e., examples of images that do not relate to collective action). We train the CNN-RNN model using the 240,521 text-based posts from the Wickedonna data set as the positive training data. We use a random sample of approximately 200,000 geolocated posts from Weibo as the first negative training data. 30 This random sample of posts is extremely unlikely to contain discussion of collective action events or many keywords from K. If we only use these data as the negative training data, then the positive training data would all contain protest-related words and the negative training data would not, which would bias the classifier into making predictions about collective action based on whether a protest-related word is present. To ameliorate this issue, we use approximately 450,000 posts that contain keywords from K but have a very low likelihood of being about collective action as the second negative training data set. 31
After training the CNN and CNN-RNN models with these data, we use the trained models to make predictions about the approximately 9.5 million Weibo posts containing at least one of the words in K. If the input Weibo post only contains text, then the CNN-RNN model generates the predicted probability that the text relates to offline collective action (ptext). If the input post contains text and images, the CNN-RNN model generates the predicted probability that the text relates to offline collective action (ptext), and the CNN model generates the predicted probability that images relate to offline collective action (pimage). When multiple images are associated with one social media post, we take the largest predicted probability as pimage. The 9.5 million posts include just under 3.6 million images.
Figure 3 shows 11 images whose predicted probabilities as assigned by the CNN in the first stage range from 0 to 1.0. These images are those whose predicted probabilities are closest to the integer values listed in the figure. For example, the third picture from the left (a night street scene) is the image with predicted probability closest to 0.2. Figure 3 suggests the image classifier has construct validity. Images with higher predicted probabilities of relating to collective action contain crowds, signs, placards with text, and government buildings. The appearance of a picture containing text (third image from the right, with predicted probability of 0.8) is not surprising as Chinese social media users often post images of text to discuss sensitive topics in an attempt to avoid censorship.

Images with their predicted probabilities of relating to collective action generated from the convolutional neural network in the first-stage classifier (some images are cropped).
When a Weibo post contains both ptext and pimage, we combine the two predicted probabilities to obtain a single predicted probability for each post. How the probabilities are combined depends on two tuning parameters (α and β):

As seen in Equation 2, α controls how much information we should borrow from text versus image data. If α is higher, more weight is placed on the output of the image classifier. β controls how much extra up-weight we give to posts that contain both text and images. The intuition here is that images in social media posts can be informative. Of 10,000 human-coded posts that contain protest-related words, 32 only 23.9 percent contain images in addition to text, but among posts identified as related to collective action in human-coded data, 56.9 percent contain images in addition to text. This suggests protesters may post pictures strategically when publicizing their efforts on social media.
We use cross-validation to select the optimal values of α and β. 33 The optimal α and β for the first-stage classifier are 0.44 and 1.10, respectively. The α is smaller than 1, which means relatively more information is extracted from the CNN-RNN model of text, but β is larger than 1, confirming our intuition that a post with both text and images is more likely to be about collective action than are posts with only text.
We evaluate the performance of the first-stage classifier with cross-validation and out-of-sample validation. Cross-validation is the dominant approach for evaluating machine-learning systems of event detection (Hanna 2017; Nardulli et al. 2015). The training data are split into k equal subsets (we use k = 5). Each subset is used to calculate precision and recall with the rest used for training, and this process is repeated k times. The advantage of cross-validation is that class labels are already known for the training data, so precision and recall can be directly estimated. The first-stage classifier performs extremely well in cross-validation, with a maximum F1 score of 0.96 (precision = 0.95, recall = 0.96). 34 The first-stage classifier vastly outperforms random guess, and above the range of F1 scores (0.6 to 0.8) for existing supervised machine-learning systems for event classification (Adams 2014; Hanna 2017).
The problem with cross-validation is that the training data could differ from the data researchers ultimately want to apply the classifier on. For example, the positive training data used for CASM in China could be based on a definition of collective action that differs from ours and draws from a broader range of data sources. Therefore, precision and recall based on cross-validation can paint a rosier picture of the algorithm performance than is warranted. To address this problem, we conduct out-of-sample validation with 10,000 posts to mimic the context where the classifier will be used, thus providing a more realistic evaluation of the system. We take a stratified random sample of 200 posts per each keyword from the 9.5 million posts collected between 2010 and 2017 (these posts are not used during training). We trained human coders to code each of the 10,000 sampled posts as discussing a collective action event or not per our definition. 35 We assess the performance of our classifier based on this independent validation set. The first-stage classifier achieves a maximum F1 score of 0.69 (precision = 0.66, recall = 0.73). Figure 4 shows the precision-recall curve of the CNN image classifier alone, the CNN-RNN text classifier alone, and the combined classifier from the first stage based on out-of-sample validation. 36 There is often a trade-off between precision and recall, but Figure 4 shows that the text-based classifier outperforms the image classifier, and the combined classifier outperforms both across the precision-recall curve.
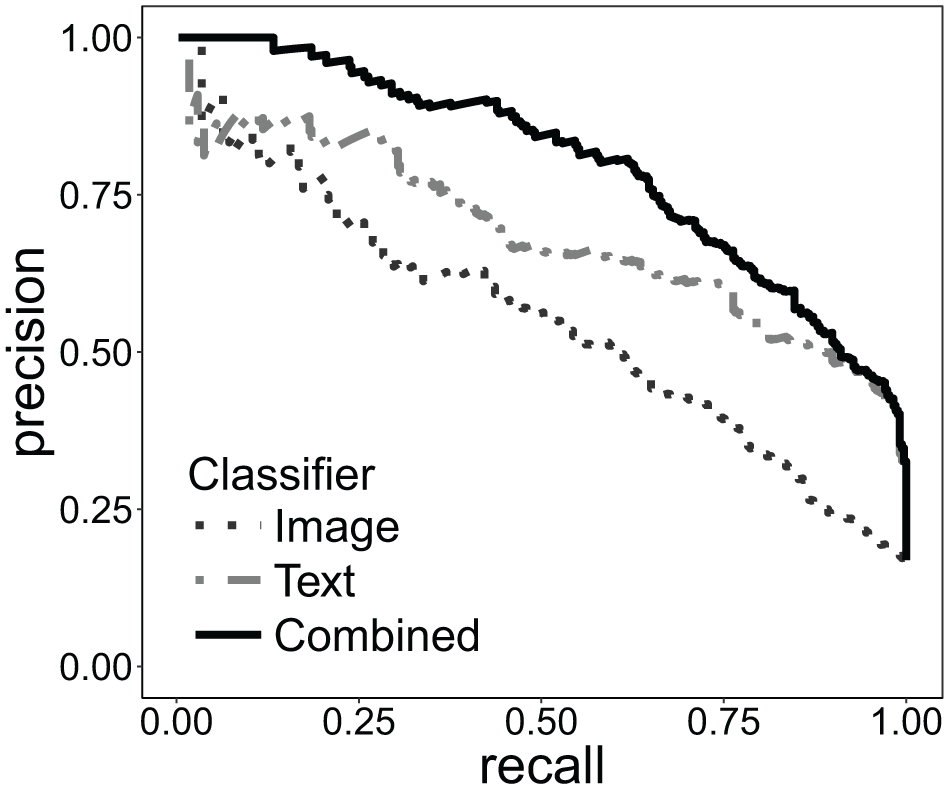
Precision-recall curve of the image-based convolutional neural network model (dotted line), text-based convolutional and recurrent neural networks with long short-term memory model (dotted dash line), and the combination of the text and image classifier (solid line) from the first-stage classifier based on out-of-sample validation.
The first-stage classifier can correctly identify posts about collective action. Figure 5 shows two posts about collective action that are identified by the first-stage classifier as such (true positive). The first stage also correctly classifies posts containing words K that are not related to collective action. Figure 6 shows a post unrelated to collective action that is classified as not relating to collective action (true negative). 37
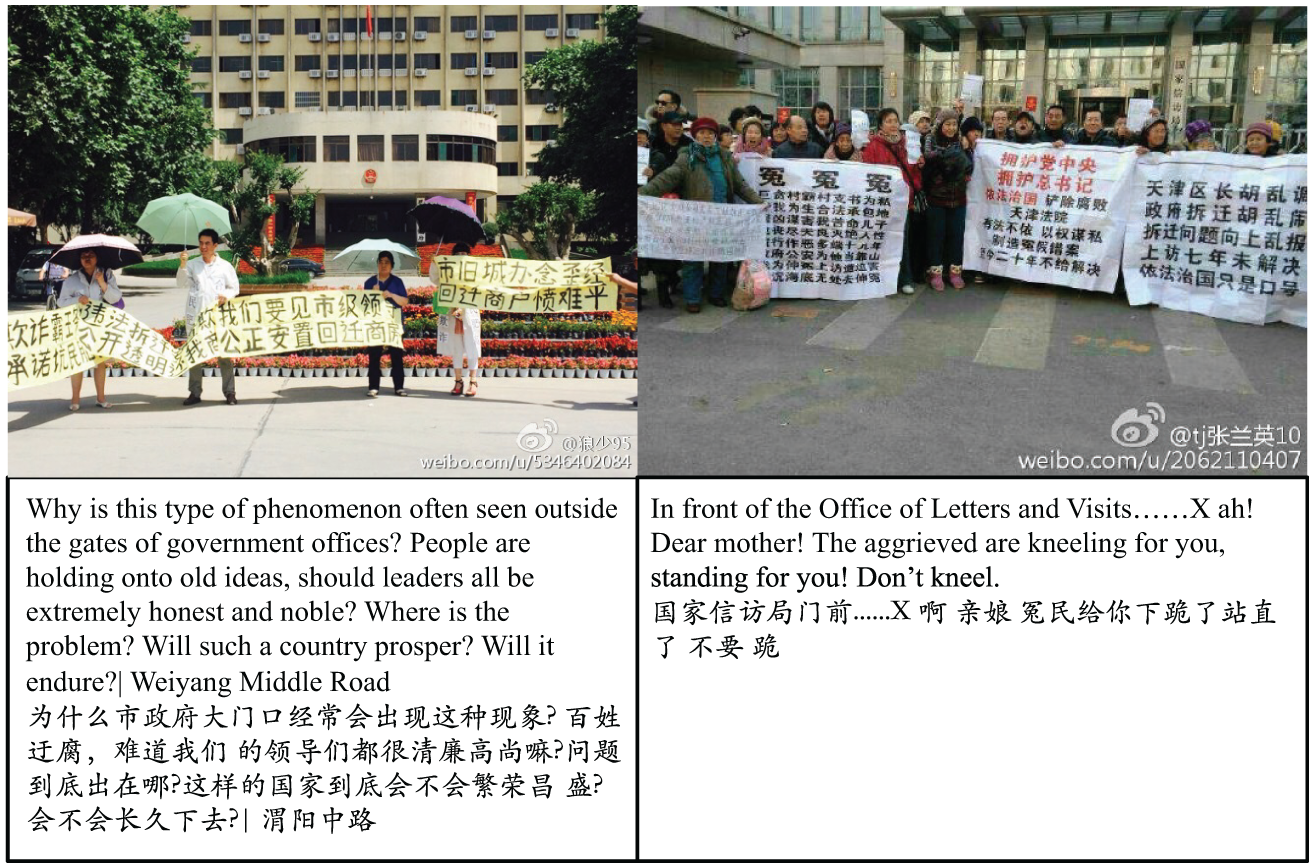
Weibo posts about collective action correctly classified as related to collective action (true positives) from the first-stage classifier.
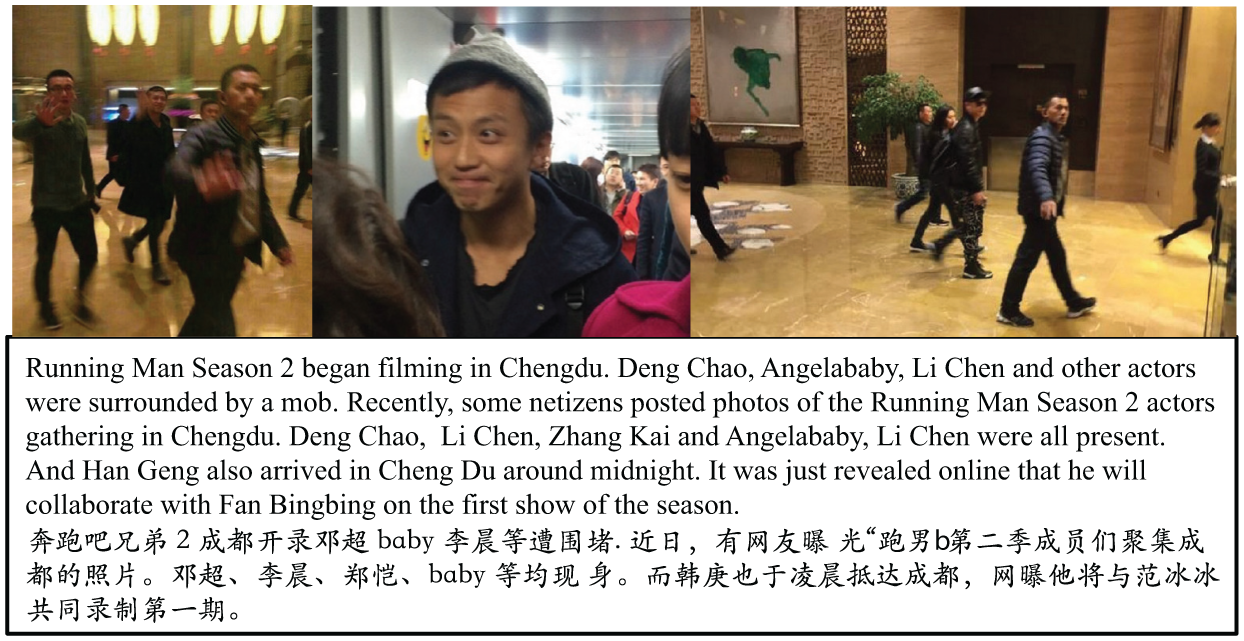
Weibo post containing one of the words in K, “surrounded by a mob,” correctly classified as not related to collective action (true negative) from the first-stage classifier.
Overall, the performance of the first-stage classifier is strong, but we wanted to do better than correctly classifying 66 percent of posts as collective action (precision = 0.66) and correctly identifying 73 percent of the collective action posts from TK (recall = 0.73). In particular, we want to improve precision to make sure more posts we classify as collective action meet our definition of collective action. To do so, we need to reduce the number of false positives. We systematically examined the false positives from the first-stage classifier by taking a random sample of 2,000 false positives and examining them by hand. We found two types of false positives. The first were posts made by government-related social media accounts that describe how public grievances are resolved. Figure 7 shows such a false positive, where a local government is publicizing how it was able to resolve worker grievances over owed wages. Reading the post in Figure 7, it is possible that workers did protest and then the government responded; however, this post does not meet our definition of collective action because it does not provide direct evidence of worker protests.
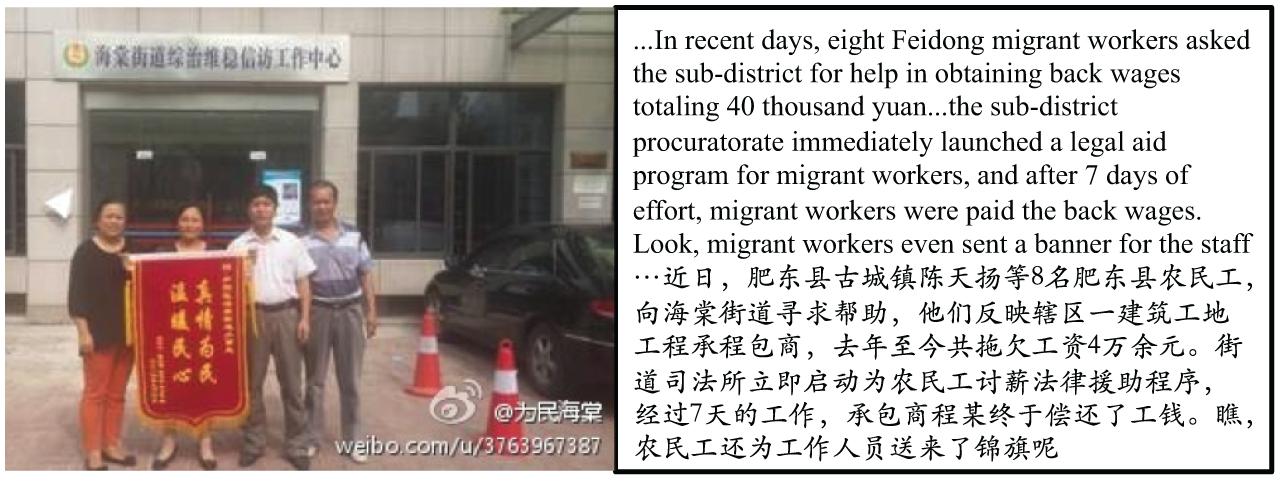
Post made by a government Weibo account incorrectly classified as related to collective action (false positive) from the first-stage classifier.
Social media posts that describe issues, problems, and grievances that can lead to collective action but collective action is not apparent in the posts are the second type of false positive. For example, Figure 8 shows a Weibo post made by someone whose house was demolished. This individual was not able to reach an agreement with the government on compensation for their house, so someone (presumably at the government’s behest) destroyed the building in the middle of night. The image that accompanies the text shows the ruins of the building.
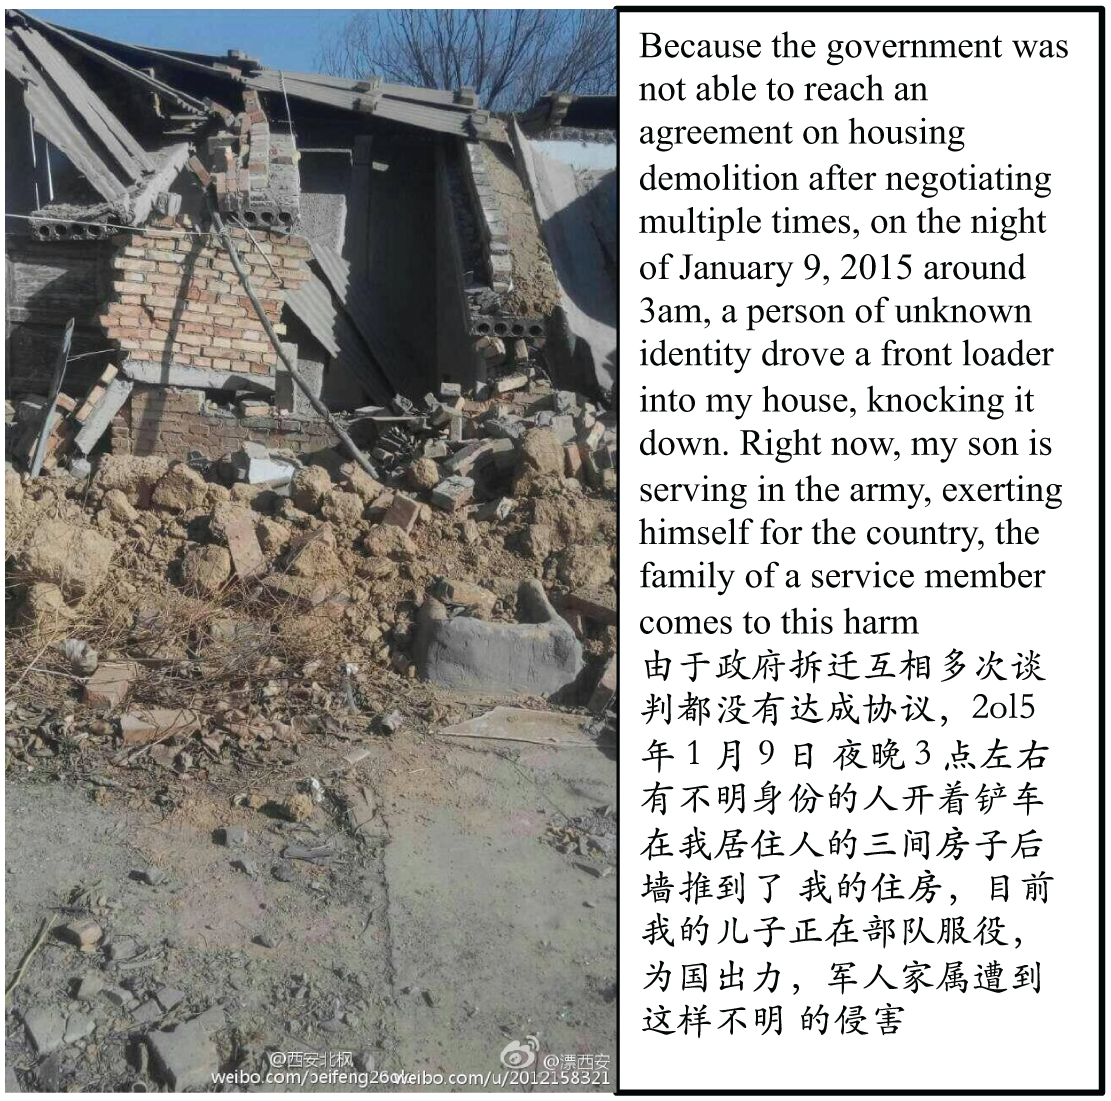
Weibo post that does not meet our definition of collective action, incorrectly classified as related to collective action (false positive) from the first-stage classifier.
Housing demolition appears frequently as a motive for collective action, but in the case of Figure 8, the Weibo post does not provide evidence of collective action as we define it (see Section 3). As a result, this post is incorrectly classified as a false positive. The following two quotes are examples of text-only social media posts incorrectly classified in the same way: What is the government of this country doing! Forced demolition, forced land-taking, corruption, and taking bribes? (这个国家的政府到底是干什么的!是不是强征强拆,贪污受贿?) What is law enforcement? Why arrest those who are just trying to demand their wages? The police are recklessly arresting people, beating people without trying to distinguish right from wrong! Is rightfully demanding wages a crime? (什么执法过当? 人家只是讨薪干嘛抓人? 警察不问青红皂白就胡乱抓 人打人! 人家正当讨薪是罪犯吗?)
These posts contain words describing issues that often motivate collective action in China—forced demolition (强拆), forced land-taking (强征), corruption (贪污), and unpaid wages (讨薪)—and words that frequently appear in discussions of collective action—police (警察), arrest (抓), and beating (打人). The first-stage classifier is not effective in distinguishing social media posts about collective action from posts that talk about the same issues, complaints, and grievances but do not meet our definition of collective action. The main reason is that in the training data, the negative examples (posts unrelated to collective action) are much less likely than the positive examples to contain the words, phrases, and images related to issues motivating protest.
To address the first type of false positive, we exclude posts that come from government or Chinese Communist Party accounts. This includes accounts of national and subnational governments, party offices, bureaucracies, and state media outlets. We acknowledge that removing all government posts may decrease the number of collective action events we identify if the government discusses collective action events online that nongovernment users of social media do not discuss online. However, we believe this scenario is relatively rare, and we want to prioritize precision over recall.
To address the second type of false positive, we use a second-stage classifier trained on data with a larger number of negative examples—posts that discuss issues and grievances such as housing demolition, police, and corruption but do not describe collective action events.
3.2.4. Second-Stage Classifier
The second-stage classifier uses the same CNN model as the first-stage classifier (the CNN model whose architecture and training method is described in Section 3.2.1). 38 However, we retrain the CNN-RNN model for the second stage (the architecture and training method remain the same as described in Section 3.2.2). A team of research assistants coded 40,505 posts with predicted probability greater than 0.8 from the first-stage CNN-RNN model. 39 Four undergraduate and master’s students who are native Chinese speakers identified by hand posts related to offline collective action. 40 Among the 40,505 posts, 9,761 pertained to offline collective action, and 30,744 did not. These 30,744 negative examples are crucial because they are much more likely to discuss issues and grievances that can motivate collective action than are the negative examples used to train the models in the first stage. To make this training data balanced, we took a sample of 20,983 (30,744 – 9,761) posts from the Wickedonna data set, so there are also 30,744 positive examples. We used these posts to train the CNN-RNN model for the second-stage classifier.
We use the CNN and CNN-RNN models to make predictions of 1,286,514 posts (associated with 1,069,113 images) with predicted probability above 0.70 from the first-stage classifier. 41 We set the probability threshold to maximize recall before application of the second-stage classifier. 42
Like in the first stage, if a Weibo post contains both text and images, we combine the two predicted probabilities to obtain a single predicted probability for each post using Equation 2. The optimal α and β for the second-stage classifier are 0.22 and 1.14, respectively. As in the first stage, α is smaller than 1, suggesting that relatively more information is based on text classifiers, and again, β is larger than 1, suggesting that posts with both text and images are indeed slightly more likely to be about protest than are posts with only text. Note that α is decreasing from the first to the second stage, suggesting the information taken from images is relatively less important in the second stage. This makes sense because many of the errors in the first stage were due to protest-related words appearing in the text of the posts, and we retrained the CNN-RNN model to better deal with text data. We consider a post as being related to collective action if the combined predicted probability is greater than 0.66, which we selected to maximize the F1 score based on out-of-sample validation.
In cross-validation, the two-stage classifier performs extremely well, with a maximum F1 score of 0.94 (precision = 0.93, recall = 0.94). For out-of-sample validation, we again use our test set of 10,000 posts (described in Section 3.2.3). The left panel of Figure 9 shows the precision-recall curve based on random guess (dot-dash line), cross-validation (dotted line), and out-of-sample validation (solid line) from the two-stage classifier. 43
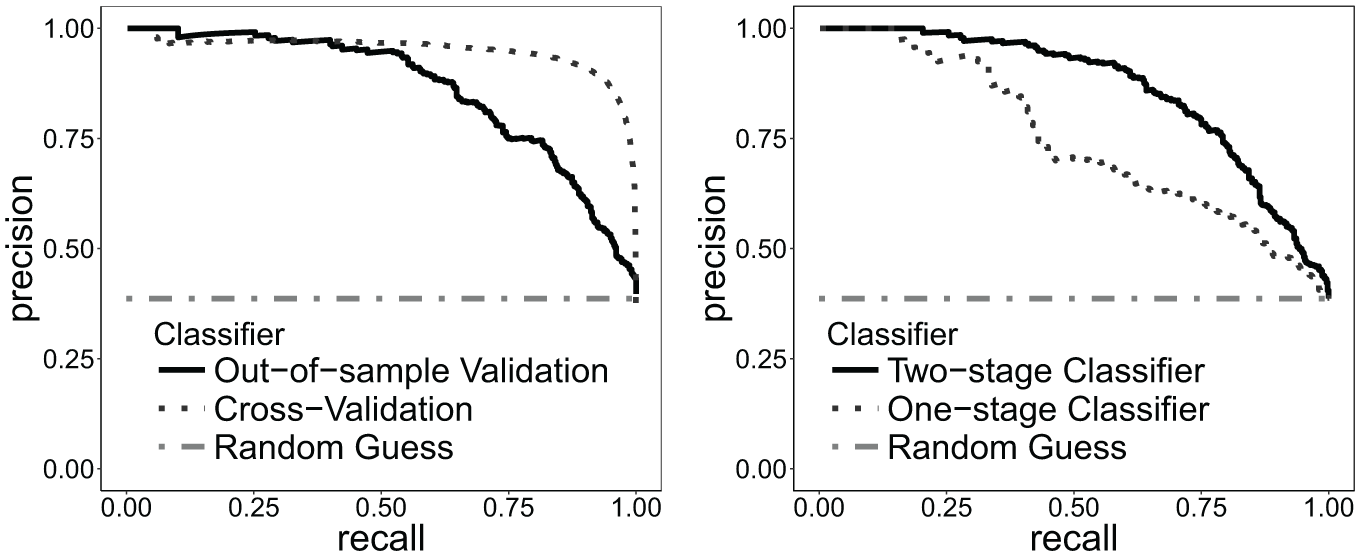
Precision-recall curve based on random guess (dot-dash line), cross-validation (dotted line), and out-of-sample validation (solid line) from the two-stage classifier (left panel); precision-recall curve of the first-stage classifier (dotted line) and two-stage classifier (solid line) (right panel).
As expected, precision and recall are better for cross-validation than for out-of-sample validation, but both are strong. The right panel of Figure 9 compares the out-of-sample performance of the first-stage classifier along with the performance of the two-stage classifier. The out-of-sample performance of the two-stage classifier is much better than that of the first stage alone, with a maximum F1 score of 0.84 (precision = 0.79, recall = 0.90). This means that at the end of the two-stage classification process, 79 percent of the posts CASM predicts to be about collective action are indeed about collective action, and CASM captures 90 percent of the human-coded collective action events from our out-of-sample validation data of 10,000 posts. Note that we cannot ascertain “true recall”—that is, to what extent our classifier can retrieve the underlying pool of posts about collective action found in all of social media, because the rarity of posts about collective action makes the creation of a human-validated data set based on all social media posts unfeasible.
From this two-stage classifier, we identify a total of 508,707 Tprotest posts out of 9.5 million that are likely discussing collective action between January 1, 2010, and June 30, 2017.
3.3. Identifying Collective Action Events
The final step of CASM is to identify unique collective action events from the posts identified by the two-stage classifier. We do so by adopting a rule-based approach that utilizes the temporal, spatial, and text information contained in the posts Tprotest. We extract two pieces of data from each post in Tprotest: (1) the date of the post and (2) the location of the post. The date of the post is included in the metadata of every post we gather from Weibo, so this step is straightforward.
3.3.1. Identifying Location
Identifying the location of a post is less straightforward. Below the central level, China is divided administratively into provinces, provinces into prefectures, prefectures into counties, and counties into townships. 44 We want to locate collective action events within these administrative divisions because collective action events in China often involve the government. Even when the target of protest is not the government, protesters often ask for government intervention. It thus makes sense to align location with existing administrative boundaries to identify unique collective action events.
When Weibo users make a post, they have an option to share the exact location where the post is being made. Only 3.3 percent of posts in Tprotest (16,770) have this attribute. When this information is available, we use the longitude and latitude from the Weibo metadata to attribute the post to the proper county.
When precise geolocation data are not available, we extract location information from the text of the post. We took a list of names of provinces, prefectures, and counties from China’s National Bureau of Statistics, 45 and we looked for these names in the text of posts in T protest . We found usable geolocation data for 53.8 percent (273,950) of posts in Tprotest. We take a conservative approach and discard the posts in Tprotest that we cannot geolocate. This means the number of collective action events we identify will be an underestimate relative to the posts we identify.
When we compare the county and prefecture location identified by our text-based extraction method against the location identified through longitude and latitude, we find that our method performs well—the county or prefecture name extracted from the text of the Weibo post matches the county or prefecture identified by longitude and latitude 95 percent of the time.
3.3.2. Identifying Events
To identify events, we combine posts by location and day. When we can identify the county, we consider all posts made within the same county on the same day, defined as a 24-hour period from 12:00 a.m. to 11:59 p.m. China time, to be the same event. When we cannot identify the county associated with a post but can identify the prefecture, we consider all posts made within the same prefecture on the same day to be the same event. We consider posts located to a county to be distinct events from posts made the same day that we can locate to the prefecture above that county (recall that prefectures are subdivided into counties). We group by day because few protests in our hand-coded data are reported on social media for more than one day.
To illustrate this approach in practice, suppose five posts reference Prefecture A on January 1. Two of those posts do not contain county names. Among the three posts that do contain county names, two reference County X, and one references County Y. According to our grouping method, there are three collective action events on January 1: one event in Prefecture A (described in two posts), one in County X (described in two posts), and one in County Y (described in one post).
There are a number of shortcomings to this method. When more than one collective action event occurs on the same day in a prefecture or county, this method undercounts the number of events. This method can also artificially inflate the number of events. Using the previous example—the two posts referencing Prefecture A without mentioning any county names could reference the collective action event occurring in County X or in County Y, and we would mistakenly count these as separate events. 46 This method assumes equivalence between date of the post and date of the event when in reality there may be multiple posts about the same event on different days even if the event is confined to a single day. Finally, this grouping method misses cross-regional protests, which are rare in China but would be of substantive interest.
From the 508,707 posts about collective action in Tprotest, we can identify location for 273,950 posts, from which we identify 136,330 unique collective action events. Going forward, we refer to this data set of 136,330 unique events as the CASM-China data set. On average, each collective action event is discussed in 2.01 posts. This suggests CASM is able to recover collective action events that receive limited overall attention on social media. 47
In future iterations of CASM, we hope to explore alternative methods of post grouping and improve the identification of unique events. For example, we could use additional location information, such as well-known locations that are not administrative regions (e.g., Tiananmen Square, Beijing Railway Station, Zhejiang University), and we could experiment with grouping based on issue in addition to location and time.
4. CASM Output and External Validity
The 136,330 collective action events that constitute the CASM-China data set occur in regions throughout China. Figure 10 shows the logged count of CASM-China events by prefecture. Darker colors correspond with more collective action events, lighter colors with fewer events, and prefectures in gray are those for which we did not identify any collective action events. The regions where we do not identify any collective action events over the seven and a half–year period are clustered in ethnic minority regions, such as prefectures in Tibet, Xinjiang, and Sichuan, and in military-controlled areas such as counties in Hainan. The lack of data from Tibet and Xinjiang may reflect the imposition of more stringent forms of repression and Internet controls in these regions by the Chinese government and lower usage of Chinese-language social media platforms.
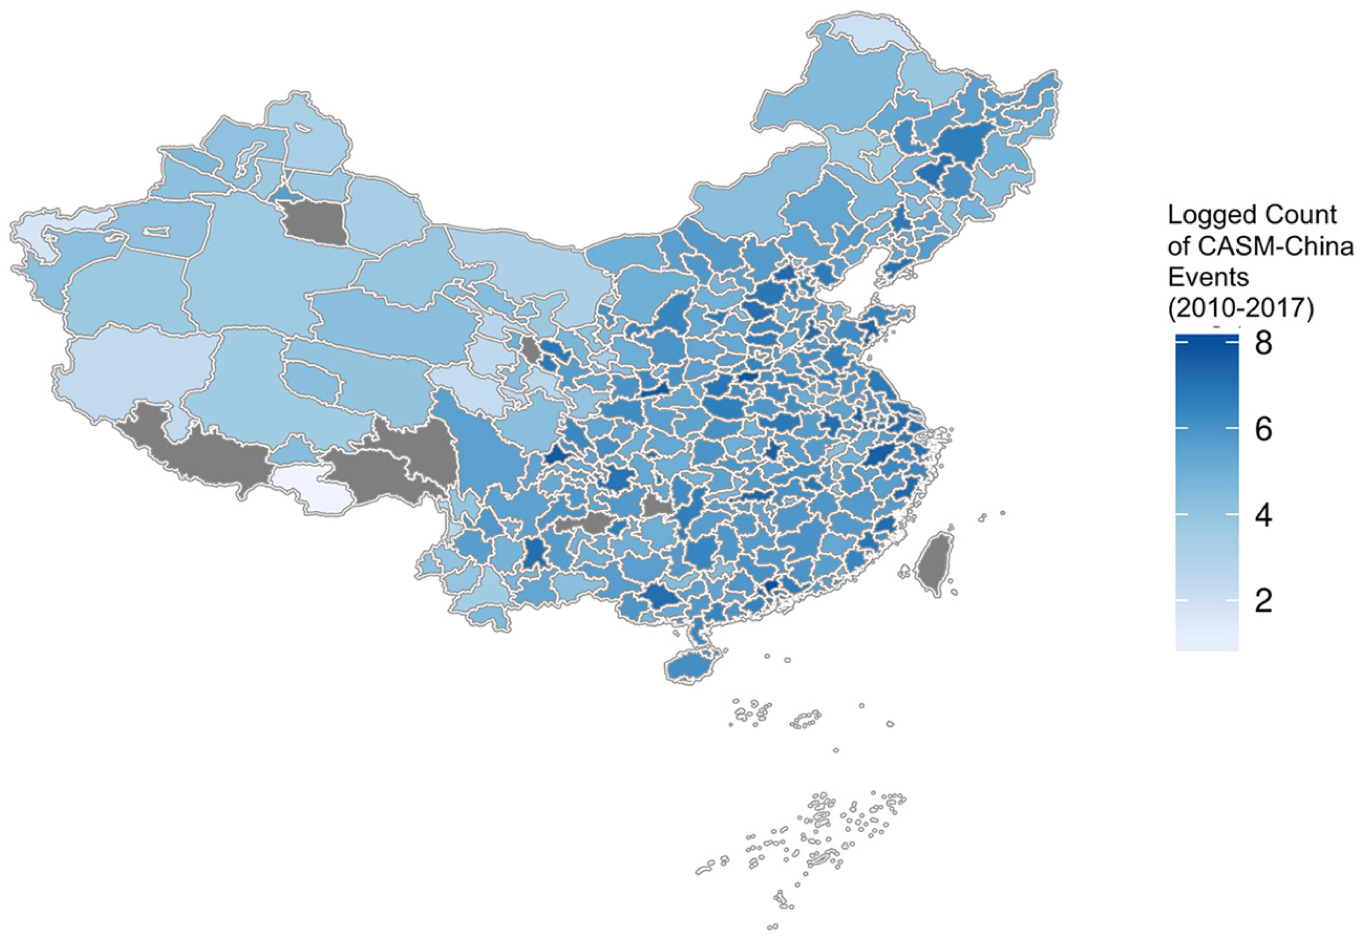
Log count of CASM-China events by prefecture (January 2010–June 2017).
The solid black line in Figure 11 shows the monthly count of events in CASM-China from January 1, 2010, to June 30, 2017. The number of events increases from 2010 to 2013 and declines after 2013. The 2010 to 2013 increase is likely due to the growing popularity of Weibo and increasing availability of data. The 2013 to 2017 decline may in part reflect the declining popularity of Sina Weibo. To account for the change in the popularity of the Weibo platform, we gather posts containing a Chinese idiom we do not expect to relate to collective action. 48 Usage of this idiom on Weibo also declines from 2013 to 2017 (see online supplemental appendix). If we use this idiom as an indicator of Weibo’s declining popularity and divide the count of CASM-China posts by the count of posts containing this idiom, we find that the volume of collective action events remains steady overall from 2013 to 2017 but experiences short-term fluctuations—a spike in the relative number of events identified by CASM at the beginning of 2015 (January and February) and near the middle of 2017 (May and June) (see Figure 11).
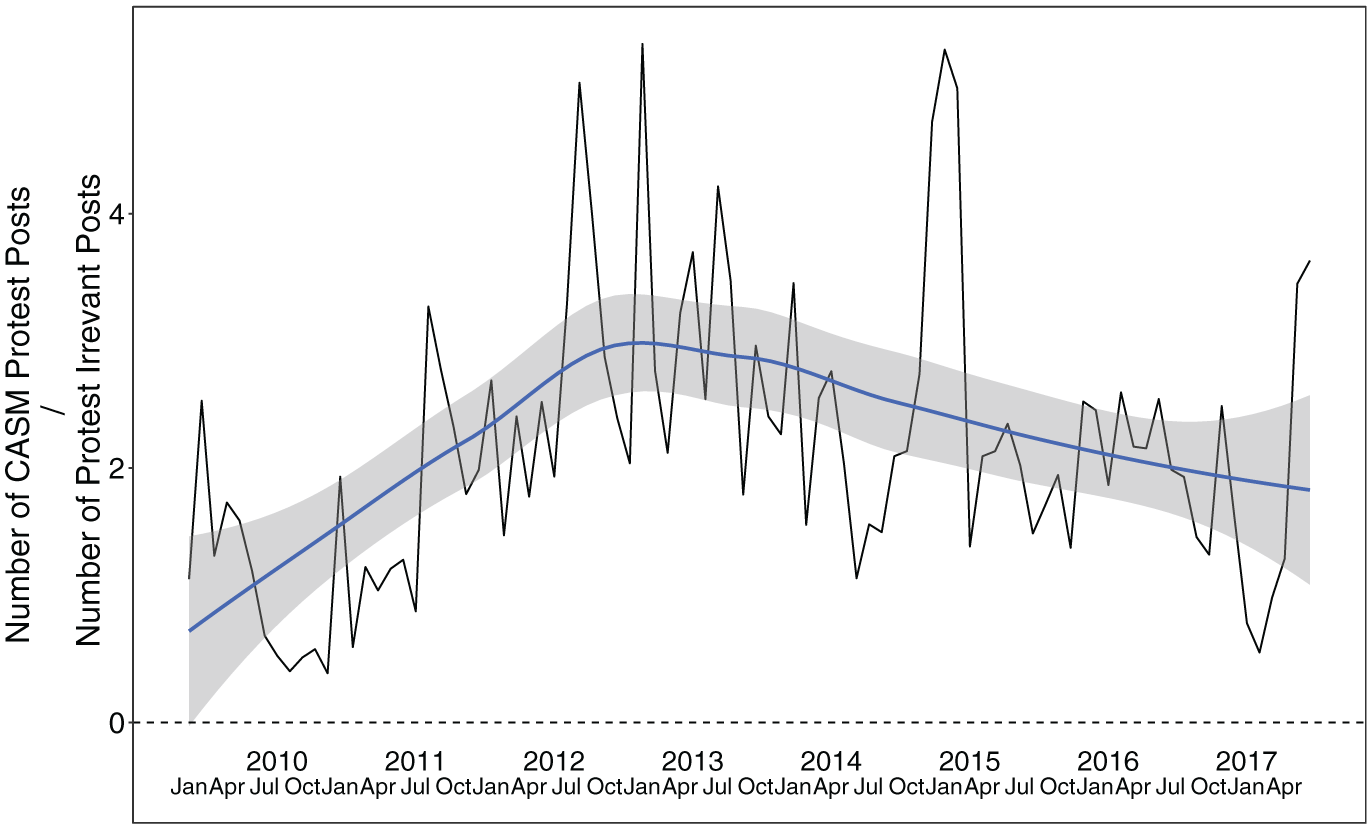
Number of CASM-China posts divided by the number of posts that contain an idiom unrelated to collective action, with loess smoothing.
This overall result goes against the prevailing perception that collective action is steadily increasing in China. Although we do not know the reason for the relatively stable rate of collective action events after 2013, we observe that it overlaps with the political tenure of Xi Jinping, which has been characterized by more stringent social and political controls.
This article describes how CASM works and provides the general contours of CASM-China. However, we recognize that the text and images of Tprotest contain much more information about collective action events than simply the time and location of occurrence. Here, we provide a first-pass look at two features of collective action events—the form of protest and the issues motivating protest—that we identify by using keywords generated from close reading of posts in Tprotest and existing research on collective action in China (Cai 2010; Chen 2011; Lee 2007; O’Brien and Li 2006; Perry 2008; Qin et al. 2017; Weiss 2014; see the online supplemental appendix for the set of keywords). 49
Following Almeida (2003), we categorize collective action events into three main forms. The first form includes conventional collective action events, such as street marches, strikes, public gatherings, public demonstrations, and public group petitions. The second form is disruptive collective action events—for example, occupation of buildings, occupation of land, construction of barricades, and cutting off power supplies. The third form is violent collective action events, including armed attacks and physical conflicts with government officials. An event is considered to be a particular form if posts pertaining to the event contain one or more of the keywords in that category (see the online supplemental appendix for the set of keywords). An event is placed in the violent category if it contains any of the keywords in this category, even if it contains keywords belonging to either of the two other categories. An event is placed in the disruptive category if it contains keywords in this category and the conventional category. We code posts in this way because violent and disruptive forms of collective action, which incur higher costs, are of particular substantive interest (Lorentzen 2013). Among the collective action events in CASM-China, 43 percent are conventional in form, 32 percent exhibit violent characteristics, and the remaining 25 percent exhibit disruptive characteristics.
We also examine the issues that motivate protest using hand-curated keywords (see the online supplemental appendix for keyword list). We focus on 11 types of issues that China scholars have identified as important motives for collective action in China today (Cai 2010; Dimitrov and Zhang 2017; Goebel 2017) (in alphabetical order):
Education: protests by parents over the difficulty of enrolling their children in public schools, over inequalities in educational access based on wealth and geography, and over the perceived bias and corruption of school administrators and teachers 50 ;
Environment: collective action over environmental issues such as air pollution and the construction of chemical plants (Deng and Yang 2013);
Ethnic/religious: collective action by ethnic minorities, such as the Uyghurs in western China, as well as religiously motivated collective action such as which occurred in the aftermath of Christian church demolitions in eastern China 51 ;
Fraud/scams: protest over fraud, scams, and the lack of consumer protectors, such as actions that erupted following losses sustained in risky peer-to-peer lending platforms 52 ;
Homeowner/property: collective action motivated by conflicts over property ownership, primarily related to corruption by real estate developers and property management companies 53 ;
Medical: protest over medical disputes—for example, family members protesting against hospitals for negligence and malpractice (Liebman 2013);
Pension/welfare: collective action over welfare provision, especially pensions (Hurst 2004; Hurst and O’Brien 2002);
Rural/land: collective action due to forced land-taking and other land-related conflicts in rural areas (Guo 2001);
Taxis: protests by taxi drivers, which have intensified in recent years over fees imposed by local governments as well as competition from ride-sharing companies 54 ;
Unpaid wages: workers’ and migrant workers’ collective action due to unpaid wages (Blecher 2002; Su and He 2010);
Veterans: protests by veterans over welfare and benefits (Diamant 2010; Tong and Lei 2010).
Although some of these issue categories are subcategories of larger issues—for example, taxi driver protests and protests over unpaid wages are all labor issues—we include more specific categories because they have been of interest to China scholars. Instead of mutually exclusive categories, if posts regarding an event contain keywords across issues, we place the event in multiple categories, and we reweigh the distribution so that the category proportion of each issue sums to one. 55
Among collective action posts with keywords related to our list of 11 issues, 56 a quarter of CASM-China events relate to unpaid wages (29 percent), slightly more than a quarter relate to conflicts over property (26 percent), and slightly less than one in five relate to conflicts over land (17 percent). The remaining 28 percent of events fall into the remaining eight issue categories (for details, see Table 3).
4.1. Comparison with Other Protest Data Sets in China
We compare CASM-China against other data sets of collective action. This is important because it makes the biases and limitations of CASM and the resulting data clearer so that any analysis conducted with these data can be interpreted more appropriately.
We use three data sets of collective action based on newspaper data: the Global Database of Events, Language, and Tone (GDELT); the Integrated Conflict Early Warning System (ICEWS); and WiseNews. 57 GDELT takes an unsupervised machine learning approach to identify events of interest, including collective action events, from global news sources. 58 ICEWS also monitors global news agencies to detect political events, with an emphasis on accuracy. WiseNews is a data set of collective action events we generate by applying CASM on a corpus of more than 1,500 major Chinese, Hong Kong, and Taiwan newspapers from the WiseNews database (Shao 2017). In addition to newspapers, the WiseNews database also contains social media data from WeChat, another social networking site in China. 59 Details of these three comparison data sets can be found in the online supplemental appendix.
We use two hand-curated data sets of protests in China: the Wickedonna data set, which is used as part of our training data, and the China Labor Bulletin (CLB), which documents labor-related protests. 60 Both data sets have been used by scholars of China to study collective action (Dimitrov and Zhang 2017; Goebel 2017). 61
Because these data sets cover different time periods, we compare them for a six-month period from January 1, 2016, to June 30, 2016. Table 1 shows the number of collective action events identified by CASM-China and all the comparison data sets. CASM-China identified 10,499 events during the first half of 2016. The Wickedonna data set contains 11,085 events, CLB 1,455 events, GDELT 299 events, WiseNews 276 events, and ICEWS 25 events during the same period. The low number of events identified by GDELT and ICEWS likely reflects limitations on reporting placed by the Chinese government on foreign media. The low number of events in WiseNews may be driven by our method of identifying collective action events (by applying CASM to newspaper data); however, it likely also reflects Chinese government constraints on media reporting of collective action as the difference is in orders of magnitude.
Comparison of CASM-China with Other Data Sets of Collective Action in China (January 1, 2016–June 30, 2016)

Note: CASM = collective action from social media; GDELT = Global Database of Events, Language, and Tone; ICEWS = Integrated Conflict Early Warning System.
We estimate that slightly over half of the collective action events identified by GDELT and ICEWS are found in CASM-China—56 percent of events in GDELT and 52 percent of events in ICEWS (see Table 1 and the online supplemental appendix for estimation details). Even though a relatively small number of protests are reported by international news outlets, CASM-China has low coverage of these collective action events. This is primarily due to foreign media’s emphasis on ethnic and religious conflict, which appears relatively rarely on social media. Among WiseNews’s collective action events, 88 percent are in CASM-China. For protests reported in the CLB, 75 percent of events are covered by CASM-China, and 65 percent of events in the Wickedonna data set are covered by CASM-China. Because data for CLB are based on a subset of data from the Wickedonna data set, especially during the first half of 2016, we examine in greater depth the 35 percent of collective action events identified by the Wickedonna data set that are not in CASM: 15.8 percent of events in the Wickedonna data set are not detected by CASM-China because they do not contain any keyword from our dictionary K; 10.4 percent are not identified because the posts are no longer found on Sina Weibo, likely due to censorship; and the remaining 8.3 percent are not found likely due to Weibo’s restriction on data collection.
Table 2 shows the proportion of events in CASM-China and the comparison data sets that are conventional, disruptive, and violent. CASM-China contains the largest proportion of violent events (32 percent), followed by GDELT (30 percent), Wickedonna (23 percent), and WiseNews (17 percent). The presence of violent collective action in GDELT aligns with existing research on biases in media reporting toward more sensational events (when media is not state-controlled). Disruptive events have the highest prevalence in WiseNews (55 percent) and CLB (52 percent), followed by GDELT (44 percent), Wickedonna (30 percent), and CASM-China (25 percent). This result is interesting because we are applying CASM, trained on Weibo data, on WiseNews data to identify collective action events, which might make the distribution of events in WiseNews more closely resemble that of CASM (more violent events). Due to biases in media reporting, we also would have expected to see more reports of violent protests in WiseNews, yet the majority of collective action events reported in WiseNews are disruptive. One possible explanation for this is that the Chinese government may prohibit Chinese media outlets from emphasizing violent protest, and in an attempt to capture an audience, Chinese media outlets may focus more on disruptive events. More research is needed to test this hypothesis. Finally, Wickedonna contains the largest share of conventional events (47 percent), followed by CASM-China at 43 percent.
Comparison (%) of the Form of Collective Action (January 1–June 30, 2016)

Note: CASM = collective action from social media; CLB = Chinese Labor Bulletin; GDELT = Global Database of Events, Language, and Tone.
We compare the distribution of issues in CASM-China to that of other data sets by applying the same keyword approach to data for the Chinese-language sources. Because the GDELT data are in English, we place them into these issue categories by hand. Table 3 shows the proportion of events containing keywords in each category, with rows in descending order based on the proportion of events related to each issue for CASM-China.
Comparison (%) of Issues Motivating Collective Action (January 1–June 30, 2016)

Note: CASM = collective action from social media; GDELT = Global Database of Events, Language, and Tone; CLB = Chinese Labor Bulletin.
CASM-China identifies relatively more collective action events related to rural land disputes (17 percent) than do other data sets (e.g., 12 percent in Wickedonna, 6 percent in WiseNews, 4 percent in GDELT). This is striking because we might expect rural usage of social media to lag behind that of urban areas, biasing events in CASM-China away from rural events. However, rural social media usage in China expanded dramatically in the past decade (McDonald 2016), and we see that reflected in the relative share of rural and land-related collective action events captured by CASM-China. As expected, CASM-China identifies far fewer events related to ethnic and religious conflict (0.45 percent) than does GDELT (40 percent). This reinforces the fact that CASM-China identifies relatively fewer collective action events from minority regions of China, whereas international media focuses on ethnic tensions.
The distribution of issues in CLB is heavily skewed toward unpaid wages, which is expected because CLB focuses on labor. WiseNews emphasizes conflicts over property and homeownership, followed by unpaid wages, and then fraud and scams. The WiseNews results are again interesting because our method of identifying collective action in WiseNews should bias the type of events found toward those found on social media (i.e., unpaid wages, property conflict, land conflicts), but we see very little Chinese news reporting on land conflicts compared to social media reports and no media reporting on several categories, such as ethnic and religious issues. This might be because the government censors Chinese media on these topics or because Chinese media talks about these topics in different ways than do Chinese people.
Because CASM-China shares many similarities with the Wickedonna data set, we compare them over time. Figure 12 shows the count of events from the two data sets from 2010 to 2017. The post-2013 trend between the two data sets looks very different. There is a steady increase in the number of events in the Wickedonna data set, whereas there is a decrease in the number of CASM-China events. We know from previous analyses in Figure 11 that some of the decrease in CASM-China is due to the declining popularity of Sina Weibo, but even after controlling for usage of Weibo, the time trend in the number of protests between CASM-China (stable from 2013 to 2017) and Wickedonna (increasing from 2013 to 2016) is different. Three possibilities could account for this difference. First, the activists who hand-curated the Wickedonna data set improved their ability to identify collective action events over time. Second, the definition of protest in the Wickedonna data set expanded over time. Third, discussions of collective action moved to other social media platforms, which are captured by Wickedonna but not CASM-China, at rates greater than the general decline in popularity of Weibo.
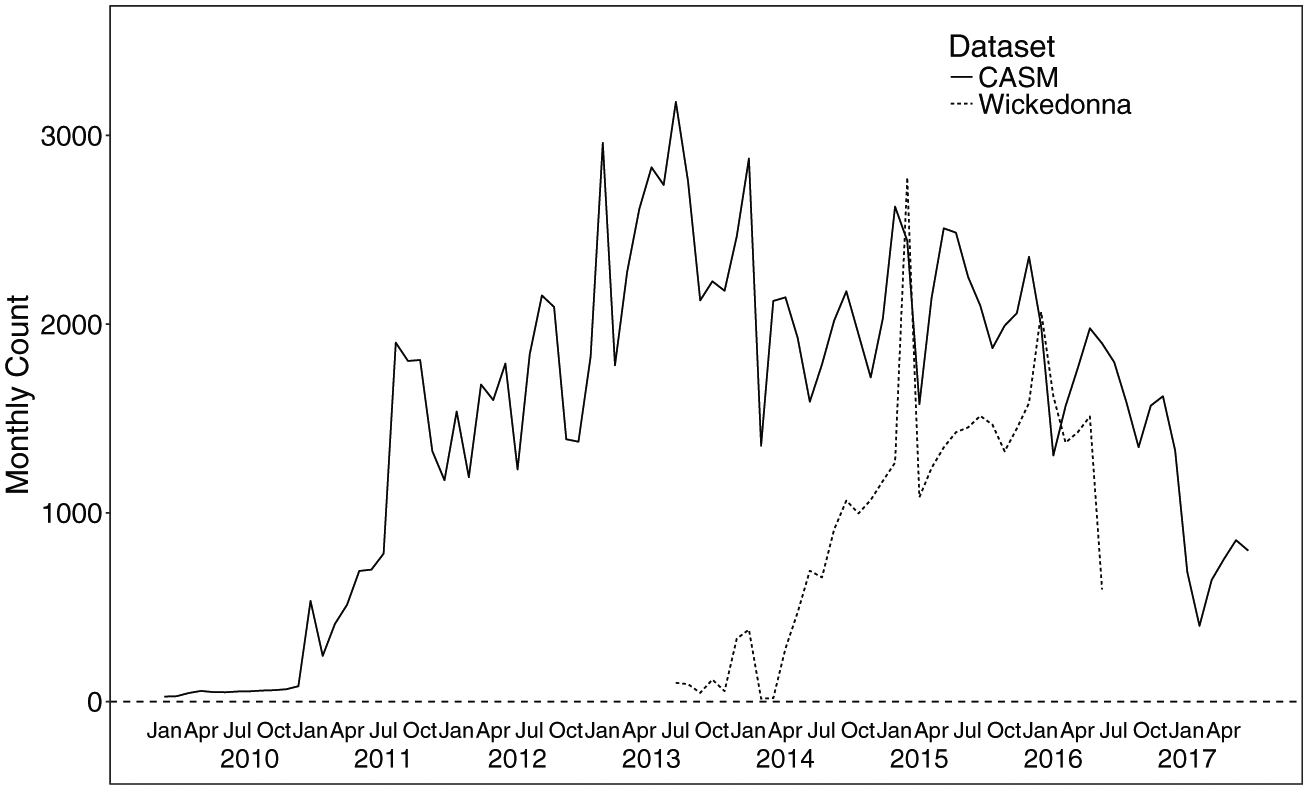
Monthly count of CASM-China collective action events (solid black line) compared with monthly count of events from the Wickedonna data set (dotted line).
These comparisons show that no data set of collective action, including CASM-China, should be considered complete. The output of CASM-China is biased but can complement events identified in hand-curated data sets, international media reporting, and Chinese media reports.
4.2. Online Censorship
Another potential source of bias is online censorship. As discussed in Section 2, censorship can limit the use of social media as target data for identifying collective action events by generating self-censorship and limiting the diffusion of knowledge around protest. In addition to these general effects of censorship, online censorship in China is specifically aimed at removing discussions of collective action (King et al. 2013, 2014). Under such conditions, how can social media data be used to detect collective action events? The answer to this seeming contradiction lies in the recognition that content removal in China is post hoc, focused on bursty (viral) online discussions, and incomplete. Censorship of collective action is not based on keywords (King et al. 2014). Only when collective action events garner a great deal of discussion and attention on social media is the content censored. This means discussions of collective action on social media that do not attract out-sized attention will remain uncensored. Finally, Roberts (2018) shows that even with censorship of bursts of discussion of collective action, a few posts often escape censorship.
To empirically assess the impact of Chinese censorship, we use a corpus of Weibo data collected in real time in January 2018, before the Chinese government could remove the subset they deemed objectionable. We found 121,088 posts containing at least one of the 50 keywords in K, and we applied CASM to these posts. We identified 1,936 posts related to real-world collective action, and we could geolocate 1,570 to the prefecture or county level. From these 1,570 posts, we identified 971 unique events. Among these posts, only 127 (8.1 percent) were later censored, leading to a loss in identifying 67 unique collective action events (6.9 percent).
This analysis confirms our expectation that post hoc content removal does not have a substantial influence on CASM’s ability to detect collective action events that have been reported online in China. However, online censorship may affect use of social media data for protest event analysis in other ways. For example, individuals may self-censor out of fear that speaking out on social media will lead to reprisals (Pan and Siegel 2018). Censorship may also limit diffusion of knowledge of collective action online and indirectly reduce the overall discussion of protest and collective action.
5. CASM Beyond China
The framework and approach of CASM can be applied to other regions of the world and other linguistic, cultural, and political contexts. The following aspects of CASM are generally applicable: using keywords to first select social media posts to improve precision, due to rarity of online discussions about collective action events; using CNN models to classify image data and CNN-RNN models to classify text data; using a second-stage classifier to differentiate discussions of offline collective action events from social media posts with similar terminology that do not describe collective action events; and using the temporal and spatial information of social media posts to identify unique events.
However, CASM trained on Weibo data cannot be applied wholesale to non–Chinese language social media data. To adapt CASM for other languages and countries, we need to consider (1) where/how to collect data, (2) data to identify keywords K and train text/image classifiers, (3) whether to include the second-stage classifier, and (4) how to combine posts into events.
5.1. Data
Outside of China, the main source of social media data is likely to be Twitter, which has widespread, global adoption and whose data are relatively accessible for researchers (Steinert-Threlkeld 2018). CASM may not be applicable in countries like Myanmar, where social media is dominated by Facebook, because Facebook data are relatively less accessible for academics.
5.2. Identifying Keywords
To identify keywords and train the first-stage deep-learning algorithms, we relied on a large set of data on collective action curated by two Chinese activists. Equivalent training data will not always be available in other contexts, and the unavailability of training data will limit the application of CASM. However, a growing literature uses large-scale social media data to study collective action events around the world, 62 and there is emerging research analyzing social media imagery of protest. 63 Although prior studies have not focused on using social media data to identify protest, this work nonetheless represents collections of social media data related to protest that can be used to identify keywords (K) and as training data for the first-stage classifier. In terms of retraining the deep-learning algorithms, the text-based CNN-RNN model must be retrained if applied to non-Chinese social media data. However, the CNN model for image classification may be more easily transferred outside of China and used to identify protests elsewhere because it is not language dependent. Researchers in other regions could take our pretrained CNN model as is or take our pretrained CNN model and retrain one or two of the final convolutional layers.
5.3. Second-Stage Classifier
In contexts outside of China, we still expect a second-stage classifier will improve performance. Social media is user-generated and used for claims-making (Koopmans and Statham 1999). Motives for offline collective action may overlap with other claims made on social media, and a second-stage classifier would help make this distinction. However, a second-stage classifier for other country contexts will require human coding on the output of the first-stage classifier. Thus, researchers will need to decide whether to include the second-stage classifier based on the performance of the first-stage classifier relative to the cost of human coding.
5.4. Grouping Posts into Events
Finally, how posts are combined into events will differ based on the availability of geolocated metadata, the type of geographic units used, and the difficulty of extracting location from text, which will vary by country and language. For example, one might not use government administrative regions as the base location unit in democracies because relatively fewer collective action events target the government. Advances are being made in the extraction of geolocation data from text (Lee, Liu, and Ward 2018), which we expect will aid in this process.
In extending CASM beyond our application here, several other considerations merit discussion. Social media changes quickly in terms of topics of discussion, platform features, algorithms, and the emergence of new apps and technologies. The CNN and CNN-RNN models in CASM will need to be retrained repeatedly to capture changes in how users communicate on social media. Care needs to be taken when making comparisons over time, and researchers must account for changes in the popularity of social media sites (as we did with Weibo, see Figure 11). For example, if CASM’s framework is applied to a different country using Twitter data, we need to consider the rate of Twitter penetration in that country when examining changes in the number of collective action events over time. In addition, censorship varies across countries. In China, Internet content providers censor content quickly and thoroughly in accordance with government demands, resulting in bursts of censorship around discussions of collective action. In other countries, the market for social media is dominated by U.S. firms that acquiesce to censorship demands slowly or impartially (Pan 2017), such that censorship is not aimed at removing online discussion of collective action. Instead, physical repression might be used to motivate self-censorship, or Internet blackout and website blocks might be implemented to prevent access to information. This means the bias induced by censorship in other contexts will relate to the extent to which social media is used to discuss collective action rather than the extent to which researchers can collect social media posts about collective action before they are removed.
6. Conclusion
This article introduces CASM, an approach to identifying collective action events using social media data. We discuss the advantages and limitations of using social media as a new target data source for protest event analysis, and we make methodological innovations in the creation of protest event data sets by using deep learning, image as data, and two-stage classification. We assess the internal performance of our system through cross-validation and out-of-sample validation. We assess the external validity of the CASM output by comparing it to other protest event data sets and evaluating the impact of censorship. We hope these assessments show more generally how internal and external validation can help researchers apply computer science methods to social science domains. The implementation of CASM in China, using Sina Weibo data, results in a large data set of collective action events with high spatiotemporal resolution spanning a seven-year period.
There are ethical considerations related to creating a system to identify collective action events from social media data. Social media data are generated by individuals and can contain personally identifiable information. Collective action is often a form of participation that nondemocratic governments deem objectionable. Creating a system to identify these activities could face a “dual-use dilemma”: A system created for research purposes could be used by other actors in potentially harmful ways (Miller and Selgelid 2007; Selgelid 2013). We describe the methods of this system because the underlying models we use (e.g., CNN, CNN-RNN) and the methods associated with them (e.g., adaptive gradient-based optimization) are already publicly available and because we are measuring collective action retrospectively. We believe the need for replicable and transparent research outweighs dual-use concerns in this case.
Social media data provide unique benefits in detecting collective action events in authoritarian regimes because they provide information when other sources, such as traditional media, are silent. Our intention is not to argue that social media is a better target source than traditional media or that it should replace other target sources. Protest event analysis based on social media data should complement existing data sets to advance our understanding of the patterns of collective action.
Supplemental Material
protest_method_appendix_final – Supplemental material for CASM: A Deep-Learning Approach for Identifying Collective Action Events with Text and Image Data from Social Media
Supplemental material, protest_method_appendix_final for CASM: A Deep-Learning Approach for Identifying Collective Action Events with Text and Image Data from Social Media by Han Zhang and Jennifer Pan in Sociological Methodology
Footnotes
Acknowledgements
Our thanks to Isabella Cai, Weronika Cheng, Hong Fan, Yu Ji, Yuju Lin, Yingdan Lu, Tara Parekh, Yanchen Song, Feiya Suo, Debnil Sur, Jiajing Xu, Jing Wang, Yao Yang, Yunhui Ye, Shirui Peng, Kezhen Zhao, Yichao Cui, Elise Jiang, and many others for superb research assistance; Charles Chang for his work in data collection; Thresher for research support; and Ling Chen, Alex Hanna, Pamela Oliver, Tamar Mitts, Emily Ritter, Arturas Rozenas, Matt Salganik, Georgiy Syunyaev, Joshua Tucker, and Yu Xie for many helpful comments and suggestions; and the Stanford Cyber Initiative and Stanford Center on Global Poverty and Development for funding support.
Funding
The author(s) disclosed receipt of the following financial support for the research, authorship, and/or publication of this article: Funding support was provided by the National Science Foundation (grant 1831481), the Stanford Cyber Initiative, and the Stanford King Center on Global Development.
Notes
Author Biographies
 .
.
References
Supplementary Material
Please find the following supplemental material available below.
For Open Access articles published under a Creative Commons License, all supplemental material carries the same license as the article it is associated with.
For non-Open Access articles published, all supplemental material carries a non-exclusive license, and permission requests for re-use of supplemental material or any part of supplemental material shall be sent directly to the copyright owner as specified in the copyright notice associated with the article.
