




Abstract
Xenophobic violence is a fundamental obstacle to the mental, social, and economic wellbeing of international migrants living and working in South Africa. Currently, there is substantial contention on what determines participation in this type of behaviour. This article looks at the role of perceived threat and whether such attitudes are driving both past participation and potential participation in anti-immigrant violence. Data from three rounds (2015–2017) of the South African Social Attitudes Survey (N = 9,292) was used for this study. Although a majority were found not to have taken part in violence, many people indicated a willingness to consider participating in anti-immigrant violence in the future. A multivariate (multinomial) regression approach was employed to identify those factors most associated with violent participation. Perceived threat was shown to be a robust predictor of potential participation in violence. This suggests that anti-immigrant perceptions could have a mobilising effect, spurring individuals towards acts of violent xenophobia.
South Africa is a violent society with alarmingly high levels of reported murders, assaults, and malicious damage to property. Psychology has made a significant contribution to understanding the determinants of this level of violence (for a review of the foremost contributions, see Seedat, Van Niekerk, Suffla, & Ratele, 2014). Palmary (2018) has implored psychologists working in Africa to investigate issues related to migration. Xenophobic violence is a fundamental obstacle to the mental, social, and economic wellbeing of international migrants living and working in South Africa. The contributions of psychological scholarship to our understanding of xenophobic violence in the country have been surprisingly slight. Instead, much of the existing academic research on this topic has come from the social and political sciences. 1 Most of this work has focused on whether certain objective economic (e.g., employment) or political characteristics act as determinants of xenophobic violence. 2 The role of attitudes in predicting participation in violence has been underappreciated. Psychological research can make a unique contribution to how we understand the attitude–behaviour relationship on this issue.
In response to Palmary’s call, this study will look at whether public perceptions about immigrants are driving participation in violence against international migrants in South Africa. For the purposes of this article, xenophobic violence is defined as violence motivated by bias against people from other countries. It is important to acknowledge that this form of aggression is part of a larger history of anti-outsider hostility in South Africa. Studies of xenophobia in the country have traditionally focused on specific episodes of collective violence and most research has been conducted at the community level. Some of this research was produced by academic institutions (e.g., Fauvelle-Aymar & Segatti, 2012 or Claassen, 2016), while others have emerged from civil society (such as Parsley & Everatt, 2010), or have been undertaken by the South African government. 3 In this article, I will focus more on who participates in violent action rather than specific episodes of collective violence. In doing so, I depart from existing academic trends and looks at participation in violence more broadly. To better understand the determinants of violence, I will examine participation intention as well as past participation using quantitative public opinion data. This is one of the first large-scale public opinion studies of individual participation in xenophobic violence in South Africa.
The attitude–behaviour relationship
Psychologists have long considered attitudes to be an important subject of study because they can be used to predict social behaviour (Petty, Wegener, & Fabrigar, 1997). In the right situations, the relationship between attitudes and behaviour can be quite strong (Fishbein & Ajzen, 2011). Public opinion surveys have been used to understand and predict behaviour in large populations, and surveys have looked at both self-reported behaviour as well as behavioural intention. Meta-analyses of the intention–behaviour link demonstrate that behavioural intentions do have a relationship with actual behaviour (Webb & Sheeran, 2006). Although this relationship is not always linear, there is undeniably a link between one’s behavioural intention to participate in a future behaviour and actual participation (also see Sheeran, 2002). The type of behaviour under consideration will, undoubtedly, have an effect on the attitude–behaviour relationship. Violent behaviour faces greater societal sanction than other forms of discriminatory behaviour (Collins, 2009). Consequently, the decision to participate in discriminatory violence needs to be recognised as a special type of discrimination.
There is a significant and growing literature on when attitudes predict behaviour and how this process may occur. Much of this literature is based on the Theory of Planned Behaviour, which hypothesises that attitudes are the major determinants of behavioural intentions (Ajzen & Fishbein, 2005). Although this theory emphasises the effect attitudes have on behaviour, the theory concedes that situational, normative, and individual characteristics likewise have an effect (also see Ajzen & Fishbein 2000; Fishbein & Ajzen, 2011). This study is concerned with how feelings of threat towards an outgroup 4 shape behaviour towards that group. Stereotypes about the threat posed by an outgroup are thought to induce various emotions (such as fear and hatred) towards that outgroup. In turn, these emotions are thought to drive behaviour towards that outgroup. This is especially true when considering the relationship between prejudice and behaviour. Although xenophobia can be a difficult concept to define (see a discussion of this issue by Sundstrom & Kim, 2014), it is best conceived of as a form of prejudice.
For a period of time, it was thought that prejudice was a poor predictor of behaviour. However, meta-analyses on the prejudice–behaviour relationship in the 1990s tended to find consistent support for this relationship. Based on an examination of 60 independent studies, Schütz and Six (1996) found a significant mean correlation (r = 0.36) between prejudice and behaviour and an even stronger correlation (r = 0.45) between prejudice and behavioural intentions. A similar result was found in an analysis of 23 studies by Dovidio, Brigham, Johnson, and Gaertner (1996) as well as by Duckitt (1992) in his analysis of the literature. These meta-analytic reviews show that the relationship depends on several moderators, but it would appear that there is a relationship between prejudice and discrimination (for a more recent review, see Carlsson & Eriksson, 2017). Most of these psychological studies are based on laboratory experiments, however, and it is uncertain to what extent the outcomes of this work can be generalised to real-world situations.
Methods
Participants
Data from the 2015–2017 rounds of the South African Social Attitudes Survey (SASAS) were used for this study. SASAS is an annually repeated, cross-sectional opinion survey. Each round of the survey series typically has a realised sample of approximately 3000 adults living in private homes. SASAS defines an adult as anyone who was aged 16 years and older at the time of interview. The 2015 and 2017 SASAS rounds were conducted between the October and December of that year, while the 2016 survey round was fielded in January and February 2017. The sample was designed to be representative of different age, provincial, geographic, and population groups. Data from the three rounds were combined, and the unweighted summary statistics for this pool sample is provided in Table 1. This table demonstrates the diversity of the SASAS sample. All SASAS questionnaires were translated into the country’s official languages for ease of interpretation by respondents. Before the SASAS questionnaires are fielded, all questionnaires are tested and evaluated in selected number of households during a survey pilot phase. 5
Summary statistics (unweighted) for the SASAS sample (Round 2015–2017).
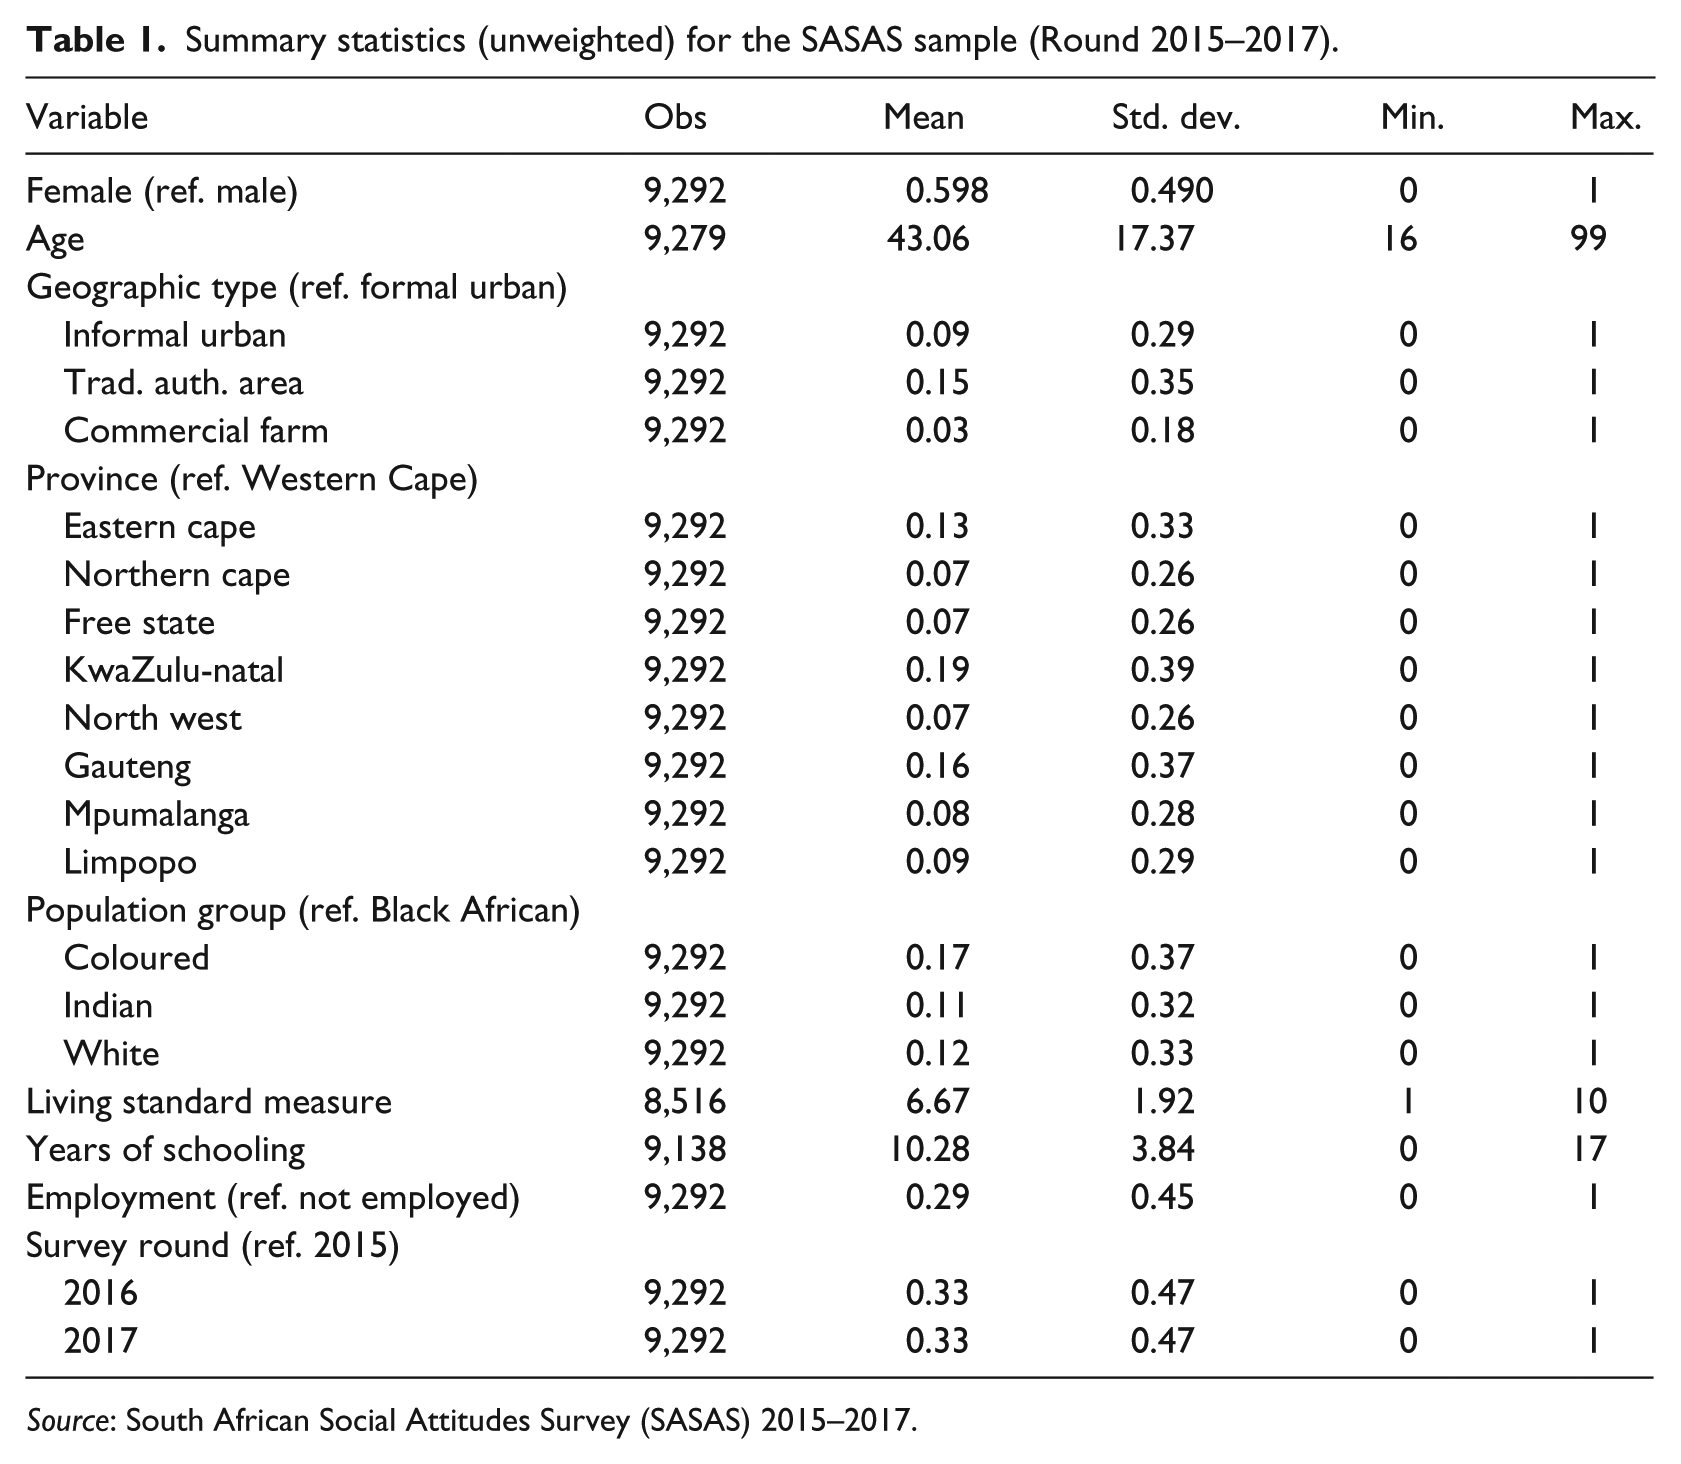
Source: South African Social Attitudes Survey (SASAS) 2015–2017.
Instrument
The SASAS questionnaire contained a range of items to capture data on respondent’s economic and socio-demographic status. Using these questions, I was able to provide a definitive measure of an individual’s position within the country’s socio-economic hierarchy in South Africa. Here, I employed three different metrics of an individual’s economic status. The first was a simple dummy variable (0 = not employed; 1 = employed) that gauged whether an individual was in paid employment. 6 Second, I utilised a question on the highest level of formal education that a respondent had completed at the time of interview. Using responses to this question, I constructed a continuous educational attainment variable that measured the years of completed formal schooling (0–16). Finally, I employed a well-known index of asset ownership from the South African Advertising Research Foundation known as the Living Standard Measure (LSM) index. This indicator is comprised of more than 30 questions and was specially designed to gauge socio-economic status in South Africa. The measure partitions the population into 10 groups – ranging from the wealthiest at 10 to the poorest at 1 – based on their access to assets and services.
To determine whether perceived threat is correlated with participation in violence, it is necessary to have a comprehensive measure of public knowledge about immigration. In all three SASAS rounds, respondents were asked five questions on the advantages and disadvantages that immigration poses for the country. 7 These are derived from a similar battery of items used by the International Social Survey Programme. Where appropriate, responses to the items were reversed and then combined to produce a composite index – this indicator has been termed the Perceived Threat Index. Standard statistical tests confirm validity and reliability of the index. 8 The index ranges from 0 to 10, with 10 indicating the most negative assessment of international migration’s impact on South Africa. The mean index score was 5.927 (SE = 0.036) in 2017 compared with 5.901 (SE = 0.036) in 2016, and 5.906 (SE = 0.038) in 2015. This demonstrates the stability of anti-immigrant attitudes in the country.
Asking about violence
In an attempt to explore the association between anti-immigrant attitudes and behaviour, SASAS introduced a question on xenophobic violence in 2015. But before this question was asked, respondents were told that they will be asked a few questions about people from other countries coming to live in South Africa. The aim of this priming statement was to avoid confusion over word the ‘immigrants’ – a word which could be applied to all groups that the respondent believes are alien or unusual. In line with standard priming procedures, this statement should improve response rates on this question (Tesler, 2015). However, it is important to note the limitations of this priming statement. The statement did not attempt to delineate different types of immigrants in South Africa. It could be argued that the texture of the responses would change if the statement had directed respondents to think about a specific type of immigrant (such as asylum-seekers or refugees).
Since SASAS 2015, respondents were asked whether they had taken part in a violent action to prevent immigrants from living or working in their neighbourhood. The response categories were as follows: (a) have done it in the past year, (b) have done it in the more distant past, (c) have not done it but might do it, and (d) have not done it and would never do it. Consequently, the third and fourth categories indicate a type of behavioural intention. In 2016, to broaden our understanding of past behaviour, SASAS researchers added the following response category after the question’s first category: ‘Have done it in the last five years’. This phrasing was repeated in 2017. For the purposes of this study, the response categories of this variable were transformed to match those of the previously described 2015 variable.
Procedure
The SASAS sample design adheres to the Geographic Information Systems Method and is nationally representative. In all SASAS rounds, small area layers (SALs) were used as primary sampling units and the estimated number of dwelling units in each SAL were utilised as secondary sampling units. In the first sampling stage, 500 SALs were drawn. In the second sampling stage, seven dwelling units were drawn with equal probability in each SAL. At this stage, residents of special institutions (such as hospitals, jails, and nunneries) were excluded. Finally, in the third sampling stage, a respondent was drawn from all persons 16 years and older at the visiting point, using the Kish Grid method. Participation in the survey was on a voluntary basis, with data collected by means of face-to-face interviewing.
Ethical considerations
I obtained ethical approval to use SASAS data from the Human Sciences Research Council (HSRC). All SASAS fieldwork and questionnaire designed follow a strict code of ethics overseen by the HSRC’s Research Ethics Committee. All respondents were asked for written informed consent, and if the fieldworker was interviewing a minor, then a dual consent process was required (both from the minor and their parent/guardian). Respondents’ personal information was removed when the SASAS data were captured. SASAS obtained approval from the Ethics Committee in each of the survey rounds used in this article.
Data analysis
STATA version 13, a quantitative software package, was used to analyse SASAS data for this study. SASAS contains weights which were designed by benchmarking to the latest mid-year population estimates prepared by Statistics South Africa. I treated these as probability weights and applied them to the data – all data presented in this article are weighted unless otherwise indicated. A univariate analysis was performed to identify levels of violent participation among the adult population in South Africa. Then multivariate analysis was used to identify determinants of participation. The study’s dependent variable involves a distinct choice among dissimilar options (i.e., a multinomial outcome). As a result, a multinomial (or polytomous) logistic regression model was selected for the multivariate analysis.
Results
Public responses to the question on participation in violent action against foreign nationals are displayed in Table 2 for the period 2015–2017. The vast majority of the adult population reported that they had not taken part in such an action in each of the years under review. In 2015 and 2017, approximately 5% of the general public said that they had committed at least one violent act to prevent immigrants from living or working in their neighbourhood. The share which self-reported such violent behaviour was notably higher in 2016, when 9% of adults in the country admitted to taking part in such an action. Of those who reported that they had participated in violence, a third said that it had taken place in the 12 months prior to the interview, while the remainder told fieldworkers that their participation had taken place in the more distant past. It is worth asking how distant in the past these actions were. Using the results for the expanded variable available for the 2016 and 2017 SASAS rounds, I shed some light on this issue. Of those who said that they had participated in violence in the distant past in 2016 and 2017, half (54%) said that it had happened in the last 5 years with the remainder (46%) indicating that their participation had taken place in the more distant past.
Count and percentage of adults willing to take part in violent action, 2015–2017.
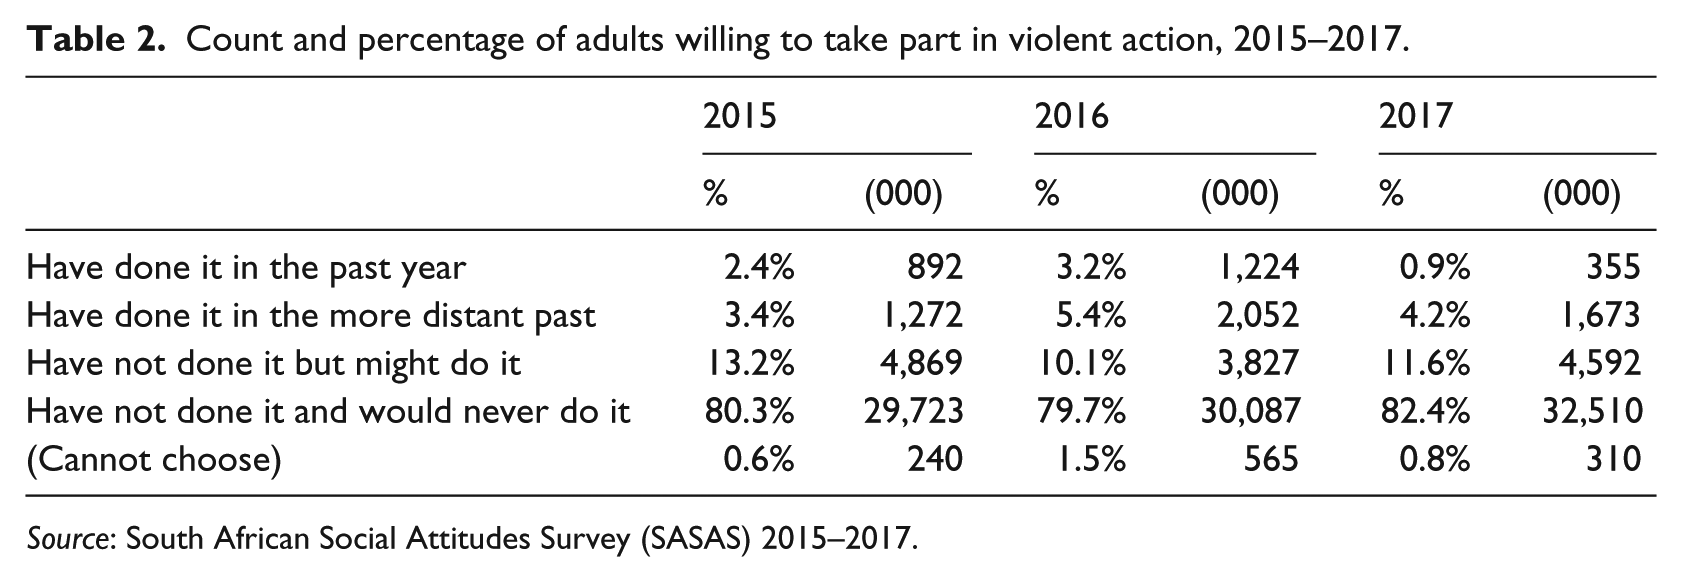
Source: South African Social Attitudes Survey (SASAS) 2015–2017.
The share of individuals who admit to engaging in anti-immigrant violence over the 12 months prior to the SASAS interview fluctuated within a narrow margin. Interestingly, in 2017, the portion who admitted to such an action was notably down from what was observed in 2016. There may be a number of different reasons for the observed change in the share admitting violent adult participation, and I will return to this issue in the discussion section. In late 2015, more than an eighth of the population said that they had not taken part in violent anti-immigrant action but would be prepared to do so. In other words, almost 5 million adult South Africans reported that while they had not previously participated in violent action against international migrants, they were prepared to consider doing so in the future. Although some minor variation can be observed in such attitudes over the period, the share willing to participate in such violence remained relatively constant.
I used the pooled (2015–2017) dataset for the multinomial regression analysis and I included a dummy variable to control for survey wave. The multinomial model’s base outcome was ‘Have not done it and would never do it’. For each of the dependent variable’s other response categories, results are displayed under the heading: (a) recent past, (b) distant past, and (c) never participated but would be willing to do so. All ‘cannot choose’ responses are coded as missing. When running the polytomous logistic regression model, I specified that probability weights be applied. The model is presented in Table 3 and contains both the standard socio-demographic control variables as well as the Perceived Threat Index. Although it is difficult to interpret, it would appear that the explanatory power of the model is low. Clearly, there are important factors that are driving participation (and the willingness to participate), which are not captured by my regression model.
Multinomial (polytomous) logistic estimates predicting response to a had or would take part in violent action against foreign nationals.

Source: South African Social Attitudes Survey (SASAS) 2015–2017.
(1) Data are weighted to be nationally representative of the adult in South Africa using probability weights, (2) the regressions controls for survey wave, (3) the number of observations used is 8,350, and (4) Wald χ2(66) = 276.14; Prob > χ2 = 0.000; Pseudo R2 = 0.054.
p < .001, **p < .01,* p < .05.
Looking at the relationship between attitudes and behaviour in Table 3, I found interesting results. The Perceived Threat Index had no relationship with recent participation, but had a statistically significant correlation with distant and potential participation. In comparison, the observed coefficient of the index on distant participation was much smaller than that on never participated but would be willing. A one-unit increase in this index improved the log odds for engaging in the distant (r = 0.068; SE = 0.034) and potential violence (r = 0.295; SE = 0.029) versus the base outcome. The results of the multinomial regression reveal that the socio-economic status variables were not robust predictors of both recent and distant past participation. Educational attainment, the LSM indicator, and employment status exerted no effect on past participation in violence. 9 This suggests that socio-economic status is not a strong predictor of an individual’s propensity to engage in anti-immigrant aggression. However, it would appear that the likelihood (r = -0.103; SE = 0.050) of reporting a willingness to take part in future violence (compared to the base outcome) among non-participants decreased as an individual’s score on the LSM indicator increased.
Finally, it would be instructive to reflect on the role that provincial residence played in predicting an individual’s level of participation in anti-immigrant violence. I observed provincial differences on participation in the distant past (vs no past participation and no intention). In other words, living in some provinces makes an individual more likely to exhibit anti-immigrant behaviour. Using the Western Cape as the reference group, I found that by residing in the Eastern Cape (r = -1.333; SE = 0.400), KwaZulu-Natal (r = -1.126; SE = 0.348), Limpopo (r = -0.829; SE = 0.371), and Mpumalanga (r = -0.758; SE = 0.377) reduced the log odds of participating in violence in the distant past (versus the base outcome). Provincial differences were also noted on behavioural intention among non-participants. Even when controlling for a range of demographic and socio-economic variables, residing in the North West (r = -0.690; SE = 0.275), Mpumalanga (r = -0.601; SE = 0.275), and KwaZulu-Natal (r = -0.562; SE = 0.268) reduced the log odds of potential participation. The results seem to suggest that social, political, and economic context factors at the provincial level are driving these observed differences. It is not clear at this stage, however, what these context factors are.
Discussion
The findings presented here have contributed to how we can understand the relationship between anti-immigrant sentiment and self-reported participation in xenophobic violence in South Africa. While I was able to find some evidence that perceived threat predicts past violent behaviour, I observed only a modest effect on distant participation and no effect on recent participation. 10 On the other hand, viewing international migrants as a threat was a significant determinant of behavioural intention and the Perceived Threat Index had a robust correlation with a willingness to participate in future violent action. It is difficult to explain this outcome, and further research is required to understand the precise nature of the linkage between attitude and behaviour on this issue. Although these findings were not as linear as may be expected, the outcome of this study shows that anti-immigrant perceptions could have a mobilising effect which could spur individuals towards acts of violent xenophobia. The article was also able to test whether certain socio-economic variables were associated with individual participation in violent xenophobic behaviour.
In this article, I found that socio-economic status was a poor determinant of past participation in anti-immigrant violence. This finding seems to contradict earlier studies of ethnic riots which focused on economic competition (see, for example, Olzak, 1994). To those familiar with existing research on anti-immigrant violence in the country; however, this result was not surprising. It is important to compare this outcome with other studies in South Africa. Here studies on public participation in large-scale anti-immigrant riots in May 2008 are useful. This work found no evidence that participation in these riots was driven by metrics of economic deprivation. Fauvelle-Aymar and Segatti (2012), for example, found that the wards in which the 2008 riots occurred were not those with the highest level of poverty (if unemployment and income are used as metrics of poverty). Using survey data from Alexandra (the township at the epicentre of the 2008 riots), Claassen (2016) also discovered that economic status was a poor predictor of past participation. However, in contrast to this earlier work, my study was able to find empirical support for the thesis that economic disadvantage is positively correlated with the intention to engage in violence.
It is important to note the media climate when survey research on past participation in violence against international migrants was conducted. In early February 2017, anti-immigrant riots broke out in the city of Tshwane. Both after and during these riots, a highly publicised anti-immigration demonstration was organised by a group calling itself Mamelodi Concerned Residents. In the lead-up and in the aftermath of this demonstration, media figures, politicians and civil society leaders sought to denounce xenophobic violence. It is possible that this type of elite cueing may have led to a change in how a certain share of the South African adult population answered survey questions about this type of violence. Based on data drawn from multiple countries in the Global North, Lenz (2013) has shown that cueing from politicians can have a powerful effect on the opinions of their supporters (also see Broockman & Butler, 2017). However, it is difficult to identify the size of the effect of a particular event on how people answer survey questions using SASAS data. This is not a problem unique to South Africa. This problem was identified by Pollock et al. (2015) in a large-scale analysis of hundreds of press-worthy events across dozens of European countries at various points in time. Moreover, it is not clear how much explanatory power theories of elite cueing have in South Africa as this phenomenon has not been adequately tested in the country.
There were a number of limitations to this study. I measured anti-immigrant aggression using a single question on behaviour and I did not try to gather data on individual participation in a wide spectrum of anti-immigrant activities and behaviours. I did not, for instance, examine public participation in verbal hostility against foreign nationals or participation in non-violent forms of anti-immigrant activity (such as boycotts or peaceful demonstrations). There is, as a result, an undeniable lack of nuance in my research design. A survey design that included multiple items on individual participation in a variety of aggressive anti-immigrant behaviours may lead to more complex research findings about the attitude–behaviour relationship. It would certainly provide greater opportunities for a more refined analysis of the determinants of different types of aggression. Future quantitative public opinion research on xenophobia would benefit from looking at different types of aggressive anti-immigrant behaviour.
The other main possible disadvantage of the data presented in this study is the potential underreporting of violent activity due to the stigma associated with such violence. When asking about violence during a face-to-face interview, the problem of social desirability cannot be ignored (for a greater discussion of this type of stigma in survey work, see Thaler, 2017). It is not clear, however, how large a problem this is. Researchers have been able to undertake similar work with residents from South African townships without experiencing considerable problems (see, for instance, von Holdt et al., 2011). In fact, Claassen (2016) has argued that social desirability bias on such questions may actually be quite minimal (also see Misago, 2016). Given how many respondents were willing to admit past participation, I am not convinced that there is a substantial underreporting problem. It may be that the degree to which violent action is considered socially undesirable waxes and wanes in the South African society. This would explain variations in the level of self-reported participation between the three SASAS rounds. Continued monitoring of public involvement in xenophobic violence will improve our understanding of this observed change in participation.
Conclusion
In South Africa, existing approaches to xenophobic violence-prevention have tended to be dominated by a criminal justice orientation that stresses law enforcement. It is my belief that policy makers would benefit from a greater focus on the prevention-oriented work of social psychologists. The findings of this article can be used for xenophobic violence prevention. This study has contributed to our understanding of two important questions: (a) how many people have participated in a violent action to prevent immigrants from living or working in their neighbourhood? and (b) who is likely to participate in such violent action in the future? Although only a minority of the adult population reported that they had participated in anti-immigrant violence, I found that a disconcerting number of non-participants were willing to consider participating in this type of discriminatory behaviour in the future. I have been able to identify attitudes towards foreign nationals as a robust determinant of behavioural intention. It is hoped that this finding will be used to develop appropriate violence-prevention strategies, and more can be done to change public perceptions about immigrants. Moreover, the data presented could be used to identify high-risk localities, helping anti-xenophobia programmes select which areas to target.
Footnotes
Acknowledgements
Guidance for this study was provided by the South African Social Attitudes Survey (SASAS), a programme within Democracy Governance and Service Delivery research programme, Human Sciences Research Council (HSRC). For their support and encouragement, special thanks to Benjamin J. Roberts and Jarè Struwig Co-ordinators of SASAS.
Funding
The authors disclosed receipt of the following financial support for the research, authorship, and/or publication of this article: This work was supported by the Centre of Excellence in Human Development at the University of the Witswaterand, Johannesburg in the Republic of South Africa under Grant P2018003. Opinions expressed, and conclusions arrived at, are those of the author and are not to be attributed to the Centre.
