



Abstract
Public organizations have long sought to increase workforce diversity and employee inclusion, a goal that has only increased in recent years. The study examines a racially diverse state government agency to explore how employee perceptions of diversity and inclusion relate to workplace happiness, employee engagement, and job satisfaction. Using original survey data of over 1,800 workers, this study explores how employees perceive diversity and inclusion, how these perceptions relate to overall workplace happiness, and examines the factors that may lead to more positive perceptions of diversity and inclusion. The analysis employs principal component analysis and multilevel regression modeling. The findings underscore the connections between overall workplace happiness and positive perceptions of diversity and inclusion. The key takeaways for public organizations include the importance of senior leadership when it comes to cultivating a diverse and inclusive environment. Finally, a notable finding is the statistically significant increase in positive feelings around inclusion and diversity for historically underrepresented racial groups and that low pay for long-term employees decreases these feelings.
Introduction
For state government service agencies, the past 2 years have presented profound challenges. Namely, the COVID-19 pandemic has exacerbated societal and workplace inequities and required both employee resilience and greater organizational leadership. In this environment, the authors conducted a survey within a large, racially diverse, state agency, whose workforce is primarily Black people and women. In this respect the agency’s demographic makeup indicates that it has successfully enacted diversity management—the intentional effort to recruit and retain employees of color, women, and other historically marginalized groups (Ivancevich & Gilbert, 2000). Yet, past research indicates that diversity management, while imperative, is insufficient without the integration of organizational inclusive behaviors (Hoang et al., 2022; Sabharwal, 2014). Based on work with this organization, the researchers believe it has taken some steps to integrate inclusion. For example, this organization recently hired a Chief Diversity Officer, and they undertook this survey with the authors to better understand employee perceptions around diversity, inclusion, satisfaction, and engagement.
For these reasons, a survey of this organization may yield key insights on topic such as diversity management, inclusion, and job satisfaction. Toward that end, this paper evaluates differences in perceived inclusion across the agency and the impacts of those perceptions of inclusion in this unique context. This study examines (a) how do employees in a racially diverse state agency perceive diversity and inclusion? (b) how does this relate to overall workplace happiness (i.e., engagement and satisfaction)? and (c) what factors may lead to more positive perceptions of diversity and inclusion?
Researchers employ principal component analysis to better understand whether and how diversity and inclusion shapes employee satisfaction and engagement. Researchers then created a multilevel regression model to understand which factors have a statistically significant impact on these perceptions. The findings suggest that agency diversity and inclusion indeed shapes both satisfaction and engagement. However, the study finds that satisfaction with leadership, pride in one’s workplace, and feelings of camaraderie are most strongly associated with diversity and inclusion. The analysis also finds three statistically significant factors that impact employee perceptions of diversity and inclusion: race, tenure, and pay. These findings are examined further in light of existing literature on diversity management, inclusion, and employee satisfaction and engagement.
Diversity Management and Inclusion
Both diversity management and inclusion relate to employee feelings about whether workplace diversity is valued, accepted, and meaningfully integrated into organizational decision-making. Diversity management relates to goals of creating a workplace that promotes equal opportunities—often via legal initiatives such as Equal Employment Opportunity (EEO) or Affirmative Action—and is also able to effectively manage a heterogeneous workforce (Riccucci, 2021; White & Rice, 2015). Diversity management is essential in the context of an increasingly diverse citizenry and to increase perceptions of fairness and inclusion of historically marginalized groups, such as Black, Indigenous, and People of Color (BIPOC) and women.
In the public sector, diversity management relates to perceptions of governmental legitimacy, responsiveness, and organizational policies that promote social equity, particularly for historically underrepresented groups (Gooden & Portillo, 2011; Riccucci, 2009). Successful diversity management can lead to passive or descriptive representation within in an organization; passive representation occurs when the employees of a public organization reflect the demographic characteristics of the citizenry they serve (Mosher, 1968). According to the theory of representative bureaucracy, passive or descriptive representation is important to increase a public organization’s perceived legitimacy in the eyes of a diverse public (Meier & Nigro, 1976; Mosher, 1968; Pitkin, 1967; Selden, 1997). This can lead to symbolic representation, where citizens perceive greater governmental legitimacy and more positive performance outcomes based on these shared characteristics (Bishu & Kennedy, 2020; Bradbury & Kellough, 2008; Riccucci et al., 2016). Moreover, researchers have found a link between diversity management that leads to passive representation and active representation, which is when that passive representation results in policies and outcomes that benefit certain populations being represented (Hindera & Young, 1998; Keiser et al., 2002; Meier & Stewart, 1992; Sowa & Selden, 2003). Managing for a diverse workforce, which includes many aspects of public personnel administration from recruitment to retention to training, is therefore a worthy organizational goal, particularly in the public sector.
However, research has confirmed that merely increasing the numbers of women or BIPOC within a public organization is not sufficient to promote a sense of organizational inclusion (Hoang et al., 2022; Sabharwal, 2014). When an organization increases numbers or percentages of historically underrepresented employees, such as women or marginalized racial and ethnic groups, that does not automatically lead to feelings of inclusion and belonging within the organizational culture for all demographic groups. In some instances, diversity management or initiatives to increase the number of women or non-White employees can be perceived by current employees as unfair (i.e., not merit-based) or an unjustified privileging of a targeted minority group (Leslie, 2019). One unintended consequence of diversity management initiatives is linked to the idea of preferential treatment; a perception that minority hiring or promotion only occurs when preferences are given leads to discriminatory performance evaluations (Leslie, 2019).
Another challenge of organizational inclusion relates to two seemingly paradoxical individual desires that the organization can satisfy for its employees: belongingness and uniqueness (Shore et al., 2011). According to Ashikali and colleagues (2021), “Individuals need to feel they belong to the group, meaning that each team member is treated as an insider, while having the opportunity to sustain and express their unique identities” (p. 500). It is important to distinguish that belongingness does not result from assimilation (Brewer, 1991). This delicate balance of feeling a part of the team—while not being forced to conform to the dominant organizational culture and subvert one’s own authentic self-expression—can be a tricky equilibrium for even skilled organizational leaders. Inclusion involves both the integration of differences—where different values, cultures, opinions, and beliefs are accepted and valued—as well as the integration of different opinions and lived experiences in organizational decision-making (Ashikali et al., 2021; Nishii, 2013). True organizational inclusion both uplifts the unique individuality of each team member, while incorporating employees’ differences in a meaningful way that leads to a sense of belonging.
Employee Satisfaction and Engagement
Job satisfaction and workplace engagement are two distinct, but interrelated factors that are critical for public organizational leadership. While satisfaction relates to the basic enjoyment of one’s job (Cantarelli et al., 2016; Vorina et al., 2017), engagement relates to an employee’s commitment to the mission and organization (Vigoda-Gadot et al., 2013). Both of these factors are important instrumentally, as they correlate to an employees’ motivation (Liu, 2020), organizational effectiveness and performance outcomes, and personnel administration issues such as recruitment and retention (Cantarelli et al., 2016).
Although job satisfaction is one of the most studied aspects of organizational literature (Rainey, 2009), definitions and measurement of satisfaction vary widely across public administration (Cantarelli et al., 2016). In general, job satisfaction measures the basic enjoyment of one’s work environment, including current role and position, as well as how the job fulfills their own individual needs such as pay and benefits (Cantarelli et al., 2016; Vorina et al., 2017). Job satisfaction is, according to Liu (2020), “An emotional state resulting from subjective appraisal of multiple facets of one’s job experiences . . . dependent upon the work itself, the arrangement and environment, the incumbent, and the interaction among them” (pp. 503–504). One widely validated job descriptive index includes five distinct dimensions of job satisfaction—feelings of satisfaction toward the work itself, supervision, coworkers, pay, and promotion (Balzer et al., 1997). Herzberg’s (1966) two-factor theory—also known as the motivation-hygiene theory of job satisfaction—contends that, as a baseline, hygiene factors are required to prevent job dissatisfaction, whereas motivation factors can increase satisfaction. Hygiene factors include interpersonal relationships, salary, policies and administration, supervision, and working conditions; whereas motivation factors include the opportunity for advancement, the work itself, the potential for growth, responsibility, recognition, and achievement (Herzberg, 1966). Many of these items were measured in the survey (see Appendix). Given the subjective and personal nature of satisfaction, Cantarelli and colleagues (2016) assert in their meta-analysis that multiple survey instruments on employees’ own self-reported assessment of their working environment are appropriate using either single-item and multiple-item measures, as validated across many quantitative studies.
The public sector faces various, well-known impediments to job satisfaction. For instance, a higher salary has been shown to have a statistically significant impact on job satisfaction and public sector employee wellbeing (Herzberg, 1966; Ryu, 2016). However, state governments and the public sector in general are often subject to salary caps and pay scales set by the legislative branch that may not keep up with inflation and often pay much less than similar jobs in the private sector (Pynes, 2009). In addition, public organizations have higher demands for transparency given their stewardship of taxpayer dollars (Guy & Sowa, 2022). In addition to the daily tasks assigned to them, they are also required to be consistently responsiveness to the public (Stivers, 1994) and political principals, such as legislators and other elected officials (Cook & Wood, 1989; Weingast, 1984). This results in higher levels of organizational red tape which, while necessary to uphold political responsiveness and transparency, may limit employee autonomy and creativity (Borst, 2018). Public sector leaders have little control over many of these factors that directly impact job satisfaction.
Employee engagement, however, looks beyond mere satisfaction to measure an employee’s commitment to the mission of the organization, to organizational improvement and achievement, and to their own feelings of personal and professional growth in their role. Higher engagement is associated with numerous positive work qualities such as lower absenteeism (Shantz & Alfes, 2015), higher job performance (Bakker, 2015; Salanova et al., 2005), higher job motivation (Sonnentag, 2003), and lower turnover (Harter et al., 2002). Workplace engagement has also been linked to positive personal benefits such as better health and greater happiness (Shantz & Alfes, 2015). Unfortunately, studies suggest that there is lower engagement in the public sector (Van der Broeck et al., 2017) as a result of managers lacking the resources that have been connected to higher employee engagement (Bakker et al., 2007; Meier & O’Toole, 2011; Xanthopoulou et al., 2009; Yang & Kassekert, 2010). However, theories of public service motivation (PSM) argue that public sector employees are motivated differently than their private sector counterparts (Christensen et al., 2017; Perry & Wise, 1990). While the survey disaggregated these two concepts, the analysis also reports on a combined engagement and satisfaction measure called “workplace happiness,” explained in greater detail below.
Data Collection and Survey
In collaboration with a large state agency, the authors designed a survey on employee perceptions of workplace conditions. With input from the agency’s senior leadership, researchers developed 20 Likert-type-scale questions that ask respondents to agree or disagree with statements regarding: (a) engagement in one’s work, (b) satisfaction with senior leaders and supervisors, and (c) views on workplace diversity and inclusion. A copy of the survey, including the corresponding demographic questions, is provided in Appendix.
The research team administered the survey via Qualtrics from August to September in 2021. A link to the survey was emailed to 3,952 employees along with four subsequent reminder emails. Posters were used to advertise the survey throughout the agency. The team also mailed 489 paper questionnaires with return envelopes and one follow-up postcard to those without an email address. In addition, researchers included the QR code to the survey if they preferred to complete it online. Of the 4,441 employees contacted, there were 1,863 responses. Although response rates vary substantially, 42% is typical for surveys such as this. 1
Table 1 lists the demographics of respondents (left column) and the agency (right column). As noted earlier, a unique feature of the survey is the fact that it was conducted within a large, racially diverse state agency. The sample reflects this diversity. In the dataset, 47.3% of those who responded are White and 38.7% identify as Black. 2 The sample also exhibits gender diversity, with 68% of respondents selecting female, 19% selecting male, 1% selecting nonbinary, and 12% preferring not to answer the question. All in all, the sample adequately reflects the demographics of the agency. 3
Demographics.
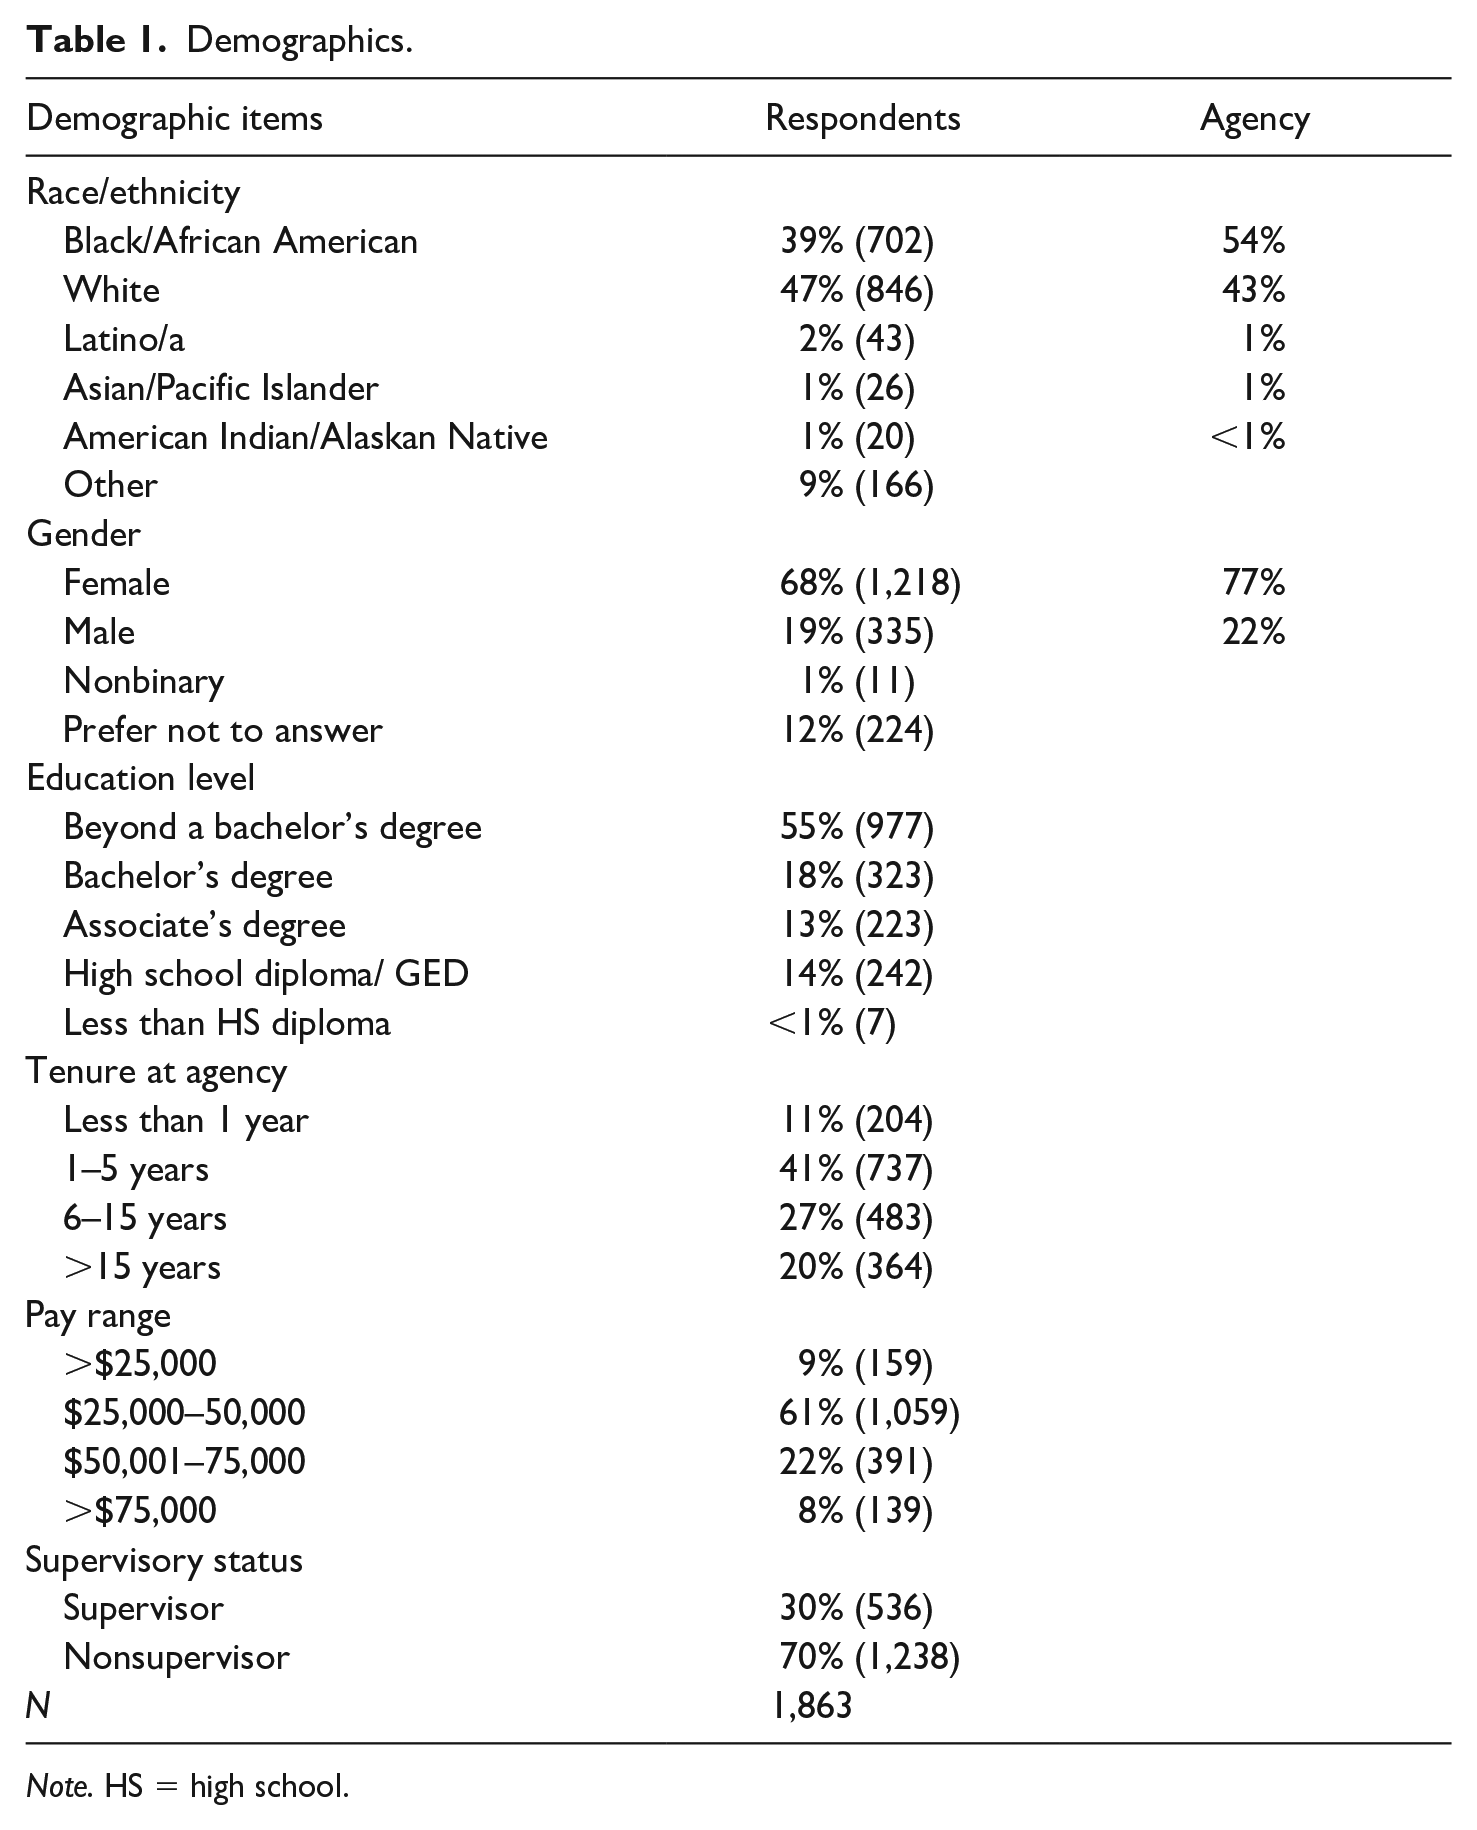
Note. HS = high school.
Analysis
This section outlines the results of the data analysis. The first section examines what do employees think about diversity in this racially diverse state agency? First, the analysis reports descriptive statistics on individual survey questions before turning to principal component analysis (PCA) to explain how these sentiments relate to broader workplace happiness. In the second section, a fixed-effects multilevel regression model analyzes why employees’ views on diversity and inclusion differ. Each section discusses the quantitative methods and models employed.
Diversity, Engagement, and Satisfaction
No doubt this agency, and the sample, exemplifies diversity management. As discussed elsewhere, diversity management, while imperative, is insufficient without inclusive behaviors (Sabharwal, 2014). This section explores what do employees think about diversity in this diverse state agency? Figure 1 presents the average response to the two questions that ask about diversity. 4 One question asks whether the agency “welcomes, promotes, and embraces diversity” while the other asks if “diverse viewpoints are encouraged and welcomed in the workplace.” Both questions gave participants five response options ranging from “strongly disagree” to “strongly agree” with the midpoint being “neither agree nor disagree” Cronbach’s Alpha for these two items is 0.84, which is very high reliability.
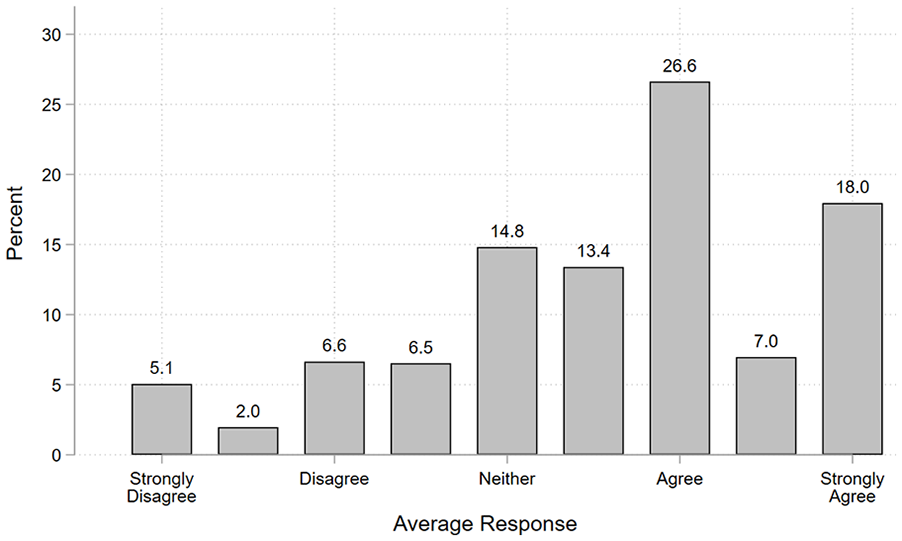
Does the Agency Embrace and Encourage Diversity?
According to the figure, employees generally agree that the agency embraces and encourages diversity. Over half of respondents (52%) either “agree” or “strongly agree” with the two questions. In fact, the two largest single categories are “agree” (26.6%) and “strongly agree” (18.0%) making the median response “agree.” Approximately one in seven respondents (13.4%) is between “agree” and “neither” while roughly the same percentage say “neither” (14.8%). About a fifth of respondents (20.2%) are below the midpoint, with only 5.1% saying they “strongly disagree” with both diversity questions.
If the two diversity questions are analyzed separately, an interesting result emerges. Namely, the mean score on the question about embracing workplace diversity (
Next, the analysis turns to the question of how views on diversity relate to broader feelings of workplace happiness: a measurement of attitudes regarding both engagement and satisfaction. In addition, 11 questions gauge workplace conditions while four asked about the employee’s immediate supervisor. Once again, a copy of the survey is included in Appendix. The analysis uncovers two questions: (a) is diversity a meaningful factor that employees use to evaluate their workplace and (b) how do views regarding diversity correlate with attitudes regarding engagement and satisfaction?
The analysis answers these questions using PCA. Like explanatory factor analysis (EFA) and similar techniques, PCA reduces a series of theoretically linked variables to a smaller set of scales. Simply put, the analysis examines how the various workplace questions “fit together” in a statistical sense. 5 In the first analysis, researchers use the default routine which forces the components to be uncorrelated with one another. 6 This assumption is relaxed in a second analysis.
Table 2 presents the first set of results. The analysis identifies three unique factors which collectively explain 70% of the variance in the 15 workplace variables. 7 In addition to reporting the eigenvalue and explained variance, Table 2 lists the correlation between each individual question and the three components (known as “loadings”) which help explain the sustenance of each scale.
Principal Component Analysis (Uncorrelated Components).
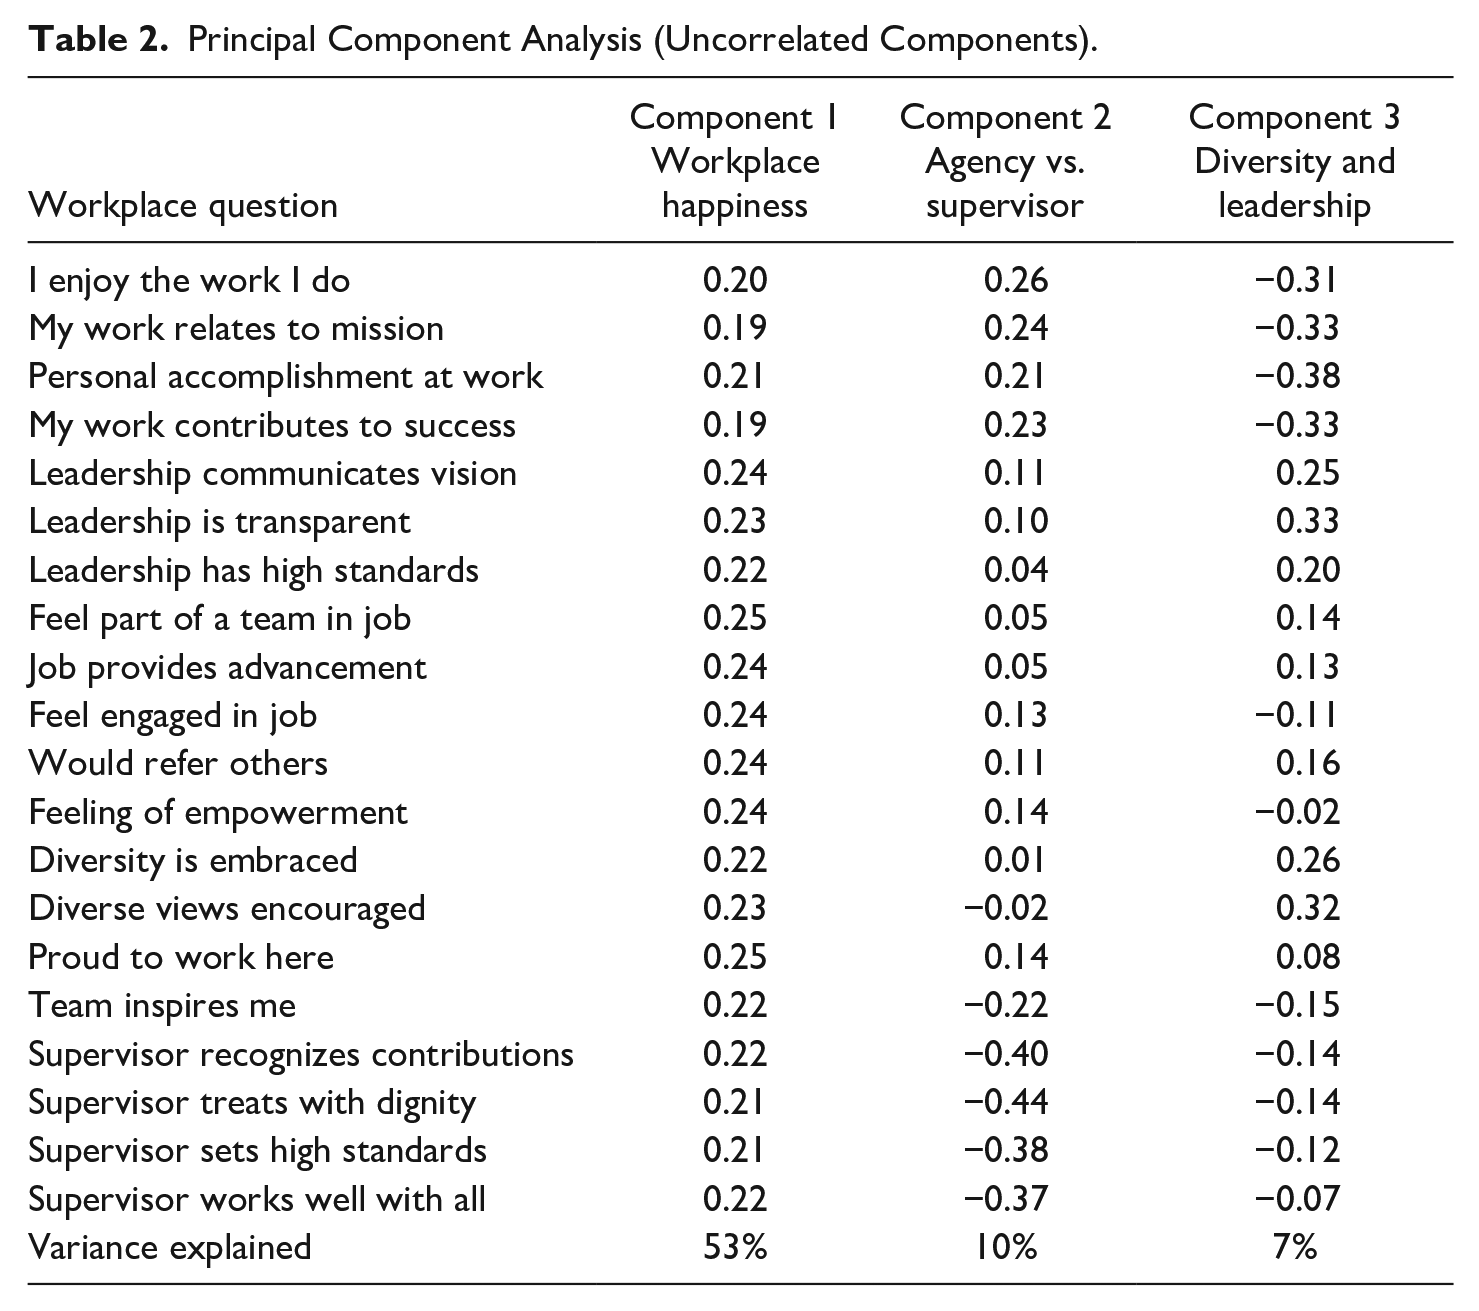
Looking at the first component, there is a modestly sized positive correlations on every question. 8 Clearly, the main component measures overarching feelings of workplace happiness. In other words, engaged employees are more likely to report feelings of personal accomplishment, satisfaction with senior leadership, pride in their organization, satisfaction with diversity, and so on. Although not surprising, it is noteworthy that the two diversity items correlate at roughly the same magnitude as the other thirteen questions. In this respect, the results indicate that diversity is just as meaningful a factor that contributes to workplace happiness as more common measures of satisfaction and engagement.
Looking at the second component, there is a large negative correlations on the supervisor questions and modestly sized positive correlations on the first four items that ask about engagement. This scale captures satisfaction with the agency as a whole yet dissatisfaction with one’s immediate supervisor (and vice versa). Although not the primary aim in this article, researchers and the organization were pleased to learn that respondents made meaningful distinctions between their workplace and their supervisor.
Looking at the third component, there is a modestly sized positive correlations on the two diversity questions and the three leadership questions as well as modest negative correlations with the first four engagement questions. 9 There can be two conclusions drawn from these results. First, because this component emerges as a distinct scale in the PCA, it reveals that diversity is indeed an important evaluative construct in this agency. So, while views on diversity correlate with workplace happiness, as indicated by the first component, diversity also represents an independent evaluative domain. Second, it is notable that the two diversity questions correlate strongly and in the same direction as the senior leadership questions. After all, senior leaders play an important role when it comes to implementing diversity, equity, and inclusion policies. In this respect, the results indicate that employees hold senior leaders, but not necessarily their immediate supervisors, accountable for embracing and encouraging diversity.
A thorny issue concerns the negative correlation between the diversity component and the four engagement questions. 10 In theory, this would indicate that views on diversity and engagement go in opposite directions. Although the first analysis yields notable findings, this odd result may be a statistical artifact. As noted above, the default setting requires the components to be uncorrelated with one another, which is unrealistic in the context of the study. Therefore, researchers conducted a second analysis where the components were allowed correlate with one another. 11 These results are presented in Table 3. Broadly speaking, the second analysis yields similar results as above but also some additional findings.
Principal Component Analysis (Correlated Components).
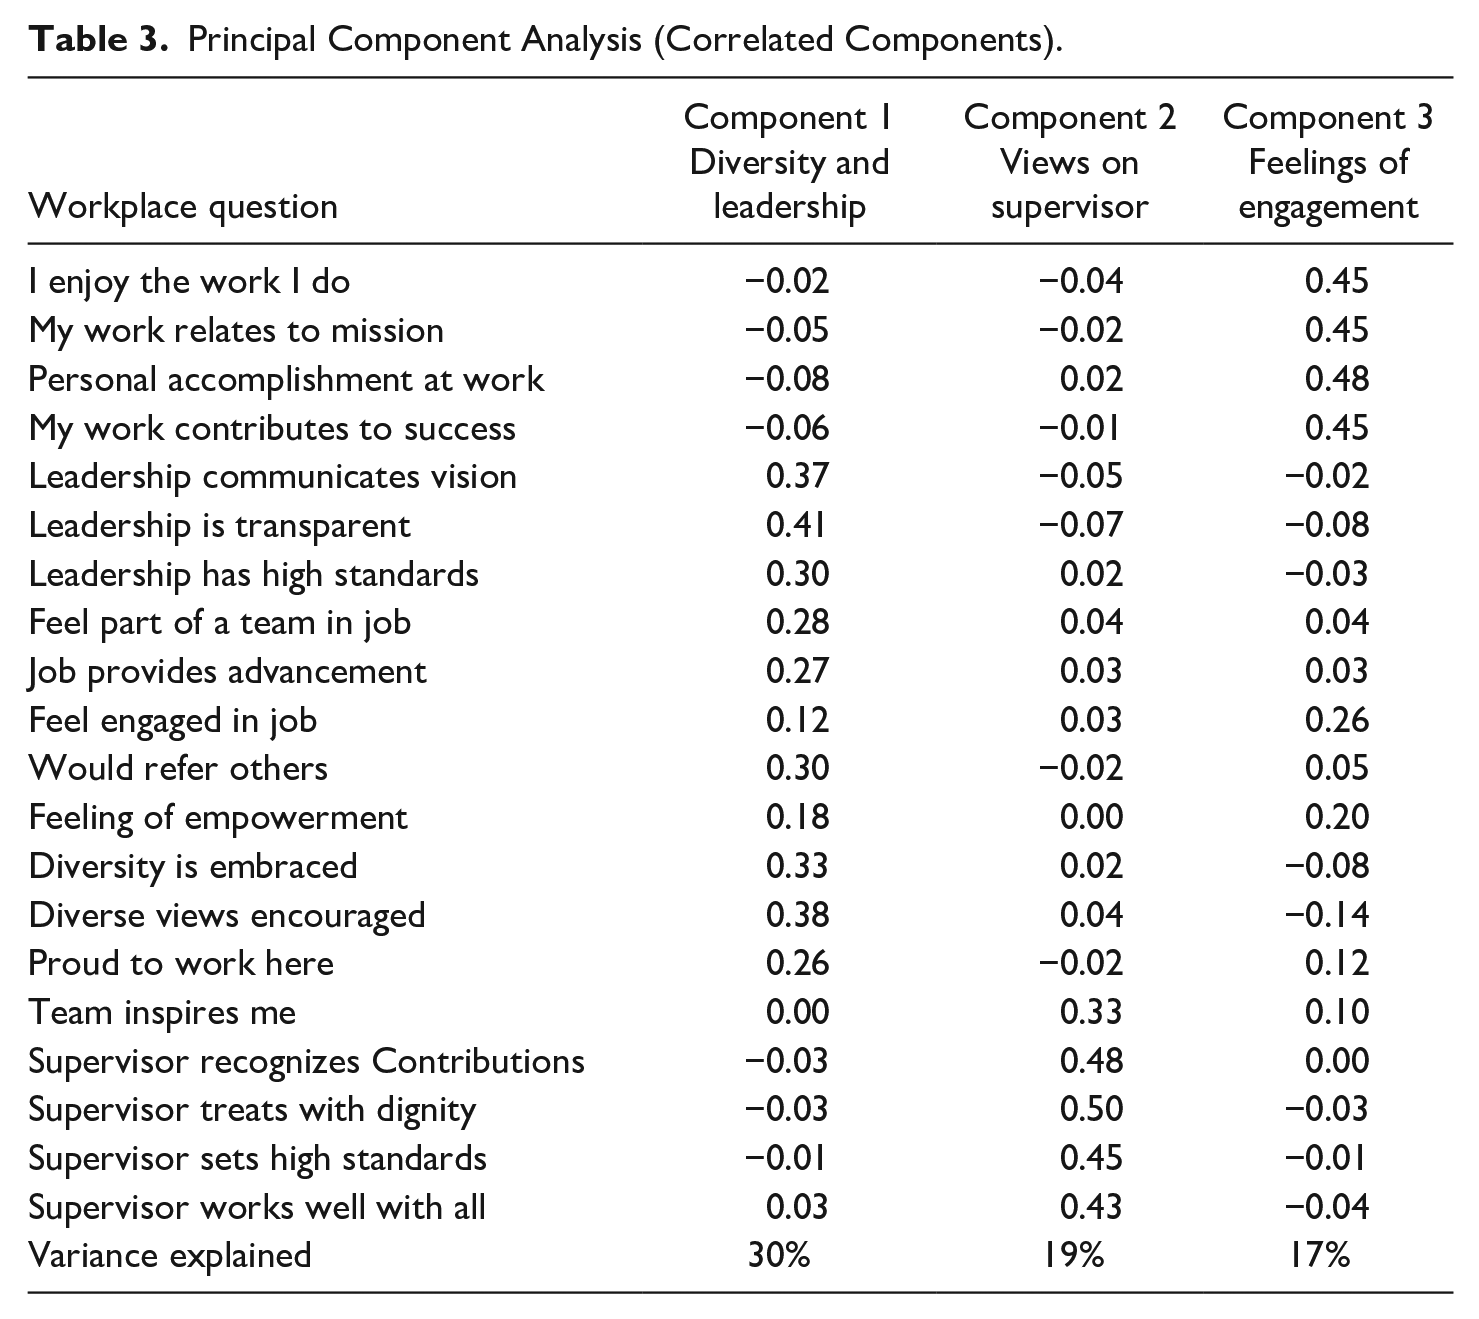
The key finding in the second analysis is that the diversity and leadership scale emerges as the first component and thus explains the largest share of the variance. In this analysis the two diversity questions correlate strongly and in the same direction as the leadership questions, suggesting once again that diversity and satisfaction with senior leaders are strongly linked. Unlike the first analysis, however, four additional items correlate in the same direction with the views on diversity. The analysis finds that respondents who agree that diversity is promoted and encouraged are more likely to say (a) they feel part of a team, (b) that their job provides advancement opportunities, (c) that they would refer others to work at this agency, and (d) that they are proud to represent their agency. This finding appears to support existing research regarding inclusivity leading to feelings of belongingness (Randel et al., 2018; Sabharwal, 2014) and providing a sense of employee voice (Alang et al., 2022).
Like the first analysis, the second component captures views on one’s immediate supervisor. A notable difference is that the four supervisor questions do not correlate in the opposite direction with any other question. This seems to be a more sensible result as it suggests that employees evaluate their supervisor using criteria that are distinct from their views on the agency. Unlike the first analysis, the third component correlates most strongly with the engagement questions. 12 The analysis also shows a modest positive correlation on the question that asks specifically about feeling engaged in their job and a sense of personal empowerment in their work.
As a final matter, an advantage of the second analysis is that it reveals how the three components correlate with one another. 13 In looking at how the scales correlate, the analysis finds that the three components exhibit large positive correlations with one another and with each of the fifteen questions. 14 Simply put, this confirms the very first result in analysis one: that engaged employees are more likely to report satisfaction with diversity, rate their supervisor highly, and so on for each question. In other words, every item on the survey relates to broader feelings of workplace happiness.
Explaining Views on Diversity
The analysis now explores why employees have positive or negative views on diversity. Using the results from the PCA, researchers calculated a diversity scale for each respondent. 15 On this scale higher values indicate that the employee has positive views regarding diversity while lower values indicate negative views. The analysis uses this scale as the dependent variable in the regression analysis reported as Model 1. 16 A secondary analysis was also conducted as a robustness check. In this model, listed as Model 2 in the table below, the research team simply add the two diversity questions and use the resulting index as the response. Although the authors favor Model 1 for theoretical reasons, both models produce identical results.
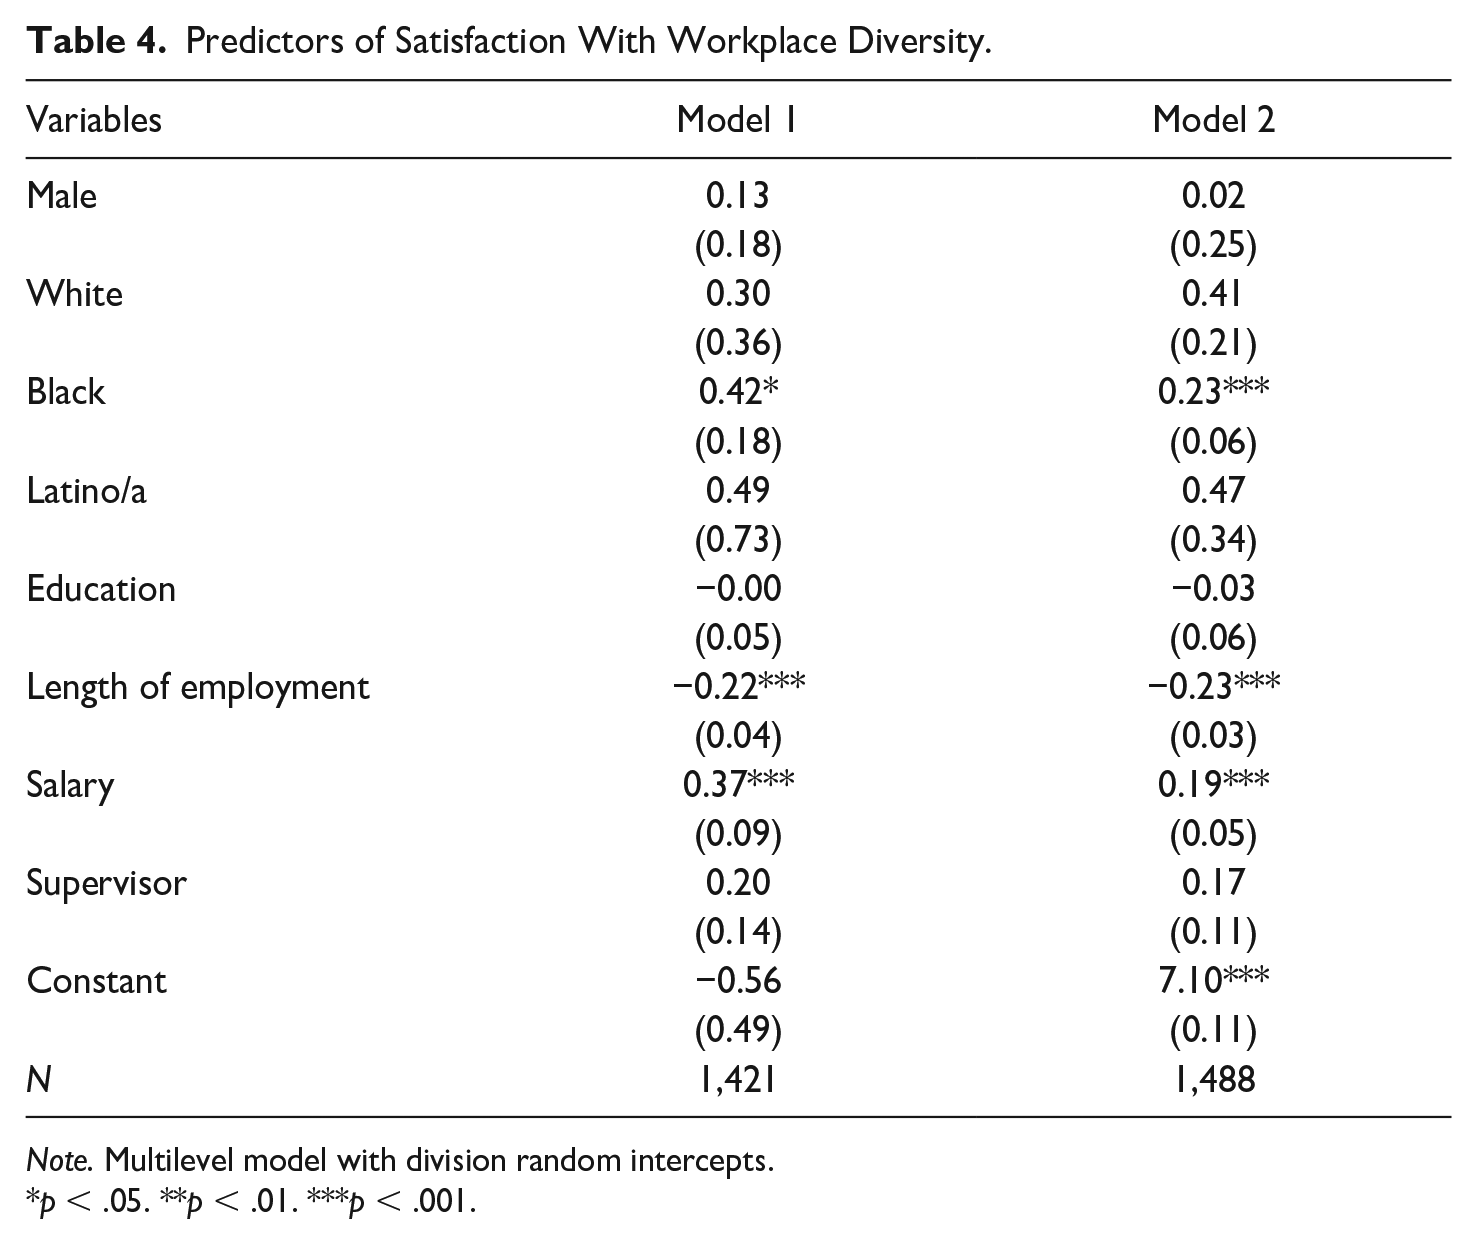
According to the analysis in Table 4, three factors are statistically significant predictors of an employee’s views on workplace diversity. First, the analysis finds that Black employees report higher levels of satisfaction with diversity compared with employees of other races and/or ethnicities. 17 In this respect, it seems this agency has not only achieved a satisfactory level of descriptive representation, but that this representation has positive spillover effects for Black employees within the organization. The results therefore confirm prior research finding that representative bureaucracy fosters improved workplace experiences for historically underrepresented groups (Hindera & Young, 1998; Keiser et al., 2002; Meier & Stewart, 1992; Sowa & Selden, 2003).
Predictors of Satisfaction With Workplace Diversity.
Note. Multilevel model with division random intercepts.
p < .05. **p < .01. ***p < .001.
Equally notable is the insignificant coefficient on the variable for White employees. Several studies document the unintended consequences of diversity initiatives. For example, Leslie (2019) discusses what she terms “negative spillover” effects: those that adversely affect an outcome other than that targeted by a diversity initiative, particularly the negative reaction of historically advantaged groups (see also Lowery et al., 2006). While the results may be unique to this specific agency, there were no such negative spillover effects in the attitudes of White employees. Furthermore, though the effect is insignificant in both models, the coefficients are in the positive direction, indicating more positive views of diversity among White employees.
Although this particular agency has a large percentage of both Black and women employees, the analysis does not find higher levels of satisfaction among women respondents. The analysis also finds no higher or lower views on diversity among Latino/a employees. Separate models tested several interactions between race, ethnicity, and gender, given the expectations of intersectionality theorists that experiences may differ for those who possess multiple nondominant identities (e.g., Black women, see Crenshaw, 1989). 18 However, the analysis found no significant interaction effects. 19 In other words, the higher rate of satisfaction among Black employees is the same, statistically speaking, for Black men and Black women (and likewise there are no differences between White men and women).
The results also suggest that longer serving employees have lower opinions of diversity compared with more recently hired employees. Initially, there was a concern that this result was driven by two phenomena. First, this finding could be the product of negative spillover among long serving White and/or male employees. The unintended consequences of diversity initiatives could be due to the perception that they are unjustified privileges for targeted groups (see Leslie, 2019). Second, this result could reflect a new employee’s satisfaction with the demographic diversity of the agency (passive representation) which quickly subsides without adequate organizational inclusion initiatives (see Hoang et al., 2022). If true, the expectation would be that the negative effect might be greatest among employees who belong to historically underrepresented groups. A secondary analysis dispels both explanations, however. Specifically, the findings show no evidence that the length of employment effect is higher or lower for any one demographic group. Like above, the analysis interacted the employment length variable with each demographic group, finding no statistically significant differences by group. 20
Instead, there may be a simple explanation for this seemingly odd result. In an effort to better understand this result, the analysis allowed the length of employment variable to assume any functional form. 21 Figure 2 presents this result. What the figure shows is that the negative relationship in the main analysis is driven (exclusively) by statistically significant positive views on diversity among employees in their first year and statistically insignificant effects for employees in every other employment cohort. Notably, the estimate for each cohort beyond the first year is close to the reference line zero, which indicates no effect. In other words, long serving employees do not have negative views on diversity: their views are simply lower than employees in their first year. This could indicate that recently hired employees are happy to work at a diverse state agency, and perhaps the racial diversity of the agency is most novel and apparent to them within their first year of employment. By comparison, longer serving employees no longer find this diversity notable, but rather a normalized feature of their organization.
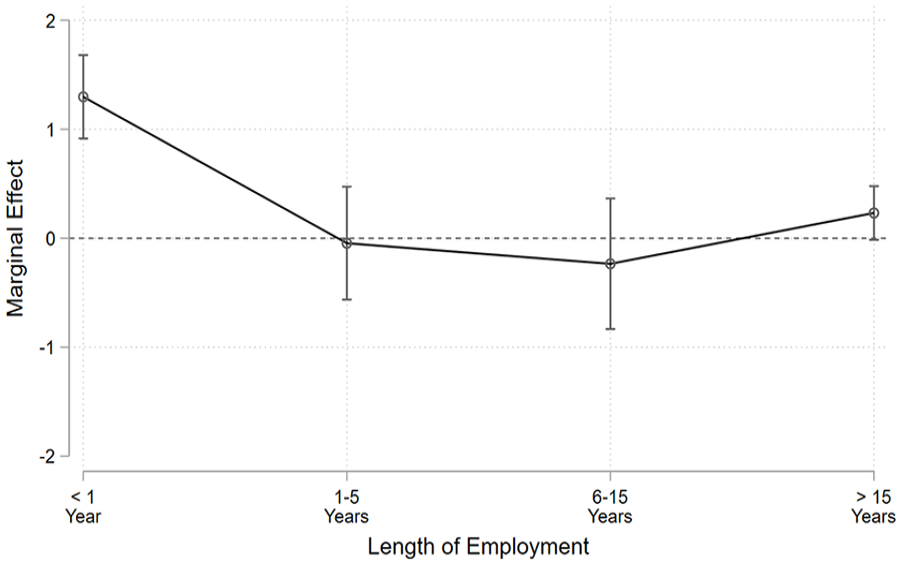
How Length of Employment Affects Views on Diversity.
Looking at Table 4, the analysis also finds that higher salaried employees report greater levels of satisfaction with diversity. This finding aligns with the motivation-hygiene theory (Herzberg, 1966) that contends an employee’s dissatisfaction increases if they feel their salary is inadequate. Herzberg (1966) notes that poor hygiene factors, such as low salary, lead to a baseline dissatisfaction with one’s job, which is hard to overcome regardless of other motivational factors. Those in the agency who have higher salaries are likely to not experience this same dissatisfaction, and the responsibility and autonomy they experience can then lead to increased motivation or satisfaction with their job. This likely means that those who have higher salaries are in a position to hire a diverse workforce and implement diversity initiatives. 22
Finally, the research team tested an interaction between length of employment and salary in a supplementary analysis. Figure 3 shows the result. The top line (denoted by squares) represents highly paid employees, and the bottom line (denoted by circles) represents low paid employees. The figure shows a slight increase in views on diversity among highly paid employees, although the differences over employment length are insignificant. In contrast, the analysis shows a large and statistically significant negative effect for low paid employees. In other words, the longer a low paid employee works, the more their satisfaction with diversity declines. 23 This finding further supports the idea that insufficient or poor hygiene factors—such as salary—have a deleterious effect that is exacerbated over time, whereas employees with a higher salary do not experience the same negative impacts regardless of agency tenure.
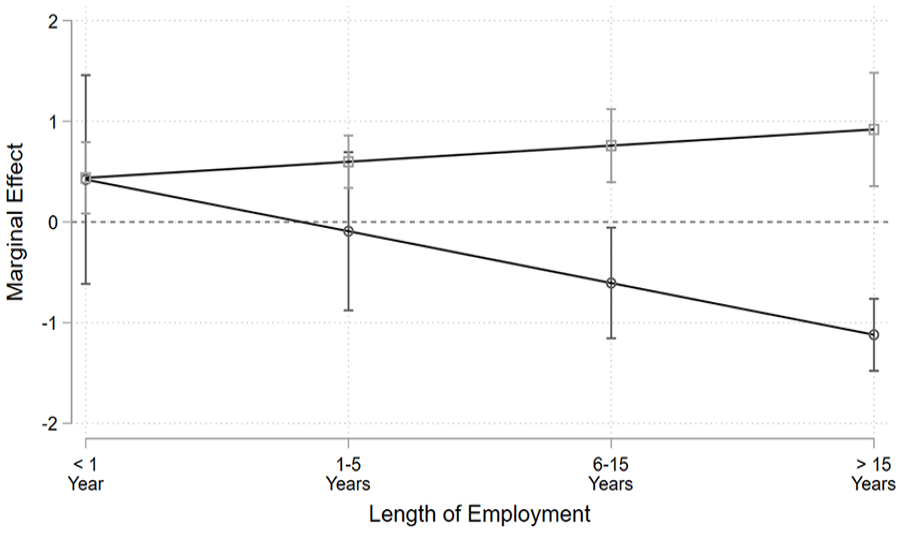
How Pay and Length of Employment Affects Views on Diversity.
Discussion and Conclusion
This study reexamines literature on diversity management, inclusion, and workplace engagement and satisfaction in the context of a racially diverse state agency workforce. Specifically, the survey and analysis examined employee perceptions of diversity and inclusion and how those perceptions relate to overall workplace happiness. The analysis delves into the factors that most likely led to positive perceptions of diversity and inclusion. Several of the findings support and expand on the prior literature, while other findings were surprising.
The findings support the idea that diversity management—such as hiring a diverse workforce—is a necessary, but insufficient first step to foster organizational inclusion and feelings of belonging (Hoang et al., 2022). In this agency, the survey showed that there was a strong overall perception that they worked in a diverse workplace—one with passive or symbolic representation. However, although the scores were high in the aggregate, there was less agreement that this agency has achieved organizational inclusion by comparison (i.e., that diverse viewpoints were valued). As noted, this finding may support prior findings, which demonstrate that more than just passive diversity is required to help employees feel a sense of inclusion, belonging, and that they have an active voice in their organization (Alang et al., 2022; Ashikali et al., 2021; Randel et al., 2018; Sabharwal, 2014).
The findings indicate that positive perceptions of diversity and inclusion correlate strongly with satisfaction with agency senior leadership (Ashikali et al., 2021). This finding is essential for practitioners, as public agencies can take tangible steps to hire or promote leaders who value diversity, encourage participation and inclusion, and foster a sense of belonging. Furthermore, the findings show that perceptions of diversity and inclusion lead to feelings of belonging (e.g., being part of a team). Diversity and inclusion also relate to pride in one’s agency and likelihood to recommend it as a good place to work, suggesting that the positive effects of diversity management and inclusion create both positive internal feelings (i.e., pride) and positive impacts beyond the organization (i.e., recommending it as a good workplace to the community at large). These results indicate that those who agree that diversity is promoted and encouraged are more likely to believe their job provides advancement opportunities; this may suggest that positive perceptions of diversity and inclusion have positive impacts on motivation (Herzberg, 1966; Perry & Wise, 1990).
The second analysis offers insights into what factors might predict employees’ positive perceptions of diversity and inclusion in their organization. The analysis found three factors were statistically significant predictors: (a) race (i.e., Black employees of any gender report higher levels of satisfaction with workplace diversity), (b) tenure, and (c) salary. Black employees—those from a historically marginalized group, particularly in the Southern state where this survey took place—are more likely to be satisfied with the agency’s efforts to promote diversity and inclusion.
Although these results are in keeping with the conventional wisdom, the findings also show that White employees do not feel negatively about these efforts, as Leslie (2019) suggests may be an unintended negative consequence. In other words, the results suggest that positive perceptions of diversity and inclusion are possible regardless of race and membership in a historically privileged group. For public organizations, this may mean that leaders have an opportunity to improve experiences and perceptions for BIPOC employees without the unintended consequence of creating resentment or negative perceptions among White employees. Whether this is unique to the organization surveyed or a more generalizable result in diverse state agencies is a subject for future research.
Finally, the findings show that tenure and pay relate to views on workplace diversity. First, newly hired employees report more positive perceptions of diversity compared to longer serving employees. This may indicate that new hires are more attuned to the diversity within this organization and therefore pay more attention to the number of women and Black people both throughout the organization and within senior leadership. 24 Over time, however, the results indicate that this becomes “normalized.” Additional theoretical development and future research in other racially diverse agencies could provide deeper insights into this finding. Second, lower paid employees—especially those with a longer tenure at the organization—report lower levels of perceived diversity and inclusion. This suggests that low pay may lead not only to job dissatisfaction (Herzberg, 1966) or impact wellbeing (Ryu, 2016), but that dissatisfaction has spillover impacts into other perceptions about the organization related to diversity and inclusion.
The goal of this study was to examine employee perceptions of diversity and inclusion and how those perceptions relate to overall workplace happiness and other employee characteristics. The analysis of original survey data at a racially diverse state agency underscores the importance of diversity management when intentionally linked to organizational inclusion to provide employee voice. The findings suggest that diversity and inclusion are not just worthy standalone goals, but that they also have positive spillover effects for employees’ overall engagement and satisfaction.
Footnotes
Appendix
Declaration of Conflicting Interests
The author(s) declared no potential conflicts of interest with respect to the research, authorship, and/or publication of this article.
Funding
The author(s) received no financial support for the research, authorship, and/or publication of this article.
