
Abstract
The purpose of this study was to determine the psychometric properties of the Turkish version of the Future Time Perspective Scale (FTPS-T) and examine age-group differences in the predictors of respondents’ future time perspective. Data were collected from a sample of 202 young adults (aged 18–28 years) and 127 community-dwelling older adults (aged 60–86 years). The internal consistency and test–retest methods were employed to assess the reliability of the FTPS-T, and the FTPS-T’s validity was assessed using construct- and criterion-related validity. The reliability and validity analyses demonstrated that the FTPS-T had satisfactory psychometric properties. Multiple regression analyses revealed that the strongest predictor of future time perspective in young adults was subjective psychological health, whereas chronological and subjective (i.e., physical) ages were stronger predictors among older adults. These findings indicate that subjective variables shape the perceptions of a lifetime, and the results are discussed in the context of socioemotional selectivity theory.
There is a rich history of studying the psychological phenomenon of future time perspective (FTP). The definition of FTP as an important individual difference variable was put forward by Lewin (1939), who defined it as “the scope of time ahead which influences present behavior” (p. 879). Zimbardo and Boyd (1999) created a “Time Perspective Theory” which they defined as “the often nonconscious process whereby the continual flows of personal and social experiences are assigned to temporal categories, or time frames, that help give order, coherence, and meaning to those events” (p. 1271). Conversely, Cate and John (2007) stated that FTP is an attempt to answer the question: “How much time do individuals think they have left ahead of them, and how do they see that time?” (p. 186). Although multiple definitions of FTP have been suggested in the literature, many researchers have asserted that it is one component of an individual’s personal lifetime and is concerned with how individuals perceive their future, as opposed to their present or past (Brothers, Chui, & Diehl, 2014).
FTP is known to be a key part of changes in motivation, emotion, and cognition and can be considered one of the most fundamental aspects of development (Carstensen, Isaacowitz, & Charles, 1999). This being so, FTP has been a focus of growing interest in the field of aging and human development over the past decade (Moss &Wilson, 2018), particularly with regard to topics on mental health (e.g., Brothers, Gabrian, Wahl, & Diehl, 2016; Demiray & Bluck, 2014) and health behaviors and beliefs (e.g., Erickson, Mackenzie, Menec, & Bailis, 2017; Stahl & Patrick, 2011; Tasdemir-Ozdes, Strickland-Hughes, Bluck, & Ebner, 2016). Given the fact that FTP has an overarching influence on human behavior, it is essential that it be assessed in a comprehensive manner.
Socioemotional selectivity theory (SST; Carstensen et al., 1999) was the first life span developmental theory to consider the central role of FTP, and it has since been dominant in the fields of time perspective and aging (Brothers et al., 2016; Fung & Isaacowitz, 2016). Under the SST framework, FTP is defined as a flexible, cognitive–motivational, and age-related construct that changes over time but can be conceptualized as a single construct, representing a bipolar continuum from expansive (the feeling that there is more than enough time to do what one wants) to limited (the feeling that time is running out; Carstensen, 2006). The theory’s assumption about developmental change in FTP is that in terms of chronological age, people shift from an expansive time perspective in their youth to a limited one as they become older (Lang & Carstensen, 2002). SST proposes that FTP plays a key role in human motivation and that the amount of time left in people’s lives gradually becomes a better predictor than chronological age for a range of cognitive, emotional, and motivational variables (Carstensen, 2006).
Predictors of FTP in Aging-Related Literature
In existing adult development and aging literature, FTP has mostly been studied as a predictor, rather than a dependent variable (Weiss, Job, Mathias, Grah, & Freund, 2016). The empirical findings from cross-sectional and longitudinal studies have shown that a more open (i.e., expansive) FTP is related to positive developmental indicators such as higher levels of subjective (Allemand, Hill, Ghaemmaghami, & Martin, 2012; Ramsey & Gentzler, 2014) and psychological well-being (Brothers et al., 2016) and the presence of meaning in one’s life (Hicks, Trent, Davis, & King, 2012). A limited FTP, in contrast to an open FTP, is clearly indicative of negative and maladaptive outcomes, including depressive symptoms and negative affects (Grühn, Sharifian, & Chu, 2016), along with lower levels of life satisfaction and optimism (Brothers et al., 2014). Given the pervasive and powerful influence of FTP on adaptive processes and positive aging outcomes, it is very important to arrive at a deeper understanding of the predictors as well as the consequences of FTP.
Despite its growing importance, only a small line of research has focused on the antecedents of FTP, and very little is known about what contributes to a more open or limited FTP. One of the most important and primary antecedents of FTP is chronological age, and there is strong evidence that higher chronological age is related to a more limited FTP (Carstensen, 2006; Stahl & Patrick, 2011). However, to date, few researchers have focused on the influence of the other sociodemographic variables on FTP. Of these, Padawer, Jacobs-Lawson, Hershey, and Thomas (2007) have suggested that being male, along with an increased age, income, and level of education are factors associated with higher FTP scores (i.e., a more open FTP). Furthermore, recent studies focused on subjective predictors (i.e., self-image and cognitive factors) of FTP suggest that essentialist beliefs about aging (Weiss et al., 2016), a subjective acceleration of time (John & Lang, 2015), (dis)identification with one’s age-group (Weiss & Lang, 2009), subjective age (Rohr, John, Fung, & Lang, 2017), and subjective health (Li & Tsang, 2016) influence people’s perception of one’s future time. Taken together, the current literature suggests that the perception of time horizons is constructed on the basis of subjective factors, in conjunction with sociodemographic factors.
Measurement and Dimensions of FTP
Depending on the discipline and age-group, several instruments have been developed to capture time perspective, such as the Lines Test (Cottle & Pleck, 1969), the Attitudes Towards the Future Scale (Güler, 2004), the Zimbardo Time Perspective Inventory (Zimbardo & Boyd, 1999), and the Future Time Perspective Scale (FTPS; Carstensen & Lang, 1996). The FTPS, which is the most commonly used measure of FTP in aging research (Fung & Isaacowitz, 2016), was developed within the theoretical framework of SST. While some studies have adopted a one-factorial structure (e.g., Lang & Carstensen, 2002), recent empirical evidence suggests that FTP may actually be made up of two (e.g., Kooij & Van De Voorde, 2011; Zacher & Frese, 2009) or three components (e.g., Kuppelwieser & Sarstedt, 2014; Rohr et al., 2017). These results indicate that additional studies are needed to determine which FTPS factorial structure should be favored, given that dimensionality assessment is one of the most critical and basic assumptions that needs to be checked carefully when working with scales.
Although the FTPS has been translated into and is widely used in many languages, such as German, Chinese, Italian, and Spanish (FTP, n.d.), it has not been validated in a Turkish population. To the best of our knowledge, the FTPS has been translated into and used in Turkish settings in only one study (Güler-Edwards, 2008), but the psychometric properties of the Turkish version of the FTPS (FTPS-T) have not been examined. To address this gap, the current research aims to examine the reliability and validity of the FTPS-T in a non-Western culture, featuring Turkish participants. Furthermore, given that FTP is an important psychological variable, particularly in the fields of aging and health, the FTPS-T will assist researchers by providing an understanding of Turkish adults’ thoughts and feelings about their future time.
The Present Study
As noted earlier, recent studies have called into question whether FTP is a uni- or multifactorial construct; therefore, the first aim of the present study was to examine the reliability and validity of the FTPS-T among young and older adults. To this end, we first investigated (a) the internal consistency and test–retest reliability and (b) the factorial structure and discriminant, concurrent, and convergent validity of the FTPS-T. Indeed, previous studies have provided strong evidence that chronological age plays a fundamental role in shaping perceptions of time; however, sociodemographic and subjective predictors (i.e., age-group identification, subjective physical and psychological age, and health) of FTP need to be replicated in different age. Thus, the second aim of the present study was to provide a more in-depth investigation of the variables related to FTP. In particular, we were interested in examining whether these predictors differ between young and older adults.
Method
Participants
The sample size was determined separately for the factor (MacCallum, Browne, & Sugawara, 1996) and multiple regression analyses (via Green’s [1991] formula). As a result, we aimed to collect data in the range of 100–200 for the factor analysis and from 90 young and 98 older participants for the multiple regression analyses. The only two inclusion criteria that the participants had to fulfill for this study were as follows: (1) to be 60 years or older (for the older group) or 18–30 (for the younger group) and (2) not to be suffering from any life-threatening illness such as cancer. Between April 2018 and June 2018, a total of 432 (258 younger and 174 older) adults were found who were eligible for participation, and 347 (212 younger and 135 older) adults agreed to participate in this cross-sectional sample. The response rates among those who were eligible to participate from the two groups were 82.2% and 77.6%, respectively. However, seven younger and eight older adults of those who were recruited and tested did not provide usable data due to statistical assumptions (see the data preparation). Moreover, three foreign students were excluded from the analyses because they were not fluent in Turkish. The final sample comprised 329 participants: 202 younger and 127 older adults. All participants were native Turkish speakers.
The sample of younger adults consisted of 202 undergraduate students from a large public university in the western part of Turkey (80.2% women; M = 21.04 years of age, standard deviation [SD] = 1.70). The older sample consisted of 127 community-dwelling adults (60.6% women; M = 70.03 years of age, SD = 6.67). We focused on both younger and older adults because we expected the differences between them to be larger than between either group and middle-aged adults.
Procedure
The participants were recruited via two methods: (a) classroom administration and (b) convenience and snowball sampling. The younger adults completed the self-report questionnairepacket, which included sociodemographic variables and other measures, that was provided to them via group administration in a classroom. A research assistant directly spoke to the older adults in a variety of public places, including courses for crafts and hobbies, and a municipal center for adults. In addition, a part of the sample of older adults was acquired by providing questionnaires to psychology students, who distributed them among their acquaintances and relatives living in the same city. These younger and older adults then completed the self-administered questionnaires after their informed consent had been obtained. We requested that participants should complete the questionnaires without assistance, as far as possible, and support was only provided when it was necessary for older adults.
The study was approved by the Ethics Board and Commission of Ege University in Turkey (Approval Number = 134–2018). Verbal as well as written consent was obtained from each participant, after they were informed of the proposed purpose of the study.
Measures
Sociodemographic variables
Participants were asked to report their chronological age (open-ended), gender, psychiatric and neurological condition, and marital status, while the older adults’ employment and educational statuses were also recorded. Prior to university, almost all Turkish students attend primary, secondary, and high school for a combined total of 12 years and typically do not work during that period (this information was verified verbally by asking the participants); for that reason, similar to previous studies (e.g., Alsaffar, 2012; Boysan et al., 2017; Ozer, Demir, & Harrington, 2012), we did not obtain any information about employment and education levels for the younger adults.
Age-group identification
Similar to Weiss’s studies (Weiss & Lang, 2009, 2012), age-group identification was assessed using two items: “I identify with people of my age” and “I have a lot in common with people of my age.” Participants rated items on a 7-point Likert-type scale, ranging from 1 (do not agree) to 7 (absolutely agree). Higher scores represented stronger age-group identification. The two items were positively correlated (roverall = .70, p < .01, ryounger = .72, p < .01, rolder = .69, p < .01), and we computed a composite score of age-group identification for further analysis by averaging the two items.
Subjective age bias
In line with a well-established research tradition (Westerhof et al., 2014), subjective age was measured by responses to two items: “How old do you feel (both physically or psychologically)?” The subjective age score was obtained by computing the discrepancy expressed in years between the chronological and felt ages for each dimension. When a respondent’s subjective age was younger than his or her actual age, a positive value was recorded, and when the subjective age was older, a negative value was obtained.
Subjective health
In line with existing research (e.g., Allen, Hilgeman, & Allen, 2011; John & Lang, 2015), participants were asked to respond to two items: “How would you describe your current (both physical or psychologically) health?” assessing their current health status on a 5-point rating scale, from 1 (very bad) to 5 (very good).
Life satisfaction
Participants’ global life satisfaction was assessed using a single item: “How satisfied are you with your life, all things considered?” answered on a scale of 1 (totally unsatisfied) to 10 (totally satisfied; e.g., Grühn et al., 2016). Previous research suggests that a single-item measure of life satisfaction has a comparable validity to multiitem measures, and it has been widely used in psychological research (Cheung & Lucas, 2014). A single item was used to reduce the participant burden.
Rappaport time line
Rappaport time line (Rappaport, Enrich, & Wilson, 1985) was used to graphically assess participants’ subjective end-of-life position. The beginning of the line was labeled birth and the end labeled death with the default score for the beginning of life being 1 and the end being 15. Participants were asked to choose a “where I am now” point on the line to indicate their place in their life span. The item was reverse scored for analyses, with higher scores indicating a more open-ended sense of the future.
Psychological well-being
Participants provided a short form of psychological well-being (PWB) that encompassed six distinct dimensions of wellness, rated on a Likert-type scale ranging from 1 to 5 (Ryff & Keyes, 1995). The scale consists of 18 items in total, where each component is represented by 3 items. The PWB was computed as the mean score across the 18 items so that higher scores are taken to indicate higher well-being. The scale was translated into Turkish by Imamoglu (2004), and the Cronbach’s alpha coefficient was reported as .79. In the present study, the reliability of the PWB was considered acceptable for both young and older participants (αoverall = .84, αyounger = .74, and αolder = .88).
Life Orientation Test
Optimism was measured using the Life Orientation Test (Scheier & Carver, 1987). The scale consisted of 12 items, of which eight assessed dispositional optimism. The participants indicated their agreement with each item, based on a scale from 0 (strongly disagree) to 4 (strongly agree), with higher scores indicating greater optimism. The scale was adapted into Turkish by Aydın and Tezer (1991), and its Cronbach’s alpha coefficient was reported to be .72. The internal consistency in this study was good (αoverall = .79, αyounger = .84, and αolder = .79).
Attitudes Toward the Future Scale
This scale (Güler, 2004) was used to assess FTP. The scale comprised 15 items grouped into three dimensions: positive, fearful, and planful orientations. Items were rated on a scale of 1 (strongly disagree) to 5 (strongly agree). The results showed good internal consistency, with a Cronbach’s alpha of .80 for the positive, .81 for the fearful, and .79 for the Planful subscale. In the present study, the internal consistency reliabilities of the subscales were satisfactory and relatively similar for both the younger and older adults, with Cronbach’s alphas ranging from .73 to .90.
Future Time Perspective Scale
Participants completed the 10-item FTPS (Carstensen & Lang, 1996). The item responses ranged from 1 (very untrue) to 7 (very true) on a Likert-type scale. Previous studies have provided evidence of the psychometric properties of the FTPS (Lang & Carstensen, 2002; Raposo, 2012), while the reliability and validity of the FTPS-T were tested in the present study.
Translation
After obtaining authorization from its developers, the FTPS was translated using the forward–backward technique. The FTPS was first translated from English into Turkish separately by three translators who were bilingual. The three translators had also achieved a minimum qualification of a master’s degree in a subfield of psychology. The translations were compared, and discrepancies in the translation process caused by ambiguous wording were noted. Problematic word choices were resolved by discussions among the translators.
Fourth and fifth translators, who had not seen the original English version, then translated each item from Turkish into English, and the backtranslated items were compared with the original English items for congruency. This process was followed in order to ensure the clarity and comprehensibility of the items, identify translation modifications, and highlight inappropriate items or response options. Any discrepancies that emerged from the comparison were discussed, and a few minor adjustments were applied.
Finally, the FTPS-T was distributed among a small group of participants (Nyounger = 10, Nolder = 5) typical of the target population. A pilot test was performed, and the results indicated that none of the terms were difficult to understand or upsetting.
Data Preparation
Prior to the data analyses, we applied objective data cleaning criteria, such as range checks, to detect anomalies and inaccuracies. At a later stage, all variables were screened and checked for data-entry errors, missing data, and potential outliers. Four younger and three older participants did not complete any of the items of the FTP or PWB Scales and were thus omitted from the analyses. Using a criterion z value and graphical methods, six unique cases (two younger and four older adults) were deemed to be outliers on one or more variables and therefore removed. Multivariate outliers were screened by computing the Mahalanobis distance for each case for the continuous variables; two cases were identified as multivariate outliers and therefore omitted from the analyses. The critical value of the Mahalanobis distance for our sample data at α = .05 is 24.996 (Tabachnick & Fidell, 2013, p. 952). The distribution and normality of the variables were assessed by statistical (i.e., skewness and kurtosis) and graphical (i.e., histogram) methods, with the normality assumption found not to have been violated. Furthermore, it was shown that the data met the regression analyses assumptions (i.e., homoscedasticity, and independence of residuals; Tabachnick & Fidell, 2013, pp. 60–129). Descriptive statistics and regression analyses were conducted using R (Version 3.3.2; R Core Team, 2016) and SPSS (Version 23), while the confirmatory factor analysis (CFA) was performed using AMOS 24.
Data Analyses
Reliability and validity analyses for FTPS
The Cronbach’s alpha coefficients and composite reliability were calculated to assess the internal consistency reliability of the FTPS-T. The test–retest reliability was evaluated by calculating the Pearson correlation coefficient 3 weeks later, with a subsample of participants. CFA was performed in order to establish and confirm the factor structure of the FTPS-T and to assess its discriminant validity, we calculated the Pearson correlation coefficient between the FTPS-T, PWB, Life Orientation Test Scales, and life satisfaction. Some researchers have stated that a moderate correlation (e.g., r = .42) present between test scores is evidence of discriminant validity (Shaughnessy, Zechmeister, & Zechmeister, 2012, p. 166). Another method used to assess discriminant validity of the constructs is to apply Fornell and Larcker’s (1981) criterion by comparing the square root of the constructs’ average variance extracted (AVE) with the construct correlations. To evaluate the convergent validity, the Pearson correlation coefficient was calculated between the FTPS-T, Rappaport Time Line, and the subscales of the Attitudes Toward the Future Scale (ATFS). Some researchers have stated that a high correlation (e.g., r =.77) between the test scores is evidence of convergent validity (Shaughnessy et al., 2012, p. 166). Another method used to assess convergent validity is to calculate the AVE; an AVE of .5 or higher is a good rule of thumb to decide whether there is adequate convergence (Hair, Black, Babin, & Anderson, 2014, p. 619). Finally, concurrent validity was assessed on the basis of the expected differences between the younger and older adults in the FTPS-T. We hypothesized that the younger adults would report significantly greater FTPS scores (i.e., an open FTP) than older adults.
Predictors of FTP
Comparisons between the age groups were carried out using independent-samples t test for the continuous variables and χ2 tests for the categorical variables. Pearson correlation was used to determine the bivariate relations between the FTPS-T and the subjective variables (i.e., subjective age and health). Multiple regression analyses for each age-group were conducted to examine the independent contributions of sociodemographics and subjective variables in the context of the FTPS. Familywise Type I error was controlled by applying a Bonferroni correction.
Results
The results section is divided into two parts, based on the aims of the study. In the first part, we examined the psychometric properties of the FTPS-T, and in accordance with the first study aim, we evaluated each age-group separately to determine the reliability and validity of the FTPS-T. As the results between younger and older adults were very similar, we combined the two age groups to increase the sample size. The scale psychometrics were found to be a bimodal distribution of ages. In the second part, we reported the findings of our examination of the associations between sociodemographic variables and FTP and age differences in predictors of FTP.
Aim 1: The Reliability and Validity of the FTPS-T
Internal consistency and test–retest reliability
The Cronbach’s alpha was .92 for the focus on opportunities (FTO) and .85 for the focus on limitations (FTL). Composite reliability value was .91 for the FTO and .86 for the FTL and are thus above the commonly suggested threshold of .70 (Hair, Ringle, & Sarstedt, 2011). Three weeks later, a subsample of 205 participants (Nyounger = 149, Nolder= 56) completed the FTPS-T, after the initial assessment. The subsample of participants for the test–retest was not selected randomly, but no statistically significant differences were found between the test–retest and test groups in terms of chronological age, t(200) = 1.19, p > .05, gender, χ2(1) = 0.36, p > .05, marital status, χ2(1)= 0.19, p > .05, and psychiatric/neurological condition, χ2(1) = 0.08, p > .05, in younger adults, and chronological age, t(125) = 1.67, p > .05, gender, χ2(1) = 3.41, p > .05, marital status, χ2(1) = 0.02, p > .05, education, χ2(3) = 2.26, p > .05, and psychiatric/neurological condition, χ2(1) = 3.08, p > .05, in older adults. The FTO and FTL showed a significantly good test–retest stability, with coefficients of .85 and .75, respectively.
Structural validity
We used a CFA to test whether the two-factor model of the FTPS provided a better fit for the data than a one- or three-factor model. To allow for a direct comparison with the three-factor model, we followed the procedure outlined by Rohr et al. (2017). Because the fit indices showed that the data fitted two- and three-factor models better than the one-factor model, we investigated whether they could be improved by allowing items to covary, and in the end, we produced a two-factor model that fitted better than the one- or three-factor models. Table 1 provides the factor loadings of the FTPS items, whereas Table 2 provides an overview of the fit indices for the different factor solutions within CFA. We used a more stringent Comparative Fit Index and Tucker–Lewis Index cutoff of .95 (Hu & Bentler, 1999) and root mean square error of approximation cutoff of .08 (Byrne, 2016, p. 98). The correlations between the two factors were, as expected, negative, r = −.61, p < .01.
Standardized Factor Loadings for Confirmatory Factor Analysis of FTPS Scale.
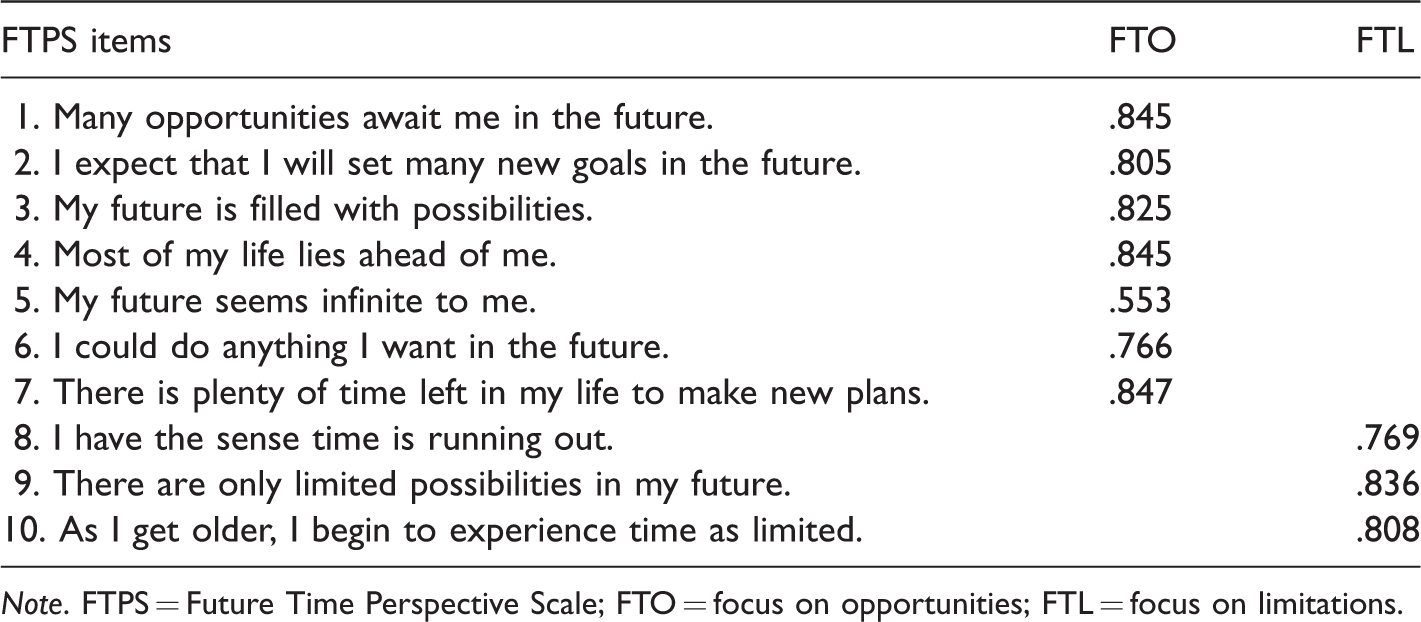
Note. FTPS = Future Time Perspective Scale; FTO = focus on opportunities; FTL = focus on limitations.
Factorial Structure of the Future Time Perspective Scale: Summary of Goodness-of-Fit Statistics for One-Factor Versus Two-Factor Versus Three-Factor Solution.
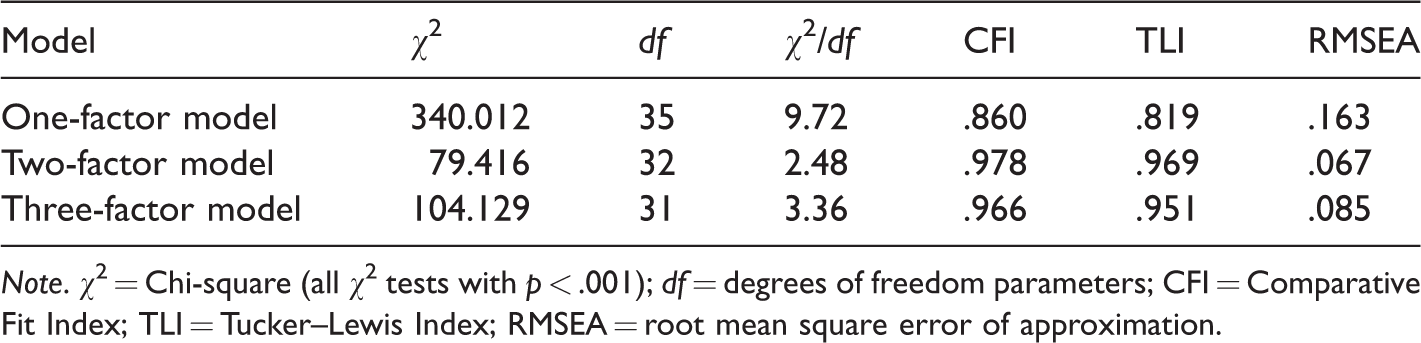
Note. χ2 = Chi-square (all χ2 tests with p < .001); df = degrees of freedom parameters; CFI = Comparative Fit Index; TLI = Tucker–Lewis Index; RMSEA = root mean square error of approximation.
Convergent validity
As expected, the FTO scores were positively correlated with the Rappaport Time Line (r = .60, p < .01), the ATFSpositive (r = .69, p < .01), and the ATFSplanful (r = .57, p < .01) but negatively correlated with the ATFSfearful (r = −.35, p < .01), whereas FTL scores were negatively correlated with the Rappaport Time Line (r = −.39, p < .01), the ATFSpositive (r = −.42, p < .01), and the ATFSplanful (r = −.39, p < .01) but positively correlated with the ATFSfearful (r = .47, p < .01). In addition, both AVE values are above the critical value of .50 (FTO AVE = .60; FTL AVE = .68), thus providing support for the measures’ convergent validity.
Discriminant validity
In line with our hypotheses, FTO scores were positively correlated with psychological well-being (r = .48, p < .01), life satisfaction (r = .36, p < .01), and optimism (r = .35, p < .01); whereas, FTL scores were negatively correlated with psychological well-being (r = −.49, p < 0.01), life satisfaction (r = −.39, p < .01), and optimism (r = −.48, p < .01). Discriminant validity was verified through the criterion employed by Fornell and Larcker (1981).
Concurrent validity
The results support the hypotheses in that FTO scores were significantly higher for younger (M = 4.66, SD = 1.04) than for older adults (M = 3.31, SD = 1.47), t(327) = 9.72, p < .001, whereas FTL scores were significantly lower for younger (M = 3.92, SD = 1.29) than for older adults (M = 4.42, SD = 1.76), t(327) = −3.00, p < .01 (see Table 3).
Sociodemographic and Subjective Variables of the Sample, Reported by Age-Group.

Note. SD = standard deviation.
aSeparated, divorced, and widowed; 86 (67.7%) older adults were retired, 32 (25.2%) were unemployed, and 9 (7.1%) were employed.
**p < .01. ***p < .001.
Aim 2: Predictors of FTP
Preliminary analyses
As seen in Table 3, FTO scores were significantly higher for younger (M = 4.66, SD = 1.04) than for older adults (M = 3.31, SD = 1.47), t(327) = 9.72, p < .001, whereas FTL scores were significantly lower for younger (M = 3.92, SD = 1.29) than for older adults (M = 4.42, SD = 1.76), t(327) = −3.00, p < .01. The Pearson correlation coefficients among the dimensions of FTP, chronological age, and subjective variables are presented in Table 4. For the sample of younger adults, FTO scores were positively correlated with subjective physical (r = .20, p < .01) and psychological age (r = .30, p < .01), subjective physical (r = .32, p < .01) and psychological health (r = .44, p < .01), and age-group identification (r = .21, p < .01); however, FTL scores were negatively correlated with subjective physical (r = −.15, p < .05) and psychological age (r = −.17, p < .05), subjective physical (r = −.26, p < .01) and psychological health (r = −.36, p < .01), and age-group identification (r = −.15, p < .05). Conversely, for the sample of older adults, FTO scores were negatively correlated with chronological age (r = −.31, p < .01) but positively correlated with subjective physical (r = .34, p < .01) and psychological age (r = .18, p < .05) and subjective physical (r = .28, p < .01) and psychological health (r = .39, p < .01); however, FTL scores were positively correlated with chronological age (r = .20, p < .05), but negatively correlated with subjective physical (r = −.45, p < .01) and psychological age (r = −.33, p < .01), and subjective physical (r = −.33, p < .01) and psychological health (r = −.30, p < .01).
Pearson Correlations Between dimensions of Future Time Perspective, Chronological Age, and Psychological Variables.

Note. *p < .05. **p < .01.
We conducted analyses of variance and tested differences in levels of education in FTO and FTL among older adults. As expected, the results revealed that education levels had a significant effect on FTL, F(3, 123) = 7.74, p < .001. Post hoc analyses using the Games–Howell indicated that older adults who had only completed primary school (M = 5.23, SD = 1.61) anticipated more limitations in their future than those who had also completed secondary school (M = 3.89, SD = 1.71), high school (M = 3.65, SD = 1.55), and university and even higher education levels (M = 3.92, SD = 1.69). With regard to the opportunity component, as the assumption of the homogeneity of variance was not met for these data, we used the Welch’s adjusted F ratio, Welch’s F(3, 50.22) = 5.15, p < .01. Post hoc analyses using the Games–Howell indicated that older adults who had only completed primary school (M = 2.80, SD = 1.12) expected to have fewer opportunities in their future, compared with those who had also completed secondary school (M = 4.09, SD = 1.66). However, there were no differences in FTO or FTL, depending on gender, marital status, psychiatric and neurological condition, or employment status; all p values were > .05. The same analysis was repeated for the younger group, and there were no differences in FTO or FTL, depending on gender, marital status, or psychiatric and neurological condition, all p values were > .05.
Main analyses
We conducted a multiple regression analysis for each age-group to determine how the subjective and sociodemographic variable contributed to the prediction of dimensions of the FTP. Table 5 summarizes the multiple regression (for younger adults) and hierarchical multiple regression analysis (for their older counterparts). For the younger adults, an examination of the beta values of the variables reveals that the strongest significant predictor for both dimensions of the FTP was subjective psychological health, while for the older adults, subjective variables provided a significant increment, beyond chronological age and education, for predicting dimensions of the FTP. In Step 3, when all six independent variables were included, the most important predictor of FTP dimensions was chronological and subjective physical age.
Hierarchical Multiple Regression Analyses Predicting Dimensions of Future Time Perspective From Sociodemographic and Subjective Variables Across Younger and Older Adults.
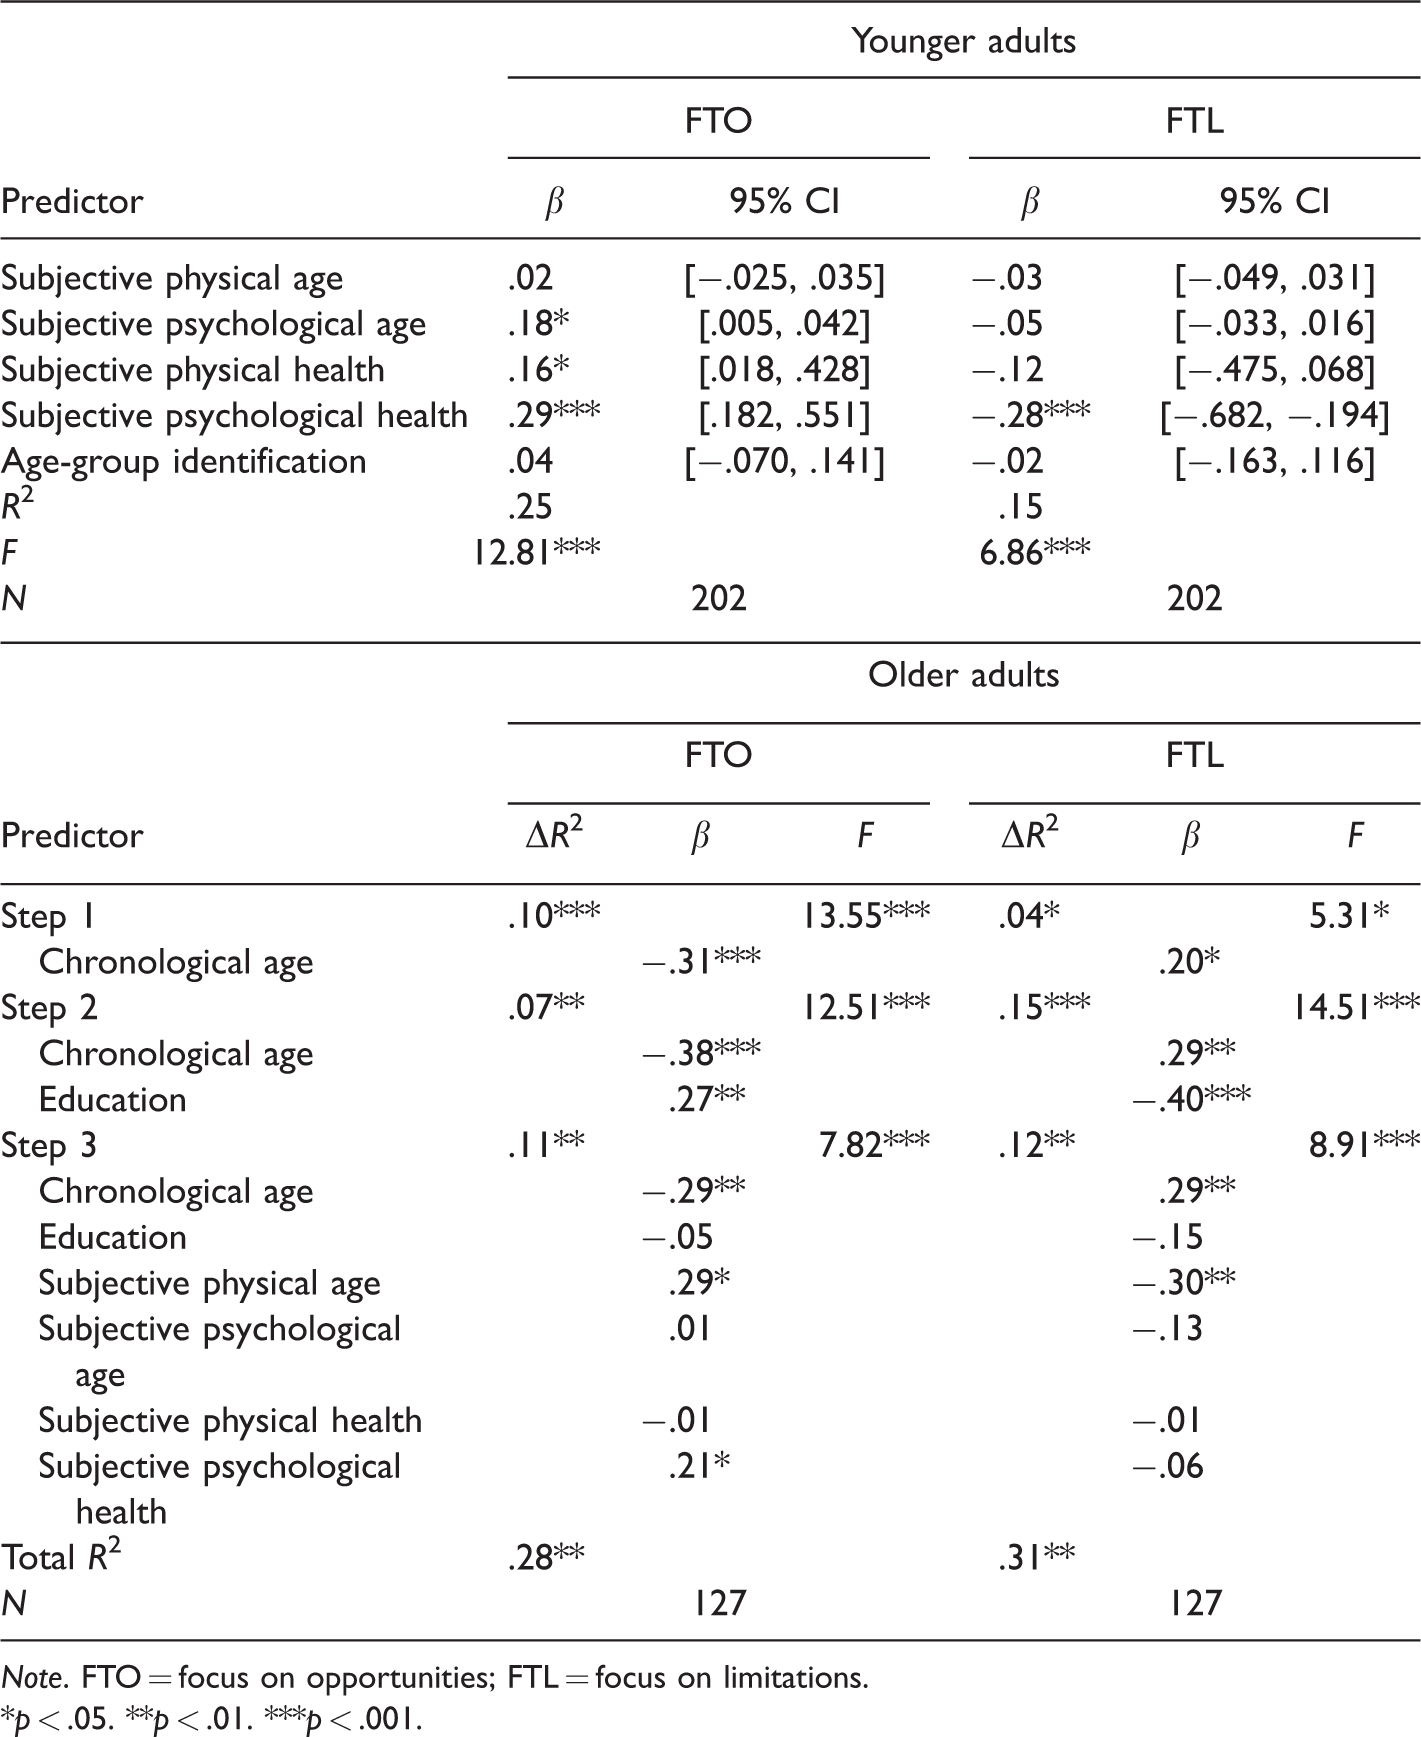
Note. FTO = focus on opportunities; FTL = focus on limitations.
*p < .05. **p < .01. ***p < .001.
Discussion
We pursued two major goals in this study. First, we wanted to assess the psychometric properties of the FTPS-T, and the results showed that it has satisfactory reliability and validity. Second, we examined age differences in predictors of FTP, and as emphasized theoretically and empirically in SST (Carstensen et al., 1999), older adults perceived their future time to be more limited, with fewer opportunities than younger adults. More importantly, our results suggest that predictors of FTP differ substantially between younger and older adults.
A growing number of empirical studies have investigated the factorial structure of the FTPS. Some studies suggest a one-factorial structure (e.g., Lang & Carstensen, 2002), while others (e.g., Zacher & Frese, 2009) offer evidence for a two-dimensional FTPS. More recently, Kuppelwieser and Sarstedt (2014) and Rohr et al. (2017) found that a three-factor model of the FTPS fits the data significantly better than one- or two-factor models. The findings within our CFA also suggest that the FTPS is best described by the two-factor model in which the factors are correlated. It is possible that religious beliefs and cultural backgrounds influence the number and correlations of FTPS dimensions.
We found supporting evidence for the discriminant validity of the FTPS-T. As predicted, our results revealed that well-being, life satisfaction, and optimism were positively related to perceiving future opportunities but negatively related to limited time. An extensive body of empirical research on FTP has reported similar findings (Brothers et al., 2014; Kozik, Hoppmann, & Gerstorf, 2015). With regard to convergent validity, consistently with earlier findings (Demiray & Bluck, 2014; Güler-Edwards, 2008), moderate and strong correlations were observed in the expected direction, with dimensions of the FTPS-T, the ATFS, and the Rappaport Time Line. The results also indicated that the FTPS-T had a high internal consistency and was acceptably stable over a 3-week test–retest period. The internal consistency reliability and test–retest coefficients obtained in this study were similar to those of previous studies (Lang & Carstensen, 2002; Raposo, 2012).
Of the various possible sociodemographic contributors (i.e., chronological age, level of education, gender, psychiatric and neurological condition, and marital status), we found that only chronological age and level of education were related to dimensions of the FTP in older adults, whereas none of these variables were significantly related to FTP dimensions in younger adults. Consistent with earlier findings regarding education-related differences in FTP (Li & Tsang, 2016; Zacher & Frese, 2009), we found that relative to their less-educated counterparts, highly educated older adults perceived future time to yield more opportunities and be less limited. However, one of the most important findings of this study is that hierarchical regression analysis demonstrates that subjective variables contribute to the prediction of FTP, beyond the effects of chronological age and level of education. Specifically, when examining the predictive utility of each possible variable, we found that subjective physical age was the most strongly predictive contributor, in conjunction with chronological age, in both dimensions of the FTP. These results suggest that the significance of subjective physical age is similar to that of chronological age, and both were substantial predictors of FTP in older adults (but not in younger adults), that is, older adults with older subjective physical ages reported a more limited FTP than older adults with younger subjective physical ages. These findings are consistent with the SST and the literature (e.g., Carstensen, 2006; Rohr et al., 2017), but extending previous findings to subjective physical age (but not subjective psychological age) significantly predicts dimensions of the FTP, and therefore, the present research highlights the importance of subjective physical age in older adults’ perceptions of future time. However, the mechanism through which subjective physical age predicts FTP dimensions has yet to be investigated, and further studies could seek to understand the mediators or moderators of the underlying processes of how subjective physical age impacts FTP.
Many recent studies have focused on one-item global ratings of subjective health (e.g., Grühn et al., 2016; John & Lang, 2015) and have shown that poorer subjective health relates to a perception of a limited future time, whereas better subjective health indicates a more open-ended time perspective (Kooij & Van De Voorde, 2011). In this study, we investigated the influence of two dimensions of subjective health (i.e., psychological and physical) on people’s perceptions of their future. As expected, we found that among younger adults, both dimensions were related to FTO and the FTL, but interestingly, when both possible contributors were included, we found that subjective psychological health constituted the single most significant predictor of FTL and was the main and strongest predictor of FTO. Subjective psychological health explains greater variance than subjective physical health and subjective psychological age. In contrast to older adults, among younger adults, it seems that subjective psychological health exerts a more powerful influence than subjective physical age on the perceptions of time horizons. These findings can be interpreted as younger adults viewing poorer subjective psychological health as more threatening, while older adults viewing older subjective physical age as more threatening. This finding could be explained by the fact that older adults cope better with health problems than their younger counterparts (Molton et al., 2008) and therefore do not view poorer subjective psychological health as more threatening. It should be noted that the older participants in the present study were relatively healthy, and therefore subjective physical age contributed more than subjective psychological health to time perception among older adults.
These findings illustrate the importance of subjective psychological health and physical age for younger and older adults, respectively, and extend the literature by showing how different dimensions of subjective health and age are related to dimensions of FTP across, younger and older stages of adulthood. However, it is worth noting that the dimensions of subjective health and age were measured using a single-item approach in this study, which could have increased measurement errors. For this reason, further research is needed to construct a stronger and more reliable tool to assess multidimensional aspects of subjective health and age in order to replicate the present findings.
Study Limitations
There are a number of limitations to this study. First, the older adult sample was relatively small, and future research that seeks to investigate possible relationships between the construct of FTP and other variables would so well to include larger samples. Second, this study included only a few predictors among the many possible individual differences. Other variables outside the scope of the study such as health and lifestyle behaviors, personality, income, and expected and desired longevity might also serve as reasonable predictors of the tendency to look to the future. We therefore recommend that additional variables be assessed in future studies in order to better understand the predictors of FTP. Third, we must underscore that our correlational results do not imply causality. Finally, we should note that despite the fact that the Ryff’s PWB Scale is one of the most widely used scales by researchers studying well-being among clinical and general samples, it has been criticized for perceived problems with psychometric reliability as well as for the number of dimensions (Clarke, Marshall, Ryff, & Wheaton, 2001; Springer & Hauser, 2006). Notwithstanding these limitations, to the best of our knowledge, this study is the first attempt to determine the psychometric properties of the FTPS-T and to examine age-group differences in predictors of FTP in Turkey. Consequently, this study provides strong initial evidence for future researchers by offering an assessment of time perspectives on aging and health.
Conclusion
The findings from this study support the notion that the FTPS-T is a feasible, reliable, and valid instrument for assessing the time perspective of the Turkish population. Moreover, our findings suggest that various dimensions of subjective variables were substantial predictors of FTP among both younger and older adults, and as a result, we argue that chronological age alone is not an adequate indicator of FTP, but rather a combination of subjective variables shapes the perceptions of lifetime. This study also has practical implications for programs or efforts in the fields of aging and health. Intervention programs should focus specifically on activities that make older adults feel physically younger, making it more likely that they come to a positive developmental outcome as they reshape their time perspective.
Footnotes
Acknowledgments
The authors wish to thank Associate Professor Aysun Dogan for her contribution to data collection. Without her contribution, this study would not have come to fruition.
Declaration of Conflicting Interests
The authors declared no potential conflicts of interest with respect to the research, authorship, and/or publication of this article.
Funding
The authors received no financial support for the research, authorship, and/or publication of this article.