




Abstract
High level of preferences for routines is an indicator of psychological vulnerability in older adults. However, the psychometric properties of the Preferences for Routines Scale (PRS) initially validated in a small selected sample of older adults revealed a low Cronbach’s α (.50) in the general elderly population. The present study aims to improve the PRS using the data from the “AMI” and “PAQUID” population-based studies. Among 718 older persons, the most discriminative items are identified using item response theory methodology. A short form of the PRS (PRS-S) included five of the ten items of the original scale and showed improved internal consistency and test–retest reliability. The factors associated with the PRS-S are similar to those found in previous studies. Norms are provided according to gender and educational level. The reduction of the number of items tends to facilitate its administration and promote its use in both clinical and epidemiologic research contexts.
Public Significance Statements
This study suggests that the daily life functioning based on individual preferences for routines can be assessed from five items. These five items constitute a short scale that shows good psychometric properties in older persons and is proving to be a relevant indicator of psychological vulnerability in both clinical practice and research.
In the last decade, some studies questioned the role of daily life routines. While partly adaptive, routinized functioning is also the marker of increasing vulnerability in psychological, cognitive, or functional domains. Beyond age and education, other factors have been identified as associated factors of routinization, such as anxious and depressive symptomatology (Bouisson & Swendsen, 2003; Bouisson, 2002; Zisberg et al., 2009), cognitive complaints, cognitive decline (Bergua et al., 2006), low flexibility abilities (Tournier et al., 2012), or restriction in daily life activities (Bergua et al., 2013). Depending on the vulnerability profiles in terms of age, anxiety, depression, cognitive functioning, and functional abilities, the preferences for routines are more or less important and more or less adaptive (Bergua, Dartigues et al., 2012). In particular, it is found that the more vulnerable people are, the greater the preferences for routines are important and not adaptive. Integrating routinization assessment in the geriatric examination of older adults may be useful because it reflects both individuals’ resources in daily functioning and vulnerability in some persons who cannot function otherwise than by their routines.
Reich and Zautra were the first researchers who specifically studied the routinization process in elderly people. They hypothesized that routinization represents both a personality trait and an adjustment strategy to stress situations (Reich & Zautra, 1991). Bouisson (2002) developed a scale, the Preferences for Routines Scale (PRS), which measures daily life routines in older adults. This ten-item French-language scale used 5-point Likert scales to assess the degree to which the participant generally agrees with statements about doing tasks in a particular order or about the desirability of changes to daily life behaviors or activities. These items primarily assessed daily behaviors in the older people, such as daily rhythms and activities, and intentionally excluded questions likely to assess personality dimensions (such as obsessionality). The initial validation of the PRS showed good psychometric properties with acceptable internal consistency (Cronbach’s α = .73) and high test–retest reliability (r = .84) in a sample of 80 elderly individuals. This sample was predominantly female (76%), between 65 and 96 years of age (with a mean of 79.6 years), and selected in roughly equal proportions from retirement homes and independent living accommodations through convenience sampling in four geographic areas of France (Bouisson, 2002). An ecological validation of daily living was also conducted on a subsample of 47 elderly participants and showed that preferences for routines assessed by the PRS predicted the repetition of both specific behaviors and environmental contexts during the same time periods across different days (Bouisson & Swendsen, 2003).
In the light of the results about preferences for routines as a potential indicator of vulnerability, its use in epidemiologic studies appeared interesting to better understand the psychological, cognitive, or functional changes in normal and pathological aging and to assess whether routinization could moderate the impact of such changes. The PRS was then included in the PAQUID (“Personnes Âgées Quid”) cohort, a prospective population-based study (Dartigues et al., 1992). However, even if the psychometric properties were acceptable in the initial validation study, the PRS in general older adult population, living at home, revealed a low level of internal consistency with Cronbach’s α = .50 (Bergua et al., 2013). This result could be explained by the differences between the two study samples, particularly in terms of sample size, sociodemographic characteristics, selection process, and living conditions.
Our study aimed at improving the psychometric properties of the PRS in a general older adult population setting, more representative of the clinical variability of elderly population. To this aim, the present study identified the best discriminative items of the scale administered in two French cohorts: PAQUID and AMI (“Aging Multidisciplinary Investigation”) studies, which include participants aged 65 years and more. In addition, normative data norms have been computed to facilitate interpretation of routinization score in clinical practice and future research.
Methods
Cohorts
This study relies on two French prospective population-based studies: AMI (Pérès et al., 2012) and PAQUID (Dartigues et al., 1992).
The PAQUID study is an epidemiological prospective survey relying on a population-based sample of 3777 community-dwelling individuals aged 65 or older living in Southwestern France. Participants were evaluated at home at the initial visit and approximately every 2 or 3 years since 1988.
The AMI study included 1002 retired farmers aged 65 and over, also living in Southwestern France, and evaluated at home at the initial visit and approximately every 2 or 3 years since 2007. The study aims at studying aging in rural areas through a multidisciplinary approach.
Assessment visits include an interview conducted at home by a trained psychologist who used a standardized questionnaire addressing health issues, life environmental conditions, functional abilities in daily life, psychological functioning, and cognitive functioning. After the interview and a neuropsychological assessment, the psychologist completed a criteria checklist for dementia diagnosis. Individuals who met dementia criteria were seen by a neurologist or geriatrician who confirmed or rejected the diagnosis according to current standards. In the final stage, the diagnosis of dementia and its etiology was reviewed by an independent panel of specialized neurologists. These studies have been approved by the Ethical Committee of the South-West and Overseas III of France. Informed consent was obtained from all individual participants included in the study.
Regarding the PRS more particularly, the scale was administered to a subsample of the participants at 13-year follow-up, and then at 15- and 17-year follow-up visits of the PAQUID study (referred to as T13, T15 and T17, respectively). This measure was also collected at 2- and 4-year follow-ups of the AMI study (referred to as T2 and T4, respectively).
Participants
As part of the AMI study, 564 persons completed the self-administered questionnaire including the routinization scale at T2, that is 77% of the 731 eligible participants. As part of the PAQUID study, the routinization scale was proposed at the end of the interview of 682 participants at T17. Considering the two samples, among the people to whom the PRS was proposed, 718 (57.6%) had complete data for the PRS, 67 (5.4%) were partially filled, and 461 (37%) were not completed at all (see the flow chart; Figure 1). In a large proportion of cases, missing data were due to lack of time, fatigue, or vulnerability. The descriptive analyses indicated that in comparison to the participants who fully completed the PRS (N = 718), the 528 persons who did not were older (p < .001) and had a lower education (p < .001). The proportion of persons with dementia was also higher (23.5% vs. 6.1%, p < .001).
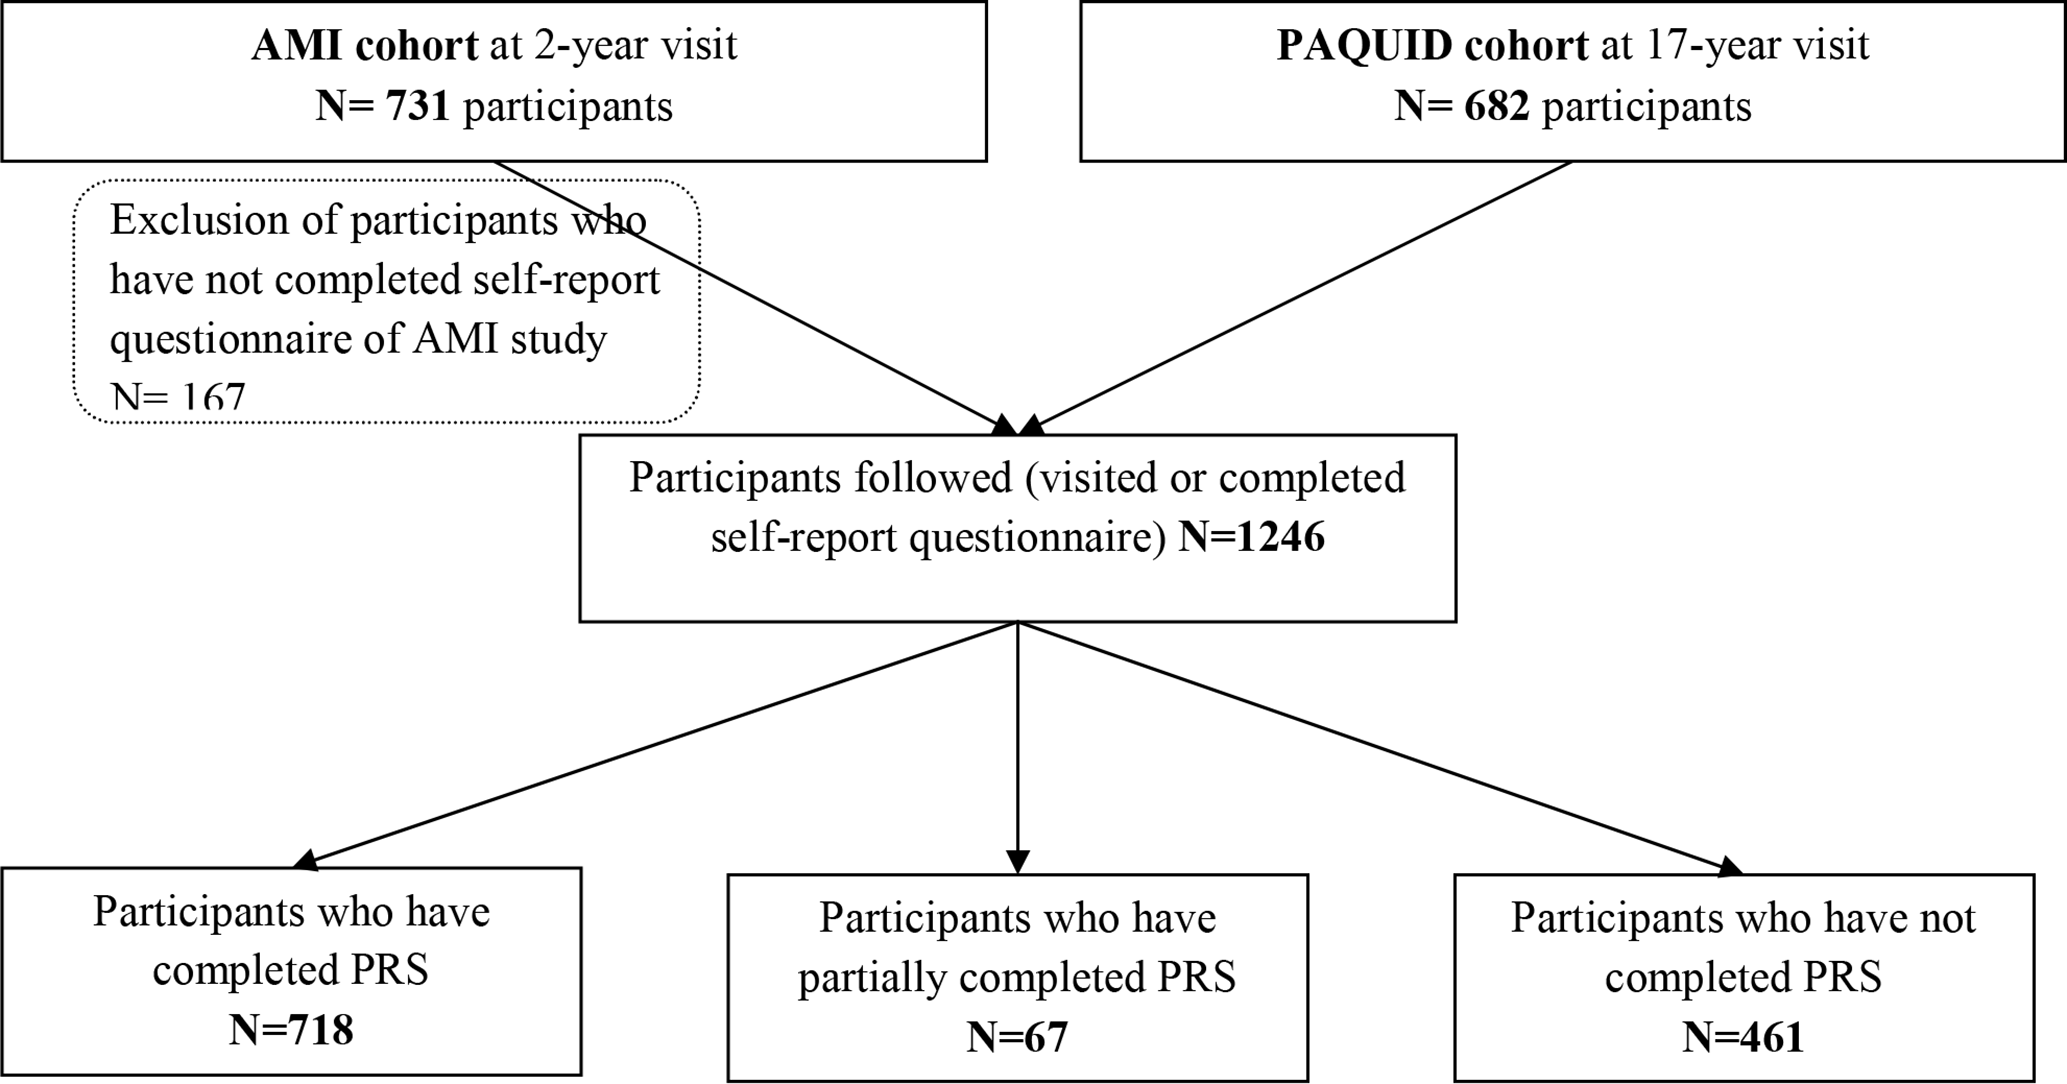
Study flow chart. PRS = Preferences for Routines Scale.
Variables
To assess the expected associations of the score on the short version of the PRS (PRS-S) with the known associated factors of preferences for routines, several variables including sociodemographics, physical, functional, mental health, and cognitive measures were considered.
Sociodemographics
Sex, age, and educational level were classified in two categories (no schooling vs. 7 years of education equivalent to primary school certificate, “CEP”), and living conditions were considered as binary variables (widowed or not, and living alone or not).
Physical Health and Limitation of Activities
Mobility was measured by Rosow and Breslau’s scale (Rosow & Breslau, 1966) assessing the ability to perform heavy housework, walk between 500 meters and 1 kilometer, and go up and down two flights of stairs: a score of 1 represents limitation for at least one of the three activities (0 = no limitation).
The ability to perform instrumental activities of daily living (IADLs) was assessed by Lawton and Brody’s scale (Lawton & Brody, 1969). The score for the four IADLs (telephone communication, transportation use, taking medication, handling finances; Barberger-Gateau et al., 1999) most associated with cognitive functioning was used. An individual was considered limited if he/she could not perform the activity at the highest level of performance. The number of IADLs for which a given individual was considered limited was summed, the score ranging from 0 to 4 (score increasing with the level of limitation).
The basic activities of daily living (ADLs) were evaluated by Katz et al.’s scale (Katz, 1983). ADLs included bathing, dressing, using the toilet, moving from one place to another, and eating. A participant was considered limited if he/she could not perform at least one of the five ADLs in this scale without a given level of assistance as defined by Katz. This binary variable was coded 0 = no limitation and 1 = limitation for at least one ADL.
Medication was considered as a comorbidity indicator. The variable used was the amount of medication currently being taken by the participant.
Mental Health and Cognition
Depressive symptomatology was evaluated by the Center for Epidemiologic Studies Depression scale (CES-D scale; Radloff, 1977). Participants were asked to indicate their experience of 20 depressive symptoms over the previous week on a 4-point scale, with the total score ranging from 0 to 60 (score increasing with the level of severity of the symptoms). In the validation study of the French version (Fuhrer & Rouillon, 1989), cutoff scores of high depressive symptomatology were identified, that is, 17 or higher for men and 22 or higher for women. Both continuous (total score of CES-D) and binary (high versus low depressive symptomatology) variables were used.
Trait anxiety was evaluated by the State-Trait Anxiety Inventory form Y (STAI-Y; Spielberger et al., 1983). Participants were asked to indicate how they “generally feel“ on a 4-point scale with respect to 20 different anxiety-related items, with the total score ranging from 20 to 80 (score increasing with the level of severity of the symptoms). The French version (Bruchon-Schweitzer & Paulhan, 1993) showed good psychometric properties in the older people (Bergua, Meillon et al., 2012). The continuous variable based on the total score of trait-STAI (STAIT) was used.
Life satisfaction was evaluated by asking participants to rate the latter on a Likert scale ranging from 1 to 7 (1 = not at all satisfied, 7 = very satisfied). We used a dichotomized score with 1 = rather satisfied (for scores from 4 to 7) and 0 = rather unsatisfied (for scores from 1 to 3).
Subjective health status was evaluated by asking participants to rate their health with the following question: “Do you consider your health condition to be: very good – good – average – poor – very poor?” We used a dichotomized score (1 = very good/good/average; 0 = poor/very poor).
Cognitive functioning was evaluated through three tests administered in both cohorts: (1) Mini-Mental State Examination (MMSE; Folstein et al., 1975), assessing global cognitive abilities, consists of 30 items involving orientation, registration, attention and calculation, recall, language, and copying skills. We used the total score ranging from 0 to 30. (2) Isaacs Set Test (IST; Isaacs & Akhtar, 1972), assessing verbal fluency, measures the ability to produce words belonging to semantic categories (colors, animals, fruits, city names), in a preset time of 60 s. We used the overall score, that is, the sum of the subscores of the four categories. (3) Digit Symbol Substitution Task (DSST; Wechsler, 1981) assesses psychomotor speed. In this test, participants have a code table displaying the correspondence between pairs of digits (from 1 to 9) and symbols. They are required to fill in as many squares as possible with the symbol paired to the digit above the square. We used the total score, that is, the number of symbols correctly reported in 90 s.
Finally, dementia diagnosis was based on a neuropsychological assessment and confirmed by a neurologist or geriatrician according to current standards. This diagnosis was used as a binary variable at each follow-up visit.
Data Analysis
For descriptive statistics, means and frequencies of the main variables were carried out. The psychometric evaluation of the PRS was based on item response theory (IRT) methodology, particularly useful for scale construction and evaluation (Thomas, 2011). It consists of linking the level of a measured construct (i.e., routinization in the present study) to an item response category (i.e., the five ordered-response categories for each question of the PRS, according to the degree to which the participant agrees with statements about daily routines).
To evaluate the PRS, the three IRT assumptions of unidimensionality, local independence, and monotonicity were first evaluated.
Unidimensionality, that is, all items are considered to load on a single factor, was evaluated with confirmatory factor analysis (CFA) using polychoric correlations. The analysis was performed using the R-Package (version 3.2.3) Lavaan (version 0.5–22), and CFA model goodness of fit was assessed by examining multiple indices and recommended criteria: Comparative Fit Index (CFI > .90), Tucker–Lewis Index (TLI > .90), and Root Mean Square Error of Approximation (RMSEA < .10; Browne & Cudeck, 1992; Kenny et al., 2015; Thomas, 2011). In the case of CFA model poor fit, an exploratory factor analysis (EFA) was performed in order to select items. Unidimensionality assumption is reached when the first factor accounts for at least 20% of the variability and when the ratio of the variance explained by the first to the second factor is greater than four (Reeve et al., 2007; Reise & Revicki, 2014).
Local independence assumes that after controlling for the dominant factor, there is no significant correlation among item responses (Reeve et al., 2007). To identify local dependence (LD), the residual correlation matrix achieved by the single factor CFA was examined. Possible LD was considered for residual correlation greater than 0.2.
Monotonicity assumes that the probability to endorse a higher item response category should increase as the underlying level of the construct increases. A nonparametric IRT model was fitted to the data to evaluate monotonicity using Mokken scaling in the R-package Mokken (version 2.8.3). This model provides nonparametric IRT response curve estimates through the probabilities of endorsing response categories. It can be visually inspected to evaluate monotonicity.
Once the IRT assumptions were confirmed, a two-parameter probit IRT model for graded responses (GRM; Samejima, 1997) was fit to the data for item and scale analysis. The graded responses are characterized here by the five-item response categories. A GRM model was performed using the R-package mirt (version 1.30) to estimate two parameters: (1) the discrimination a or item slope (i.e., inverse of the residual variability of an item): higher slope value means that the item is more powerful to discriminate individuals between proximate levels of routinization; and (2) the difficulty: item thresholds indicate item difficulty and locate items along the latent construct where the item best discriminates among individuals. For each five-level item, the model provides four thresholds (b1, b2, b3, b4). GRM fit was assessed using the S-X² statistic which compares the differences (residuals) between the observed and expected response frequencies. Items with an S-X² p value of less than .001 were considered to have poor fit (McKinley & Mills, 1985; Reeve et al., 2007).
Reliability of the PRS was also estimated using Cronbach’s α and intraclass correlation coefficient (ICC) between baseline and 2-year follow-up visits (ICC > 0.75, excellent; 0.40 < ICC < 0.75, acceptable; Andresen, 2000; Fleiss, 1981). ICC was calculated after exclusion of participants having received a diagnosis of dementia or institutionalized between these two follow-up visits.
Differential item functioning (DIF) analyses were performed to examine if the probabilities of responding on different categories vary across the studied groups (e.g., age or gender) for equivalent levels of routinization (Choi et al., 2011; Reeve et al., 2007). Two types of DIF were measured: uniform DIF which refers to DIF in the threshold parameter, and nonuniform DIF which appears in the discrimination parameter. DIF was evaluated within the PRS sample based on the main associated variables: gender, age (under 80 years vs. 80 years and over, to distinguish between the third age and the fourth age; Baltes & Smith, 2003), education level (≥7 years vs. <7 years of schooling, equivalent to primary school certificate, “CEP” level), widowhood or not, anxiety status (score <36 vs. ≥36, that is, the median score according to the norms of STAI-Y trait scale; Bergua, Meillon et al., 2012), and ADL and IADL disability (at least one disability vs. more). DIF analyses were performed using the R-package Lordif (version 0.3–3).
Finally, we assessed the associations of the scores on the new version of the PRS with commonly associated factors among which sociodemographic, physical and functional, cognitive, and psychological variables. Correlations were calculated to examine the relationship between the new version of the PRS and the main continuous variables to check covariance between the study variables. Univariate linear regressions were then performed by domains followed by multiple linear regressions with a backward stepwise procedure to assess the main explanatory variables of preferences for routines among sociodemographics, physical and functional, psychological, and cognitive scores. The assumptions of homoscedasticity and normal distribution of the residuals were verified.
The adjustment of the PRS scores for sociodemographic characteristics was based on regression coefficients obtained at the previous step. The standardized regression residuals were used to identify the associated percentiles. The residuals represent the difference between the score of an individual and the mean score of individuals with the same gender and education obtained by the linear regression (Royston & Altman, 1994). Higher adjusted scores correspond to better performance.
Results
Descriptive statistics are presented in Table 1. The final sample of 718 individuals had a mean age of 80.20 (SD = 6.86), 54.0% were men, 31.9% had low educational level, 19.2% were widowed, and 33.0% were living alone. Regarding the functional status, 65.9% were mobility-restricted, 33.4% were limited for one or more IADL, and 13.2% were ADL-limited. Regarding mental health variables, 7.1% had high depressive symptomatology, with a mean CESD score of 7.46 (SD = 6.77); the mean score for anxiety symptomatology was 37.39 (SD = 9.46); subjective health was rated as rather good for 92.9% individuals; and life satisfaction was rated as rather satisfying for 95.4% individuals. The mean MMSE score was 26.31 (SD = 3.01) and 6.1% (n = 44) were incident cases of dementia at the 2-year follow-up of the AMI study and at 17-year follow-up of the PAQUID study. Finally, IST and DSST scores were 55.44 (SD = 15.33) and 24.71 (SD = 10.12), respectively.
Descriptive Statistics of the Study Sample (N = 718).
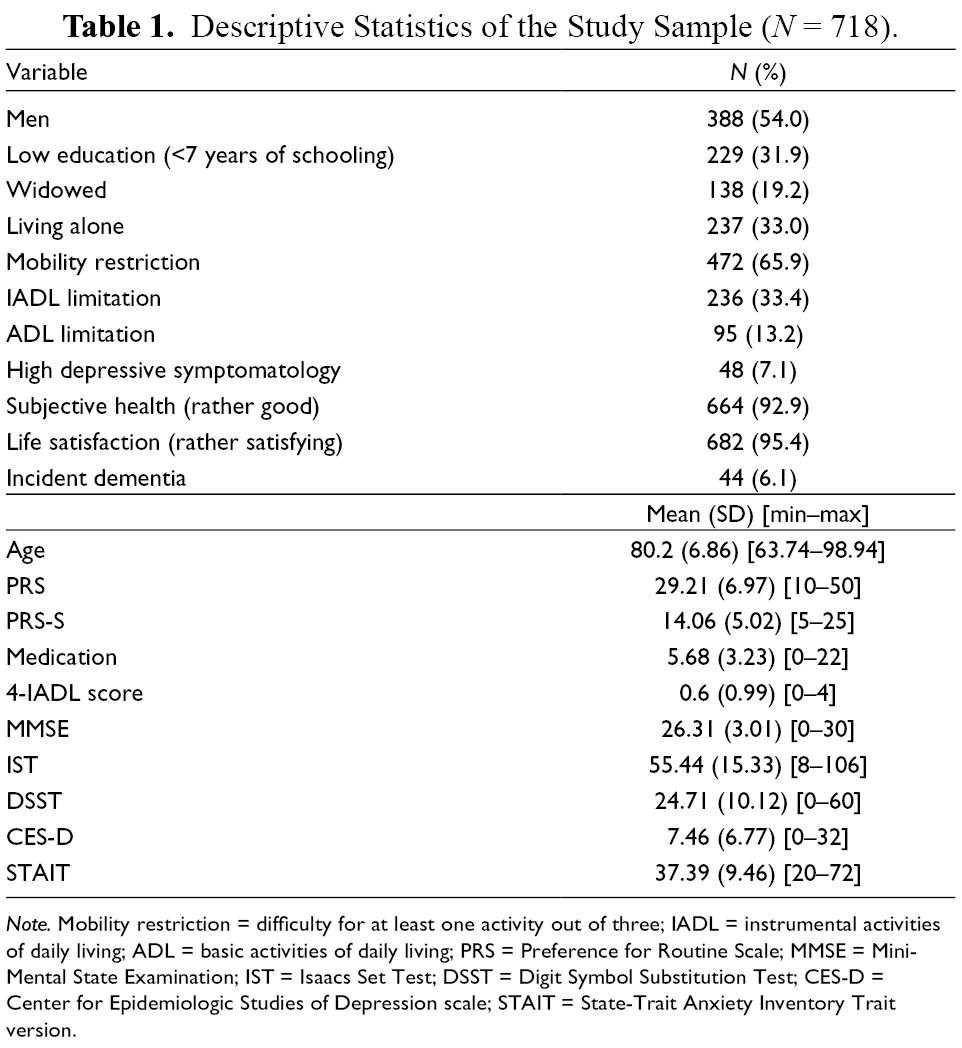
Note. Mobility restriction = difficulty for at least one activity out of three; IADL = instrumental activities of daily living; ADL = basic activities of daily living; PRS = Preference for Routine Scale; MMSE = Mini-Mental State Examination; IST = Isaacs Set Test; DSST = Digit Symbol Substitution Test; CES-D = Center for Epidemiologic Studies of Depression scale; STAIT = State-Trait Anxiety Inventory Trait version.
Calibration of the PRS
The CFA results on the ten-item scale indicated a poor fit to a unidimensional model with a CFI of 0.55, TLI of 0.42, and RMSEA of 0.14. After EFA analyses made it possible to select relevant items, the best fit to a unidimensional model was obtained with a five-item scale (items 2, 3, 5, 7, 8). The first and second factors in EFA accounted for 27% and 18% of the variance, respectively; hence, the ratio of the variance explained by the first to the second factor was 1.5, which did not meet the criterion of 4. CFA analysis showed that the five-item loadings to the first factor were 0.57 (SE = 0.04), 0.53 (SE = 0.04), 0.77 (SE = 0.03), 0.63 (SE = 0.04), and 0.49 (SE = 0.04) for items 2, 3, 5, 7, and 8, respectively. CFA fit indices were as follows: CFI = 0.96, TLI = 0.91, RMSEA = 0.10, which met the criteria of good fit to unidimensionality.
Concerning LD, four out of the 45 item pairs (8.9%) had residual correlation greater than 0.20. The considered item pairs were: items 6–9, items 4–6, items 4–9, and 9–10, with residual correlation of 0.45, 0.32, 0.28, and 0.21, respectively. These items were finally removed in the five-item short-form scale (a short form of the PRS or PRS-S; see Supplemental Figure).
The Mokken scalability coefficient of the ten-item scale was 0.12, suggesting a poor scalability according to usual criteria (>.30). All the items had a scalability coefficient under the bound of 0.30. For the five-item short form, the coefficient was 0.31, greater than 0.30 with individual item coefficient greater than 0.26. The five-item short form was close to the assumption of monotonicity.
The results of IRT analysis are presented in Table 2. The item threshold parameters ranged from −1.75 to 1.68. The item discrimination (slope) ranged from 0.97 to 2.26 with item 8 exhibiting the lowest discrimination value and item 5 the highest one. According to Baker’s criteria (Baker, 2001), all items had moderate discrimination power. The probability values for the S-X² statistics ranged from 0.00 to 0.57. Based on the S-X² p value less than .001, all items were found to fit the GRM. Model R codes for the GRM can be found in Supplemental Material.
IRT Item Characteristics for the Five-Item Short Form of the PRS.
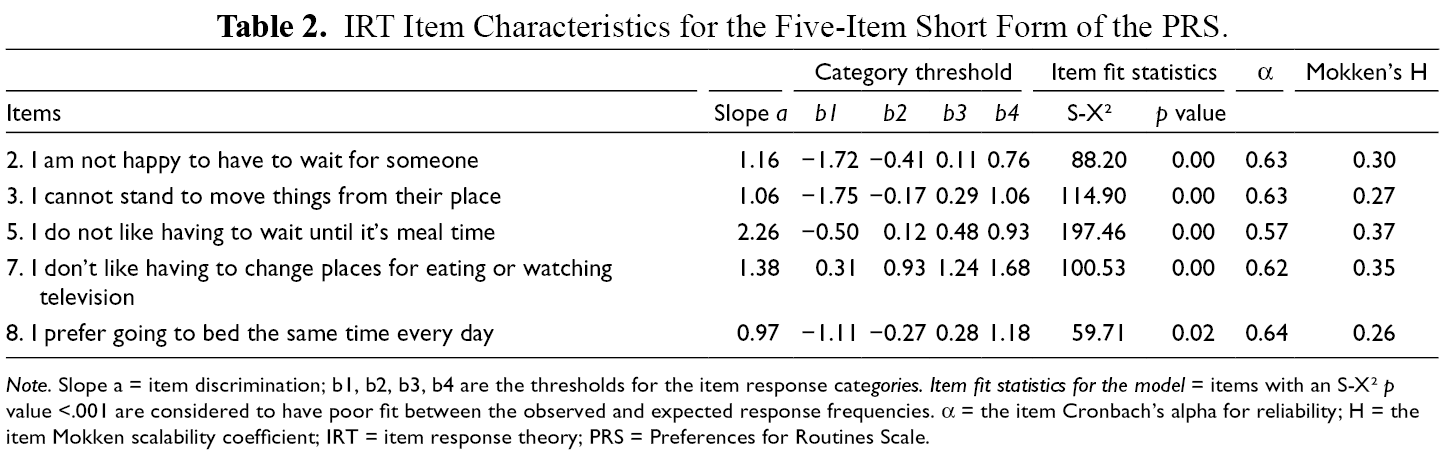
Note. Slope a = item discrimination; b1, b2, b3, b4 are the thresholds for the item response categories. Item fit statistics for the model = items with an S-X² p value <.001 are considered to have poor fit between the observed and expected response frequencies. α = the item Cronbach’s alpha for reliability; H = the item Mokken scalability coefficient; IRT = item response theory; PRS = Preferences for Routines Scale.
Differential Item Functioning
For equivalent level of routinization, the probabilities of responding on each of the five items did not vary with gender, age, educational level, widowhood, anxiety status, and ADL and IADL disability.
Reliability
The Cronbach’s α coefficient for the five-item short form was 0.66 versus 0.55 for the ten-item form, which indicates a better internal consistency for the short scale. Moreover, the test–retest reliability between baseline and 2-year follow-up visits was good, ICC = 0.69 (n = 343).
Finally, the factors associated with the PRS-S were assessed (Table 3) using univariate and multivariate regressions.
Variables Associated with the PRS-S. Results from Linear Regressions (N = 718).
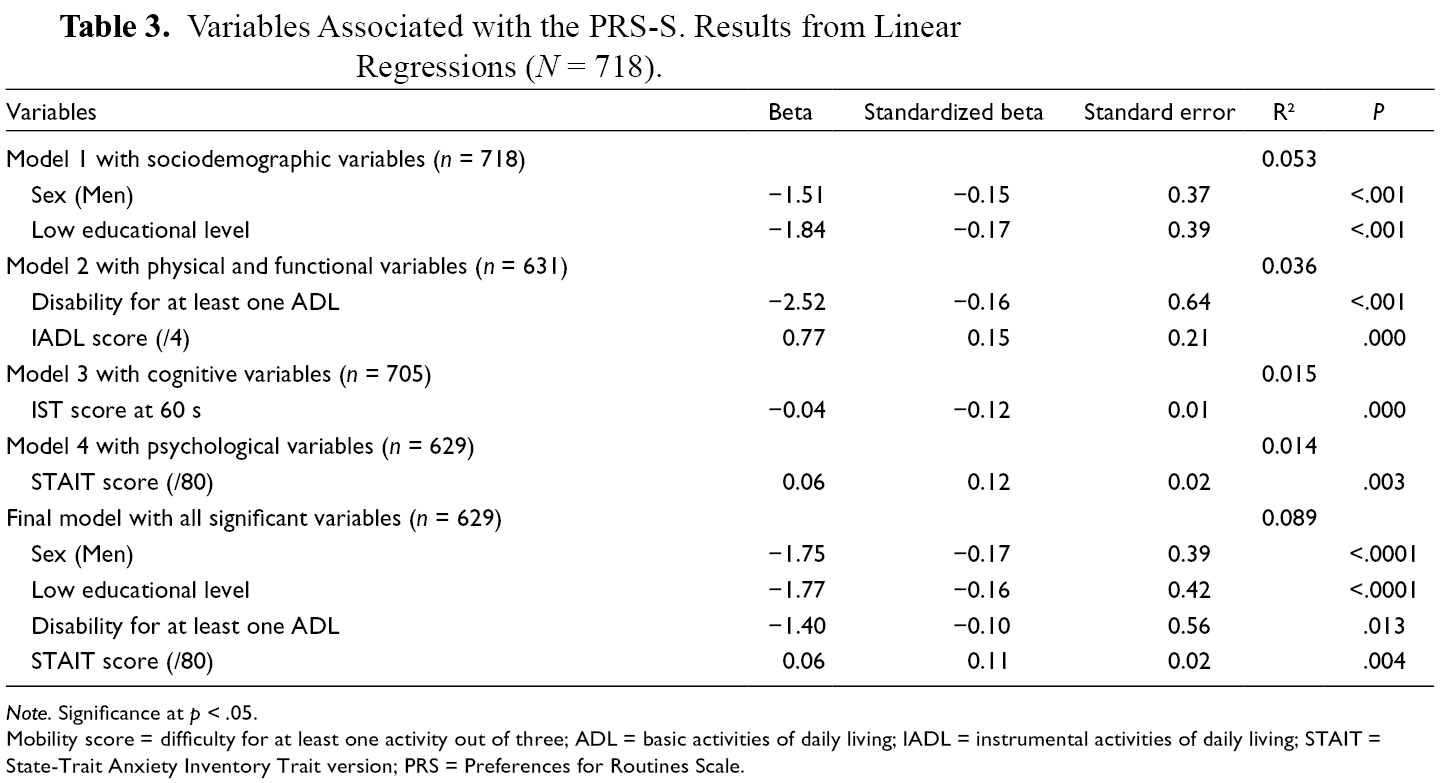
Note. Significance at p < .05.
Mobility score = difficulty for at least one activity out of three; ADL = basic activities of daily living; IADL = instrumental activities of daily living; STAIT = State-Trait Anxiety Inventory Trait version; PRS = Preferences for Routines Scale.
For univariate regression analyses, the PRS-S score significantly differed only for participants with lower educational level (β = −.71), those with disability (β = −.36), and those with higher medication (β = .04). Regarding cognition, the PRS-S score was significantly associated with MMSE (β = −.04), IST (β = −.01), and DSST (β = −0.02) performances, but not with dementia diagnosis. Finally, among the psychological variables, only STAIT was significantly associated with the PRS-S score (β = 0.032).
After checking correlations (using Spearman’s test) between the different variables in the study, the main factors associated with the PRS-S were assessed by domain (see Supplemental Table). Multivariate regression models were then conducted to identify the most pertinent correlates of the PRS-S among sociodemographic variables, functional and physical, cognitive, and psychological measures. The PRS-S was significantly associated with male gender (β = −1.51) and low educational level (β = −1.84) among sociodemographic variables (model 1), with disabled individuals for ADL (β = −2.52) and IADL (β = 0.77) among physical and functional variables (model 2), with the IST score (β = −0.04) among cognitive variables (model 3) and with the STAIT score (β = 0.06) among psychological measures (model 4). The final model included all significant variables identified through these different models; the PRS-S score was significantly associated with male gender (β = −1.75), low educational level (β = −1.77), ADL disability (β = −1.40), and the STAIT score (β = 0.06).
As the scores on the PRS-S differed according to gender and educational level, p < .001, the norms (Table 4) were stratified by gender and educational level (lower or higher than CEP).
Norms of the PRS-S According to Gender and Educational Level (N = 718).

Note. PRS = Preferences for Routines Scale.
Discussion
Given the low internal consistency of the PRS in the general older adult population due to its initial validation in a very selected sample of older adults, it was important to redefine the scale so that it can be used in larger contexts involving older adults presenting a wide range of sociodemographic and clinical characteristics. In addition to the larger sample size, the present study is based on a sample of older people with an equivalent age range (between 64 and 104 years) to the initial validation study, with a balanced gender distribution (54% of men). The older persons in the present study were assessed in two French regions, between 2005 and 2011, which does not constitute a significant generational difference when compared with the original study. A more important difference relates to the proportion of institutionalized people (here, 11.1%). However, it can be assumed that this proportion is more representative of the lifestyle of people in this age group (only 4% to 7% of people over 65 living in institutions; Insee, 2019).
We used IRT to develop the PRS-S with five items rated from 1 to 5 according to the level of routinization leading to a total score that ranged from 5 to 25. IRT has allowed for identification of the items that contributed the most to the measure of preferences for routines. The removed items were about doing the same things each day, liking unexpected events, moving and changing activities, going out to meet new people, and watching new programs or movies on television. Without these items, psychometric properties of the PRS-S were improved in the general older adult population with better internal consistency and test–retest reliability. In addition, reducing the number of items also has the advantage to shorten the scale administration duration.
Moreover, the factors associated with the PRS-S are similar to those identified in previous studies. Preferences for routines remain greater in the persons with lower educational level as found by Bouisson and Swendsen (2003) and Zisberg et al. (2009). Considering that education is an indicator of sociocultural level and lifestyle, this result supports the hypothesis of Zisberg et al. (2009) according to which more educated people would be more oriented toward novelty by pursuing their interests more actively than less educated people who would be more focused on their daily routines. Preferences for routines as assessed by the PRS-S were also associated with disability as found by Bergua et al. (2013) and Zisberg et al. (2009); low cognitive functioning, in particular for executive functions, as found by Tournier et al. (2012); and with high trait anxiety level as found by Bergua et al. (2006) and Bouisson (2002). The association of routinization with the absence of widowhood may appear counterintuitive because the loss of a spouse is generally associated with greater psychological vulnerability (Bennett, 1998). Nevertheless, as emphasized by Naef et al. (2013), widowhood induces the need to find and adjust to a new rhythm of life and to other routines. Thus, routinization could be less important among widowed persons. Consistently, living as a couple leads to more daily routines. Another result may appear counterintuitive—in particular, that men have more preferences for routines than women. This result could be however understood in the light of the hypothesis of gender differences in social roles as described by Eagly (1987). Indeed, the preference for routines in domestic and daily living activities could be associated with the rhythms and constraints of a man’s traditional social role which is more aligned with work and social environments. These specificities should be better studied in further research. More generally, it would be important in the future to pay more attention to past life experiences and their impact on routines. For example, it could be readily assumed that childhood/midlife stress as a factor of psychological vulnerability leads to more routinization. Finally, as found by Bergua et al. (2006), age was not associated with preferences for routines here. It could be due to the characteristics of the included sample with a relatively high average age. A selection bias cannot be excluded given that the most vulnerable older adults may have tended to decline participation.
This last point is one of the main limitations of the present study. The reasons related to the noncompletion of the scale were mainly associated with age, educational level, and dementia. Therefore, we cannot exclude a selection bias associated with an underestimation of routinization in our study sample even if it is based on two cohort studies that are representative of the general older adult population. For the AMI cohort, the missing data for the most vulnerable individuals can be explained by the way the PRS is administered as a self-administered questionnaire. For the PAQUID study, they can be mainly explained by the proposal of the PRS at the end of the interview, after many other tests and questionnaires have been completed. Moreover, persons suffering from severe dementia were not able to complete this type of scale. The norms should therefore be used with precaution, particularly in the oldest persons, those with the lowest educational level, and those with a dementia diagnosis. Despite these limitations, the feasibility and relevance of the PRS-S are improved, compared to the original version. The scale could be more easily added as part of a clinical or research interview.
In conclusion, the level of preferences for routines appears to be an interesting marker for understanding vulnerability and daily functioning in the elderly. The validation of this PRS-S scale will contribute to consider the elders’ routines not only in clinical practice but also in epidemiologic research contexts.
Supplemental Material
Supplementary Material 1 - Supplemental material for Validation of Short Form of Preferences for Routines Scale: Norms in Older Adults
Supplemental material, Supplementary Material 1, for Validation of Short Form of Preferences for Routines Scale: Norms in Older Adults by Valérie Bergua, Arlette Edjolo, Jean Bouisson, Celine Meillon, Karine Pérès and Hélène Amieva in The International Journal of Aging and Human Development
Supplemental Material
Table S1 - Supplemental material for Validation of Short Form of Preferences for Routines Scale: Norms in Older Adults
Supplemental material, Table S1, for Validation of Short Form of Preferences for Routines Scale: Norms in Older Adults by Valérie Bergua, Arlette Edjolo, Jean Bouisson, Celine Meillon, Karine Pérès and Hélène Amieva in The International Journal of Aging and Human Development
Supplemental Material
Figure S1 - Supplemental material for Validation of Short Form of Preferences for Routines Scale: Norms in Older Adults
Supplemental material, Figure S1, for Validation of Short Form of Preferences for Routines Scale: Norms in Older Adults by Valérie Bergua, Arlette Edjolo, Jean Bouisson, Celine Meillon, Karine Pérès and Hélène Amieva in The International Journal of Aging and Human Development
Footnotes
Author Contributions
VB: all aspects of the study; AE, CM: statistical design and statistical analyses. JB, KP: revision of the manuscript and contribution to its content and to interpretation of data. KP: coordinator of the AMI study and data collection. HA: supervision of data interpretation and manuscript preparation.
Declaration of Conflicting Interests
The author(s) declared no potential conflicts of interest with respect to the research, authorship, and/or publication of this article.
Funding
The author(s) disclosed receipt of the following financial support for the research, authorship, and/or publication of this article: The AMI project was funded by AGRICA (CAMARCA, CRCCA, CCPMA PREVOYANCE, CPCEA, AGRI PREVOYANCE), la Mutualité Sociale Agricole (MSA) de Gironde, la Caisse Centrale de la Mutualité Sociale Agricole (CCMSA).The PAQUID study was supported by ARMA (Bordeaux), Caisse Nationale d’Assurance Maladie des Travailleurs Salariés, Conseil Général de la Dordogne, Conseil Général de la Gironde, Conseil Régional d’Aquitaine, Fondation de France, France Alzheimer (Paris), GIS Longévité, Institut National de la Santé et de la Recherche Médicale, Mutuelle Générale de l’Education Nationale, Mutualité Sociale Agricole, Novartis Pharma (France), and SCORInsurance (France).

Author Biographies
References
Supplementary Material
Please find the following supplemental material available below.
For Open Access articles published under a Creative Commons License, all supplemental material carries the same license as the article it is associated with.
For non-Open Access articles published, all supplemental material carries a non-exclusive license, and permission requests for re-use of supplemental material or any part of supplemental material shall be sent directly to the copyright owner as specified in the copyright notice associated with the article.
