



Abstract
This study investigates the psychometric properties of the Meaningful Activity Participation Assessment-Meaning (MAPA-M) scale using the Rasch measurement model. For the psychometric properties of MAPA-M, principal component analysis, Rasch analysis, and differential item functioning analysis were conducted. Participants in this study were 480 older adults from the USC Well Elderly 2 study, recruited from 21 locations in the Los Angeles metropolitan area. There were eight items with DIF, but they were accepted because they assumed unidimensionality and showed good person invariance. The 25 items assuming unidimensionality of MAPA-M had values between 0.6 and 1.4 in infit and Outfit MnSq, and all ZSTD values were less than 2.0. The 25 items demonstrated a conceptual item-difficulty hierarchy. The person strata value was 2.68, which is equivalent to a reliability index value of .76. The findings indicate that the revised scale can accurately and reliably measure meaningful activities by older adults.
The performance of meaningful activities improves individuals’ emotional and physical health and quality of life (Eakman et al., 2010; Pergolotti et al., 2015). These meaningful activities affect health in many ways. According to a study by Goldberg et al. (2002), participation in meaningful activities was related to overall satisfaction with life, in part due to the capacity of the activities to provide the experience of competence, mastery, and value within a social group. Pergolotti et al. (2015) noted that meaningful activity factors are also important in the treatment of older adults with cancer, beyond clinical and demographic factors. Similarly, Roland and Chappell (2015) noted that meaningful activities can benefit older adults because they offer a sense of pleasure, connection with others, and autonomy. If these meaningful activities are evaluated before treatment, it will help to establish treatment goals and plans.
One of the few available tools for measuring meaningful activities is the meaningful activity participation assessment (Eakman et al., 2010). The MAPA consists of a sub-scale of Meaningful Activity Participation Assessment-Frequency (MAPA-F), which indicates the frequency of meaningful activities, and Meaningful Activity Participation Assessment-Meaningfulness (MAPA-M), a quantitative assessment of the significance of the presented activities. The test items of the MAPA-M consist of a 6-point scale (Clark, 2013). The MAPA-M is a self-reported outcome measure that assesses the personal importance of the activities the individual has engaged in over the past few months. The instrument showed good reliability (Cronbach's α = .86) for older adults (Eakman, 2007).
Early in its development, the MAPA was studied to determine whether a larger number of test items could increase its usefulness in predicting health and well-being (Eakman, 2007). In addition, Eakman (2007) performed principal component analysis on the MAPA-F and MAPA-M scales and demonstrated numerous components (n = 10 in the MAPA-F and n = 9 in the MAPA-M). A consecutive study examined the reliability and validity of the instrument based on classical test theory approaches (Eakman et al., 2010). The study findings revealed that the test–retest reliability was .84, and the internal consistency of the MAPA-M scale was .85. However, to the best of our knowledge, there are no studies that examine the item difficulty hierarchy or item fit of the instrument. Given that the factor structure of the scale and the fitness of the test items have not been analyzed, it is unclear whether the scale consistently measures the trait to be properly measured. Rasch analysis can examine item-level psychometrics (Wright & Stone, 1979). For instance, this approach can investigate item difficulty and item fit by linking items according to the ability and item difficulty of survey respondents (Bond & Fox, 2015). Item difficulty refers to the level of each item according to an individual's ability. The same characteristics or factors are critical for legitimately comparing meaningful activities (Velozo et al., 1999). The evaluation tool developer performs several statistical procedures to ensure that the evaluation items are appropriate for all respondents (Camilli & Penfield, 1997; Holland & Wainer, 2012). The statistical procedure aims to identify items with different statistical characteristics in a specific group of respondents. This indicates differential item functioning (DIF). These items are said to function differentially between groups, which are potential indicators of item bias (Sireci & Rios, 2013).
Our research question was to examine the item-level psychometric properties of the MAPA-M and check if this instrument can be utilized as a clinical assessment tool. Therefore, the purpose of this study was to investigate the measurement construct and psychometric properties (i.e., item fit statistics, item difficulty hierarchy, person reliability, and differential item functioning) using the Rasch model.
Method
Design and Participants
The data examined in this cross-sectional study included 29 items of the MAPA-M used in the initial evaluation of the USC Well Elderly 2 study (Clark, 2013). The USC Well Elderly 2 study was conducted to determine the effects of occupational therapy interventions that promote a preventive lifestyle on mental and physical health and cognitive function in older adults. Participants consisted of men and women aged 60 to 95 years, recruited from 21 locations in Los Angeles. The present study extracted 480 survey participants who completed the baseline assessments of the MAPA-M from the USC Well Elderly 2 study. More information about the USC Well Elderly 2 study can be found on the website (https://www.icpsr.umich.edu/web/NACDA/studies/33641?sortBy=5). This study was approved by the Institutional Review Board of the authors (1041849-202102-SB-023-02).
Outcome Measures
The MAPA-M consists of 29 items and is a checklist-type survey that checks the degree of meaning for the individual (Clark, 2013), such as house chores, driving, and hobbies (Table 1). The test items consist of a 6-point Likert scale (1 = I do not do this, 2 = not at all meaningful, 3 = somewhat meaningful, 4 = moderately meaningful, 5 = very meaningful, 6 = extremely meaningful). However, there were no responses in the rating categories of 5 and 6 in the study database. Response category 1 was removed because it indicates that the activity item was not performed and the responses in this response category could bias the rating scale structure. Therefore, in this study, only responses of 2 (not at all meaningful), 3 (somewhat meaningful), and 4 (moderately meaningful) were selected and analyzed.
MAPA: Meaningful Activity Participation Assessment.

Note. Response choices (1—I do not do this; 2—Not at all meaningful; 3—Somewhat meaningful; 4—Moderately meaningful; 5—Very meaningful; 6—Extremely meaningful); range of scores: 0–116. Source. https://www.icpsr.umich.edu/web/ICPSR/studies/33641#.
Data Analysis
The psychometric properties of the MAPA-M were investigated using the Rasch analysis. First, we examined the unidimensionality assumption of the 29 test items using principal component analysis (PCA). We conducted a rating scale analysis to examine the rating scale structure. In addition, fit statistics, person reliability (internal consistency), and item difficulty hierarchy were investigated to examine the item-level psychometric characteristics of the scale (Wright & Stone, 1979). Item invariance according to demographics was examined using differential item functioning (DIF) for the age group (less than 76 years old versus older than 76 years old) and gender (male versus female).
Unidimensionality
The unidimensionality of the MAPA-M items was examined using PCA. An eigenvalue of the first contrast of less than 2.0, was considered as a cutoff for unidimensionality (Linacre, 2017). Yen's Q3 statistics was used to examine local independence, and a residual correlation greater than.2 was considered a violation of the local independence assumption (Linacre, 2017). We assumed that the test items would be unidimensional.
Rating Scale Analysis
The rating scale was measured using the following criteria: (a) at least 10 observations in each response category, (b) average measures increase monotonically with category (e.g., the measure estimation in the second category is higher than that in the first category), (c) outfit mean-square values less than 2.0, and (d) investigate whether the frequency of category use is irregular because of step disordering through step calibrations (Linacre, 2002).
Item Fit Statistics
The item fit of the MAPA-M was examined using fit statistics from the Rasch analysis. Rasch measurement can determine whether each item “fits” the singular dimension in an instrument (Bond & Fox, 2015). The fit of an item includes a mean square (MnSq) value between 0.6 and 1.4, and a standardized scores (ZSTD) value less than 2.0 (Wright, 1994). Misfit items outside the MnSq and ZSTD values were removed.
Differential Item Functioning
DIF is a comparison of estimates for different traits (e.g., gender, age, employment status, and race) (Bond & Fox, 2015). In this study, the DIF analysis for gender and age was conducted under the hypothesis that there was no difference in item difficulty for the two characteristics. This magnitude of the difference was examined using DIF contrast (moderate to large DIF > 0.64 logits; slight to moderate DIF as between 0.43 and 0.64 logits; negligible DIF < 0.43 logits) (Zwick et al., 1999), and its significance was examined using the Rasch–Welch probability (<.05) (Linacre, 2017).
Item-Sample Targeting and Reliability
Item fit through Rasch analysis provides a basis for how accurately it can be measured for the variable of interest. Similarly, targeting provides a basis for precision when measuring the variable of interest. In other words, targeting visually shows the item difficulty hierarchy along with the sample's person ability levels. For such targeting, a person-item map (Wright map) can be used to visually analyze whether the item difficulty range matches the person's ability range.
To determine reliability, this study examined the separation reliability coefficient of the Rasch model. Separation reliability coefficients represent the precision of variance of the distribution of measures that can be attributed to differences between that person measure and item difficulty (Bond & Fox, 2015). A reliability of .90 indicates four strata of person groups (Fisher, 1992). In addition, floor and ceiling effects were considered if the maximum and minimum extreme scores were greater than 5.0% (Fisher, 2007).
Data on the participants’ demographic characteristics were analyzed using SAS version 9.4 (SAS Institute, Cary, NC). Rasch analysis was performed using Winsteps 4.7.1.0 (Linacre, Beaverton, OR).
Results
There were 480 participants in the study database, with an average age of 74.31 years (standard deviation [SD] = 7.6). There were 165 men (34.4%) and 315 women (65.6%). Races included Caucasians (180, 37.5%), African-Americans (155, 32.3%), Hispanic/Latino 97 (20.2%), Asian (19, 4.0%), and other (27, 5.6%) (Table 2).
Demographics of the Study Sample (N = 480).

Source. USC Well Elderly 2 study.
Unidimensionality
The PCA revealed that the test items met the unidimensionality assumption. Approximately 33.30% of the total variance in the items was explained by one dimension, with no critical unexplained variance remaining in the first contrast (eigenvalue = 1.96) (Table 3). Residual correlations were 0.21 for item 2 (crafts/hobbies), 0.53 for item 13 (other computer use), 0.21 for item 16 (personal finances), and 0.23 for item 21 (special events or cultural activities), showing local dependence. We removed those four items showing local dependence and conducted Rasch analysis using the remaining 25 items (Table 4).
PCA Model Fit.

Note. Unexplained variance in 1st contrast = less than 2.
Residual Correlations (Local Independence).

Note. Residual correlations (<0.2).
Rating Scale Analysis
The MAPA-M with the three response categories had more than 10 observed counts in each response category. The average of the MAPA-M category measures increased continuously from −2.16 to 2.16, showing that the thresholds were aligned. In addition, the outfit MnSq for all categories was less than 2.0. Finally, step calibrations were investigated and showed values of −.96 and +.96 (Table 5).
The Revised MAPA-M Rating Scale.

Item Fit Statistics
The 25 items with the assumed unidimensionality of MAPA-M had values from 0.6 to 1.4 in infit and outfit MnSq. In addition, all ZSTD values were less than 2.0 (Table 6).
Item Fit and Item Difficulty Hierarchy met the Unidimensionality Assumption (25 Items).

Note. SE = standard error, MnSq = mean square, ZSTD = standardized z-statistics.
Differential Item Functioning
Among the 25 MAPA-M items in the gender group (male vs. female), six items with significant values are as follows: item 3 (computer use for email), item 8 (homemaking/home maintenance), item 10 (musical activities), item 15 (pet care activities), item 17 (using public transportation), and item 25 (sexual or intimate activities) (Rasch–Welch probability <.05). In addition, in the age group (76/76+), item 3 (club/organization or volunteer activities), and 14 (physical activities or exercise) had significant values (Rasch–Welch probability <.05). However, the PCA results indicated that eight DIF items showed a unidimensional measurement construct (eigenvalue of the first construct = 1.3). In addition, an invariance test with 95% confidence intervals for the person measures with and without eight DIF items indicated that the person measure parameters were not affected by the eight DIF items. For these reasons, the eight DIF items were not removed from MAPA-M.
Targeting and Reliability
A person-item map presents a match between the distribution of the person's ability and item difficulty (Figure 1). The values in the measure column in Table 4 represent the item difficulty hierarchy. Among the 25 items of the MAPA-M, the most meaningful item was shopping and creative activities (0.91 logits), and the least meaningful item was driving (−0.83 logits).
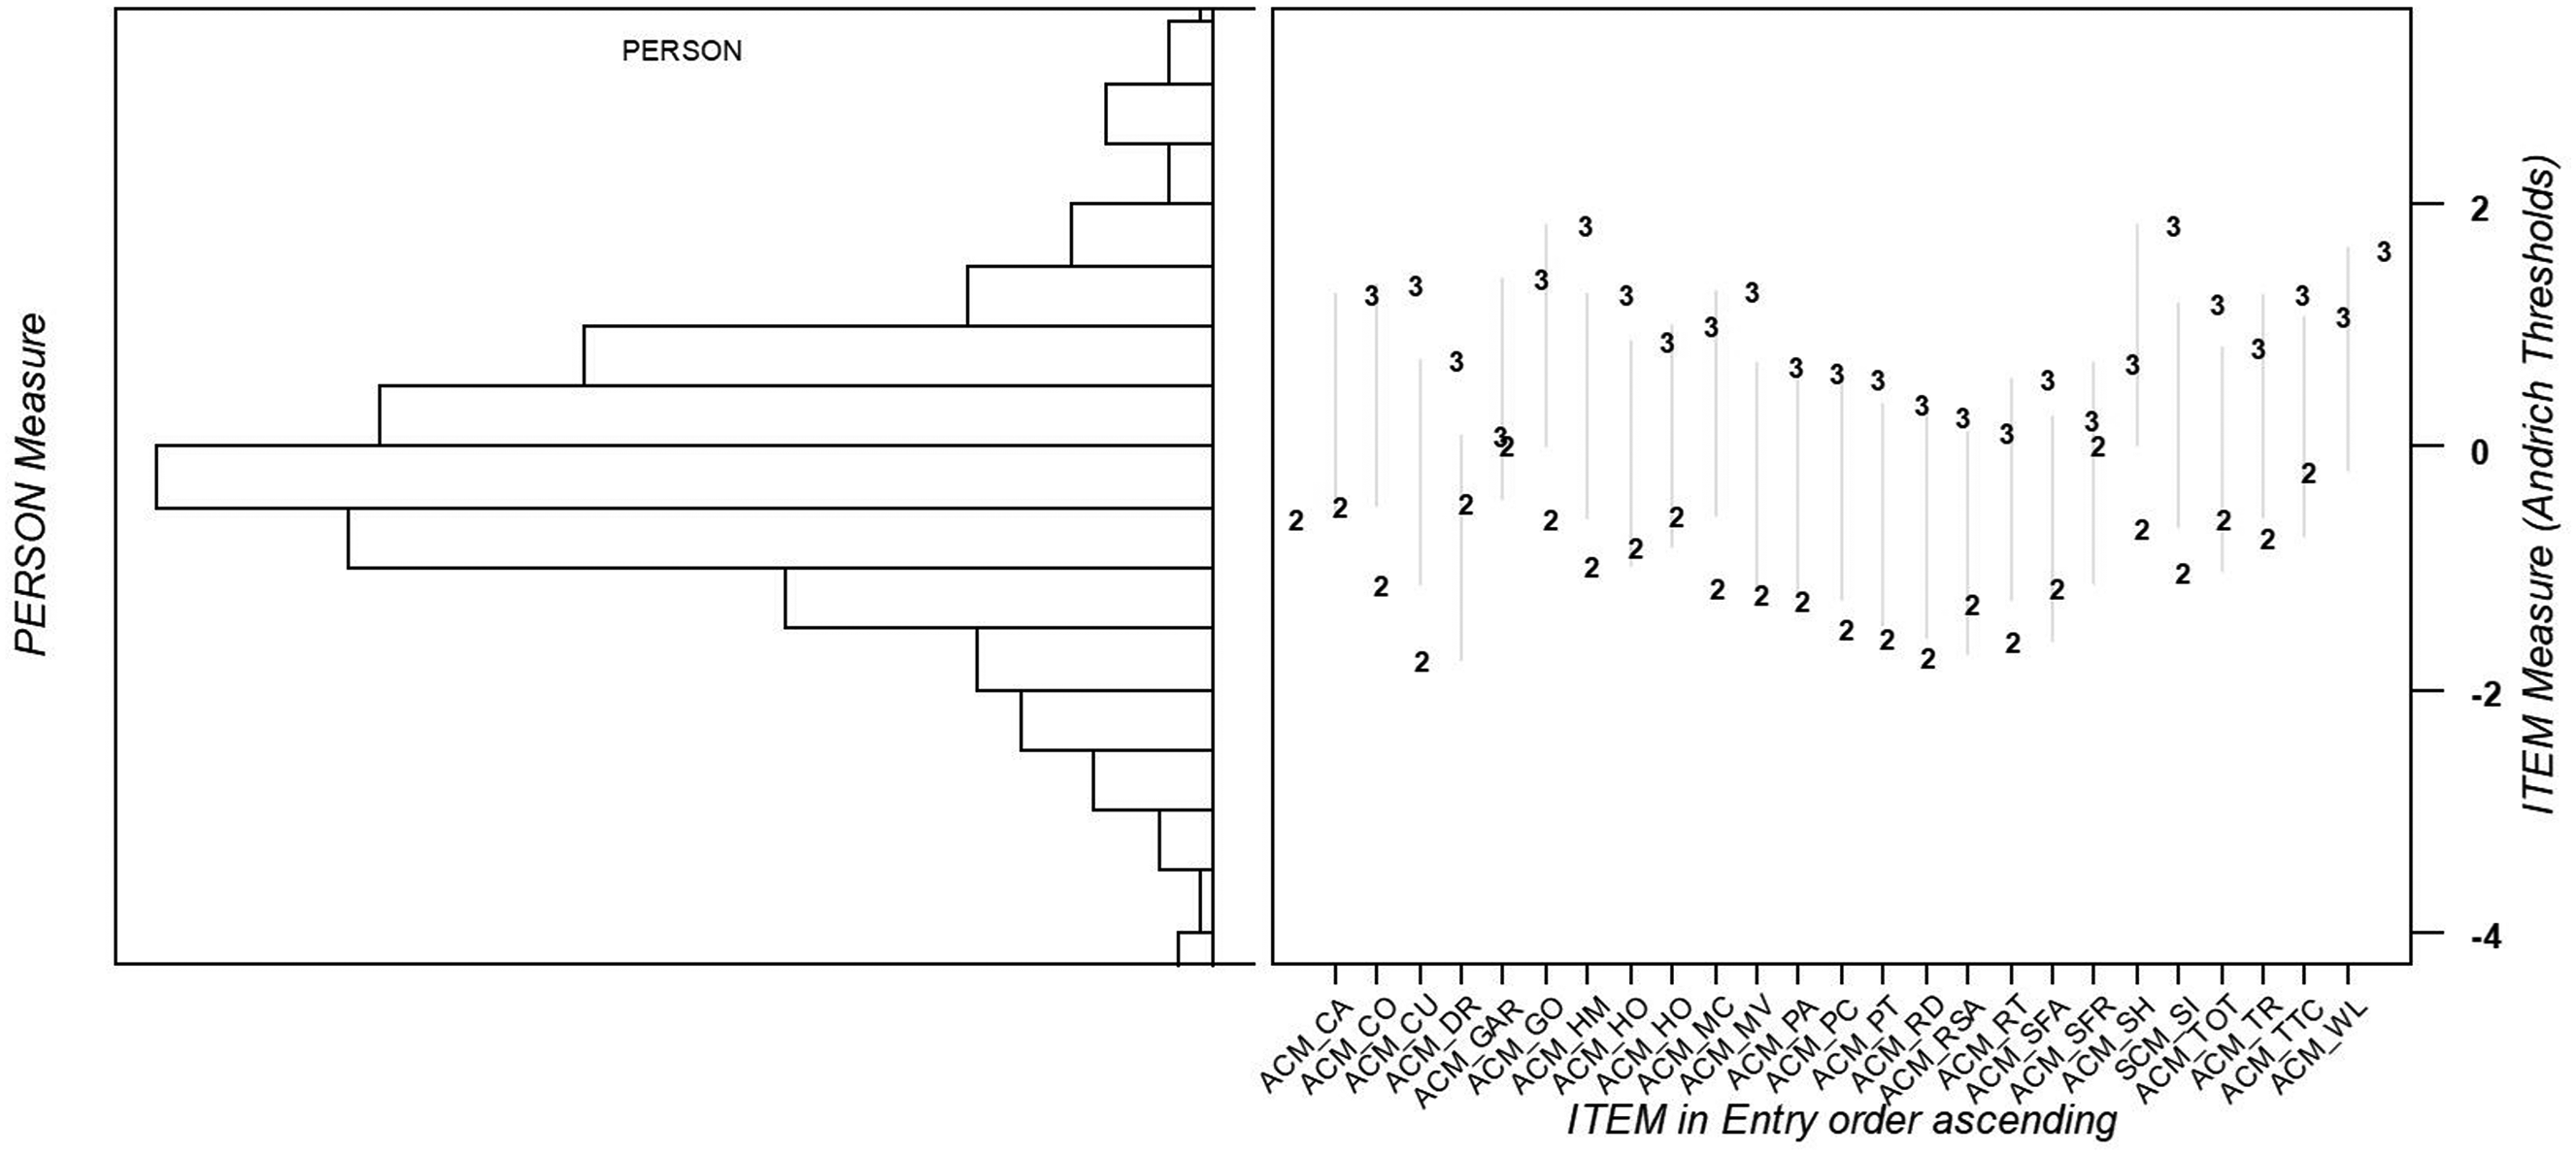
Person-item map. Graphic presentation of the relationship between person ability and item difficulty.
In the MAPA-M, the difference between the mean of person measurements (−0.24 logits, SD = 1.27) and the mean of item difficulty (0.00 logits, SD = .50) was 0.24 logits. The person reliability was.76, and the personal strata value was 2.68. In addition, the MAPA-M had no floor effect (n = 6, 1.3%) or ceiling effect (n = 2, 0.4%).
Discussion
This study examined the measurement validity of the MAPA-M for unidimensionality, rating scale, DIF, targeting, and reliability using Rasch analysis and factor analysis. There are several novel findings of this study. First, the MAPA-M assumed unidimensionality in 25 items. Second, DIF was found to exist in eight items, however, these eight items were found to be unidimensional. In addition, good person invariance was shown between 17 items, of which 8 items were removed and 25 items from which 8 items were not removed. Therefore, the MAPA-M was accepted without removing the eight items. In addition, the rating scale of the MAPA-M increased in the order in which the category threshold was expected. Finally, the 25 items showed high confidence in person measurement separation.
In this study, it was found that there was DIF according to gender. First, we show the DIF in the section on the use of computers. According to a study by Ramón-Jerónimo et al. (2013), males over 50 years old report that they spend more time on computers and use the Internet more than females over 50 years old. According to this, computer use in males may be considered slightly more meaningful compared to women in the present sample. Second, it was shown that DIF occurs during homemaking/home maintenance. Until recently, there was a higher proportion of women than men in homemaking/home maintenance (Cerrato & Cifre, 2018). In addition, because children in a family grow up watching their parents’ roles, gender-based homemaking/home maintenance continues across generations (Giménez-Nadal et al., 2019). Therefore, there is a possibility that DIF may occur depending on gender for items on home management. Third, in the case of pet care activities, people with a high attachment to pets spend a lot of time with pets but spend less time with pets when the attachment is low (Curl et al., 2017). Accordingly, pet care activities are likely to result in a DIF. Fourth, in the case of public transport use, it is predicted that there will be DIF in the measurement of meaningful activities based on the study that males are more satisfied with public transportation than females (Choo et al., 2012). Lastly, in the case of sexual or intimate activities, males are more interested in sex than females, and females are more interested in hearing lovely words (Johnson, 1996). Accordingly, sexual or intimate activities are likely to result in a DIF.
In this study, it was found that there was DIF according to age group. First, in the case of club/organization or volunteer activities, individuals who are in good health and who are not working have a high level of participation in volunteer activities (Lee et al., 2008). However, as age increases, physical function decreases due to physiological changes (Aversa et al., 2019). Accordingly, club/organization or volunteer activities may have DIF according to age group. Finally, physical activity and exercise are decreased due to a decrease in muscle strength and physical function with aging (Westbury et al., 2020). In addition, musculoskeletal disorders are common among older adults. Therefore, physical activities or exercises are likely to have DIF depending on the age group. This brief review has offered reasonable justification for the presence of item DIF in the MAPA-M found in the present study.
In this study, we investigated the hierarchy between items. The most meaningful item was shopping and going out to movies or restaurants, and the least meaningful item was driving. First, in the case of shopping, unlike in the past, offline stores can be replaced with online shopping (Lim & Kim, 2011). Online shopping has made some aspects of shopping more easily accessible and pleasurable. Also, consumers aged 65 and older watch TV for about 7 h a day and watch it more often than other age groups (Nielsen, 2016). This supports the rationale that shopping is the most meaningful item for consumers over the age of 65 to purchase daily necessities without having to move due to changes in physical and physiological functions. Second, visiting a movie or restaurant was the most meaningful activity, similar to shopping. Cultural life, such as movie or restaurant visits, is related to the leisure satisfaction of the elderly (Kwak, 2018). In addition, in the case of restaurant visits, any restaurant is researching and striving for customer satisfaction. Customer satisfaction can be increased through service quality, food quality, and cost-effectiveness ratio. According to the study by Fu and Parks (2001), friendly service and individual attention, rather than tangible aspects of service, affect the satisfaction of elderly customers. Therefore, in the case of elderly customers who use the restaurant, satisfaction with the service and food provided by the restaurant will be high, which can be regarded as a meaningful activity for visiting the restaurant. Lastly, it is probably a more meaningful activity because people can (a) have opportunities to interact/ connect with others and (b) have an opportunity to get out of the house. Finally, driving is an important part of most people's lives and provides access to social and professional activities. However, driving is known as a stressful activity and causes several physiological changes in the body, including activation of the sympathetic nervous system, increased blood pressure, and increased heart rate (Parsons et al., 1998). In addition, Hong et al. (2016) reported that driving skills gradually decreased with age. Therefore, this can support the rationale for the result that the driving item is the least meaningful activity because it can cause anxiety, fear, and decreased driving ability in the elderly. As such, the activities that are “most meaningful” and “least meaningful” may differ depending on the importance of the activity of an individual (Juang et al., 2017).
This study had several limitations. First, because the Well Elderly 2 study data were used, the participants were limited to older adults. If the participant target is broadly included as a young or adult target, the item hierarchy analysis may differ according to physical ability. Therefore, future studies with different age groups are required to assess the item-level psychometrics of the scale more accurately. Second, none of the study subjects rated any of the test items in the categories of 5 (very meaningful) and 6 (extremely meaningful). While we had to collapse those categories to conduct Rasch analysis, these modifications would not be clinically adequate for an assessment instrument. This could be due to the generic floor effects in this older adult sample, which could also result in misfitting items, and also the generic issue of the secondary data analysis. Similarly, we removed the response in Category 1 “I do not do this” because this response pattern would not contribute to the latent trait of meaningfulness. However, this modification introduces a potential bias for the rating scale structure. A prospective study with a wide range of age groups and a sensitivity analysis with and without Category 1 should be conducted to examine this measurement issue. Third, while the Rasch measurement model has been widely used to validate the psychometric structure of patient-reported outcome measures, especially in rehabilitation, the interpretation of the item difficulty parameter would be clinically challenging. For instance, the conceptualization and application of the Rasch model are centered around “person ability” and “item difficulty.” The MAPA-M consists of individuals’ “subjective” ratings of the degree to which each activity is considered meaningful to them. Such subjective ratings on the meaningfulness of activities differ from one's perceived ability to perform the activities in that the former does not always mathematically form a logical, hierarchical pattern along with the continuum of person ability and item difficulty. For example, one can easily say “driving” is more difficult than “radio/TV” for an older adult; that is, the older adult has to demonstrate a higher level of “person ability” to perform such more difficult items (driving). However, no one can really say “driving” is always more meaningful than “radio/TV” for older adults or vice versa, regardless of their personal ability. Unlike ability traits, variables, such as personal preference or meaningfulness, usually do not easily fall into a collective pattern for a mathematically predictive model. Nonetheless, findings from the present study offer evidence that differing types of activities may be distinguishable based upon their relative levels of perceived meaningfulness. Finally, MAPA-F measures the frequency of activities. In some cases, clients may rate exercise as their frequently engaged activities on the MAPA-F, but they lose the opportunity to rate how meaningful the activities are. Future studies should examine the association between actual performance and the rating of the meaningfulness of the test items.
Conclusion
We found 25 appropriate item-level psychometric properties of the 29-item MAPA. These results suggest that meaningful activities can be measured using 25 items instead of 29 items.
Footnotes
Declaration of Conflicting Interests
The author(s) declared no potential conflicts of interest with respect to the research, authorship, and/or publication of this article.
Funding
The author(s) disclosed receipt of the following financial support for the research, authorship, and/or publication of this article: This work was supported by the Ministry of Education of the Republic of Korea and the National Research Foundation of Korea (NRF-2021S1A3A2A02096338)
