
Abstract
This study examined whether the identified latent classes of structural and cognitive social capital are differently associated with depression trajectories in older Korean adults. From the five waves (2006, 2009, 2012, 2015, and 2018) of the Korean Welfare Panel Study, 3,606 participants aged ≥65 were analyzed. The latent class analysis identifies structural and cognitive social capital subgroups. Latent growth curve analysis examined the latent classes’ effect on depression trajectories. Three classes were identified: medium-structural and high-cognitive (Class 1), high-structural and cognitive (Class 2), and low-structural and cognitive (Class 3). Classes 1 and 2 showed lower depression at baseline; however, the trajectory change rate was opposite than Class 3. Compared to Classes 1 and 2, depression was highest at baseline but with a slower change rate in Class 3. Therefore, it is important to identify older adults’ structural and cognitive social capital classes to depression trajectories.
Keywords
Depression is one of the most disturbing health concerns among older adults worldwide, including in South Korea (hereafter, Korea). The global prevalence of depression among older adults is 5.7%, which is higher than the estimated prevalence of 3.8% of the entire population (WHO, 2021). There has been a substantial increase in depression among older adults in Korea since 2010; as of 2018, of the total population diagnosed with depression, one-third were aged 65 and above (Health Insurance Review & Assessment Service, 2020). Among the Organization for Economic Cooperation and Development (OECD) countries, Korea ranks the highest in older adult suicide rates: 2.7 times higher than the average (OECD, 2022b). As depression is a well-known risk factor for suicide, with increasing depression in older adults, the rapidly aging population in Korea is cause for concern. Older adults aged 65 years and above account for 17.5% of the total population in Korea, and the country is poised to deal with a post-aged society by 2025 (Statistics Korea, 2022).
Multiple factors influence the onset of depression in older adults, including socioeconomic status (SES) and poverty (Cheung & Chou, 2019; Freeman et al., 2016; Ng et al., 2014; Park & Seo, 2021; Zhou et al., 2021). Korea's exceptional economic growth has been accompanied by an increase in socioeconomic inequality, with the majority of older adults remaining at a low SES (Fields & Yoo, 2000). For years, low SES and its correlates, such as poverty, have been the main concerns regarding older Korean adults. The poverty rate of older adults was the fourth highest among the OECD countries in 2021, and almost half of older adults in Korea live in poverty (OECD, 2022a).
In addition to low SES and poverty, social isolation is another determinant of depressive symptoms in older adults. One in five older adults in Korea lives alone (Statistics Korea, 2022), and they express their sense of loneliness as being alienated from society (Kim et al., 2021). Being socially isolated and expressing feelings of loneliness are risk factors that increase depressive symptoms among older adults (Kim et al., 2021).
In the growing body of research on factors related to depression in older adults, studies have shown that social capital has a profound effect on depression (Amegbor et al., 2020; Bae & Kim, 2020; Ehsan et al., 2021; Forsman et al., 2012; Kim, 2015; Kim & Kim, 2018). Social capital is a set of shared norms, values, attitudes, and beliefs acquired through social relationships and networks among individuals (Putnam, 1993). Studies suggest that social capital is a prominent determinant of health and also contributes to reducing symptoms of depression in older adults (Amegbor et al., 2020; Bae & Kim, 2020; Kim, 2015; Kim & Kim, 2018; Park et al., 2018). Although an extensive body of research has identified the effect of social capital on depression in older adults, it has rarely assessed the multidimensional concept of social capital (Lee, 2019; Yun & Bae, 2020) or its effect on depression. The concept of social capital is multifaceted, encompassing both tangible and intangible sources that individuals or groups possess through their social networks. These resources comprise several structural and cognitive components, such as social ties and tangible resources (structural), as well as trust, reciprocity, and mutual relationships (cognitive). These components interact to create social capital, which can be utilized to achieve personal or collective goals (Ehsan et al., 2021; Ester & Ichiro, 2015). However, a limited number of studies have examined the two-dimensional perspectives of social capital and its association with depression, and those that did have produced mixed results. De Silva et al. (2005) point out that higher cognitive social capital is associated with improved mental health, whereas higher structural social capital often aggravates mental health symptoms. Low structural and cognitive social capital have been found to increase the likelihood of depression in older adults (Forsman et al., 2012; Lee, 2019; Yun & Bae, 2020). These inconsistent results could be due to the heterogeneous characteristics of social capital among older adults. Thus, identifying homogeneous subgroups based on multidimensional characteristics of social capital among older adults can serve as an alternative method to study the effect of social capital on depression.
The latent class is a method used to classify a heterogeneous population into mutually exclusive and homogeneous subgroups based on the observed patterns of individuals (Geiser, 2013). It is an effective technique for identifying groups of people who share common profiles of structural and cognitive social capital. Previous studies (Lee, 2020; Park, 2017) failed to propose comprehensive indicators of structural and cognitive social capital when identifying latent social capital classes. To the best of our knowledge, none of these studies have included structural and cognitive social capital factors simultaneously to identify unknown latent classes of older adults in Korea. Additionally, previous studies in Korea have mostly focused on the relationship between social capital and depressive symptoms based on a cross-sectional design without considering the latent classes observed in older adults.
Therefore, this study aimed to bridge this gap by identifying latent classes among older adults based on structural and cognitive social capital components and examining latent class heterogeneities in terms of depressive symptoms. Further, in contrast to the cross-sectional design of previous studies, latent growth curve analysis was applied to interpret the causal relationship between social capital subgroups and depression trajectories after adjusting for potential confounders such as SES. This study addresses the following specific research questions: (1) How do structural and cognitive social capital differ by latent class membership of older adults? (2) What are the differences in SES between the latent class? (3) How does older adults’ latent class membership influence their depression trajectories?
Theoretical Background
Social Capital Theory
Social capital is defined as a social network built within individuals based on mutual trust, reciprocity, and the common good (Coleman, 1988). According to Putnam (1995), social capital is a feature of social organizations, for example, networks, norms, and social trust, that facilitates coordination and cooperation for mutual benefit. Bourdieu (1986) also defined social capital as the sum of benefits or opportunities individuals and groups obtain through the institutionalization of actual or imagined emotional or mutual cognitive relationships or through continuous networks. It is not only a collection of informal values or norms shared within groups or organizations (Fukuyama, 2000) but also a property that can more effectively promote people's behavior through trust or mutual obligations between people, groups, and communities (Harpham, 2002).
Social capital is composed of structural and cognitive social capital. Structural social capital refers to the observable aspects of social capital, which involves the actual number of social interactions among individuals, groups, or communities (Harpham, 2002). In other words, structural social capital refers to the number of social networks, relationships, and memberships linking individuals and groups (Ehsan et al., 2021). Second, cognitive social capital refers to the subjective evaluation of social interactions such as bonding with others, perceived social support, values, norms, trust, altruism, and reciprocity (De Silva et al., 2005; Ehsan et al., 2021; Harpham 2008).
Social Capital and Depression
The relationships between social capital and depression can differ in two aspects: structural social capital and cognitive social capital. First, structural social capital can play either a positive or negative role, depending on the specific circumstances that people encounter. For instance, older adults who maintain more social contact with neighbors are less likely to be depressed (Kelley-Moore et al., 2016). Individual participants in Swiss community-based interventions aiming to empower older adults to participate in their community activities were significantly associated with fewer depressive symptoms (Ehsan et al., 2021). In contrast, infrequent social contact with friends and neighbors among older adults in Sweden and Finland was significantly associated with a greater risk of depression (Forsman et al., 2012). Thus, two opposing results regarding the relationship between structural social capital and depression were found. Contradicting results have been found regarding the association between social participation and depression among older adults. Some studies show no association, while others indicate that social participation is a protective factor (Bassett & Moore, 2013; Chiao et al., 2011; Fujiwara & Kawachi, 2008).
Unlike structural social capital, prior studies have consistently shown that cognitive social capital has a stronger protective effect against depression (Bassett & Moore, 2013; De Silva et al., 2005). For example, a study of older adults in Sweden and Finland revealed that cognitive social capital was significantly associated with the odds of having depression, indicating that lower interpersonal trust in friends and neighbors was significantly related to a higher odds ratio of being depressed (Forsman et al., 2012). A study in Korea found that higher satisfaction with social relationships increased trust, which in turn buffered the negative impact of depression on suicidal ideation among older adults (Bae & Kim, 2020). Yun and Bae (2020) found that cognitive social capital, such as satisfaction with social relationships and trust, is a significant determinant of mental health.
In contrast to its positive impact on life satisfaction among older adults in residential care facilities, cognitive social capital, including trust and reciprocity, was found to have a significant negative impact on depression (Lee, 2019). A study in Korea showed that lower levels of community trust and norms were significantly associated with higher depressive symptoms; however, community participation was not necessarily a predictor of depressive symptoms among community-dwelling older adults (Park et al., 2018). Cognitive social capital, mediated by depressive symptoms, was also found to be significantly associated with suicidal ideation in older adults. In other words, higher levels of trust, reciprocity, and social relationships are significantly associated with lower levels of depressive symptoms, which in turn reduce suicidal ideation in older adults (Kim & Kim, 2018).
Cognitive social capital also influences the relationship between structural social capital and depression. For instance, the relationship between structural social capital and depression was found to be significantly mediated by cognitive social capital in a study of older Chinese adults, indicating that structural social capital, such as social participation, reduces depressive symptoms by promoting cognitive social capital such as trust and reciprocity (Lu & Peng, 2019).
Taken together, previous studies clearly show that higher levels of social capital are negatively associated with depressive symptoms in older adults; however, the results are inconsistent when social capital is divided into structural and cognitive aspects. For instance, although older adults have higher levels of structural social capital, including frequent contact with family, friends, and neighbors, they may have lower levels of cognitive social capital, indicating that they are less likely to trust or help others. Therefore, this study aimed to identify the unique patterns of latent classes based on Korean older adults’ structural and cognitive social capital and their relationship with depression trajectories. Based on the extant literature, the research model of this study is illustrated in Figure 1.

Research model of the study.
Methods
Data
Data from the Korean Welfare Panel Study Data (KOWEPS) were used to identify the latent classes of older adults in terms of structural and cognitive social capital levels. The KOWEPS was conducted by the Korea Institute for Health and Social Affairs in conjunction with the Social Welfare Research Institute of Seoul National University. A nationally representative sample of Korean households was selected using stratified, multistage probability sampling. The first wave of KOWEPS was conducted in 2006, including 18,856 individuals from 7,072 households, and data were collected annually using the computer-assisted personal interviewing method. KOWEPS covers various topics related to social service needs, healthcare utilization, physical and mental health, health behaviors, and socioeconomic information. For the current study, data of 3,771 older adults aged 65 years and older were selected in 2006 (Wave 1) and monitored in 2009 (Wave 4), 2012 (Wave 7), 2015 (Wave 10), and 2018 (Wave 13). The final sample size was 3,606 after excluding missing cases that could not be categorized, as per the latent class in this study. This study did not require institutional review board approval because the data from KOWEPS are publicly available.
Measurement
Independent Variable
The social capital variables were divided into two dimensions: structural social capital, which is measured by the number of help from family, friends, and neighbors (0 = no, 1 = more than once). The number of participants participating in the volunteer activities was measured dichotomously (0 = no, 1 = more than once). Cognitive social capital includes trust, reciprocity, and satisfaction with family and social relationships, which were dichotomously measured. For instance, trust was measured based on whether the respondents believed that most people were trustworthy (0 = no, 1 = yes), reciprocity was measured based on whether respondents were willing to help people in need (0 = no, 1 = yes), and satisfaction with family or social relationships was measured in a dichotomous manner (0 = not satisfied, 1 = satisfied).
Dependent Variable
Depression was measured using the short version of the Center for Epidemiologic Studies-Depression (CES-D) scale, which comprises 11 items related to depressive symptoms. The scale includes items such as, “I felt difficulty in everything I did,” “I have no appetite,” “I felt lonely,” and “I could not sleep well.” Each item is measured using a four-point Likert scale (0 = less than one day per week, 1 = 2–3 days per week, 2 = 4–5 days per week, and 3 = more than 6 days per week). For the current study, the total scores of 11 items in the CES-D scale were utilized, with higher scores indicating more depressive symptoms. The internal consistency of the CES-D scale was measured using Cronbach's alpha, and it showed consistently high reliability over time: 2006 (.89), 2009 (.86), 2012 (.85), 2015 (.89), and 2018 (.89).
Control Variables
Sociodemographic characteristics such as gender, age, education, income, and self-rated health, which can possibly influence depressive symptoms, were controlled for. Gender was coded dichotomously (0 = male, 1 = female). Age and income were entered in a raw data format. Self-rated health was measured using a five-point Likert scale (1 = very healthy to 5 = very poor).
Data Analysis
Latent Class Analysis
We used eight social capital items (four for structural social capital and four for cognitive social capital) to categorize the population into independent latent classes. Latent class analysis (LCA) was used to classify the types of social capital and to estimate the probability of being included in a specific class based on eight social capital items.
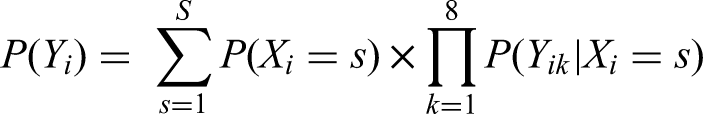
For instance, let i = 1, . . ., N denotes the respondents. For each individual, we observed the responses to eight questions, denoted by k = 1, . . ., 8. Yik = 1 if the individual responded “Yes” to question k and Yik = 0 if otherwise. An individual's response pattern was the vector Yi. We assumed a finite number of social capital classes, denoted by s = 1, . . ., S. The discrete latent variable X represents social capital class (Owen & Videras, 2009):
For the evaluation of model fit in LCA, relative model fit measures are preferred to absolute model fit using Pearson χ2 and likelihood ratio (LR) statistics because of the frequent violation of asymptotic conditions. The bootstrap LR difference test was used for the relative model fit. The bootstrap LR difference test simply compares a model with G latent classes to a model with G-1 classes. A significant p-value in the bootstrap LR difference test indicates that the model with G latent classes fits the data better. By contrast, a nonsignificant p-value indicates that a more parsimonious model (G-1 classes) is preferred (Geiser, 2013). In addition, Akaike information criteria (AIC), Bayesian information criterion (BIC), and sample-adjusted BIC (a_BIC) with smaller values indicate a better fit.
Latent Growth Curve Model
The latent growth curve model (LGM) was used to analyze interindividual (between-persons) and intraindividual (within-person) changes in depressive symptoms over time, depending on the social capital latent classes (Card et al., 2007; Preacher et al., 2008). In this study, two main parameters were estimated. First, we examined the intercept and mean of the slope of depressive symptoms, which indicate the average initial depressive symptoms and their rate of change, respectively. Second, we tested the intercept and slope variances, which indicate the interindividual variability in the initial depressive symptoms and their rates of change, respectively.
The LGM was conducted in two steps. The first was to examine the unconditional model, which represents the growth curve of depressive symptoms without the impact of social capital classes and other covariates. The second tested the conditional model, which included social capital classes and other covariates. All data analyses were conducted using Mplus 7.11 and SPSS 26 program.
Results
Table 1 summarizes the descriptive characteristics of the participants. Approximately 60% of the total sample included older women. In terms of education, the number of older adults with an elementary school degree was the highest, followed by those with no degree (35.5%), middle school degree (10.6%), high school degree (9.4%), bachelor's degree (4.1%), and college or master's degree (0.5%). Approximately half of the participants (45.2%) reported that their self-rated health condition was poor, followed by those who rated themselves as healthy (18.9%), very poor (18.3%), neutral (15.6%), and very healthy (2%). The average age of the sample was 72.8 years, ranging from a minimum of 65 years to a maximum of 103. The mean annual household income of the sample was approximately 24,920,000 won.
Characteristics of the Study Participants (N = 3,606).
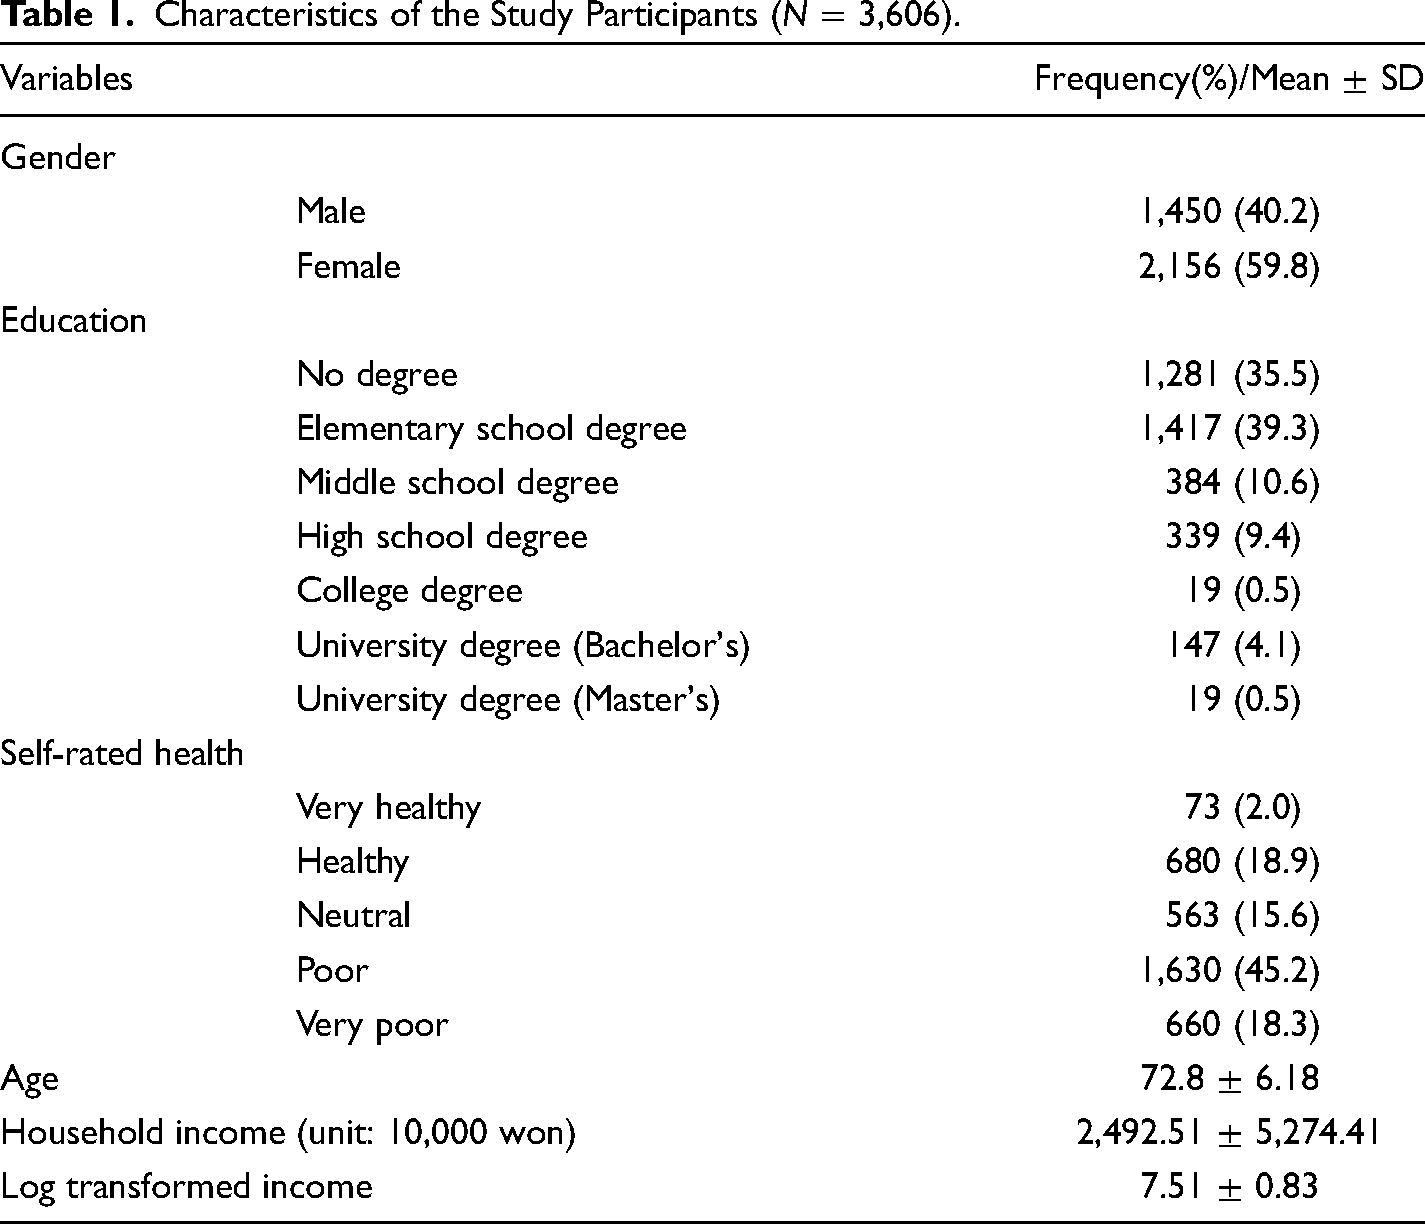
Table 2 presents the information content and entropy of the latent classes. The parametric bootstrapped likelihood ratio test (LRT) for two classes versus three classes was significant, indicating that the three-class model showed a better model fit than the two-class model. Although the LRT for three classes versus four classes was also significant, entropy showed that the three-class model was still better than the four-class model in terms of classification quality. In addition, the average latent class probabilities of the diagonal (Table 3) indicate the classification accuracy. To obtain an appropriate solution, the number of diagonals is recommended to be 0.8 and higher. The three latent class models in this study showed higher classification accuracy than the two- or four-latent class models, based on the values of entropy and average latent class probabilities. Finally, the interpretability of a solution is important for determining the best-fit LCA model (Geiser, 2013). In the current study, the four-class model showed a slightly lower value of AIC and BIC than the three-class model, whereas one of the classes in the four-class solution was difficult to interpret due to medium-size conditional response probabilities for trust items. Therefore, a three-class model was selected.
Information Content and Entropy by Latent Class.

Average Latent Class Probabilities for Most Likely Latent Class Membership by Latent Class.

Based on the three-class model, we compared the conditional response probabilities of the three latent classes. As shown in Table 4, Class 1 showed higher probabilities of help from family and volunteering but lower probabilities of help from friends and neighbors in terms of structural social capital than Class 2. On the other hand, cognitive social capital, such as reciprocity, satisfaction from family, and social relationships, was the highest compared to Classes 2 and 3. Thus, we named Class 1 the medium structural and high-cognitive groups. Class 2 showed higher levels of structural social capital, such as having help from family, friends, and neighbors, than Classes 1 and 3. The levels of cognitive social capital were higher than those of Class 3 but lower than those of Class 1, except for trust. In general, Class 2 showed higher levels of structural and cognitive social capital. Thus, we labeled it the high-structural and cognitive group. Lastly, Class 3 showed lower structural and cognitive social capital levels for all eight items (Table 4). Thus, we named Class 3 the low-structural and cognitive groups.
Conditional Response Probability by Social Capital Latent Class.

Figure 2 presents the structural and cognitive social capital patterns based on the three latent classes. In particular, significant differences in structural social capital were found in the number of help from family, friends, and neighbors. Regarding cognitive social capital, reciprocity, satisfaction with family, and social relationships differed among the three latent classes.
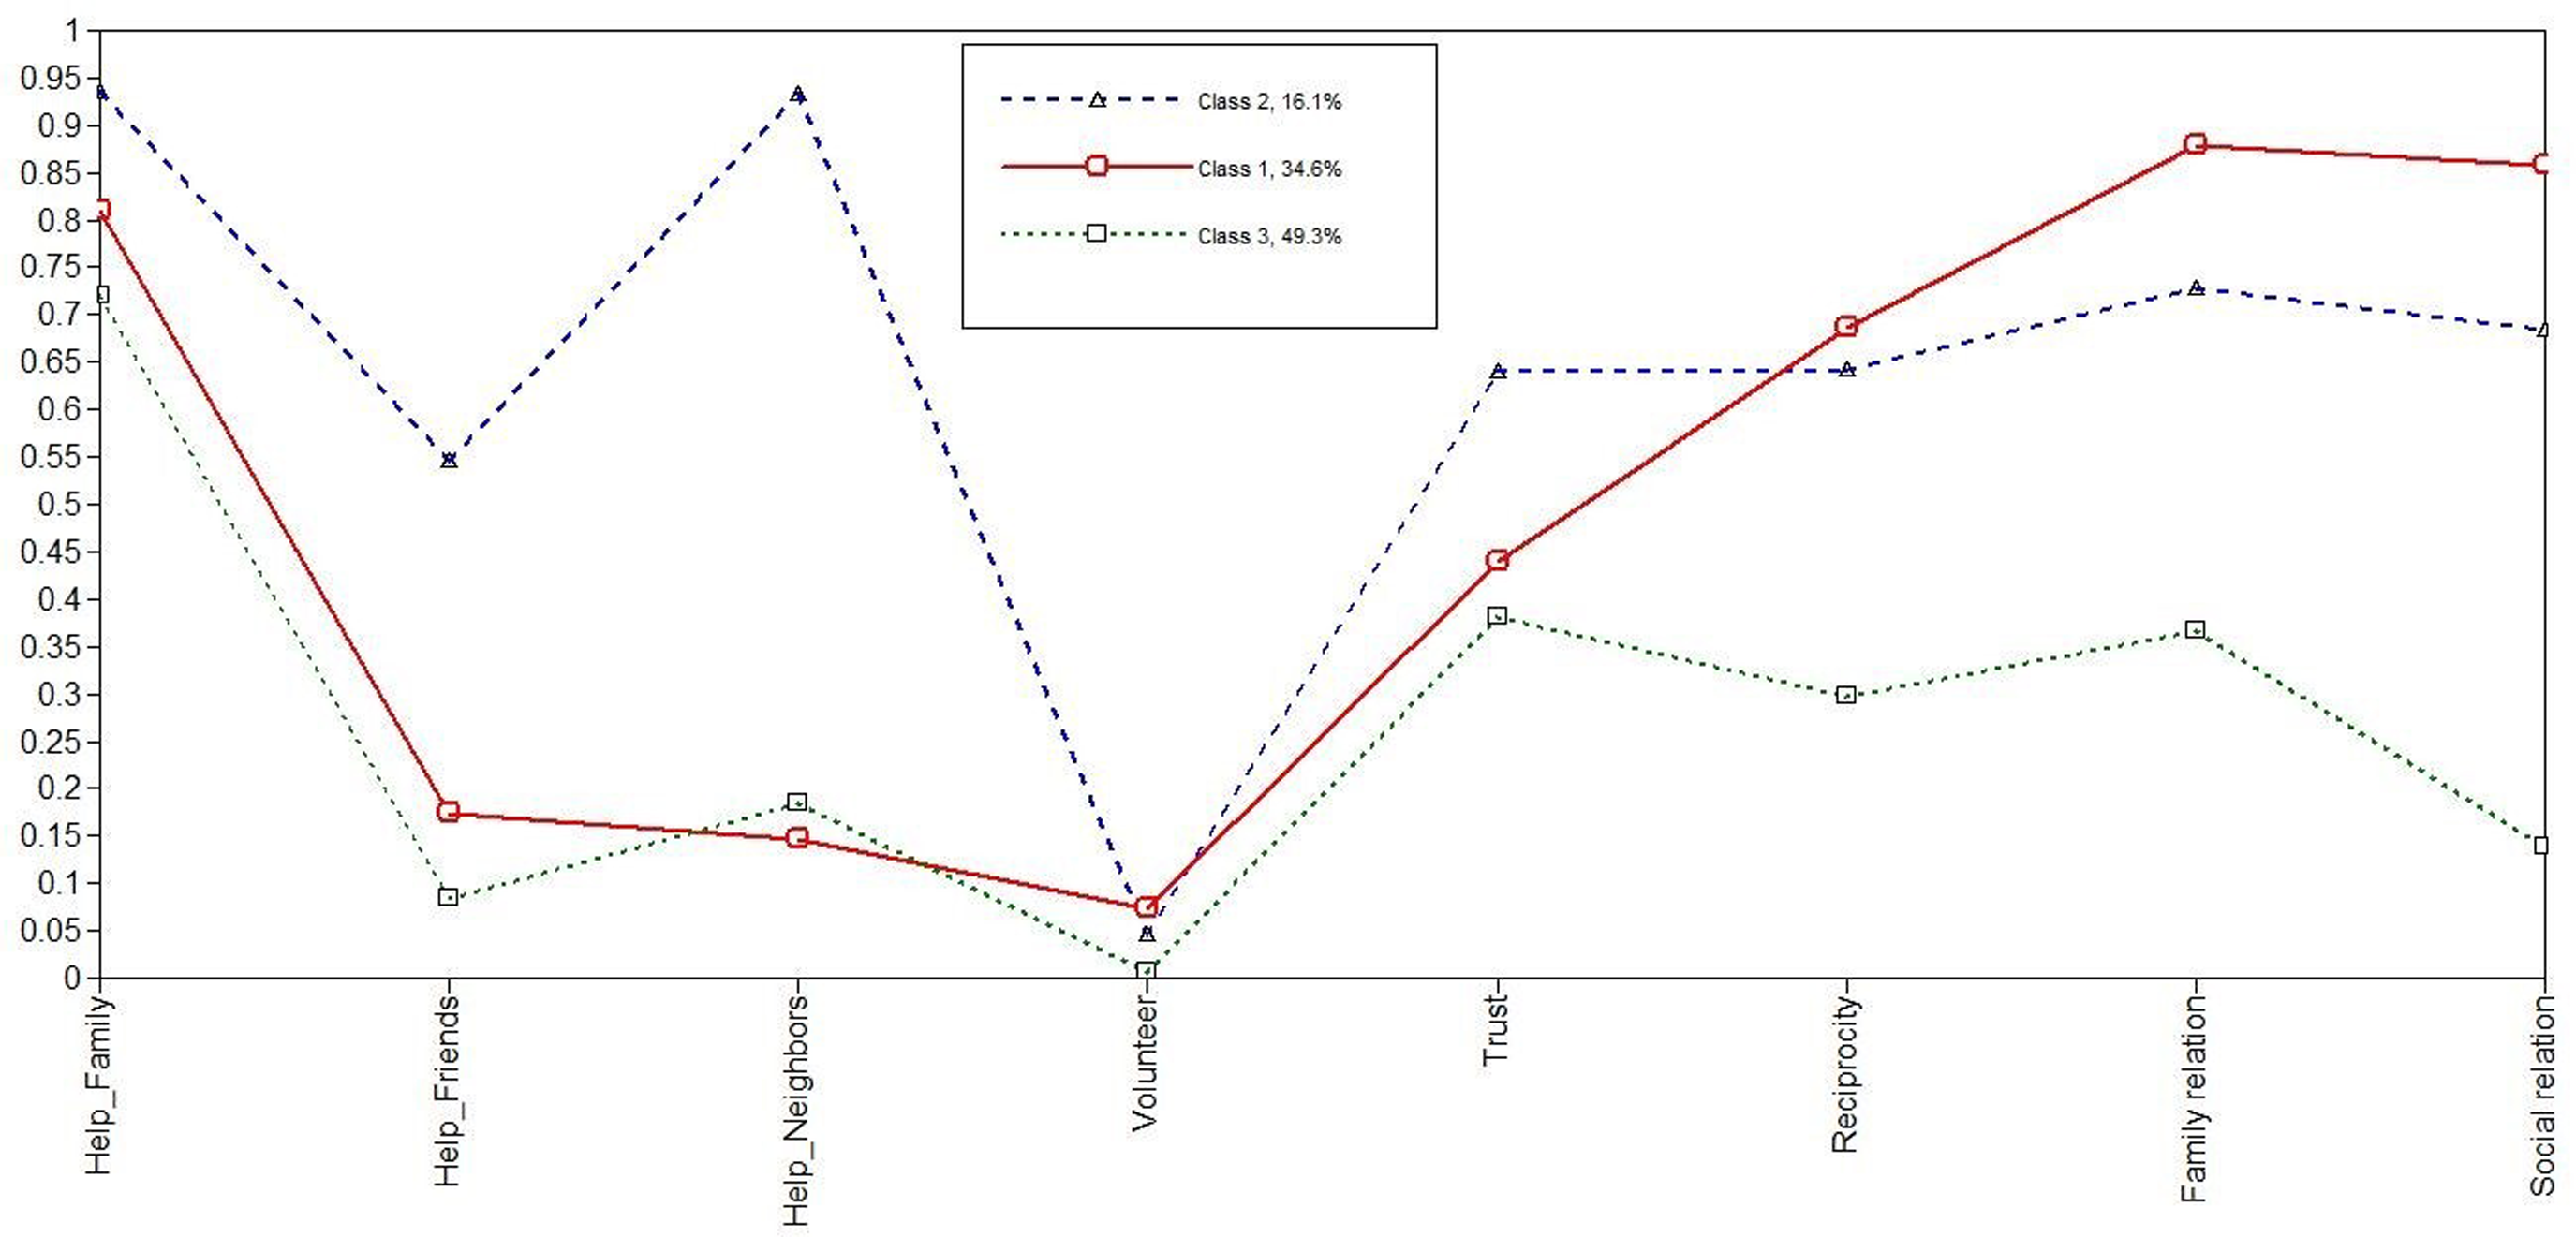
Latent classes by structural and cognitive social capital factors.
Table 5 presents the characteristics of the study participants according to the three latent classes. First, Class 3 showed a higher percentage of females than Classes 1 and 2 did. Second, Class 1 showed the highest level of education, while Class 3 showed the lowest level of education. For instance, 6.8% of older adults in Class 1 hold a bachelor's degree, compared to only 2.4% of those in Class 3. Third, the self-reported health condition of older adults in Class 3 was worse than that reported in Classes 1 and 2. Fourth, the average age of older adults in Class 3 was slightly higher than that in Class 1. Finally, older adults in Class 1 had the highest household income, followed by those in Classes 2 and 3, respectively. Overall, older adults in Class 3 were more likely to be vulnerable in terms of SES. Additionally, depression scores significantly differed among the three latent classes from 2006 to 2018. Class 1 had the lowest depression scores overall, whereas Class 3 had the highest depression scores over time.
Characteristics of the Study Participants by Latent Class.

**p < .01, ***p < .001.
Unconditional Growth Curve Model
Before using the unconditional growth curve model, we identified the model fit indices in the intercept-only model, which were assumed to not change over time. The model fit indices of the intercept-only model were acceptable (χ2(13) = 374.76, CFI = 0.73, TLI = 0.79, RMSEA = 0.09, SRMR = 0.08). Compared with the intercept-only model, the unconditional growth curve model based on a linear change over time showed a significant improvement in terms of model fit indices (χ2(10) = 200.61, CFI = 0.86, TLI = 0.86, RMSEA = 0.07, SRMR = 0.059). Thus, we select the unconditional growth curve model instead of the intercept-only model. The unconditional growth curve model for depressive symptoms is presented in Table 6. The significant mean intercept and slope indicate that the initial depressive symptoms of older adults were significantly different from zero (β = 18.618, p < .001) and that the rate of change in depressive symptoms decreased over time (β = −0.464, p < .001). The significant variance of the intercept and slope revealed notable interindividual variabilities in terms of the initial level of depressive symptoms (β = 14.979, p < .001) and the rate of change of symptoms (β = 0.365, p < .01), respectively. Finally, the significant covariance between the intercept and slope indicated that older adults with higher depressive symptoms at baseline showed a relatively slower decline in terms of rate of change than those with lower depressive symptoms at baseline.
Unconditional Growth Curve Model Results.

**p < .01, ***p < .001.
Conditional Growth Curve Model
The conditional growth curve model was used to examine the impact of latent classes on depressive symptoms over time, controlling for socioeconomic factors such as household income, gender, age, education, and self-rated health, as shown in Table 7. First, the overall model provided a good fit (χ2(31) = 300.1, CFI = 0.89, TLI = 0.84, RMSEA = 0.05, SRMR = 0.03).
Conditional Growth Curve Model Results.

In the case of depressive symptoms at baseline, Class 1 (medium structural and high-cognitive group) and Class 2 (high-structural and cognitive group) showed significantly lower depressive symptoms than Class 3 (reference group: low-structural and cognitive group). All control variables were significantly associated with depressive symptoms at baseline. In other words, higher levels of household income and education were associated with fewer depressive symptoms at baseline, but older female adults, older age, and poorer self-rated health were significantly related to higher levels of depressive symptoms at baseline.
In addition, a significant difference was found in the rate of change in depressive symptoms among the latent classes, indicating that the change in depressive symptoms in Class 3 was lower than that in Classes 1 and 2. Among the control variables, only self-rated health was a significant predictor of the rate of change in depressive symptoms, indicating that older adults with poorer self-rated health tended to decline slowly compared to their counterparts who self-rated themselves as healthier. Finally, the conditional growth curve model, including social capital and control variables, explained 51.4% of the variance in depressive symptoms at baseline (intercept) and 42.3% of the variance in the rate of change (slope).
Discussion
The first half of this study aimed to identify the latent classes of older Korean adults based on their structural and cognitive social capital. Results from the latent class analyses revealed that older Korean adults could be categorized into three latent classes. Class 1, Class 2, and Class 3 were groups with medium structural and high-cognitive, high-structural and cognitive, and low-structural and cognitive social capital, respectively. Older adults in Class 1 reported medium levels of structural social capital but the highest level of satisfaction from family and social relationships, as well as more participation in volunteering than those in Classes 2 and 3 did. Older adults in Class 2 showed the highest levels of structural and cognitive social capital, whereas older adults in Class 3 reported the lowest levels of structural and cognitive social capital among the three latent classes.
Interestingly, significant differences in SES were found among the three latent classes. More than half of the older adults in Class 3 were female, and they were more likely to have lower levels of education, lower household income, poorer self-rated health, and more depression than those in Classes 1 and 2. Similar SES patterns were found in Classes 1 and 2, but older adults in Class 1 had slightly higher levels of education and household income and lower levels of depressive symptoms than those in Class 2.
The second half of this study examined the differences in depression trajectories according to the three latent classes using latent growth curve modeling. First, the unconditional growth curve model showed decreasing patterns of depressive symptoms over time. However, significant heterogeneity was found in terms of the initial level of depressive symptoms and rate of change. Second, to understand the heterogeneity of depression trajectories, we added three latent classes as predictors, controlling for socioeconomic factors such as household income, gender, age, education, and self-rated health.
The conditional growth curve model showed that depression trajectories differed according to the latent class to which the group belonged. Older adults with low structural and cognitive social capital (Class 3) were more likely to be depressed than those in Classes 1 and 2 at baseline. This result indicates that lower levels of structural social capital, for example, help from family, friends, and neighbors, and volunteering and cognitive social capital, for example, trust, reciprocity, and satisfaction from relationships, could have a negative impact on depressive symptoms. This result is in line with several studies that show a strong link between low social capital and depression. Lower levels of both structural and cognitive social capital significantly predict depression in older Koreans (Lee, 2019; Yun & Bae, 2020). Forsman et al. (2012) also found that older adults with low-structural and cognitive social capital showed increased symptoms of depression, which is consistent with the findings observed in Class 3 in this study.
Interestingly, older adults in Class 1 with higher levels of cognitive social capital showed fewer depressive symptoms despite their relatively lower structural social capital, such as help from friends and neighbors. These results are consistent with those of previous studies showing that high cognitive social capital decreases the likelihood of depression (Harpham, 2008), whereas the association between structural social capital and depression is ambiguous (De Silva et al., 2005); however, there are other explanations. For instance, older adults who receive high informal support from family, friends, and neighbors may have resulted from their dependent health status. As shown in Table 5, 47.1% of the participants in Class 2 reported their health status as poor, which is higher than that of Class 1 and even close to that of Class 3. In other words, “high structural social capital,” as defined in this study, may represent high care or support needs.
Finally, a significant difference in the rate of change of depressive symptoms was found among the three latent classes. Unexpectedly, the rate of change in depressive symptoms in Class 3 was slower than those in Classes 1 and 2, although older adults in Class 3 showed the highest levels of depressive symptoms in the beginning. This may be due to the ceiling effect, which explains why older adults with lower SES (Class 3) showed relatively higher depressive symptoms at baseline; thus, the probability of them being more depressed over time was lower than that of those in the higher SES group. According to the convergence trajectory theory, differences in health tend to decline with age. In particular, health disparities due to SES tend to decrease with age as the impact of SES is more on young and middle-aged than on older adults, who are beneficiaries of social policies such as social security and Medicare (Ross & Wu, 1996). In this respect, the gap in depressive symptoms among older adults in the three latent classes may decrease over time.
Based on these results, we recommend that older adults in Class 3, the most vulnerable group, establish structural and cognitive social capital. However, the older adults in Class 1 demonstrated that it might be more important to maintain a higher level of cognitive social capital, regardless of structural social capital, to reduce their depressive symptoms. Among the cognitive social capital components in Class 1, participation in volunteer activities was the highest among the three latent classes. Because volunteerism is a self-determined action, which resulted in reduced symptoms of depression.
To the best of our knowledge, this is the first study to simultaneously utilize latent class and latent growth curve analyses to identify latent classes among older Korean adults based on their social capital. However, despite this new approach, this study has several limitations. First, as we used secondary data, eight-item structural and cognitive factors do not exactly represent the concept of social capital. Therefore, further studies need to collect more comprehensive and accurate measures of social capital based on social capital theory. Second, we could not control for a relatively low entropy score because secondary data have limited information regarding structural and cognitive social capital. This problem can be properly addressed if primary data are collected in future studies. Lastly, the rate of change in depressive symptoms by latent class showed unexpected results. This might be related to convergence trajectory theory, which explains that differences in health tend to decline with age. Thus, further studies are needed to identify the latent classes of young and middle-aged adults based on their social capital and to compare their depression trajectories with those of older adults.
Footnotes
Acknowledgements
This research was supported by the BK21 FOUR of the National Research Foundation of Korea (NRF) funded by the Ministry of Education.
Declaration of Conflicting Interests
The author(s) declared no potential conflicts of interest with respect to the research, authorship, and/or publication of this article.
Funding
The author(s) received no financial support for the research, authorship, and/or publication of this article.