



Abstract
Community colleges aim to provide educational opportunities that prepare citizens to lead more productive personal, civic, and work lives. Approximately 60% of incoming community college students are referred to at least one developmental math course, and 80% of these students will not have earned college-level math credit even after three years (Bailey, Jeong, & Cho, 2010). Minority students tend to be assigned to greater numbers of developmental math courses and are less likely than White students to progress through their developmental math requirements to achieve college math credit (Bailey et al., 2010). Absent such credit, students cannot transfer into four-year degree programs or qualify for entry into preparation programs in a wide range of occupational-technical specialties. As a result, hundreds of thousands of students each year find themselves unable to progress toward their educational, career, and life goals. This is one of the most significant social equity problems of our time (Cullinane & Treisman, 2010).
Researchers have identified several factors that impede student success. The current developmental math education system consists of a long, multi-course sequence (Hodara, 2013). The sequence typically begins with pre-algebra followed by elementary and intermediate algebra, all as pre-requisites to taking a college-level course. Based on their scores on a placement test, students may be required to take one, two, three, or in some cases even more of these developmental courses (Cullinane & Treisman, 2010). This structure offers a serious impediment to student success. Even when students successfully complete one of these courses, many fail to continue through the sequence (Bailey et al., 2010).
In addition, classroom instruction often does not use research-based instructional activities and pedagogic practices that can foster deeper student learning (National Research Council, 2002). Traditional math curricula do relatively little to engage students’ interest and demonstrate the relevance of mathematical concepts to everyday life (Carnevale & Desrochers, 2003). Many students have had negative prior math experiences leading them to believe that they are not a math person (believing that math ability is fixed or innate), which often triggers anxiety when they are faced with difficult or confusing math problems (Blackwell, Trzesniewski, & Dweck, 2007; Haynes, Perry, Stupnisky, & Daniels, 2009). This is compounded for some students (e.g., women, African Americans) who identify as part of a group that has been stereotyped as not being good at math (Cohen, Garcia, Purdie-Vaughns, Apfel, & Brzustoski, 2009). Other research indicates that students’ difficulty in developmental math frequently relates to the language and literacy demands of mathematics rather than their mathematical ability (Gomez, Rodela, Lozano, & Mancevice, 2013). More specifically, students struggle to use the language of mathematics effectively, understand problem situations that require mathematical reasoning, and communicate their learning with others orally and in writing.
Statway’s Theory of Improvement
To address these challenges, the Carnegie Foundation for the Advancement of Teaching developed and implemented the Statway program. The program aims to accelerate students’ progress through developmental math and to acquire credit in college statistics in just one year. Six key drivers—accelerated pathway through college-level math, learning principles for curriculum and instruction, productive persistence, language and literacy supports, faculty development for advancing quality teaching, and networked improvement community (NIC)—organize the program’s working theory of improvement (Bryk, Gomez, Grunow, & LeMahieu, 2015).
First, as depicted in Figure 1, students starting in elementary algebra within the traditional math sequence would need at least one and a half to two years to earn college math credit. For some students, it takes even longer as they may need to repeat a course or find themselves unable to register for the next course in a time slot that accommodates their family and work schedules (Bailey et al., 2010; Cullinane & Treisman, 2010). To reduce these structural barriers, Statway is designed as an intensive, integrated one-year experience involving a cohort of students working with a faculty member to achieve college-level math credit. It combines college-level statistics with the concepts and skills from elementary and intermediate algebra that students need to successfully complete college statistics. The program is intended to meet the requirements for introductory college-level math in liberal arts or general education in community colleges and four-year universities and provides quantitative preparation suitable for students pursuing a non-STEM (science, technology, engineering, and mathematics) major (Cullinane & Treisman, 2010; Hodara, 2013).

Statway versus traditional math sequence.
Second, the Statway instructional system is anchored in three research-based principles known to enhance student learning. The first principle is productive struggle through which students are more likely to retain what they learn when they expend effort solving problems that are within reach and grappling with key mathematical ideas that are comprehensible but not yet well formed (Schmidt & Bjork, 1992). Thus, each new concept is introduced with a rich problem that engages students’ thinking and encourages this struggle to understand (Hiebert & Grouws, 2007). The next one is explicit connections to concepts. Mathematics instruction sometimes focuses on procedural competence at the cost of advancing real conceptual understanding. Research suggests making explicit connections between mathematical or statistical facts, ideas, and procedures can improve both conceptual and procedural understanding (Boaler, 1998; Hiebert & Grouws, 2007). The last one is a deliberate practice in which classroom and homework tasks are designed to overcome gaps in understanding, apply what is learned, and deepen facility with key concepts (Ericsson, 2008; Ericsson, Krampe, & Tesch-Römer, 1993). Deliberate practice eschews rote repetition for carefully sequenced problems developed to guide students toward deeper understanding of core concepts (Pashler, Rohrer, Cepeda, & Carpenter, 2007).
Third, Statway incorporates an evidence-based package of student activities and faculty actions that promote productive persistence. These interventions focus on promoting students’ belief that they can learn math (i.e., the growth mindset beliefs countering the fixed mindset beliefs; Dweck, 2006), reducing their anxiety (Jamieson, Mendes, Blackstock, & Schmader, 2010) and increasing their sense of belonging (Walton & Cohen, 2011). Specific activities focus on developing the skills needed to be effective students and the flexible mindsets necessary to utilize those skills (Dweck, Walton, & Cohen, 2011; Yeager & Walton, 2011). These aims are advanced through targeted student interventions, guidance to help faculty create more engaging classroom environments, and a lesson structure that encourages active student engagement.
Fourth, efforts are also made to reduce language and literacy barriers that can hinder student learning of mathematics, led by Gomez and her colleagues (Gomez et al., 2015; Gomez et al., 2013). Language and literacy supports for students are interwoven in instructional materials and classroom activities so that learning is accessible to all. Language and literacy tools have been developed to help students extract important vocabulary or concepts, allow them to highlight key concepts in problem situations and readings, and assist them in synthesizing information in context and strengthening reasoning skills.
Fifth, it was hypothesized that many community college faculty might find teaching Statway to be novel or even challenging because their past teaching experiences relied heavily on lectures and a teacher-centered pedagogy emphasizing the transmission of math content, facts, and procedural knowledge (Edwards, Sandoval, & McNamara, 2015; Grubb, 1999; Grubb & Gabriner, 2013). To address these possible concerns, Statway incorporates faculty professional development consisting of ongoing mentoring, online activities and resources, and in-person meetings and workshops.
Sixth and finally, the Statway program is organized as a NIC aiming to accelerate educators’ efforts to continuously improve (Bryk, Gomez, & Grunow, 2011; Dolle, Gomez, Russell, & Bryk, 2013). The NIC is a scientific learning community distinguished by four essential characteristics. It is (a) focused on a well-specified common aim, (b) guided by a deep understanding of the problem and the system that produces it, (c) disciplined by the rigor of improvement science, and (d) networked to accelerate the development, testing, and refinement of interventions and their effective integration into varied educational contexts. The Statway NIC joins community college faculty and administrators with improvement specialists and educational researchers from other institutions. They collaboratively engage in disciplined inquires using common conceptual frameworks, measures, and inquiry protocols to advance measureable improvements in teaching and learning in Statway (Bryk et al., 2015).
As summarized in Figure 2, the Statway initiative is organized around six key drivers: (a) structural arrangement as an accelerated year-long pathway through college-level math, (b) research-based principles for curriculum and instruction, (c) strengthening the skills and mindsets that students need to succeed in an academic setting (productive persistence), (d) language and literacy supports to make mathematics learning accessible to more students, (e) support of faculty professional development for advancing quality teaching, and (f) the social arrangement of a NIC to accelerate learning to continuously improve. In this regard, Statway can be considered as a multifaceted change initiative, addressing complex problems simultaneously in developmental math education and providing a solution for students, faculty, and colleges.
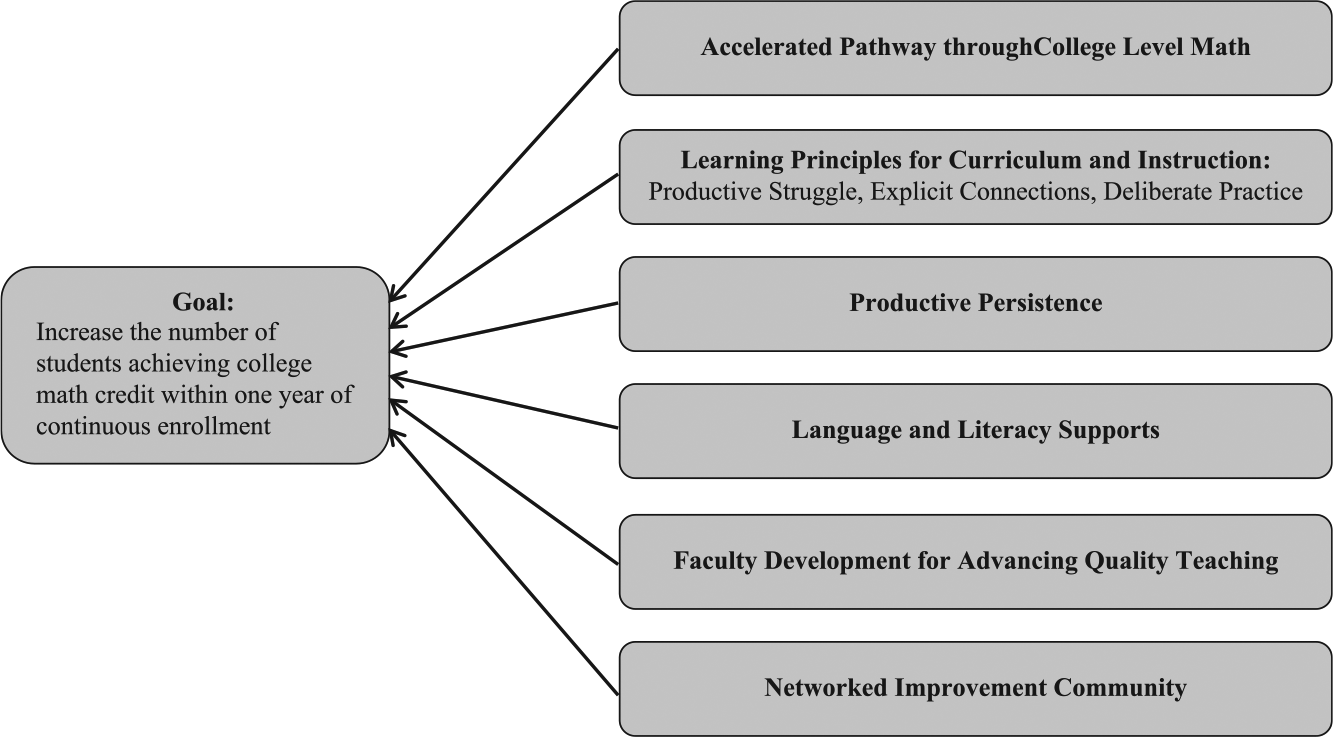
Six key drivers of Statway.
The objective of the current study was to assess the first two years’ efficacy of this change initiative. We used a propensity score matching technique to statistically reduce possible selection bias (where certain kinds of students may have been more likely to enroll in Statway, leading to more positive outcomes than there otherwise would have been) and accordingly increase the validity of causal inference (Rosenbaum & Rubin, 1983). Given the hierarchical nature of our data (i.e., students nested within colleges), we employed a hierarchical linear modeling (HLM) approach (Raudenbush & Bryk, 2002) to obtain propensity scores (Hong & Raudenbush, 2005, 2006). We then compared college math performance between Statway and the non-Statway matched comparison groups. A second objective was to track the academic outcomes of students one year after their enrollment in Statway. For this purpose, we compared college-level course credit accumulation between the two matched groups in the subsequent year. This comparative analysis was intended to determine whether Statway students continue to demonstrate success even after their Statway experience. All analyses were conducted separately for Years 1 and 2 cohorts.
Method
Participants
Statway was first launched during the 2011-2012 academic year. The first cohort of students began Statway in the fall of 2011. This initial cohort of students spanned 19 community colleges across five states (i.e., California, Connecticut, Florida, Texas, and Washington; for the participating community colleges, see Appendix). In total, 50 faculty members taught 55 sections of Statway with 1,133 students enrolled (Strother, Van Campen, & Grunow, 2013). The second cohort included a total of 1,553 students enrolled in 77 sections of Statway taught by 67 faculty members. Of the 19 community colleges that participated in Statway, all but one offered Statway in both Years 1 and 2 (Van Campen, Sowers, & Strother, 2013). The vast majority of students placed at least two levels below a college-level math course, and almost half were also required to take at least one developmental reading course (Strother et al., 2013; Van Campen et al., 2013). Approximately 60% of the students were female, and less than one third were raised in families where the mother held either a two- or four-year college degree. Well over half of the students were minorities.
Data Collection
Institutional researchers from participating colleges provided background data on student characteristics, course enrollment, and course performance. Two colleges were not included in the Year 1 analyses. One college discontinued the program partway through the year, because its district mandated an alternative developmental math program. The second college implemented Statway as a further accelerated one-semester course. In so doing, they substantially changed the course content, and hence, their implementation was not as comparable as the remaining colleges’. Consequently, the Year 1 analytic sample consisted of 928 Statway students from 17 community colleges. Four colleges were not included in the Year 2 analyses. Two colleges made major changes in the curriculum, how it was offered, and the data they were willing to collect and share. The institutional research offices in two other colleges failed to provide the data necessary for conducting adequate propensity score matching. Thus, the Year 2 analyses were based on 771 Statway students from 15 community colleges. All 15 of these colleges also offered Statway in Year 1.
Study Design
Figure 3 delineates the basic study design used in this research. The first objective in this study was to identify a group of students most comparable with Statway students. Defining an appropriate comparison group in this instance was a little more complex than typically the case. As noted earlier, Statway is designed as an intensive course of study intended to assist developmental math students to achieve college-level credit in statistics within one academic year of continuous enrollment. In contrast, students following the traditional developmental math sequence and starting two or more levels behind college-level math cannot typically achieve college-level math credit in one year. They would need to be enrolled for one and a half to two years to meet the same benchmark (Bailey et al., 2010; Cullinane & Treisman, 2010). This led us to draw a comparison group from students who began taking their developmental math course one year before their Statway counterparts and then compare both groups’ course outcomes at the end of the Statway year. Thus, comparison students had two years to achieve the same outcomes that Statway students accomplished in one year. As illustrated in the left panel of Figure 3, the comparison group for students who began Statway in Fall 2011 consisted of students who began developmental math in Fall 2010. These two groups were then compared at the end of the Spring 2012. Our goal was to be conservative in forming the comparison group by giving these students twice as much time to reach the same success benchmark as Statway students. Data on 58,034 and 48,383 potential comparison group students were available in the Years 1 and 2 analyses, respectively. We also compared descriptive data and course completion outcomes for comparison group students from Years 1 and 2 and found them very similar college by college. Thus, there is little reason to believe that this matched strategy biases results because the comparison and treatment groups were not strictly contemporaneous.
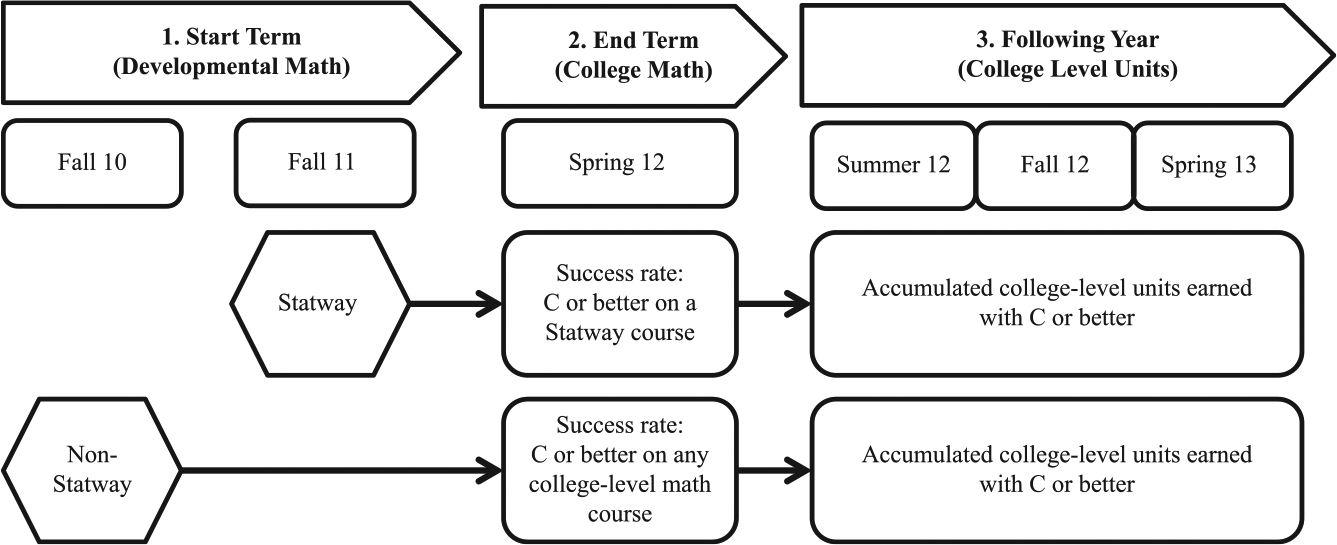
Study design with Year 1 as an exemplar.
To obtain propensity scores, we formulated a two-level HLM model with a total of 44 student-level covariates including student background characteristics, course taking, and course performance during the two years prior to Fall 2010-2011 for the Year 1 cohort and Fall 2011-2012 for the Year 2 cohort. We selected covariates based on prior research findings and advice from institutional researchers in the participating colleges. The list includes standard student background data such as gender, race/ethnicity, and placement levels. All these characteristics have been shown to differentiate students’ progress in the developmental math sequence (Bailey et al., 2010). We also matched on detailed data about students’ prior course taking and success because this has been found to be a more reliable indicator of their educational and career goals than a declared program of study (Jenkins & Cho, 2012).
Table 1 presents all the covariates used in the propensity score matching and their descriptive statistics for Years 1 and 2. Information on some variables for some students was not recorded in institutional records. We defined these data instances as “unknown” and included this as a separate matching category. For instance, there are a substantial number of unknown records for student placement levels because the information on student placement levels was missing and/or students did not take a placement test. Missing GPAs correspond to students who had not yet taken any college-level courses or received grades that do not have an effect on their GPAs (i.e., W [Withdrawals] and I [Incompletes]). To factor these cases with missing GPA scores into the propensity model, we formulated a dummy variable and coded missing GPAs as 1, otherwise 0.
Descriptive Statistics of Covariates in the Two-Level Propensity Models.
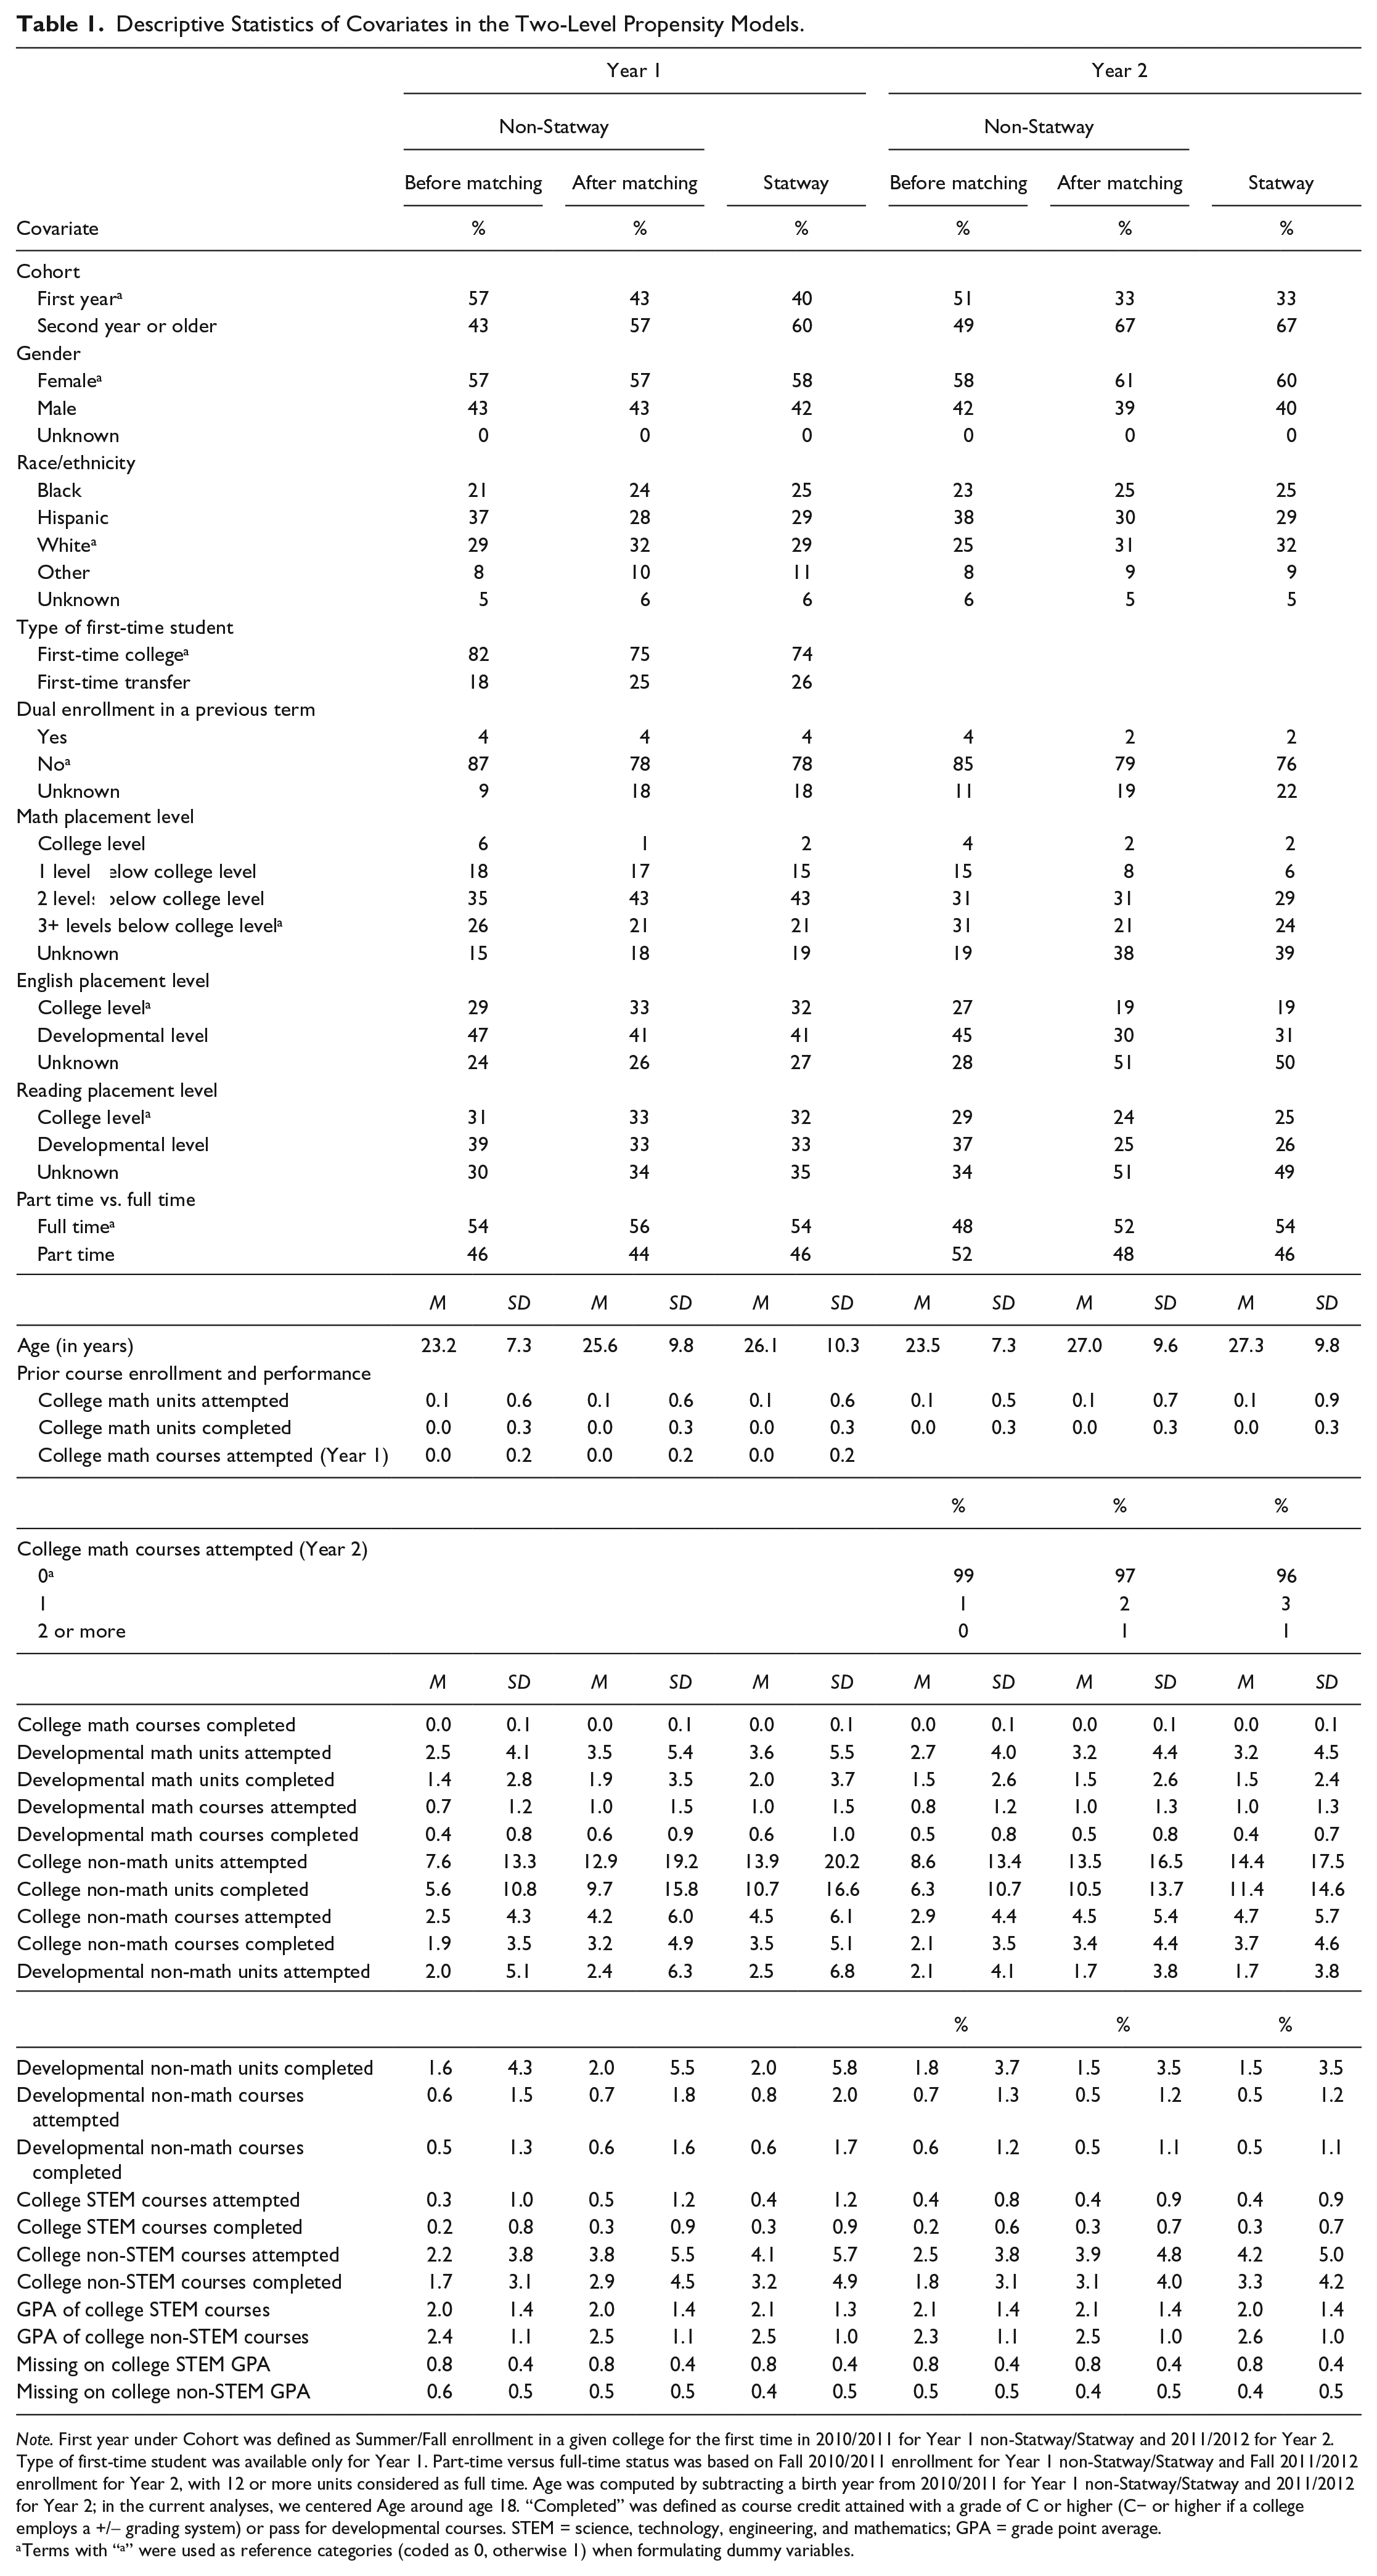
Note. First year under Cohort was defined as Summer/Fall enrollment in a given college for the first time in 2010/2011 for Year 1 non-Statway/Statway and 2011/2012 for Year 2. Type of first-time student was available only for Year 1. Part-time versus full-time status was based on Fall 2010/2011 enrollment for Year 1 non-Statway/Statway and Fall 2011/2012 enrollment for Year 2, with 12 or more units considered as full time. Age was computed by subtracting a birth year from 2010/2011 for Year 1 non-Statway/Statway and 2011/2012 for Year 2; in the current analyses, we centered Age around age 18. “Completed” was defined as course credit attained with a grade of C or higher (C− or higher if a college employs a +/- grading system) or pass for developmental courses. STEM = science, technology, engineering, and mathematics; GPA = grade point average.
Terms with “a” were used as reference categories (coded as 0, otherwise 1) when formulating dummy variables.
Overall, Statway and traditional developmental math students look quite similar across the covariate set. Year 1 Statway students were somewhat less likely to be in their first year of study. The racial ethnic composition was also a bit different with slightly more Black students and fewer Hispanic students enrolled in Statway. Statway students were also more likely to have been placed exactly two levels below college math. The latter is not surprising in that this was the target group of students for whom Statway was specifically recommended. Year 2 data appear similar with the exception of somewhat fewer full-time students enrolled in the traditional developmental math sequence.
We conducted propensity score matching separately for each college by applying a nearest neighbor matching algorithm (Rosenbaum & Rubin, 1985). This algorithm was appropriate for our study because we wanted to retain all Statway students and had a large pool of non-Statway students available for creating matches. We attempted to find up to five matches per Statway student (5:1 ratio matching) to maximize the best matches from the non-Statway student group while still maintaining precision (Ming & Rosenbaum, 2000). We also specified a caliper distance of up to 0.2 to reduce the risk of bad nearest neighbor matches based on recommendations in the literature (Austin, 2011; Rosenbaum & Rubin, 1985).
Next, as illustrated in the middle panel of Figure 3, we estimated the effectiveness of Statway by comparing success rates of Statway students with their matched comparisons using a three-level HLM model with a binary outcome. Success was defined as a grade of C or higher for Statway students at the end of the year. For the matched comparisons, success was defined as a C or higher on any college-level math course as defined in local institutional records. 1 Statway students (Level 1) were nested within their faculty member classrooms (Level 2), and faculty in turn were nested within colleges (Level 3). Because matched comparisons were created for each Statway student, their respective comparison students were also assigned the corresponding Statway faculty ID. In essence, each faculty member’s classrooms now formed as a mini experiment where the mean outcomes for their students could be compared with those for students just like them who had pursued the more conventional course of study. Key for our analytic purposes, this strategy permitted estimation of the variability in effects among faculty within colleges. Finally, as depicted in the right panel of Figure 3, we also examined college-level course performance between Statway and their matched comparisons in the subsequent calendar year including a summer term where applicable. These follow-up data were available only for the Year 1 cohort. We defined student performance in the follow-up year in terms of the college course credits accumulated with a grade of C or higher. We used HLM 7 (Raudenbush, Bryk, Cheong, Congdon, & du Toit, 2011) for all of the HLM analyses.
Results
Propensity Score Matching
To obtain propensity scores, we formulated a two-level Bernoulli model and estimated its model parameters using maximum likelihood via adaptive Gaussian quadrature. φ ij is the probability of student i enrolling in Statway in college j. Accordingly, η ij is the log-odds of this incident and formally expressed as follows:
Level 1 Model (student)

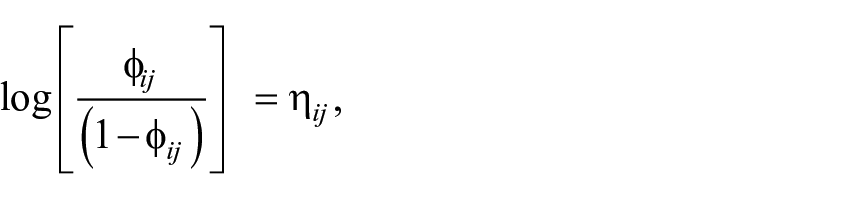

Level 2 Model (college)





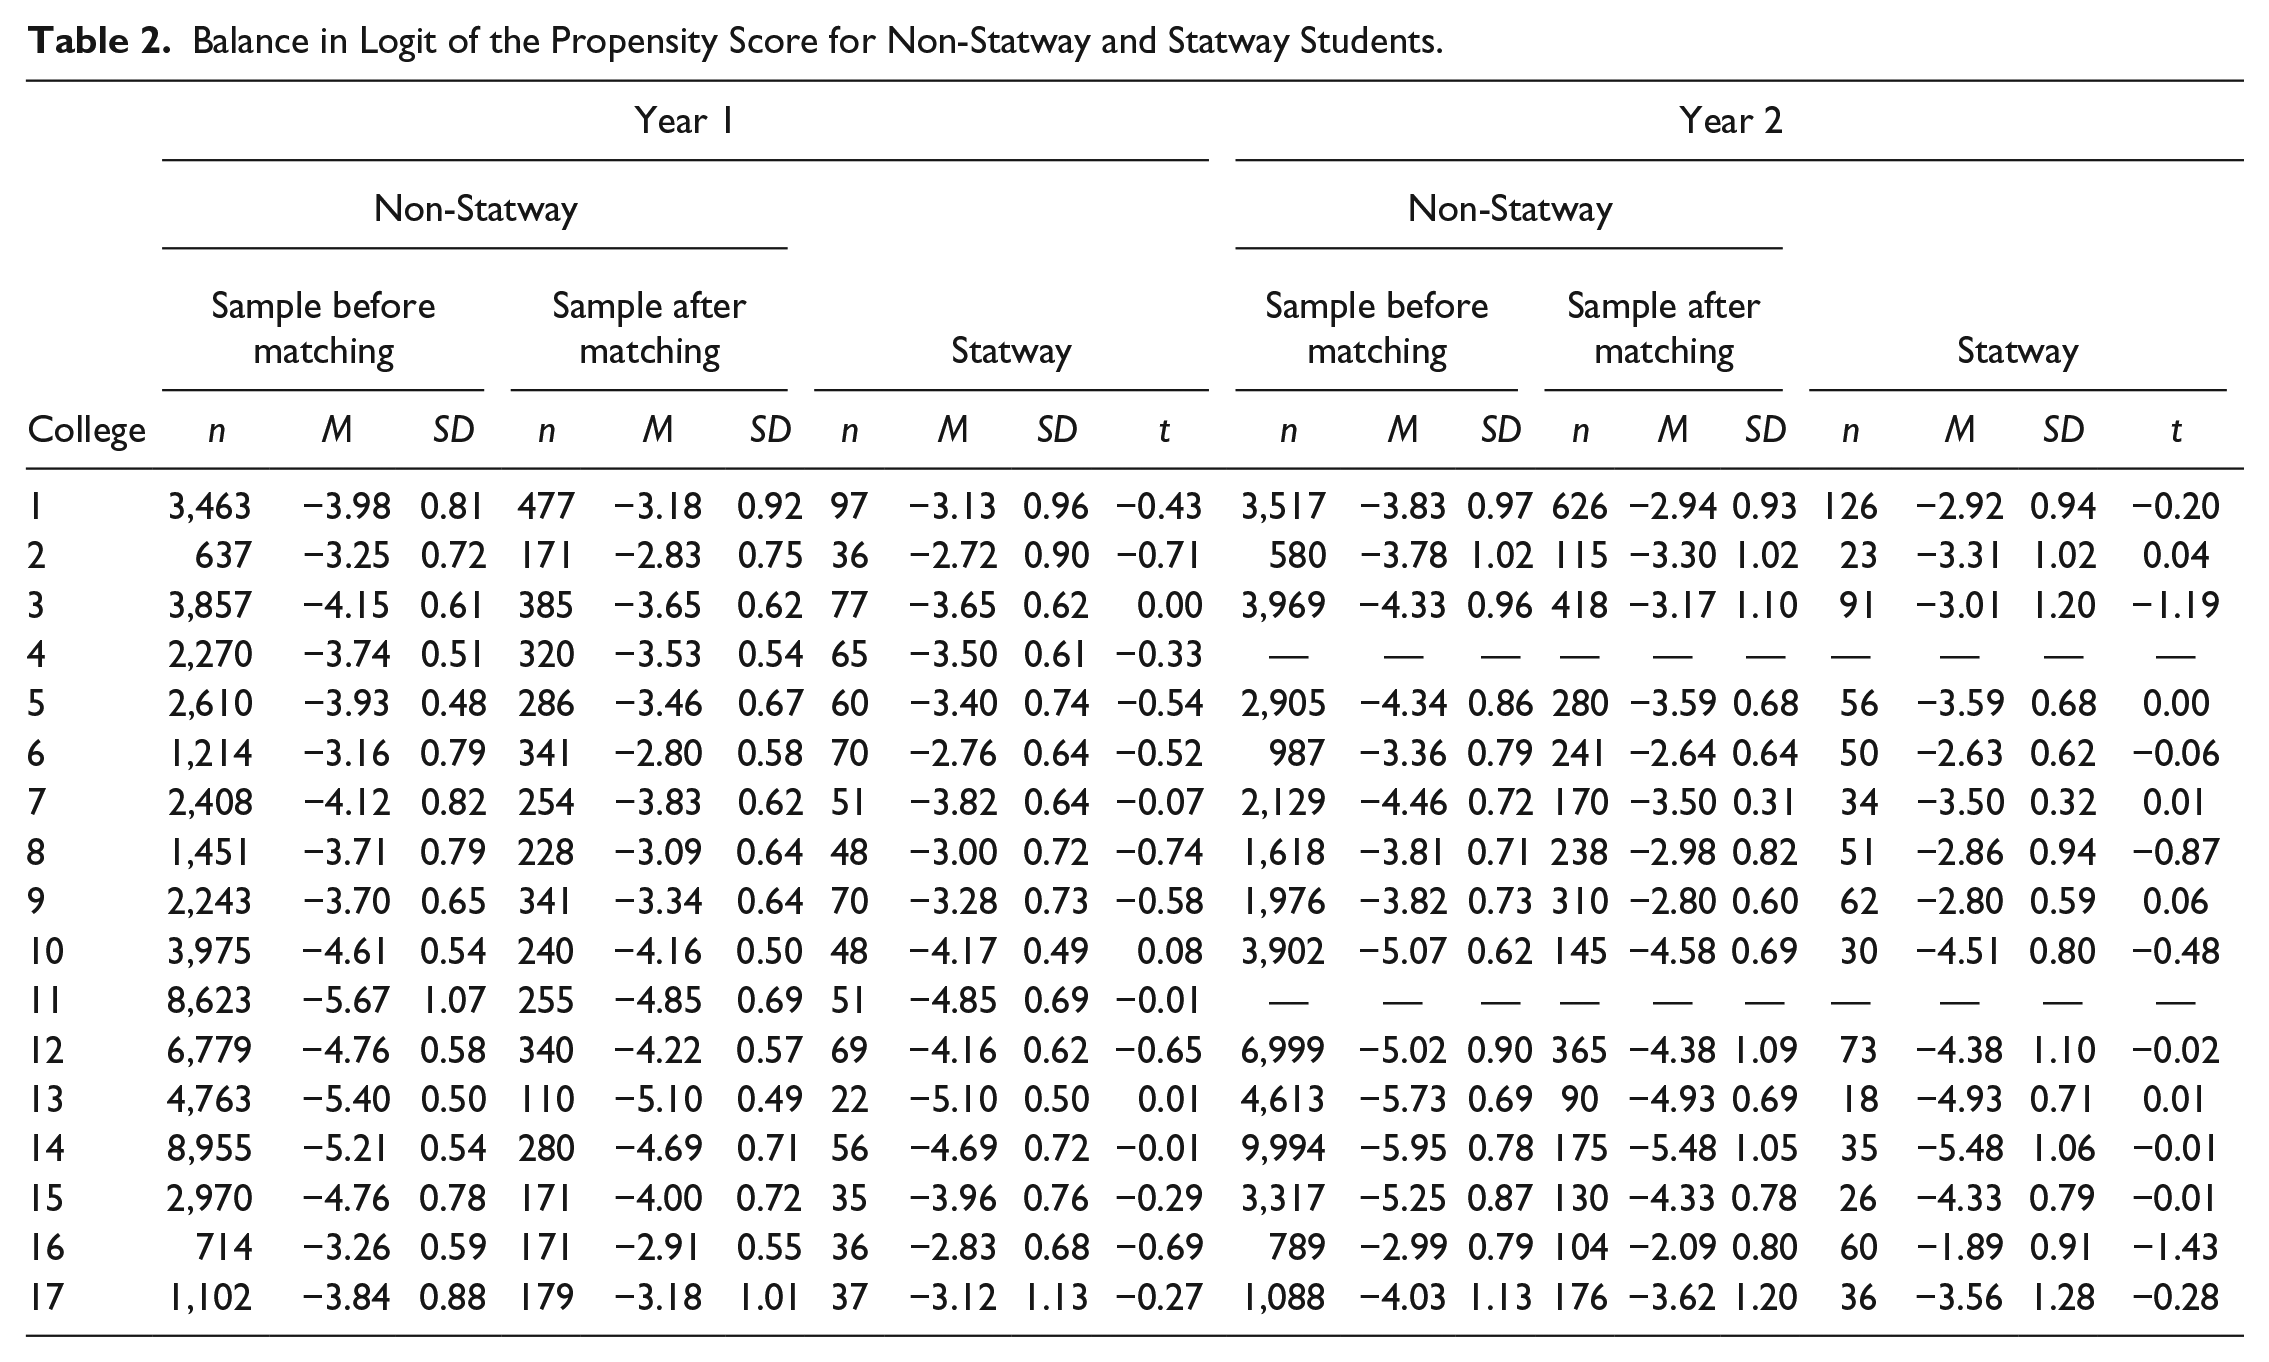
where SW is a dummy variable indicating whether a given student was enrolled in Statway (coded as 1) or not (coded as 0), COV1 . . . COV44 are the set of propensity score covariates, and i and j denote student and college, respectively. We estimated one random slope, β44j, for a dummy variable indicating placement two levels below college math. Preliminary analyses identified significant heterogeneity among colleges in this relationship. Consequently, the propensity score matching in each college was based on their local site-specific relationship for this one variable. We matched a total of 4,549 comparison students with 928 Statway students for Year 1 and a total of 3,583 comparison students matched with 771 Statway students for Year 2. 2 Table 1 compares the descriptive statistics on each covariate before and after matching to the Statway group. Table 2 documents the balance in propensity score college by college for Years 1 and 2. For both cohorts, there were no significant differences in mean propensity score between the Statway and matched students in any of the colleges (see t values). Taken together, this provides strong evidence that comparability of the groups was achieved on the measured covariates.
Balance in Logit of the Propensity Score for Non-Statway and Statway Students.
Estimating Statway Effects
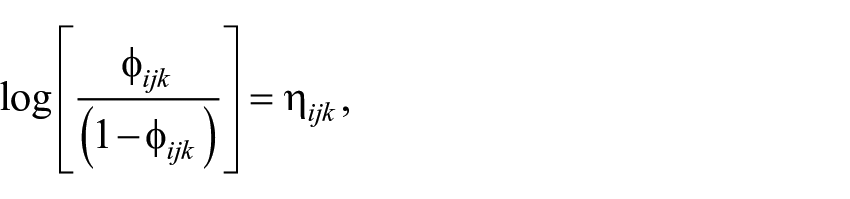
To estimate differences in success rate, we formulated a three-level Bernoulli model 3 and estimated its model parameters using maximum likelihood via adaptive Gaussian quadrature. φ ijk represents the probability that student i associated with faculty member j’s class in college k successfully achieved college math credit. Correspondingly, η ijk is the corresponding log-odds of this outcome and formally expressed as follows:
Level 1 Model (student)


Level 2 Model (faculty)



Level 3 Model (college)



where CMA represents college math achievement (1 for successfully completed and 0 for not successfully completed), and SW is a dummy variable indicating whether the student was enrolled in Statway (coded as 1) or one of the matched comparisons (coded as 0). As a further safeguard, we included individual students’ propensity scores, PS, as an additional adjustment variable.
The results presented in Table 3 indicate that on average, Statway students demonstrated significantly higher odds of success, 5.31 and 7.40 (95% confidence intervals [CIs] = [4.54, 6.21] and [6.20, 8.85]), in achieving college-level mathematics credit than the comparison students for Years 1 and 2, respectively. These translated into the estimated probabilities of success of 54.43% and 55.26% for the Statway groups and 18.36% and 14.30% for the comparison groups for Years 1 and 2. 4 In addition, we found variation among colleges in student success (0.239 and 0.342 for the Years 1 and 2 variances). Figure 4 shows that for both cohorts, students in all but one college demonstrated greater success in Statway.
Model-Based Estimation of Statway Effect on College Math Achievement.

Note. The dfs, chi-square statistics, and p values are derived from penalized quasi-likelihood estimation but reported here to indicate approximate significance levels for the random effects.
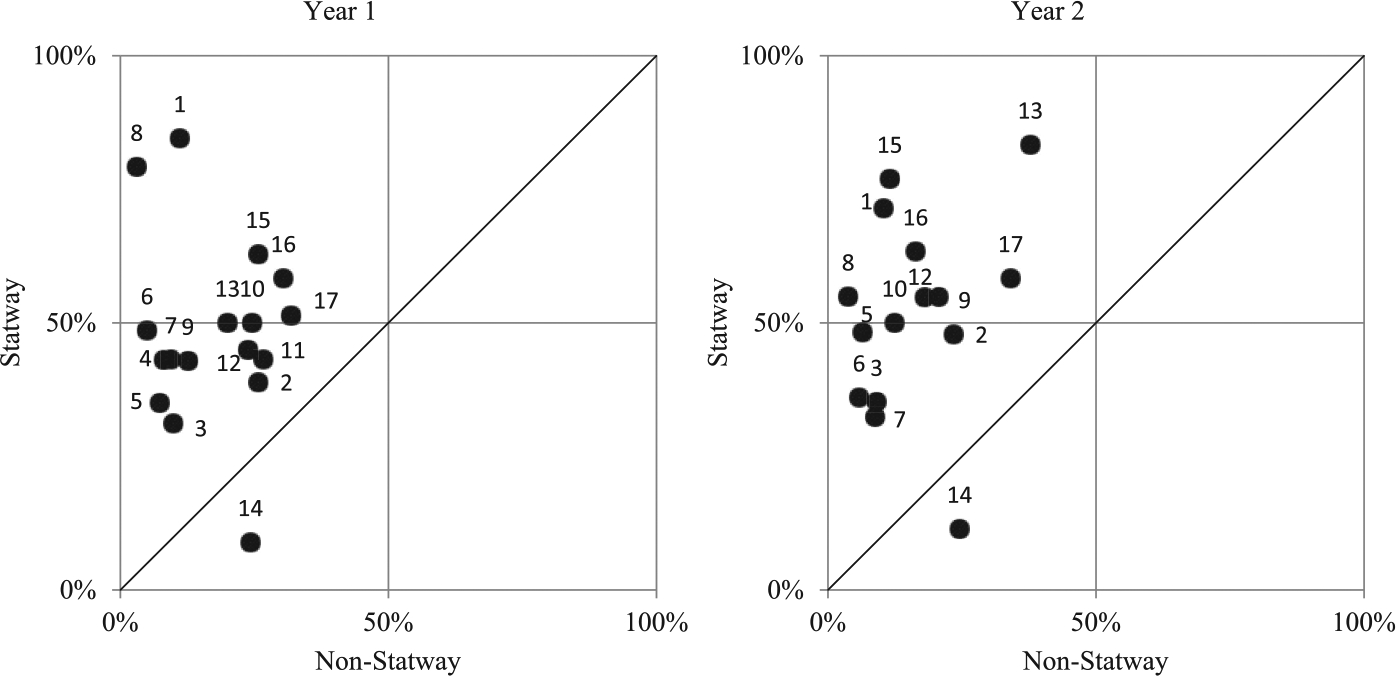
Comparative success rates by college—Year 1 (left) and Year 2 (right).
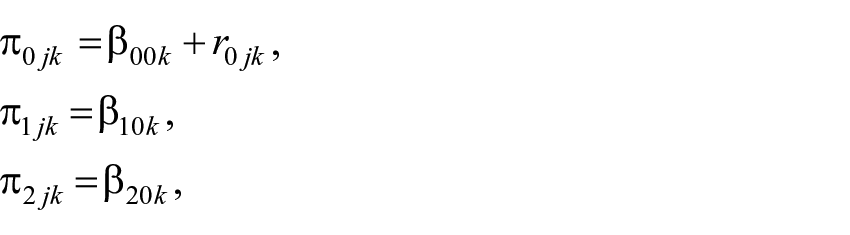
To estimate differences in college credits earned with a grade of C or higher in the subsequent year, we formulated a three-level Poisson model and estimated its model parameters using penalized quasi-likelihood estimation. 5 λ ijk represents the event rate that student i within faculty member j’s class in college k successfully earns college credits in the following year. Thus, η ijk is the corresponding log of this event and formally expressed as follows:
Level 1 Model (student)



Level 2 Model (faculty)
Level 3 Model (college)
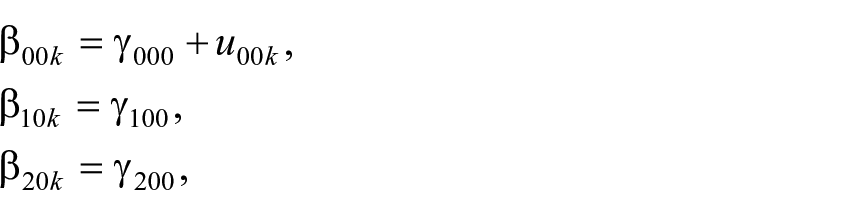
where CCE represents accumulated college-level units earned with a grade of C or higher in the subsequent year. 6
The results presented in Table 4 indicate that on average, Statway students earned significantly more college credits than their matched comparison (with a higher event rate ratio, 1.37, 95% CI = [1.11, 1.69]). The estimated accumulated credits for the Statway and matched comparison groups were 5.57 versus 4.08, respectively. We again found variation among colleges (variance = 0.320). Figure 5 depicts that in the majority of colleges, Statway students earned more college credits in the subsequent year than their matched comparisons.
Model-Based Estimation of Statway Effect on Accumulated College Credits Earned in the Subsequent Year—Year 1.

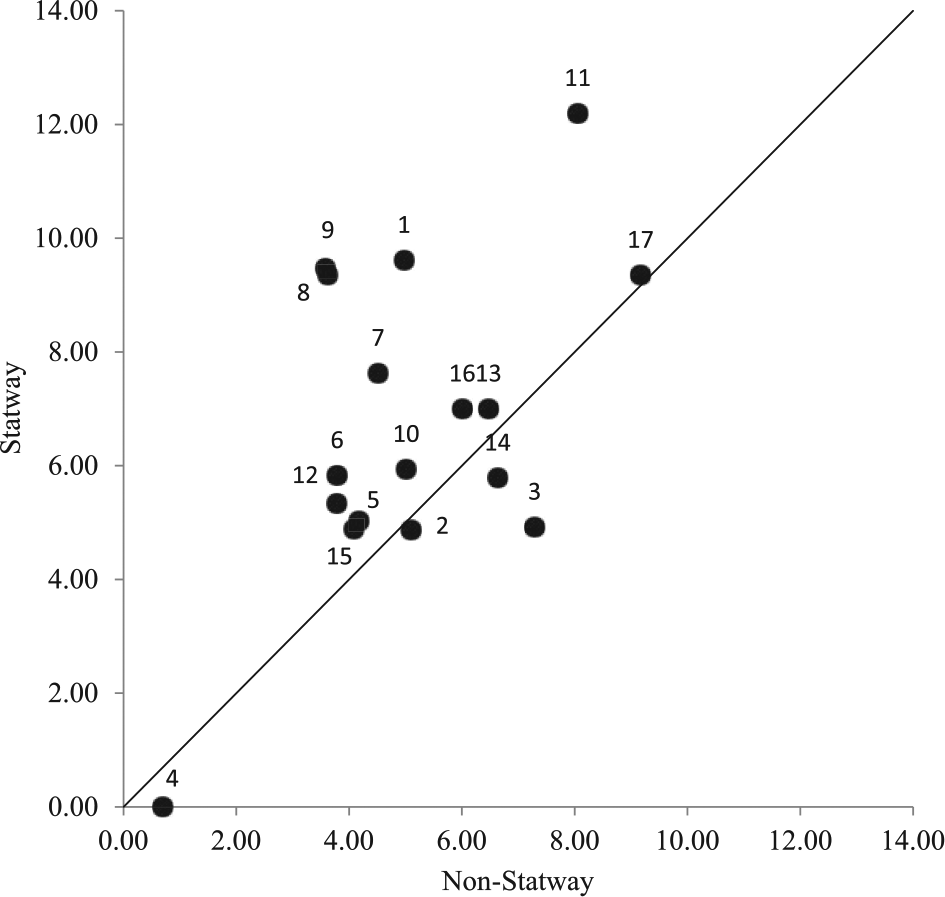
Comparative college-level credits accumulated in the subsequent year by college—Year 1.
Subgroup Analyses
To examine possible differential effects of Statway (a) by gender and race/ethnicity subgroups and (b) by math placement levels, we formulated a three-level HLM similar to those described above. In these subgroup analyses, however, we applied effect coding to the grouping variables to directly represent both main and interaction effects on the outcome. The reference categories were female, White, and a math placement three or more levels below college. Each of these was coded as -1. We excluded cases with the unknown gender status or the college math placement level.
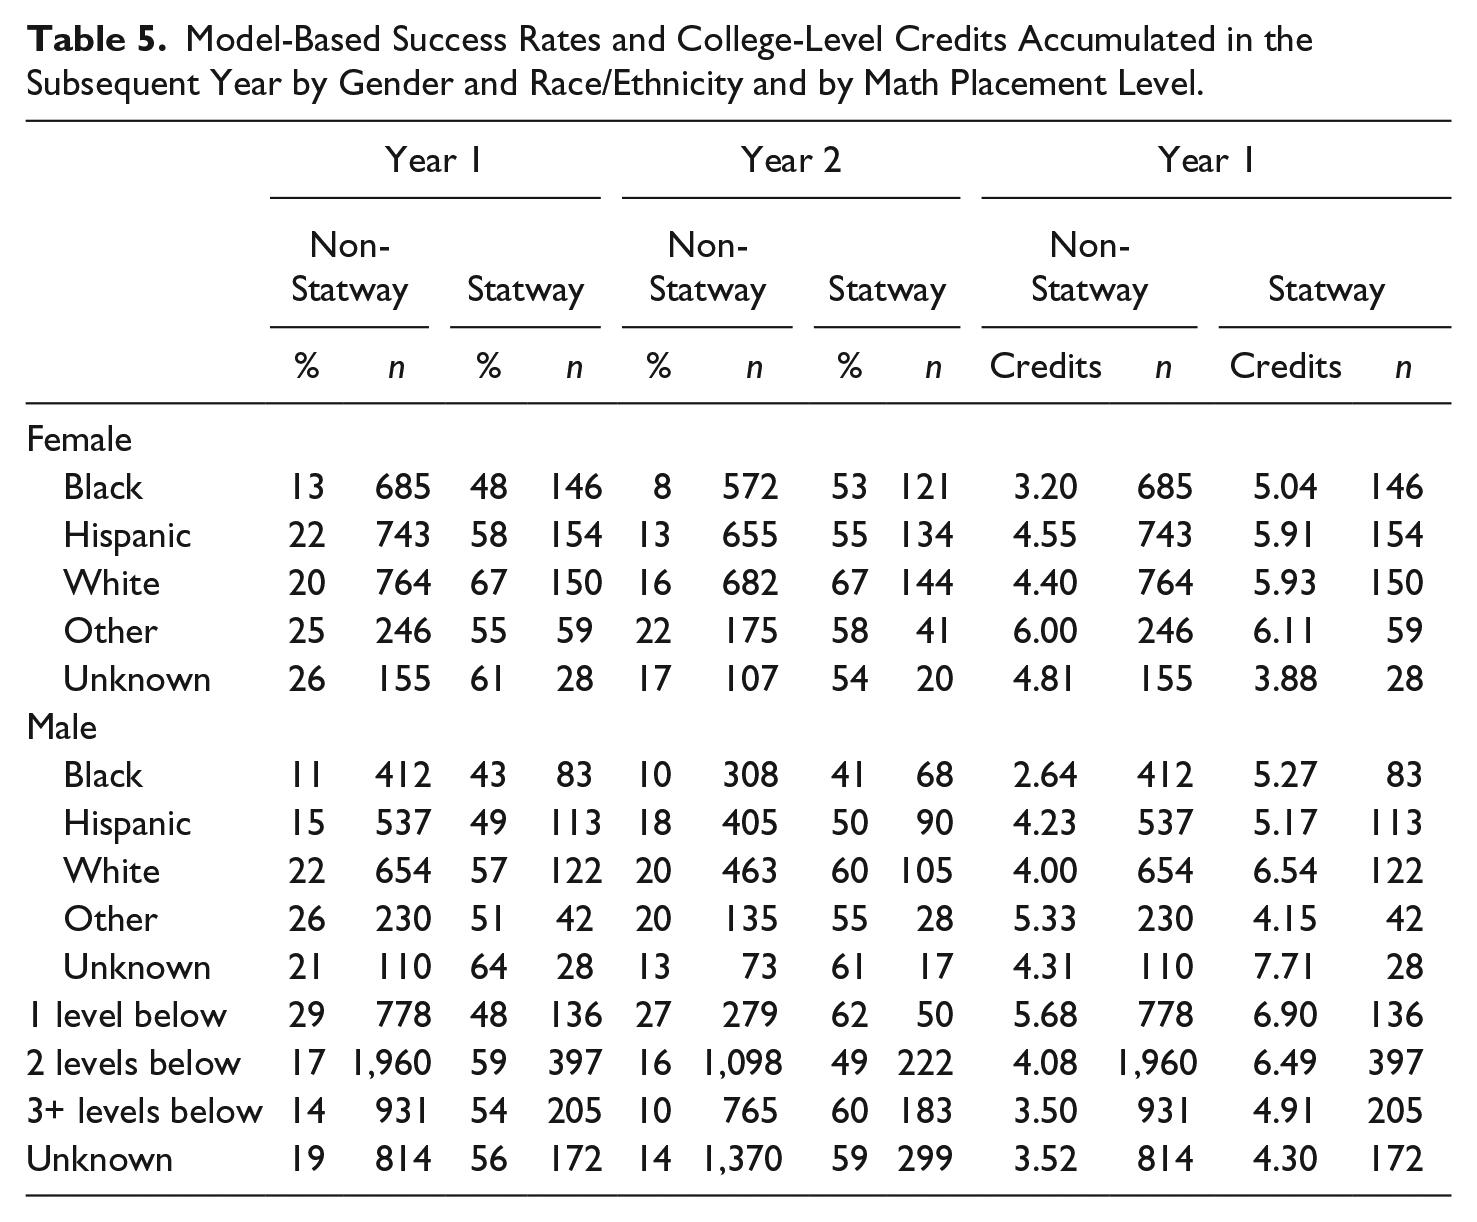
Table 5 presents the model-based results transformed back into their natural metrics of proportion of students successfully acquiring college math credit and accumulated college credits earned in the follow-up year. This metric transformation was made for the ease of interpretation. The left and middle panels of Table 5 present the estimated proportions successful by gender and race/ethnicity and by math placement level. In general, large positive Statway effects appear consistently for all subgroups of students. The only exception was a somewhat smaller effect among Year 1 students who were placed one level below college level. Likewise, the right panel of Table 5 presents the estimated college credit accumulation by gender and race/ethnicity and math placement level. Positive effects of Statway were observed for each major race/ethnicity group: Black, Hispanic, and White. Also, regardless of math placement levels, overall, Statway students performed better than the comparison students. The effect appears the largest among students who were placed two levels below college level. The latter is not surprising as this was the subgroup of students whose outcomes Statway was specifically designed to improve.
Model-Based Success Rates and College-Level Credits Accumulated in the Subsequent Year by Gender and Race/Ethnicity and by Math Placement Level.
Discussion
The current study sought to undertake a rigorous causal analysis of Statway’s effectiveness for community college students. To assess this, we used a propensity score matching technique (Rosenbaum & Rubin, 1983) within an HLM framework (Raudenbush & Bryk, 2002). Given the modest number of students participating in Statway in each college as compared with the college’s population of developmental math students, we were able to secure a very high degree of propensity score matching across 44 different indicators. We also undertook a sensitivity analysis to examine the robustness of the estimated effects for possible unmeasured covariates. Given the large size of the estimated effects complemented with the results from the sensitivity analysis, we conclude that there is strong evidence that Statway substantially improves student success rates in acquiring college-level math credit. Our results also suggest that significant Statway effects persist into the following school year. Statway students accumulated more college credits in the follow-up year than their matched comparisons. We speculate that the latter may be a consequence of Statway’s emphasis on strengthening student growth mindset as a mathematical learner and doer and enhancing students’ sense of belonging in a mathematical environment. These are the major foci for productive persistence, one of the six key drivers of Statway (see Figure 2).
These results are replicated across two different implementation cohorts. We also found significant improvements for all gender and race/ethnicity groups as well as for students with different math placement levels. The results suggest that Statway effectively advances more equitable outcomes for disadvantaged students than has been documented with traditional developmental math curricula and instruction (Bailey et al., 2010; Carnevale & Desrochers, 2003; National Research Council, 2002).
Our findings are consistent with the hypothesis formulated by Hodara (2013) that
structural changes to the developmental sequence may have limited effects, but the combination of structural, curricular, and pedagogical changes to a developmental math sequence as well as the provision of non-academic supports can impact the college success of students in long-lasting, meaningful ways. (p. 29)
First, Statway accelerated the developmental math course-taking process and reduced the time required to earn college credit in one year by integrating developmental math skills and college-level statistics. This structural feature contributes to minimizing the confusion and ineffectiveness of the developmental system (Bailey et al., 2010). Second, the Statway instructional system is grounded in research-based learning principles: productive struggle, explicit connections to concepts, and deliberate practice (Boaler, 1998; Ericsson, 2008; Ericsson et al., 1993; Hiebert & Grouws, 2007; Pashler et al., 2007; Schmidt & Bjork, 1992). This instructional system helps to improve the content and pedagogy of developmental math and foster deeper student learning. Third, this system also integrates two types of research-based supports for students. One pertains to social-psychological factors of student learning (productive persistence) to sustain students’ engagement and persistence (Dweck et al., 2011; Jamieson et al., 2010; Walton & Cohen, 2011; Yeager & Walton, 2011), and the other addresses language and literacy barriers to make leaning accessible to students (Gomez et al., 2015; Gomez et al., 2013). Fourth, Statway provides faculty with a rich set of opportunities for professional development to advance the quality of their teaching of Statway and quite possibly beyond as well (Edwards et al., 2015; Grubb, 1999; Grubb & Gabriner, 2013). Finally, Statway is organized as a NIC to accelerate collaboration and learning among college faculty and administrators, improvement specialists, and educational researchers (Bryk et al., 2011; Dolle et al., 2013). Although highly speculative, there is also the possibility of significant derivative effects associated with faculty participation in the Statway NIC. Although anecdotal in form, individual Statway faculty members have reported that their experiences here are changing the way they teach more generally as well as how they think about student learning. This is a tantalizing hypothesis that merits future empirical scrutiny.
It is important to acknowledge some limitations of the present study. First, although we identified large effects of Statway across two different implementation cohorts (complemented with the results from the sensitivity analyses), the matched comparisons in this study were not fully contemporaneous with Statway students. To allow comparison students to complete their program of study in two years and then permit us to follow up both groups for another year, comparison students began essentially a year earlier than Statway students. This raises the possibility of cohort effects that might confound our results. However, we found no evidence of a significant overall improvement in outcomes over that two-year period in the data provided by college institutional researchers on all of their developmental math students. If cohort effects were operating, we would expect to see this improvement. Regardless, it is important to consider this alternative hypothesis in future analyses as more data become available over time. To do this, we would need to match comparison students from the same enrollment cohorts and then follow them forward for staggered periods (i.e., two years for Statway students and three years for the matched comparisons).
Second, no information on programs of study or majors declared was available for use in propensity score matching in this study. Although the reliability of such data has been questioned (for example, see Jenkins & Cho, 2012), information on students’ declared programs of study or majors might further improve the matching of non-Statway students with Statway students especially in cases where prior course-taking data are limited (e.g., the first semester students).
Third, we also want to examine performance for the Year 2 cohort in the follow-up year to see whether the results on increased college course credit accumulation also replicate. Even longer term as more extended longitudinal data become available, we want to examine more distal outcomes such as transfer rates and academic success of Statway students in four-year institutions. These analyses would further illuminate the dimensions and possible limitations of Statway’s effectiveness.
Finally, we note that we found no evidence in our analyses of significant variability in student outcomes among faculty within colleges. However, up to this point in time, the number of faculty members teaching Statway per college has been small, and therefore, the power to detect such variation in performance has been limited. As the Statway initiative now starts to scale to many more sections within colleges, future studies should explicitly focus here. It is important to investigate whether the effects reported in this study generalize as a larger and presumably more diverse sample of faculty subsequently take up this work.
In conclusion, these overall results suggest that Statway is a very promising alternative to the traditional developmental algebra pathway. It is also an effective solution that advances equity. Statway takes a holistic, systemic approach as a multifaceted change initiative to tackle complex problems in developmental math education. Addressing all those issues simultaneously makes Statway distinct from traditional developmental math programs and seems the key to student success. Through a NIC structure, college faculty and administrators, improvement specialists, and educational researchers collaborate with each other and accelerate learning to improve Statway to change developmental math education from crisis to hope for students to sustain their academic and career aspirations.
Footnotes
Appendix
Declaration of Conflicting Interests
The authors declared no potential conflicts of interest with respect to the research, authorship, and/or publication of this article.
Funding
The authors disclosed receipt of the following financial support for the research, authorship, and/or publication of this article: This program of work is supported by the William and Flora Hewlett Foundation, the Bill & Melinda Gates Foundation, the Lumina Foundation, the Kresge Foundation, the Carnegie Corporation of New York, the Great Lakes Higher Education Corporation, and the National Science Foundation’s grant DUE-1322844.
Notes
Author Biographies
References
Supplementary Material
Please find the following supplemental material available below.
For Open Access articles published under a Creative Commons License, all supplemental material carries the same license as the article it is associated with.
For non-Open Access articles published, all supplemental material carries a non-exclusive license, and permission requests for re-use of supplemental material or any part of supplemental material shall be sent directly to the copyright owner as specified in the copyright notice associated with the article.
