
Abstract
Keywords
2-year colleges, also known as community or junior colleges, have traditionally served as educational bridges between high schools and universities, providing open admission, affordable tuition, and developmental education (noncredit-bearing courses, also referred to as remedial education or basic skills). Community colleges provide a critical entry point into postsecondary education, and compared to 4-year colleges, serve a higher proportion of first-generation, low-income, and post-traditional students (Horn, 2007; Shapiro et al., 2013). These student populations tend to be older, are enrolled part-time, and often work full-time and have dependents. As of Fall 2015, community colleges educate 41% of America’s undergraduate student population (American Association of Community Colleges, 2017) and strive to meet our country’s increasing demands for higher education accessibility, remediation, and equity. Researchers suggest that community colleges are valuable components of our nation’s democracy and economy, and the financial disparities that plague our country would be much more severe without these colleges assisting in maintaining a competitive workforce and sustaining America’s middle class (Mellow & Heelan, 2008). Nevertheless, community colleges are often equipped with limited resources and insufficient funding compared to 4-year institutions (Center for Minority Serving Institutions, 2015; Cunningham, Park, & Engle, 2014; Garcia, 2018).
A certain subgroup of community colleges, classified as minority-serving institutions (MSIs), have a unique mission to serve student populations that have traditionally been disadvantaged or excluded from higher education based on their racial or ethnic identities. 1 Over one fifth of community colleges nationwide qualify as MSIs (Center for Minority Serving Institutions, 2015). MSIs include Historically Black Colleges and Universities (HBCUs), Hispanic Serving Institutions (HSIs), Tribal Colleges and Universities (TCUs), Alaska Native and Native Hawaiian–Serving Institutions (ANNHs), Native American Serving Nontribal Institutions (NASNTIs), Predominately Black Institutions (PBIs), and Asian American and Native American Pacific Islander–Serving Institutions (AANAPISIs; Office of Civil Rights, n.d.). Institutions apply through the U.S. Department of Education to be designated as an MSI. The institution must enroll significant percentages of undergraduate minority and lower income students and meet the minimum eligibility thresholds required by each type of MSI. For example, to qualify as an AANAPISI, 10% of an institution’s undergraduates must be Asian American, Native American, and/or Pacific Islander and 50% of degree-seeking students must receive financial assistance through Pell Grants, Federal Supplemental Educational Opportunity Grants (FSEOG), Federal Work–Study, or Federal Perkins Loans (U.S. Department of Education, n.d.). After receiving MSI designation, institutions are then eligible to apply for federal grant funding and resources aimed specifically at improving the capacity of MSIs (Office of Civil Rights, n.d.). 2-year MSIs have demonstrated remarkable success in improving higher education access and attainment and play an important role in promoting students’ social mobility (Center for Minority Serving Institutions, 2015).
Despite their important role in American higher education, 2-year MSIs have limited revenues, especially compared to their non-MSI and 4-year counterparts. In efforts to fulfill their mission of serving historically underrepresented students, MSIs keep tuition costs relatively low, especially at 2-year colleges, where the average annual cost of tuition and fees in 2012-13 was US$3,874, compared to US$8,118 at non-MSIs (Cunningham et al., 2014). In addition, as Cunningham and colleagues (2014) report, most colleges have had to deal with cuts to state appropriations during economic downturns, but MSIs are particularly underresourced and spend less per student, which may affect their capacity to provide necessary academic and student support services. In addition, federal funds allocated for MSIs have declined or remained flat in recent years. MSIs also receive less funding from private gifts, grants, contracts, and investment returns (Cunningham et al., 2014). Because they operate under tight fiscal constraints, MSIs may be particularly vulnerable to the negative consequences of a widely spreading state policy called performance funding.
A national trend toward a new funding model for higher education—performance funding—has caused researchers and policy organizations to question its potential disparate impacts on MSIs in particular (Boland & Gasman, 2016; Jones, 2014). Specifically, performance funding is a state budgeting model that ties a portion of appropriations to public colleges and universities based on student progression and outcomes (Dougherty & Reddy, 2013) as opposed to more traditional budgeting models that are primarily incremental and often input or cost based (Hearn, 2015). The rise of this policy has been fueled by concerns over inadequate student retention and completion rates, increasing college costs and student debt levels, and economic recessions that have necessitated fiscal scarcity and fueled calls for accountability (Dougherty et al., 2014; Li & Zumeta, 2015). In recent years, performance funding has experienced a surge in prevalence. In fiscal year (FY) 2016, 32 states had implemented or were currently implementing a policy, and of these states, 21 states had a policy for 2-year colleges (National Conference of State Legislatures, 2015; Snyder & Fox, 2016). These funding models increasingly have higher stakes attached; between 2000 and 2013, 21 states adopted models that link base appropriations to performance metrics (rather than awarding bonus funds based on performance metrics; Li, 2017a).
Compared to 4-year institutions, less research has been conducted on the impact of performance funding at 2-year colleges. Furthermore, research that focuses on funding distributions to 2-year MSIs and how they change under performance funding are nonexistent. Only two publications, to our knowledge, examine performance funding and 2-year MSIs explicitly. The first is Jones’s (2014) policy report on performance funding policy design for MSIs. The second is Ness, Deupree, and Gándara’s (2015) study on campus responses to these policies, which focused on four institutions in Tennessee, including one PBI.
Purpose of Study
Given the dearth of research on performance funding and 2-year MSIs, the purpose of this study is to examine how state appropriations were distributed to 2-year MSIs and non-MSIs under performance funding. Beyond total funding distributions, we explore how MSIs and non-MSIs generate funds from specific performance metrics. For the analysis, we focus on Texas and Washington because both states house numerous MSIs and have well-developed 2-year systems. Texas has 50 public community college districts, some of which have multiple campuses, and 10 technical colleges (Texas Association of Community Colleges, n.d.; Texas State Technical College, n.d.). Washington’s system consists of 34 community and technical colleges (Washington State Board for Community and Technical Colleges, 2018a). Furthermore, half of Texas’s community college districts and nearly one third (10) of Washington’s campuses are MSIs (Center for Minority Serving Institutions, n.d.).
Upon its inception in 2007, Washington’s performance funding policy was innovative in that the formula funded student milestones found to be critical to the pathway to graduation (Leinbach & Jenkins, 2008), such as persisting after the first year and passing certain gatekeeper courses (i.e., credit-bearing courses that serve as a “gateway” to continuation in a field of study; HCM Strategists, 2011; Washington State Board for Community and Technical Colleges, 2018b). Washington’s policy, also known as the Student Achievement Initiative (SAI), awards points to each college based on the number of students who reach each milestone (i.e., performance metric) and calculates funding allocations based on this point system. Texas’s policy, known as the Student Success Points Model, was informed by that of Washington’s and considers student milestones toward degree completion while also calculating points for each performance metric. We focus solely on community colleges in Texas and not technical colleges because the state has a separate funding formula for the Texas State Technical Colleges.
A small literature base has specifically examined Washington’s and Texas’s performance funding policies. Using data on Washington State from years 2002 to 2012, Hillman, Tandberg, and Fryar (2015) found that the SAI had produced no aggregate changes to retention rates or associate’s degrees. However, the policy did result in greater completions of short-term certificates. This is worrisome given that a study using Washington data found that short-term certificates generally offer very limited labor market value, especially compared to long-term certificates and associate’s degrees (Dadgar & Trimble, 2015). Interviews conducted in Washington State in 2014 revealed that administrators, faculty, and staff expressed concerns about the underlying idea of quantifying student success using a point system, as the SAI did, and were skeptical about data accuracy and tracking. Nevertheless, the SAI had gathered greater support in recent years among administrators and faculty compared to the support following its initial inception (Li, 2017b).
A revision to the SAI in 2012 sought to advance policy goals to serve historically underrepresented students in addition to the existing goal of the policy to improve credential completions (Kaikkonen, 2016). Specifically, the policy revision increased incentives for students in developmental education and precollege courses to provide support for colleges to serve students with a longer time to completion. Examining data from 2011-12 through 2014-15, Kaikkonen (2016) concluded that overall, there were no changes to degree completions but there were decreases in student enrollment, which consequently decreased the number of SAI points earned by students in basic skills, precollege English, and precollege math. These decreases were partially explained by colleges reducing their precollege course sequence to facilitate students moving through college faster.
Turning to Texas, before the legislature implemented its performance funding policy for 2-year colleges, McKinney and Hagedorn (2017) used existing data to predict that the following groups would yield lower revenue under the performance-based model: African American students, students over the age of 19, students who had earned general equivalency diplomas (GEDs) rather than high school diplomas, part-time students, and those who qualified for the lowest levels of remedial coursework. The authors concluded that Texas’s case might serve as a “cautionary tale,” given the potential for institutions to turn away students who garner lower revenue levels under the performance-based model (McKinney & Hagedorn, 2017, p. 179).
Literature on performance funding in the 2-year sector is still developing, and additional research could better inform the design and implementation of the policy. In this study, we compare state appropriations to 2-year MSIs and non-MSIs and explain the extent to which performance funding policies affect higher education equity with respect to serving disadvantaged students. In addition, our research offers design recommendations for policy makers to consider when adopting and revising performance funding models. Specifically, we address the following questions:
Conceptual Perspectives: Vertical and Horizontal Equity
This study addresses questions of equity in resource allocations to community colleges that serve large proportions of underrepresented minority students. As such, we use a funding equity framework to guide this work. Specifically, following Dowd and Grant’s (2006) framing for their study of community college finance and their useful summary of the different meanings of equity in community college finance, we anchor this study in conceptual perspectives on vertical and horizontal equity. Although definitions of equity abound, two helpful conceptions of equity—vertical and horizontal equity—have been employed to examine state funding distributions to public schools (Berne & Stiefel, 1984).
Horizontal equity is defined as the equal treatment of equals; in this study, horizontal equity would result from appropriating equal funds to institutions considered to be equal to one another. A simple funding formula that only takes colleges’ enrollments into account would constitute a horizontal equity approach if the only criterion for equality between institutions is enrollment size. Vertical equity, conversely, refers to the unequal treatment of unequals. A vertical equity funding framework recognizes that not all institutions (or the groups of students they serve) are equal. This approach acknowledges social injustices that have resulted in some groups being privileged over others in educational opportunity and success. The federal government’s MSI grants program represents one effort to pursue vertical equity.
Under vertical equity, community colleges that enroll students who have historically been underserved would receive more funding than others. This approach is akin to methods used in equalization funding formulas for K-12 schools. Vertical and horizontal equity are not mutually exclusive, and as Musgrave (1959) argues, the requirements for achieving these two types of equity are “different sides of the same coin” (p. 161). For example, it is possible to have a state with a funding formula designed to pursue horizontal equity that only takes enrollments into account. Beyond that formula, however, the state government may allocate special funds to institutions with large proportions of low-income students. This latter portion of the funding model would acknowledge inequities in institutions’ circumstances and seek vertical equity.
As Berne and Stiefel (1984) have argued with respect to public K-12 education, students (and the institutions that serve them) are hardly equal to one another. Yet, determining which institutions are equal to one another is a subjective endeavor. One method for determining how much differentiation in funding is appropriate to make schools more equal to one another is by examining outcome equity (Verstegen, 1998). Using this perspective, state appropriators determine the degree to which funding redistributions are necessary to yield comparable outcomes (e.g., standardized test scores or other performance metrics) between lower and higher resourced institutions (Baker & Green, 2015). In this study, we do not assess outcome equity; we focus on resource equity or an input-driven approach to equity (Lee & Wong, 2004).
We acknowledge that MSIs and non-MSIs are not equal. First, MSIs’ revenues from all sources are lower than those at non-MSIs (Cunningham et al., 2014). All sources should be considered in determining funding equity. For instance, although state funding may not be lower for institutions with larger proportions of racial or ethnic minority students, other sources of revenue may be lower. As noted earlier, revenues from contracts, grants, investment returns, and private gifts are lower at MSIs compared to non-MSIs (Cunningham et al., 2014). Melguizo and Kosiewicz (2013), who found that local funding for institutions with larger proportions of underrepresented minority students is lower than for those with smaller proportions, argue that the state should use local sources to compensate for this reduced funding.
Second, MSIs serve large proportions of racial or ethnic minority and low-income students, which tend to have lower levels of academic achievement (Gasman & Conrad, 2013) and face other social and structural barriers (including attending lower resourced institutions) when they enter higher education (Garcia, 2018; Melguizo & Kosiewicz, 2013). Recognizing the importance of campus resources for student success (Bound, Lovenheim, & Turner, 2010), we argue that vertical equity—higher levels of state funding to MSIs—is warranted. Horizontal equity, in contrast, would amount to treating unequals equally.
Equity and Community College Finance
Equity considerations can be embedded within any of the aforementioned funding models. Within performance funding models, traditional metrics may not fully capture the unique goals of MSIs as the metrics focus heavily on outputs (Jones, 2014). Coincidentally, more states have recently incorporated metrics to promote the success of underserved student populations. States are providing additional funding for colleges to retain and graduate students from underrepresented backgrounds, including Pell Grant recipients and racial or ethnic minorities (e.g., Blacks/African Americans, Hispanics, Latina/os, Native Americans, and/or Alaska Natives; 2 National Conference of State Legislatures, 2015). The creation of such metrics resulted in part from concerns over unintended consequences of performance funding, which include evidence of increasing selectivity to admit more students with a higher likelihood of graduating (Lahr et al., 2014). Research suggests equity metrics can help mitigate such unintended consequences (Gándara & Rutherford, 2017).
Washington and Texas, whose models are described in detail below, do not specifically target minority populations nor the institutions that serve larger proportions of these students (i.e., MSIs). Nevertheless, this omission aligns with the goals for the performance funding policies in these states. The impetus for performance funding in both Texas and Washington was primarily to increase accountability to public colleges and universities in the state (Gándara, 2016; Washington State Board for Community and Technical Colleges, 2018b) and not explicitly to address access or equity.
Alternative funding approaches could also be used to address equity. For instance, in lieu of performance funding, states could allocate more funding (e.g., a base funding amount) to institutions with large percentages of students who are members of traditionally underserved groups, as with supplemental and concentration grants in California’s public school funding model (California Department of Education, n.d.). Our research design is guided by these perspectives on community college finance and equity.
Research Design
Texas began allocating performance funds in 2014-15 (FY 2015) through the Student Success Points Model. Washington began allocating performance funds in 2008-09 (FY 2009) through the SAI. To provide an adequate number of years of data before Washington’s policy began, we collected data starting from 2004-05, with the latest year being 2014-15.
Data Sources
Data sources for this study included publicly available data sets from the state higher education agencies: the Texas Higher Education Coordinating Board and the Washington State Board for Community and Technical Colleges, as well as the Integrated Postsecondary Education Data System (IPEDS). Sources consisted of annual reports and data files that describe enrollments, completions, revenues and expenditures, performance funding points, and performance funds allocated.
For Texas, data on state funding and enrollments were collected from the state’s administrative data system managed by the Texas Higher Education Coordinating Board. Specifically, we used formula funding data available through the Finance and Resources Planning section of the coordinating board’s website. This data set includes funding allocated to each institution through performance funding and the points earned by each institution under the performance funding model. We also gathered data from the coordinating board’s Higher Education Accountability System. From this source, we used data on Fall headcount enrollments and on total state funding per full-time equivalent (FTE) student.
For Washington, we collected data on state funding and enrollment from the IPEDS. State appropriations data came from the IPEDS Finance component, defined as funding allocated to institutions through acts of a state legislative body, excluding grants, contracts, and capital appropriations. For enrollment, we used 12-month FTE enrollment for each academic year, gathered from the IPEDS 12-month enrollment component. Data sources for performance fund allocations included the Academic Year Reports published on the website for the Washington State Board for Community and Technical Colleges. 3 We collected data from these PDF reports for 2009-10 through 2014-15.
Defining MSIs
In our exploration of MSIs, we discovered that there exists conflicting information on which colleges are designated as MSIs during each year. For instance, the Department of Education maintains a list of colleges that applied to and were awarded Title V funds for the Developing HSI Program from FY 2009 to FY 2016, 4 as well as grant awards for the AANAPISI Program from FY 2012 to FY 2017. 5 However, these lists only provide year-by-year information for a segment of our years of analysis, and only for colleges that were successful in securing Title V grants. We also considered the Penn Center for Minority Serving Institutions, which provides an MSI directory. 6 However, the directory does not report changes to MSI designations; that is, it is unclear the year in which each listed institution became an MSI. Therefore, we decided to define MSI status according to select criteria from the Department of Education.
We collected lists of all institutions eligible for Title III and Title V funds from the Department of Education, for all years ranging from FY 2005 to FY 2015. Next, we collected data from the IPEDS Fall Enrollment Survey, specifically, the grand total of all degree/certificate-seeking undergraduate students enrolled for credit during each Fall. For HSIs, we calculated the percentage of Fall enrollment of students who were Hispanic or Latino. For AANAPISIs, we calculated the combined percentage of Fall enrollment of students belonging to any of the following three categories defined by the IPEDS new race definitions (Fall 2008 onwards): Asian, American Indian or Alaska Native, and Native Hawaiian or Other Pacific Islander. In the IPEDS old race categories, we combined (a) Asian or Pacific Islander total and (b) American Indian or Alaska Native total.
According to the Title V section of the Higher Education Act of 1965, an institution that “has an enrollment of undergraduate full-time equivalent students that is at least 25 percent Hispanic students” allows it to be eligible for HSI status (U.S. Department of Education, 2014, p. 691). Because the FTE undergraduate student variable is unavailable in IPEDS, we chose to use the Fall enrollment variable, detailed in the previous paragraph. An AANAPISI is defined as having “an enrollment of undergraduate students that is not less than 10 percent students who are Asian American or Native American Pacific Islander” (U.S. Department of Education, 2014, p. 137). For each academic year, we coded colleges that enrolled 25% or higher Hispanic/Latino students and were eligible for Title III and V funding as HSIs. Similarly, we coded colleges that enrolled 10% or higher Asian, American Indian or Alaska Native, and Native Hawaiian or Other Pacific Islander and were eligible for Title III and V funding as AANAPISIs. Note that some colleges were eligible for Title III and V during one year but not the next, and other colleges changed their percentages of student enrollment to meet (or no longer meet) the minority student threshold. Colleges must have met both the Title III and V eligibility criteria and the students of color enrollment criteria to be defined as an MSI in our data set. As a result, certain colleges were defined as an MSI in one year but not the next. We believed it was important to account for changes in MSI eligibility from year-to-year, especially as we were exploring funding allocations across time. Accommodating this temporal variation in MSI status for each college provides more precision in grouping colleges into an MSI versus non-MSI group during each year and is a unique contribution of our study.
Method
To address our first research question of whether performance funding models are associated with state appropriations to 2-year MSIs, we explored aggregate differences between MSIs versus non-MSIs, before and after performance funding. In each state, we created two groups: MSI and non-MSI, and calculated the median amount of state funding per FTE for each group across each year from 2004-05 through 2014-15.
Subsequently, we addressed our second research question on how MSIs fared under each performance metric in the Texas and Washington funding formulas. We examined the total performance points earned by each college, and the points earned on individual performance metrics. Again, we created an MSI group and a non-MSI group for each year and calculated the median value of performance points earned. Next, we provide background on performance funding and policy design, then describe the state funding allocations to MSIs versus non-MSIs and points earned on performance metrics in the funding formula for Texas and Washington, respectively.
Student Success Points Program in Texas
Community colleges in Texas enroll more than half (51.5%) of all students in public higher education institutions and provide access to college to more students in Texas than any other sector (Texas Higher Education Coordinating Board, n.d.). In the Fall of 2016, total enrollment at community colleges was 712,554 (Texas Association of Community Colleges, 2017). Among the 50 community college districts in Texas, 21 met MSI-eligibility criteria in the latest year of our analysis (2014-15). 7 As discussed in the “Method” section, this number varied across years. Of the colleges that met MSI-eligibility criteria between 2004 and 2015, all were HSIs. One district, the Houston Community College System, was also an AANAPISI. Most districts in the system are single-campus districts.
Before the implementation of performance funding in the 2014-15 biennium (two-year budgeting cycle), state allocations for community colleges were determined using an instruction and administration formula (Legislative Budget Board, 2013). Under this model, the state allocated funds based on contact hours, weighted differentially by discipline. In FY 2011, institutions received 29.9% of their operating revenues from state appropriations, 32.8% from tuition and fees, 31.9% from property taxes, and 5.4% from federal funds (Legislative Budget Board, 2013). Prior to performance funding implementation, some institutions also received supplemental funding for dramatic enrollment growth, diseconomies of scale (small-institution funding), and bachelor’s degrees in applied technology.
In 2011, the Texas Legislature adopted House Bill 9, which directed the coordinating board to develop a performance funding model in consultation with institutional representatives. The Texas Higher Education Coordinating Board (THECB) and the Texas Association of Community Colleges, a group that represents and advocates for community colleges in Texas, formally proposed the recommended model—titled the Student Success Points Program—to the legislature. The legislature adopted this new model in 2013 and first used it to determine 2014-15 funding allocations (Texas Association of Community Colleges, n.d.).
The Student Success Points Program design was informed by Ewell’s (2006) Milestone Events Model (Texas Association of Community Colleges, 2013). This type of funding model, which Washington State’s performance funding program was also designed after, accounts for students’ varying levels of college readiness. Specifically, the Student Success Points Model applies to all public community colleges and has three components: core operations, weighted contact hours, and success points (Texas Association of Community Colleges, 2013). For core operations, each community college district receives US$1 million per biennium (i.e., every 2 years). Aside from core operations, 90% of formula funding is distributed based on weighted contact hours. The remaining 10% is allocated based on institutions’ success points, which are earned through performance metrics. The Student Success Points Model includes the following metrics presented in Table 1: developmental education in math, reading, and writing; first college-level course passed in math, reading, and writing; completion of 15 and 30 semester credit hours; degrees or certificates awarded; and transfer to university after 15 semester credit hours. Additional funding is awarded for developmental education in math, college-level courses passed in math, and degrees awarded in critical fields, including in science, technology, engineering, and mathematics (STEM) and allied health (Texas Association of Community Colleges, 2013).
Median Student Success Points per Fall Headcount Enrollment in Texas by MSI Status, FY 2014 to 2015.

Note. MSI = minority-serving institution; Dev ed = developmental education; FY = fiscal year.
Denotes higher Student Success Points for MSIs relative to non-MSIs.
In 2014-15, the first biennium the Student Success Points model was utilized, a total of US$172 million was awarded based on the Student Success Points Model. The model calculated 3-year averages (2010, 2011, and 2012) of the total success points accumulated by each institution to determine performance funding allocations to each college (Texas Association of Community Colleges, n.d.).
State Funding Allocations to MSIs and Non-MSIs in Texas
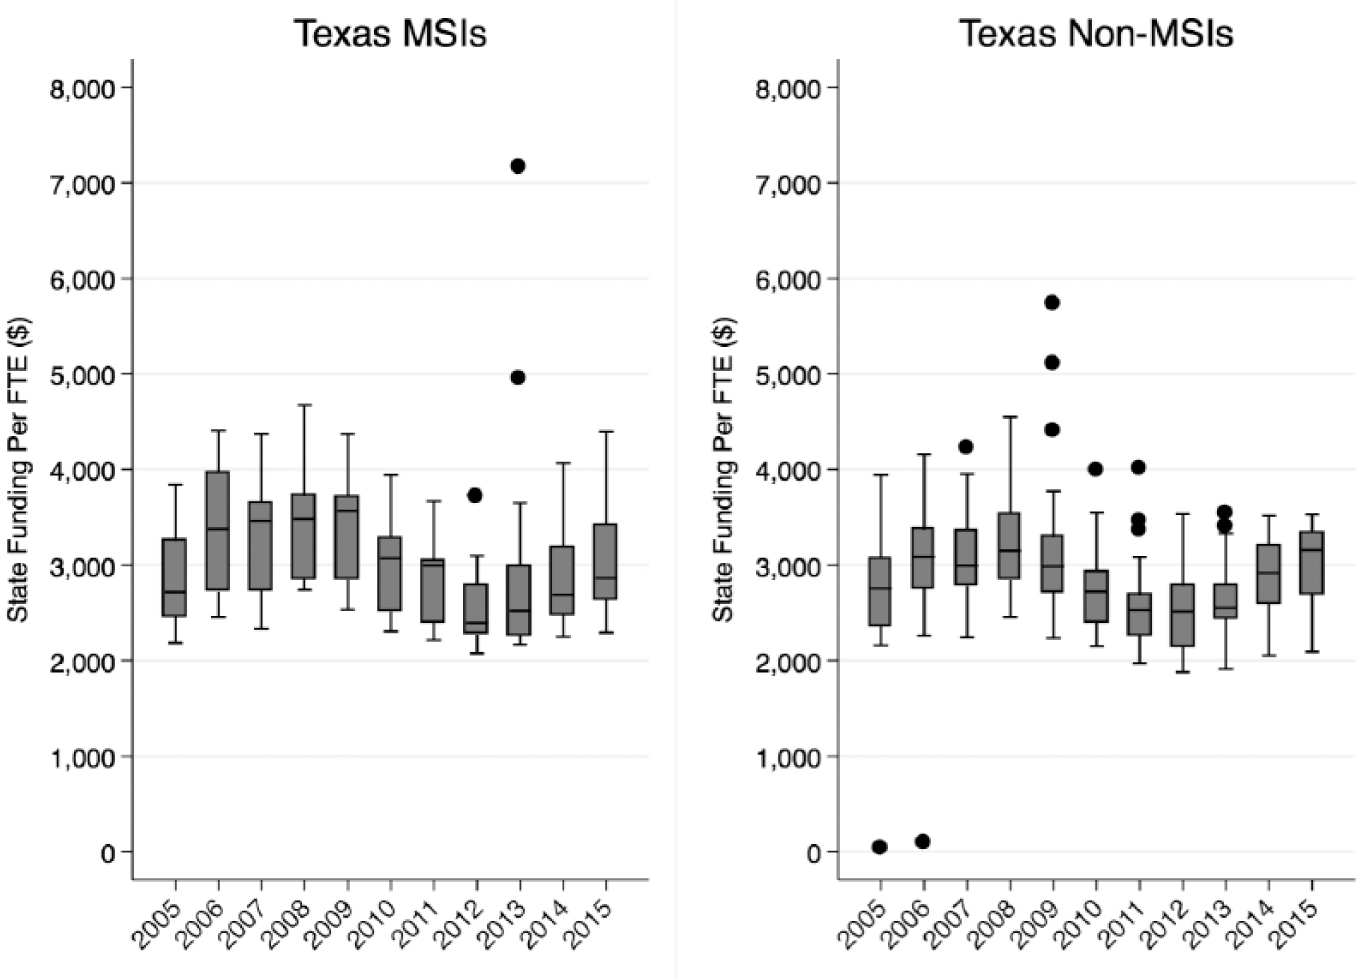
In Texas, total state funding per FTE student increased for both MSIs and non-MSIs after the introduction of performance funding in 2014 compared to the years immediately preceding performance funding, as illustrated in Figure 1. This re-investment in higher education by state governments in FYs 2014 and 2015 following the Great Recession is consistent with national trends (State Higher Education Executive Officers, 2016).
Texas state funding per FTE for MSIs and non-MSIs.
In the decade before the implementation of performance funding (2005-13), MSIs received US$2,944 (median) per FTE student from the state—US$148 more than non-MSIs, which earned US$2,796. After performance funding (2014-15), MSIs earned less than non-MSIs. We focus on medians given the outliers in the data (presented in Figure 1). Specifically, MSIs earned US$2,731 (median) per FTE student, whereas non-MSIs earned US$2,980. Although MSIs lost their funding advantage under performance funding, this change cannot be attributed to the policy as MSIs were earning fewer state funds than non-MSIs in the years immediately preceding the policy. Between 2006 and 2011, MSIs consistently received more state funds than non-MSIs. Yet, in 2012, MSIs earned US$2,394 per FTE compared to US$2,513 by non-MSIs. In 2013, MSIs earned US$32 less than non-MSIs (US$2,520 compared to US$2,552). The sharp declines in funding per student at MSIs in 2012 can be largely attributed to enrollment increases at these institutions. Specifically, enrollments at MSIs grew by 35% between 2011 and 2012, partly because large districts (i.e., San Jacinto and El Paso) became HSI-eligible between 2011 and 2012, and a small district (Western Texas) lost eligibility between 2011 and 2012. The increases in funding in 2014 and 2015 were not due to enrollment changes as enrollments were relatively stable across both MSIs and non-MSIs between 2012 and 2015.
Performance Funding Points to MSIs and Non-MSIs in Texas
Because total formula funding for community colleges in Texas is determined not only by performance funding but also by contact hours, we delved deeper into the performance-based component of the new funding model by separating median success points earned by MSIs and non-MSIs in 2014. We only present 2014 findings since at the time of data collection, this was the only year for which we had data on both enrollments and Student Success Points awarded to each institution. That year, 20 of the 50 public community and junior college districts in Texas were coded as MSIs in our data set.
Our findings indicate that MSIs and non-MSIs earned virtually equal amounts of funding from the Student Success Points Program. Specifically, MSIs earned US$135 (median) per student compared to US$133 for non-MSIs. The range in performance funds earned per student was somewhat wider among non-MSIs than among MSIs. Specifically, at non-MSIs, the interquartile range (25th percentile to 75th percentile) was US$121 to US$150. In contrast, the interquartile range of performance funds earned per student among MSIs was US$124 to US$145.
Next, we examined how MSIs and non-MSIs fared under each metric included in the Student Success Points Model (presented in Table 1). Specifically, we compared medians in per-student (Fall headcount) success points accumulated between the two groups of institutions in 2014. The success points are adjusted for their corresponding weights in the Student Success Points Model (e.g., degrees in critical fields are weighted more heavily than total degrees, and math metrics are weighted more heavily than those for reading and writing). A carrot (^) denotes that MSIs earned a higher number of median performance points on a particular metric. Generally, MSIs and non-MSIs performed similarly across the metrics. MSIs performed slightly better on two of the 11 metrics (transfers and gateway courses in math). Non-MSIs performed somewhat better on three of the 11 metrics (developmental education in math, 15 semester credit hours attained, and degrees awarded in critical fields).
In summary, all community colleges in Texas experienced funding increases under performance funding. MSIs had received higher funding levels in the decade prior to performance funding; under the Student Success Points Model, they received lower levels of funding than their non-MSI counterparts. However, this disadvantage in funding cannot be attributed to performance funding as MSIs were already earning less than non-MSIs in the years immediately preceding performance funding. Losses in funding per student to MSIs in FYs 2012 and 2013 were largely due to increases in enrollments for some MSIs. Turning to performance points, MSIs scored higher on Student Success Points in the aggregate, although points across groups were nearly equivalent. MSIs performed slightly better than non-MSIs on transfers and gateway courses in math. Non-MSIs outperformed MSIs on developmental education in math, 15 semester credit hours attained, and degrees awarded in critical fields.
Student Achievement Initiative in Washington
There were 33 college campuses in Washington that were included across all years of our data set (2004-05 to 2014-15). These colleges are part of the Washington State Board for Community and Technical Colleges and receive performance-based funds through the SAI. Note that we report the four Seattle District colleges as separate campuses (North Seattle College, Seattle Central College, Seattle Vocational Institute, and South Seattle College) and the two Spokane District colleges as separate campuses (Spokane Community College and Spokane Falls Community College). The online annual reports on Student Progress and Success reported SAI data on Pierce College Fort Steilacoom and Pierce College Puyallup as two separate campuses from years 2009-10 through 2012-13. Starting in 2013-14, Pierce District was reported as a single campus. For the purposes of consistency across years, we excluded both the Pierce colleges from our data set.
In the broader financial context, 2-year colleges in Washington depend heavily on public funding. In FY 2014-15, all expenditures came from a pool of revenue consisting of 45% from state appropriations, 11% from local appropriations, and 27% from tuition and fees (Washington State Board for Community and Technical Colleges, 2015). Year 2006-07 was established as the base year for tracking colleges’ initial performance, whereas 2007-08 was considered the learning year during which colleges were expected to utilize data and develop potential strategies for responding to the SAI, with full implementation of the policy in 2008-09. In 2007-08 and 2008-09, colleges received seed money as they transitioned to the SAI (Shulock & Jenkins, 2011).
In the development phases of performance funding, the Washington State Board partnered with the Community College Research Center to identify key academic milestones that students must complete to graduate. An important criterion was that these milestones had to be meaningful for students from all backgrounds and at all types of institutions (Washington State Board for Community and Technical Colleges, 2018b). The milestones chosen were intended to be appropriate for students regardless of demographic characteristics (race, age, income, and employment status), intensity of enrollment (part-time, full-time), previous academic preparedness, and current academic program. In addition, model designers sought to select academic milestones that were independent of institutional characteristics (urban, rural, large, small, community, or technical college).
There are several broad categories of achievement measures in the SAI: building toward college-level skills (also considered developmental education or noncredit bearing courses that are referred to as basic skills); first-year retention; second-year retention and workforce or transfer ready; completing college-level math; and completing degrees, certificates, and apprenticeship training (Washington State Board for Community and Technical Colleges, 2018b). Unless otherwise specified, colleges are awarded one point for each student who reaches any of the following milestones: earns a high school diploma or equivalent; increases a score on a select nationally recognized math, English language, or reading test; completes the highest precollege math course (three points); completes the highest precollege English course (two points); completes college-level math and English in the same year (effective 2013-14); earns 15 credits, 30 credits, or 45 credits (effective 2013-14); earns an associate’s degree, long-term certificate, or short-term certificate; or completes a workforce program or apprenticeship program (Washington State Board for Community and Technical Colleges, 2018b).
The SAI formula has changed slightly across years. In 2009-10, the first year that the SAI was funded (without the prospect of seed money, as was the case during the earlier transition years), there were four categories of achievement measures, and their respective momentum points: (a) becoming college-ready (adult basic education students increase basic literacy and math skills; students pass precollege math and English), (b) first-year college success (students completing their first 15 college credits; students completing their first 30 college credits), (c) first five credits in quantitative (students meet the math requirement for their program), and (d) completion (students complete an associate’s degree, workforce certificate, or apprenticeship). 8 In 2013-14, a fifth achievement category was added: second-year college success (two metrics were added: students complete at least 45 credits and; retention), with the purpose of ensuring students complete courses that will lead to transfer or credential completion. 9
Since the SAI was implemented, colleges have earned 1% of their state funds through the policy, which is a low percentage compared to state policies nationally, and serves more as a policy signal emphasizing important goals of the state as opposed to a strong financial incentive (Jenkins & Shulock, 2013; Jenkins, Wachen, Moore, & Shulock, 2012). In 2009, funds were allocated based on three weighted categories: 10% of total funds for completions, 35% for total points less completions, and 45% for points per student. Each college competed against its own baseline, not against all other colleges in the state (Jenkins et al., 2012). Appropriations were allocated according to the college’s annual performance and its improvement from prior-year points. That is, according to the 2010-11 report on Student Progress and Success, in calculating total points, “a college’s performance is compared to its past performance to determine its annual improvement in total points, allowing each college to focus on areas important to its students. Financial rewards are based upon the point gain” (Washington State Board for Community and Technical Colleges, 2011, p. 31). In the 2013-14 report on Student Progress and Success, the funding awards were modified to be the following: “45% for each college’s share of total points less completions (readiness and progress point production), 45% for each college’s relative points per student (effectiveness), and 10% for each college’s share of completions” Washington State Board for Community and Technical Colleges, 2014, p. 46).
The state board undergoes periodic examinations of the funding formula to decide whether improvements can be made. There is descriptive evidence that the SAI has resulted in certain positive outcomes. Between 2007 and 2011, colleges saw an average increase of 31% in total points earned through the funding formula (Belfield, 2012). The basic skills metric has encouraged greater enrollment of traditionally underserved students, and the SAI does not appear to have penalized colleges that enroll more students from underserved racial or socioeconomic backgrounds (Belfield, 2012). Moreover, stakeholder buy-in among some administrators and faculty has increased in the years since the SAI was first implemented (Li, 2017b).
State Funding Allocations to MSIs and Non-MSIs in Washington
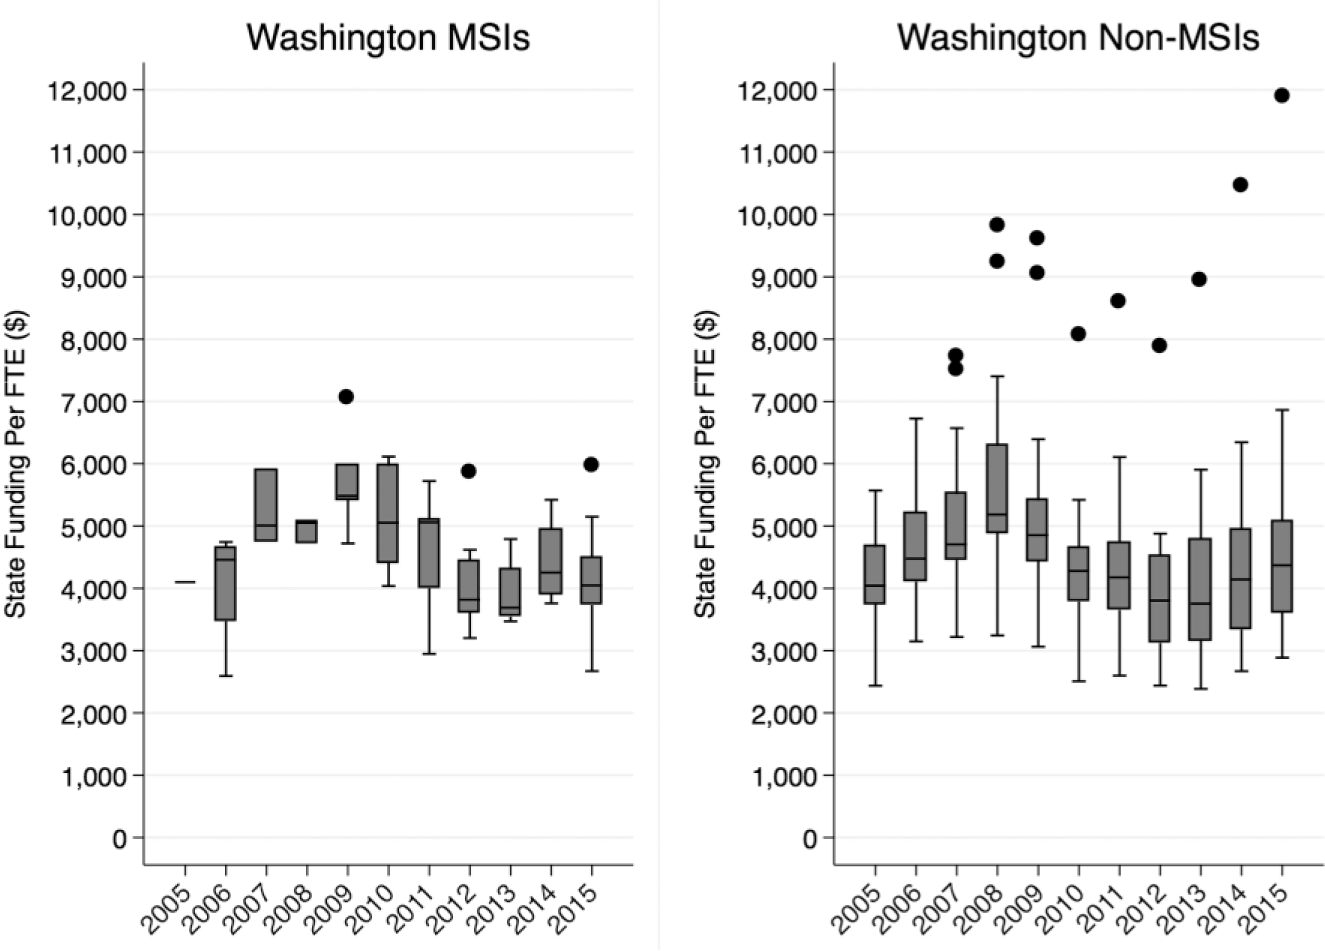
State appropriations to Washington’s 2-year colleges have fluctuated in the past decade, as seen in Figure 2, which plots the distribution of median funding per FTE among all MSIs and non-MSIs from FY 2005 (2004-2005) to FY 2015 (2014-2015). Based on our calculations, MSIs received a median of US$4,567 per FTE student in 2006, before the start of the recession—higher than the median among non-MSIs (US$4,460). MSIs also received greater state funding per FTE student in 2007, at US$5,008 compared to US$4,727. In 2008, the two groups of colleges experienced increasing state funding per FTE student, although MSIs received less funding (median of US$5,051) compared to non-MSIs (median of US$5,294). In 2009, state funds per FTE appeared to increase for MSIs (median of US$5,485) yet decrease for non-MSIs (median of US$4,865).
Washington state funding per FTE for MSIs and non-MSIs.
Starting in 2010, both MSIs and non-MSIs experienced declining state support following the recession and its subsequent recovery. In 2010 as well as 2011, MSIs received greater median funding per FTE student compared to non-MSIs (MSIs received US$5,054 in 2010 and US$5,059 in 2011, whereas non-MSIs received US$4,279 in 2010 and US$4,175 in 2011). Despite these gains, in 2012 and 2013, MSIs received less state funding per FTE, although more in 2014. In the most recent year displayed (FY 2015), MSIs were allocated a median of US$4,048 in state appropriations per FTE versus US$4,410 to non-MSIs. Although funding toward colleges have not returned to their prerecession levels, it appears that funding to non-MSIs increased more steadily in the more recent years, whereas funding to MSIs remained more stagnant. Overall, Figure 2 indicates that across time, MSIs have not been disproportionally affected more severely by declines in overall state funding.
Note that there are several outliers on the right-hand graph in Figure 2, consisting of non-MSIs that received above average state funding per FTE. These colleges were Bellingham Technical College and Renton Technical College in 2007, Renton Technical College and Seattle Vocational Institute in 2008 and 2009, and Seattle Vocational Institute in 2010 to 2015. The technical colleges tended to receive more per FTE funding than the community colleges, which also explains the greater variation among Washington colleges, since Texas technical colleges are under a separate funding formula.
Performance Funding Points to MSIs and Non-MSIs in Washington
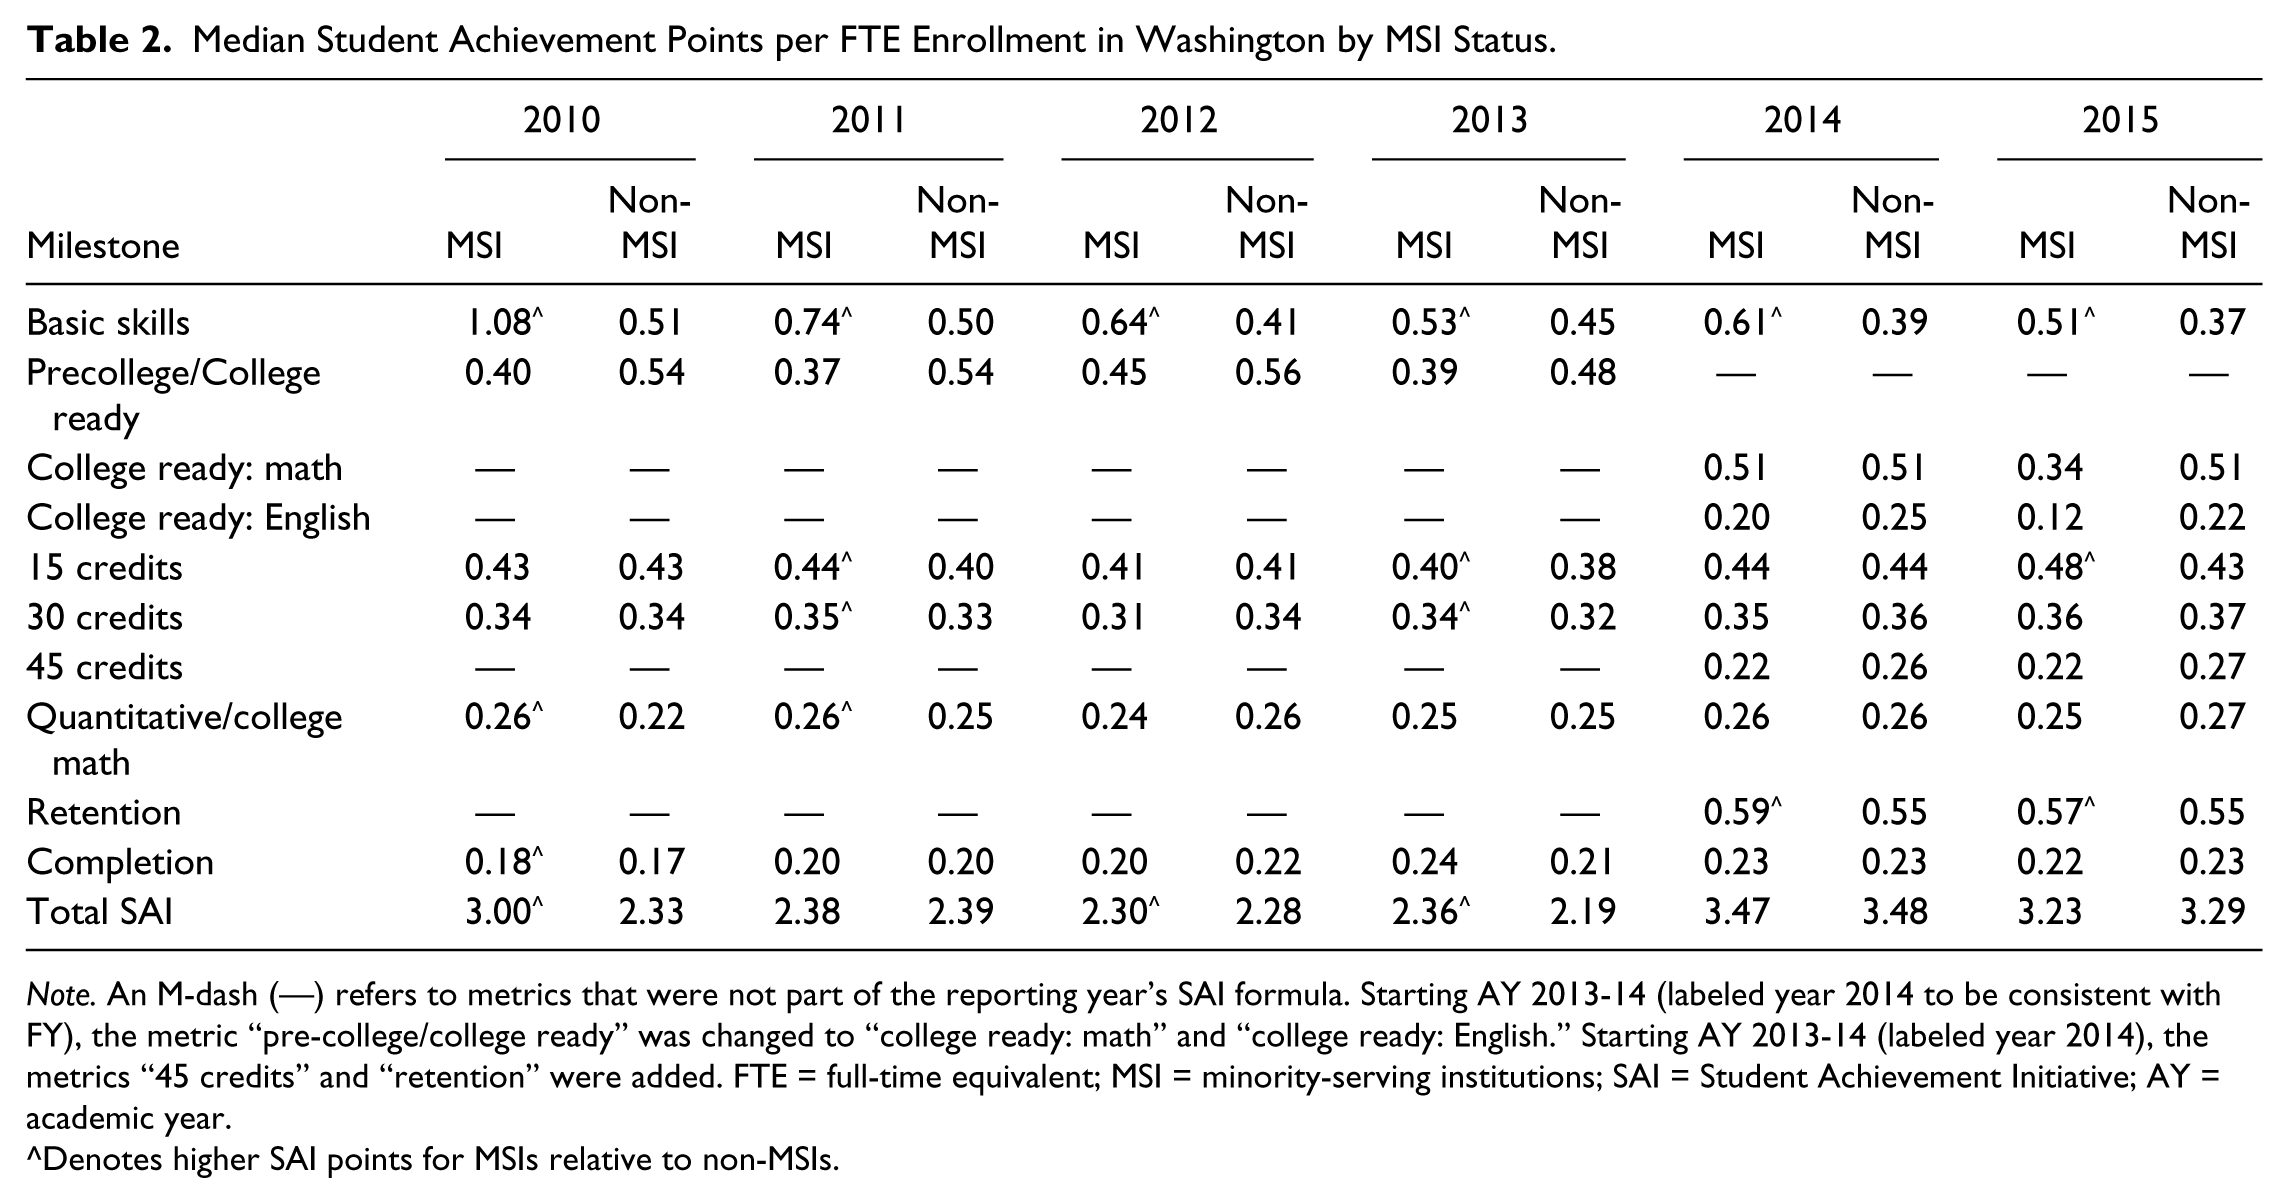
Next, we examined SAI points earned for each milestone. For each milestone in the SAI funding formula, we calculated the median points earned per FTE separately for the two categories of colleges—MSI and non-MSI—during each year from academic year 2009-10 (the first year that points differed for each metric) to academic year 2014-15 (Table 2). Note that the milestones evolved across these 6 years. In 2013-14, the category of “Precollege/college ready” was separated into two metrics, “college ready: math,” and “college ready: English,” for which points were awarded when students completed the precollege math and English sequence. 10 Also in 2013-14, a fifth category of achievement measures titled “second-year college success” was added, which introduced a retention metric and a 45-credit hour metric in which points are awarded when students complete at least 45 credits (see notes in Table 2). Consequently, the total SAI points earned per FTE student are higher in 2014 and 2015 with the addition of the “second-year college success” performance metrics. A dash in the table indicates that a particular performance metric was not utilized in the specified year, whereas a carrot (^) denotes that MSIs earned a higher number of median performance points on a particular metric.
Median Student Achievement Points per FTE Enrollment in Washington by MSI Status.
Note. An M-dash (—) refers to metrics that were not part of the reporting year’s SAI formula. Starting AY 2013-14 (labeled year 2014 to be consistent with FY), the metric “pre-college/college ready” was changed to “college ready: math” and “college ready: English.” Starting AY 2013-14 (labeled year 2014), the metrics “45 credits” and “retention” were added. FTE = full-time equivalent; MSI = minority-serving institutions; SAI = Student Achievement Initiative; AY = academic year.
Denotes higher SAI points for MSIs relative to non-MSIs.
We describe patterns in the data displayed in Table 2. MSIs earned more points per FTE student than non-MSIs for basic skills (developmental education) in every year that the metric was reported. Under this metric, points are awarded when students increase their basic literacy and math skills. 11 Across all years, MSIs earned fewer points on the college-ready metrics, which consist of students completing precollege math and English sequences.
Regarding the attainment of certain credit hour thresholds, the median number of points per FTE student earned by MSIs was higher on students completing the first 15 college credits and for students completing the first 30 college credits, in both 2011 and 2013, and higher on the 15-credit hour metric in 2015. Yet in all other years, non-MSIs earned more points per student on the 15- and 30-credit hour metrics, in addition to earning more points in 2014 and 2015 on the newly introduced 45-credit hour metric. MSIs earned more points on the quantitative milestone (meeting the math requirement for a student’s program) in 2010 and 2011, albeit fewer points in all subsequent years. MSIs also earned slightly higher median points per student on the retention metric in 2014 and 2015. With the exception of year 2010, MSIs consistently earned fewer points per FTE student on the completion metric, or the number of students who completed associate’s degrees, workforce certificates, or apprenticeships. As a whole, these patterns suggest that once students enter the college credit-bearing segment of their program, non-MSIs fared better than MSIs in terms of SAI points earned per student. Finally, the median total SAI points per FTE student earned by MSIs in Washington was higher than non-MSIs in some years (2010, 2012, 2013) but lower in other years (2011, 2014, 2015).
Although Washington’s performance funding policy did not incorporate metrics for underrepresented students specifically (to account for student racial and socioeconomic demographics), it did not create clear disadvantages in performance points earned by MSIs compared to non-MSIs. The data suggest that the inclusion of the basic skills (developmental education) rewarded MSIs due to their greater proportion of traditionally underserved students, and specifically, adults who were taking noncredit bearing courses. Nevertheless, non-MSIs more often earned higher performance points per student on the credit attainment metrics, the quantitative metric, and the completion metric. As a result, MSIs generally secured fewer total SAI points per FTE after performance funding was implemented.
Limitations
Several limitations of our study are worth noting. First, MSIs in Texas and Washington are distinct groups of institutions. In Texas, MSIs are overwhelmingly HSIs; in Washington, they are primarily AANAPISIs. Future work should examine the unique impacts of performance funding on different types of MSIs. Second, the current study focuses on institutions with an MSI designation without attention to varying levels of minority students served. For example, institutions with 95% of students identified as Hispanic (such as Texas Southmost College on the southern border) are treated analogously to those with 25% of students who identify as Hispanic (such as Amarillo College in the Texas panhandle). Institutions with varying levels of students with differing characteristics (e.g., race or ethnicity, part-time status, gender, and income levels) might fare differently under performance funding. Future work should examine the intersection between MSI classification and the varying numbers of student subgroups served. Moreover, our findings are not generalizable to all community college systems, which are housed in different local contexts. Nor do our conclusions apply to other states’ performance funding policies, particularly as policy designs have unique features, including variation in the metrics funded, the proportion of total state funding allocated, and the length of time a policy has operated. One of the unique contributions of our study is the attention to these differences across performance funding policy designs specific to Texas and Washington.
Discussion
This study examined state funding distributions to 2-year MSIs in Texas and Washington before and after performance funding regimes, utilizing data on appropriations per FTE student in years 2004-05 through 2014-15. Data analysis reveals that 2-year MSIs in these states were not disadvantaged in per-student funding levels under performance funding. In Texas, MSIs were allocated less in state appropriations per student after the start of performance funding in 2014; although based on our data analysis, the trend of declining appropriations to MSIs was occurring in the years immediately preceding the advent of performance funding. In Washington, both MSIs and non-MSIs saw fluctuating levels of state appropriations across years. Both groups of colleges saw declining support after the start of performance funding in 2009, which coincided with the recession. Although MSIs did not experience disproportionally larger declines in appropriations after performance funding, a recovery (increase in funding) occurred for non-MSIs in 2014 and 2015, but only in 2014 for MSIs.
In this study, we also explored how 2-year MSIs fared under each performance funding metric in the funding formulas for Texas and Washington. Specifically, we compared the median points earned per enrolled student (i.e., Fall headcount in Texas and FTE in Washington) on each performance metric among MSIs and non-MSIs. In Texas, the differences in performance on individual metrics between MSIs and non-MSIs were minimal. MSIs earned slightly less in the metric that is weighted most heavily: degrees in critical fields. However, MSIs earned slightly more performance funds in total (roughly US$2 per student) than their non-MSI counterparts.
In contrast, Washington MSIs earned fewer points per FTE enrolled student on a majority of performance metrics, when analyzing across the six years of data available. Similar to Texas, the performance funding model in Washington emphasizes developmental education (basic skills) and precollege or college-ready courses. The inclusion of the developmental education performance metric allowed MSIs to earn more points in this metric in each year we analyzed (2009-10 to 2014-15). However, MSIs earned fewer points on precollege or college-ready courses across all years, and across more years than not, MSIs earned fewer points on credit attainment metrics (15, 30, and 45 credits), the quantitative and college math metric, and the completion metric. Nevertheless, MSIs earned more in total performance points per student in three of the six years we analyzed, suggesting that as a whole, the funding formula did not explicitly disadvantage the populations served by MSIs compared to their non-MSI counterparts.
The performance funding models adopted in Texas and Washington do not include equity-related inputs, such as metrics for students of color (underrepresented racial or ethnic groups), Pell Grant recipients, first-generation students, or adult students. Despite lacking these design features, MSIs in these states have not experienced disproportional declines in total state appropriations after the introduction of performance funding. Both MSIs and non-MSIs gained and lost funding due to changes in economic conditions. Yet, 2-year MSIs have not experienced negative consequences related to performance funding allocations specifically. Moreover, although certain performance funding metrics aided MSIs in earning more points while other metrics did not, the total number of performance metrics per student earned did not consistently benefit either group of colleges.
Given these results, we might say that policy makers in Texas and Washington have approximated horizontal equity in their funding of MSIs and non-MSIs under the new funding models. Yet, as we proposed earlier, MSIs and non-MSIs—and the students they serve—are not equal. As such, horizontal equity may not be an appropriate lens by which to judge fairness in their funding. Mentioned previously, not only do MSIs receive less funding from all sources compared to non-MSIs (Cunningham et al., 2014), but institutions that serve large proportions of minority students also tend to receive lower levels of local funding than institutions with lower shares of minority students (Melguizo & Kosiewicz, 2013). Furthermore, additional institutional resources are required to retain and graduate students who have lesser academic preparedness or come from otherwise underserved backgrounds. These resources encompass academic and student support services, such as tutoring, faculty or peer mentorship, academic advising, and first-year transition programs. Thus, from the perspective of vertical equity—the concept that those in unequal circumstances should be treated unequally—the new funding schemes in Texas and Washington may not be considered equitable. In light of our findings and our conceptual framework, we advance a number of considerations for policy makers who are developing or revising performance models in states that house 2-year MSIs.
We begin with a recognition that the performance funding model designs in Texas and Washington incorporate elements that help minimize financial drawbacks for institutions that serve historically disadvantaged students. Specifically, by focusing on milestones and not basing funding exclusively on outputs such as degree attainment, the models in Texas and Washington avoid overtly disadvantaging MSIs. If all funding were tied to degrees awarded in critical fields in Texas, MSIs would receive much less funding. Similarly, if the Washington model solely funded the attainment of degrees, certificates, or apprenticeships, MSIs would have earned fewer funds in all but one of the six years explored. Instead, the milestone metrics incorporated in Texas and Washington’s models yield relatively balanced results between MSIs and non-MSIs. By incentivizing the completion of developmental (basic) education, college-level reading or math courses, and the attainment of 15 or 30 credit hours, the policies recognize that student progress ultimately leads to student completion and rewards colleges for these intermediate achievements.
We propose that the metrics for developmental (basic) education in Washington’s performance funding formula explain why we do not see inequitable total performance points for MSIs. Because of the formula’s emphasis on the achievement measure of building toward college-level skills, colleges with more students needing developmental education are eligible for higher levels of funding than those with more college-ready students. Thus, incorporating metrics specifically for developmental education may be one avenue to limit the potential for inequitable funding to MSIs versus non-MSIs. Not only do these metrics have concrete financial implications, their inclusion is a signal to colleges and policy makers that the state values delivery and improvement of developmental education (Baime & Baum, 2016).
Although Texas and Washington’s performance funding models may be less detrimental to MSIs than other performance-based model designs (especially those that prioritize degree completion), we also acknowledge that policy makers can pursue other options that better approach vertical equity in funding-model development.
First, within the performance funding regime, policy makers can incorporate bonus funding to reward institutions for serving and ensuring the success of traditionally underserved students. Neither Texas nor Washington offers funding premiums for completions by historically underserved students, such as first-generation students, students of color, lower income students, and returning adult students. Other states do, including Ohio, which provides premiums to both 2- and 4-year institutions for students who are considered racial minorities in the state (Native American, Hispanic, and Black/African American), low income (Pell-eligible at any point), and adult (aged 25 years or older at time of enrollment; Ohio Board of Regents, 2014). Previous research on Ohio has found that these premiums for underrepresented student metrics in the performance funding formula have catalyzed changes at institutions such as greater usage of predictive analytics as well as centralized data systems to better assess student progress toward graduation (Li & Zumeta, 2016).
Another example is Tennessee, which since 2010, has awarded 2-year and 4-year institutions extra funding for Pell-eligible and adult students who reach milestones, although the state does not include a premium for racial/ethnic minority students (Ness, Deupree, & Gándara, 2014). In 2015, Tennessee added a premium for students with lesser academic preparedness, which might mitigate the disproportional negative financial implications of the previous model for Southwest Tennessee Community College, a PBI (Ness et al., 2014; Tennessee Higher Education Commission, 2011). From our analysis, we cannot conclude that MSIs fare better under performance-funding models in Ohio and Tennessee. We mention these states to advance the idea that incorporating metrics for historically underrepresented students, in addition to the focus on developmental education and milestones in Texas and Washington, is one strategy consistent with vertical equity. This approach would ensure additional resources are allocated toward MSIs.
In Texas, funding-model designers considered and ultimately rejected funding premiums rewarding the success of underserved students (Gándara, 2016). If policy makers had chosen that route, not only would MSIs not be disadvantaged by performance funding, but—consistent with vertical equity—they would also receive additional funding to account for historic disparities faced by these institutions and the students they serve. The inclusion of premiums for underserved students, in addition to progression metrics and a focus on developmental education in funding formulas, may further help MSIs continue to secure vital institutional resources in the face of performance-based policies. We also note that Texas and Washington’s models do not recognize English Language Learners, another student population that may warrant additional resources. A metric that acknowledges these students may supplement the existing metrics in Texas and Washington capturing passage of precollege or college-level English reading and writing courses. In addition, we recognize the possibility that had the proportion of funding allocated in Washington’s performance funding policy (1% of total state appropriations) been higher and more consequential, institutional leaders at MSIs may have advocated more strongly for a set of metrics that would be more advantageous to the student populations served at these institutions.
Beyond funding methods, another consideration is the discretion granted to institutions for using the appropriations they receive. Generally, institutional leaders have full discretion to use funds they receive from performance funding for any operating expense (National Association of State Budget Officers, 2015). They are not required to use those funds explicitly to support certain initiatives or certain types of students. Thus, even if MSIs received more funding, and even if their additional funding were tied to traditionally underserved students through a premium in the funding model, institutional leaders may choose to use those funds for other purposes (Contreras, Malcom, & Bensimon, 2008). Despite the value of the flexibility generally granted to institutions for using state appropriations, policy makers might consider the option of restricting some funds to ensure they are indeed used to support students who most need the resources.
We conclude by echoing Lee and Wong’s (2004) claim that “performance-driven accountability policies alone cannot move us forward toward equity” (p. 797). Indeed, given the historical disadvantages some institutions have faced, if equity is a primary goal, policy makers should do more than to simply avoid creating sharp funding losses for these institutions. Instead, they should be more intentional about correcting historical inequities in funding model design. Student demand for community colleges may change, as well as state economic conditions and workforce opportunities, and policies must keep up with shifting demographics and institutional missions. Performance funding has potential for increasing both attainment and equity in higher education, if both are considered in policy design. Keeping a close eye on these policies is imperative for scholars and policy makers looking forward.
Footnotes
Authors’ Note
An earlier version of this manuscript was presented at the 2017 Association for Education Finance and Policy conference in Washington, DC. This study was referenced in a blog post from The Education Trust on November 14, 2017.
Declaration of Conflicting Interests
The authors declared no potential conflicts of interest with respect to the research, authorship, and/or publication of this article.
Funding
The authors received no financial support for the research, authorship, and/or publication of this article.