
Abstract
We test an uninvestigated proposition from spiral of silence theory that fear of social isolation (FSI) prompts people to seek out information about the climate of public opinion. Taking a trait-based individual difference perspective, the authors develop and validate a measure of FSI that is less likely to produce the interpretational problems that plague existing measures. Then, using data from eight countries spread across four continents, the authors examine whether those who fear social isolation to a greater extent are more likely to attend to a particular source of information in the social environment about public opinion—mass media reports of public opinion polls. Study results support spiral of silence theory’s prediction—FSI does appear to motivate people to ascertain what the public thinks. However, there may be some cultural boundaries to this process.
Communication scholars have long shown an interest in factors that facilitate what Noelle-Neumann (1974) called the “spiral of silence.” A recent title and keyword search on “spiral of silence” in the Thomson Reuter/ISI Web of Science reveals more than 80 published articles on the topic, and the 1974 Journal of Communication article (Noelle-Neumann, 1974) that introduced the theory and two editions of the book that followed (Noelle-Neumann, 1993) have been cited well more than 500 times in combination. And yet in spite of decades of published research, there are components of the theory that to this date remain untested. In the research described here, we close one of the remaining gaps between theory and research. Specifically, we examine whether fear of social isolation (FSI) functions as a motivator, as the theory assumes, for people to seek out information about the opinion climate. We approach this task by first developing a measure of FSI that we believe reduces some of the interpretational problems that have plagued research to date. We then ascertain whether individual differences in FSI predict the extent of attention people allocate to informational cues about the opinion climate, such as public opinion polls. We also honor (and test) Noelle-Neumann’s position (Noelle-Neumann, 1993, p. 205) that “Any theory of public opinion must be internationally applicable” by conducting the study in eight countries using similarly or identically worded questions while minimizing inconsistencies that might result from differences in question meaning resulting from haphazard translation.
Fear of Social Isolation in Spiral of Silence Theory and Research
Conceived by Elisabeth Noelle-Neumann in the mid-1960s (Noelle-Neumann, 1974), spiral of silence theory postulates that public opinion about some topic (e.g., a social issue) or person (e.g., a politician) is governed by the tenor of media coverage that person or topic receives as well as, to a lesser extent, the frequency in which certain perspectives are articulated publicly during social discourse. According to this perspective, people who hold a particular position but see that position losing ground in the public and media discourse will be less likely to articulate that position publicly due to the fear of socially imposed sanctions, such as isolation from friends and community, which can result from the appearance of deviating from majority opinion. Over time, as proponents of a particular perspective self-censor, others come to perceive that perspective as losing further ground, to the point where the perspective largely disappears from the opinion landscape.
At the heart of the theory, Noelle-Neumann (1977) postulated first that “as social beings, most people are afraid of becoming isolated from their environment” (p. 144). This fear of social isolation (FSI) is arguably the most important component of the spiral of silence (see Noelle-Neumann & Petersen, 2004, p. 129), for it is presumed to function as “the motivational trigger for the whole process” (Lin & Pfau, 2007, p. 156) and sets the spiral into motion. On the basis of this fundamental assumption, Noelle-Neumann (1977) explains in her second assumption, “In order to avoid becoming isolated . . . , people constantly observe their environment very closely” and they “try to find out which opinions and modes of behavior are prevalent” (p. 144). Later, she comments, “Humans invest their attention with great economy. The effort spent in observing the environment is apparently a smaller price to pay than the risk of losing the goodwill of one’s fellow human beings—of becoming rejected, despised, alone” (Noelle-Neumann, 1993, p. 41). Rephrased, strong is the human need to avoid being socially ostracized—so strong that we are willing to expend valuable cognitive fuel to regularly scan the information environment so as to remain appraised of where our own opinions reside in the landscape of public opinion. “This behavior does not evolve from people’s petty curiosity,” as Petrič and Pinter (2002, p. 39) eloquently put it, “but is functionally necessary for their social behavior and conduct. They are seeking cues about how to conduct publicly in order to avoid social sanction.” That is, knowing what people think matters because the interpersonal risks of appearing to be on the losing side of a public debate or controversy are too great.
So spiral of silence theory clearly postulates that as a result of fear of being socially isolated, people are motivated to scan their environment to discern the opinion climate. But surprisingly, as Scherer et al. (2006) noted in a recent review, this proposition has never been put to empirical test, although it is critical to the theory and explicitly stated in Noelle-Neumann’s earliest and more recent writings about it (Noelle-Neumann, 1977, 1993; Noelle-Neumann & Petersen, 2004). We rectify this shortcoming of the existing literature here.
Of course, it would be a gross mischaracterization of the literature to say that the role of FSI in public opinion processes has never been studied. On the contrary, it has been studied extensively, but there is disagreement and inconsistency in just what this fear is and how to best operationalize it, if it is to be operationalized at all. Furthermore, as we describe in what follows, research to date says nothing about whether FSI prompts people to tune in to their environment to assess what others are thinking. That is, does this fear actually stimulate the “quasi-statistical organ” (Noelle-Neumann, 1974, p. 44) or “quasi-statistical sense” (Noelle-Neumann, 1997, p. 216) into action?
Measurement of Fear of Social Isolation
Noelle-Neumann defines FSI as a “fear—probably developed over the course of evolution—of being rejected by those around [us]” and that “most people are afraid of becoming isolated” (Noelle-Neumann, 1977, p. 144). FSI is conceptualized here as a social constant of sorts, and as such, it frequently is taken as a given and not subjected to empirical measurement (see Fuchs, Gerhards, & Neidhardt, 1992) in spiral of silence research. That is, some researchers merely assume that FSI is the “black box” that prompts people to self-censor when they perceive their own opinion is in a minority in the distribution of public opinion. In such studies, FSI is not a variable at all or deemed not central enough to the goals of the study to include in the measurement or analysis. Recent examples in this tradition include Ahlam and Frey (2008) and Priest (2006).
Scheufele and Moy (2000) challenged spiral of silence researchers to think “macroscopically” by conducting cross-cultural spiral of silence research and assessing intercountry variation in study results, to be predicted a priori by dimensions that distinguish the people of one culture from another such as individualism/collectivism. If a stronger association between perceptions of support for one’s own opinion and willingness to speak out is larger in collectivist countries than in individualist countries, this would support the role of FSI in the spiral of silence process. This approach does not involve explicit measurement of FSI but rather assumes that people from different countries vary in their FSI more so than do people living in the same country. Huang (2005) is an example of a study in this tradition. 1
Some researchers take yet a different perspective by measuring fear at the individual level—as a characteristic of the person, and a dimension along which people vary, even within the same country or culture. For any emotion people experience, there are individual differences in the frequency and intensity of those experiences. Although it is probably true that few are entirely indifferent to rejection by others—FSI is deeply embedded into the human genome no doubt—it is most certainly true that some people possess a stronger tendency to fear isolation than others, regardless of where they happen to have been born and raised. Indeed Noelle-Neumann has been open to this idea. Her concept of the avant-garde, who “either know no fear of social isolation, or who have overcome it” (Noelle-Neumann, 1993, p. 139) acknowledges that some people care less about being social isolated than do others. She also describes an unpublished thesis (Noelle-Neumann, 1993, pp. 214-215) that measures individual differences in “embarrassability” as a proxy for FSI.
This individual difference perspective has come to dominate spiral of silence researchers who empirically study FSI’s role in the process. Researchers who favor this individual difference approach have diverged in whether they conceptualize this fear as “state” or “trait” (although some conceptualize and measure this fear in both ways, for example, Ho & McLeod, 2008; Lee, Detenber, Willnat, Aday, & Graf, 2004; Neuwirth, 2000; Scheufele, Shanahan, & Lee, 2001). The state-based conceptualization approaches measurement of fear by focusing on fears and consequences resulting from a specific behavior, such as articulating a minority viewpoint publicly in a particular situation or with respect to public expression of opinions about the particular topic or controversy being used in a study. Examples include Moy, Domke, and Stamm (2001) and Neuwirth, Frederick, and Mayo (2007).
A trait-based conceptualization, by contrast, construes FSI as a stable characteristic of the person that manifests itself in behavior across situations. Whereas a state orientation assumes such fear is temporally inconsistent, situationally specific, and amenable to contextual manipulation, the trait orientation predicts temporal consistency in behavior (such as the self-censorship that results) and views FSI as deep within the psyche of the individual, relatively immutable, and not subject to empirical manipulation. In terms of measurement, the trait-based orientation quantifies a person’s emotional or cognitive responses to broad, generic situations rather than specific ones, or feelings or insecurities about how the world does or may respond to the person, and tends to focus on the person rather than the situation in the way that personality psychologists do when they measure self-esteem, extroversion, neuroticism, and other traits. Examples of this approach include Willnat, Lee, and Detenber (2002) and Petrič and Pinter (2002).
Regardless of orientation, researchers in the individual-difference tradition agree that FSI should be treated as a variable measured at the individual level rather than as a social constant. To date, these researchers have focused almost entirely on individual differences in FSI as antecedent to or intervening between perceptions of the opinion climate and public expression of opinions (Petrič & Pinter, 2002; Shoemaker, Breen, & Stamper, 2000), or they use FSI as an exogenous variable in models of willingness to speak out (Ho & McLeod, 2008; Lee et al., 2004; Moy et al., 2001; Scheufele et al., 2001; Willnat et al., 2002). There is some study-to-study variability in results, but generally this research supports the claim that individual differences in FSI as measured thus far predict willingness to publicly articulate positions that are perceived as deviant through the lens of prevailing public opinion. These findings have enriched the literature and debate about the role of individual differences in public opinion expression, but they don’t addresses spiral of silence theory’s proposition that FSI prompts information seeking about the distribution of public opinion. Furthermore, as we discuss below, FSI as often measured is likely confounded with many individual differences that influence communication behavior, such as willingness to publicly articulate opinions—deviant or not.
Another characteristic of research in this tradition is that there are almost as many FSI measures reported in the literature as there are studies investigating its role in spiral of silence processes, each constructed ad hoc for the purpose of that particular study. Some studies have worked with single items making an assessment of quality such as reliability difficult. For instance, Huang (2005, p. 335) measured FSI with the item, “I might be the only person who supports my opinion.” Similarly, Moy et al. (2001, p. 20) measured FSI largely with respect to isolation resulting from opinion deviance (e.g., single item, “I worry about being isolated if people disagree with me”). Such operationalizations can be criticized for their narrow focus because they do not tap the general tendency to fear isolation as proposed in Noelle-Neumann’s first assumption (see Noelle-Neumann & Petersen, 2004, p. 349), and in some cases, they seem to focus purely on fear generated vis-à-vis perceived correspondence between one’s own opinion and the prevailing opinion climate.
Other studies can be criticized for criterion contamination resulting from the use of FSI indicators (such as a person fearing being isolated by publicly speaking a minority viewpoint or a particular position) that are as much indicators of the criterion (willingness to speak out) of the instrument being used to predict in the study (Ho & McLeod, 2008; Scheufele et al., 2001; for example, “I avoid telling other people what I think when I think there is a risk they’ll avoid me”). Yet other studies have used more appropriate items that didn’t scale well (for instance, Lin & Pfau, 2007, used a 5-item measure with α = .54; also see Neuwirth, 2000), or researchers used a diverse set of items without reporting reliability or testing dimensionality. For instance, Kim, Han, Shanahan, and Berdayes (2003) measured FSI by asking “how often respondents (a) voice their views in front of other people” and “worry about being isolated from others.” In a similar vein, Scheufele et al. (2001, p. 321, also Ho & McLeod, 2008) treated diverse items such as, “I don’t worry about other people avoiding me,” and “I enjoy avoiding arguments,” as unidimensional without providing evidence attesting to the tenability of this assumption. Some researchers have used measures of related constructs as a proxy for FSI, such as dispositional shyness, social anxiety, or communication apprehension (e.g., Petrič & Pinter, 2002; see Willnat et al., 2002, who explicitly advocated against this practice), argumentativeness (Ho & McLeod, 2008; Scheufele et al., 2001), or fear of negative evaluation (Shoemaker et al., 2000). The most convincing scale, described by Willnat et al. (also see Lee et al., 2004), used items such as, “At times, I worry about being alone.” However, this study also did not test the dimensionality of FSI, and there was no attempt to test the scale’s validity.
So there is no consistently used, demonstrably valid measure of FSI in the literature. Certainly, one possible reason is that FSI was not the focal independent variable in many of these studies. Another reason could be that researchers are using disparate definitions of FSI. One could pick out single items from that pool based on some semblance of face validity, but with the aim of establishing a reliable and valid scale for spiral of silence research such a strategy does not go far enough. Thus, for the measurement of FSI in this study, rather than relying on an instrument with unknown dimensionality or validity, we take a step back by developing a new FSI scale using a full-scale construction process. We explain the development of this scale in the next section. We then turn to the primary theoretical mission of this article by assessing whether individual differences in FSI predict individual differences in attention allocated to discerning the opinion climate.
Study 1: FSI Scale Development
We had four objectives when developing our FSI measure. Our first goal was to produce a unidimensional measure of FSI that does not operationalize fear in reference to isolation resulting from specific acts, such as expressing normatively deviant opinions in general topic areas or on specific topics in specific situations. Rather, our goal was to assess general emotional or cognitive responses to being socially isolated or “left out.” That is, we approach our measurement of FSI from the perspective of a trait orientation. Second, we sought to produce a measure that was minimally correlated with dispositional shyness or what is sometimes called “communication apprehension.” Third, we wanted it to be as short as feasible so as to facilitate its use in telephone surveys or other costly methods of measurement. Finally, this new measure must not yield data so highly correlated with data from competing measures so as to make it largely redundant.
Scale Development and Validation
Method
The participants were 328 students at a university located in the Midwestern United States (Mage = 22.02 years, SD = 2.22, min. = 19, max. = 35, 56% female). They completed an in-class questionnaire in exchange for extra course credit. After completing the questionnaire (which took 10 to 15 min), the participants returned it to the investigator without placing any identifying information on it.
To measure FSI, we used five statements (with 5-point Likert-type response scale, from strongly disagree to strongly agree) developed based on the definition of FSI described above (Noelle-Neumann & Petersen 2004, p. 349) as well as items used in previous studies in line with this definition (e.g., Willnat et al., 2002). The exact wordings of each of the five items were as follows:
FSI1: “It is scary to think about not being invited to social gatherings by people I know.”
FSI2: “One of the worst things that could happen to me is to be excluded by people I know.”
FSI3: “It would bother me if no one wanted to be around me.”
FSI4: “I dislike feeling left out of social functions, parties, or other social gatherings.”
FSI5: “It is important to me to fit into the group I am with.”
Consistent with our first goal, these items were worded carefully so as to not refer to opinion expression situations or, for that matter, communication of any kind. Instead, our items refer to cognitive and emotional responses associated with real or potential rejection or exclusion by others around us (see, Noelle-Neumann & Petersen 2004, p, 349).
This questionnaire also included the 7 items used by Scheufele et al. (2001) and Ho and McLeod (2008) to measure FSI as well as the 13-item shyness subscale of Cheek and Buss’s Shyness and Sociability Scale (Cheek & Buss, 1981; Robinson, Shaver, & Wrightsman, 1991). All 20 of these additional questions required the same 5-point Likert-type response format. As discussed in more detail later, these items were included to establish empirically how well we met our fourth goal of developing an instrument that measures something different than a set of items used by several prior researchers as well as to empirically examine how well we met our second goal of constructing a measure minimally correlated with dispositional shyness.
Analysis and Results
Reliability and dimensionality
Our first task was to assess whether the proposed five-item FSI scale can be described as unidimensional, in accordance with our first goal. To assess the dimensionality of the five items, we conducted a principal-axis-factor analysis combined with a parallel analysis (O’Connor, 2000; Reise, Waller, & Comrey, 2000). 2 For the parallel analysis, we used the 95th percentile of eigenvalues based on 5,000 factor analyses of random data and conducted the analysis using an SPSS algorithm described in O’Connor.
This procedure suggested only a single factor was necessary to describe the relationships between the items. To assess the adequacy of a single-factor model in reproducing the covariance matrix, we used standard measures of fit in covariance structure modeling (see, for example, Kline, 1998) when estimating a single-factor indicators-as-effects model, assuming local independence (i.e., no correlated indicator errors). This fit of this model was excellent, χ2(5) = 7.969, p = .158, comparative fit index (CFI) = 0.989, Tucker–Lewis Index (TLI) = 0.978, root mean square error of approximation (RMSEA) = 0.043, all factor loadings were positive and statistically significant (and with standardized values greater than 0.50). An examination of modification indices showed no evidence that adding covariances between indicator errors would improve fit to a statistically significant degree.
The composite score calculated for each respondent by averaging responses across the five items was reliable, as indexed by Cronbach’s alpha (α = .71). The average FSI score was slightly above the theoretical midpoint of the scale (M = 3.34, Mdn = 3.40, SD = 0.65), with 25th, 50th, and 75th percentiles of 3.00, 3.40, and 3.80, respectively. The results of a Kolmogorov–Smirnov Test suggested significant deviation from normality (p < .01), with negative skew in the distribution (Z = −2.73, p < .01) but no evidence of significant kurtosis (z = 1.62, p > .10).
Discriminant validity
The preceding analysis establishes the unidimensionality of our five-item FSI scale and that the scale can produce a composite score that is sufficiently reliable. Our next analysis focuses on whether this new measure is statistically distinct from competing measures. We focused on the measure first used by Scheufele et al. because it has been used in published research (Ho & McLeod, 2008; Yun & Park, 2011) and has appeared in numerous recent conference papers as well (Blake, Wyatt, & Reineke, 2009; Reid, Helmle et al., 2009; Reineke, Morey, Blake, & Wyatt, 2009). In other words, repeated publications and recent research suggest it has gained some popularity and thus likely will be used in the future. We first conducted an exploratory factor analysis (principal-axis factoring, obl
Exploratory Factor Analysis of the 12 Fear of Social Isolation Items (FSI1 to FSI5 are the 5 New Items Proposed Here, and SSL1 to SSL7 are the Seven Items Used in Scheufele, Shanahan, and Lee, 2001, and Ho & McLeod, 2008).
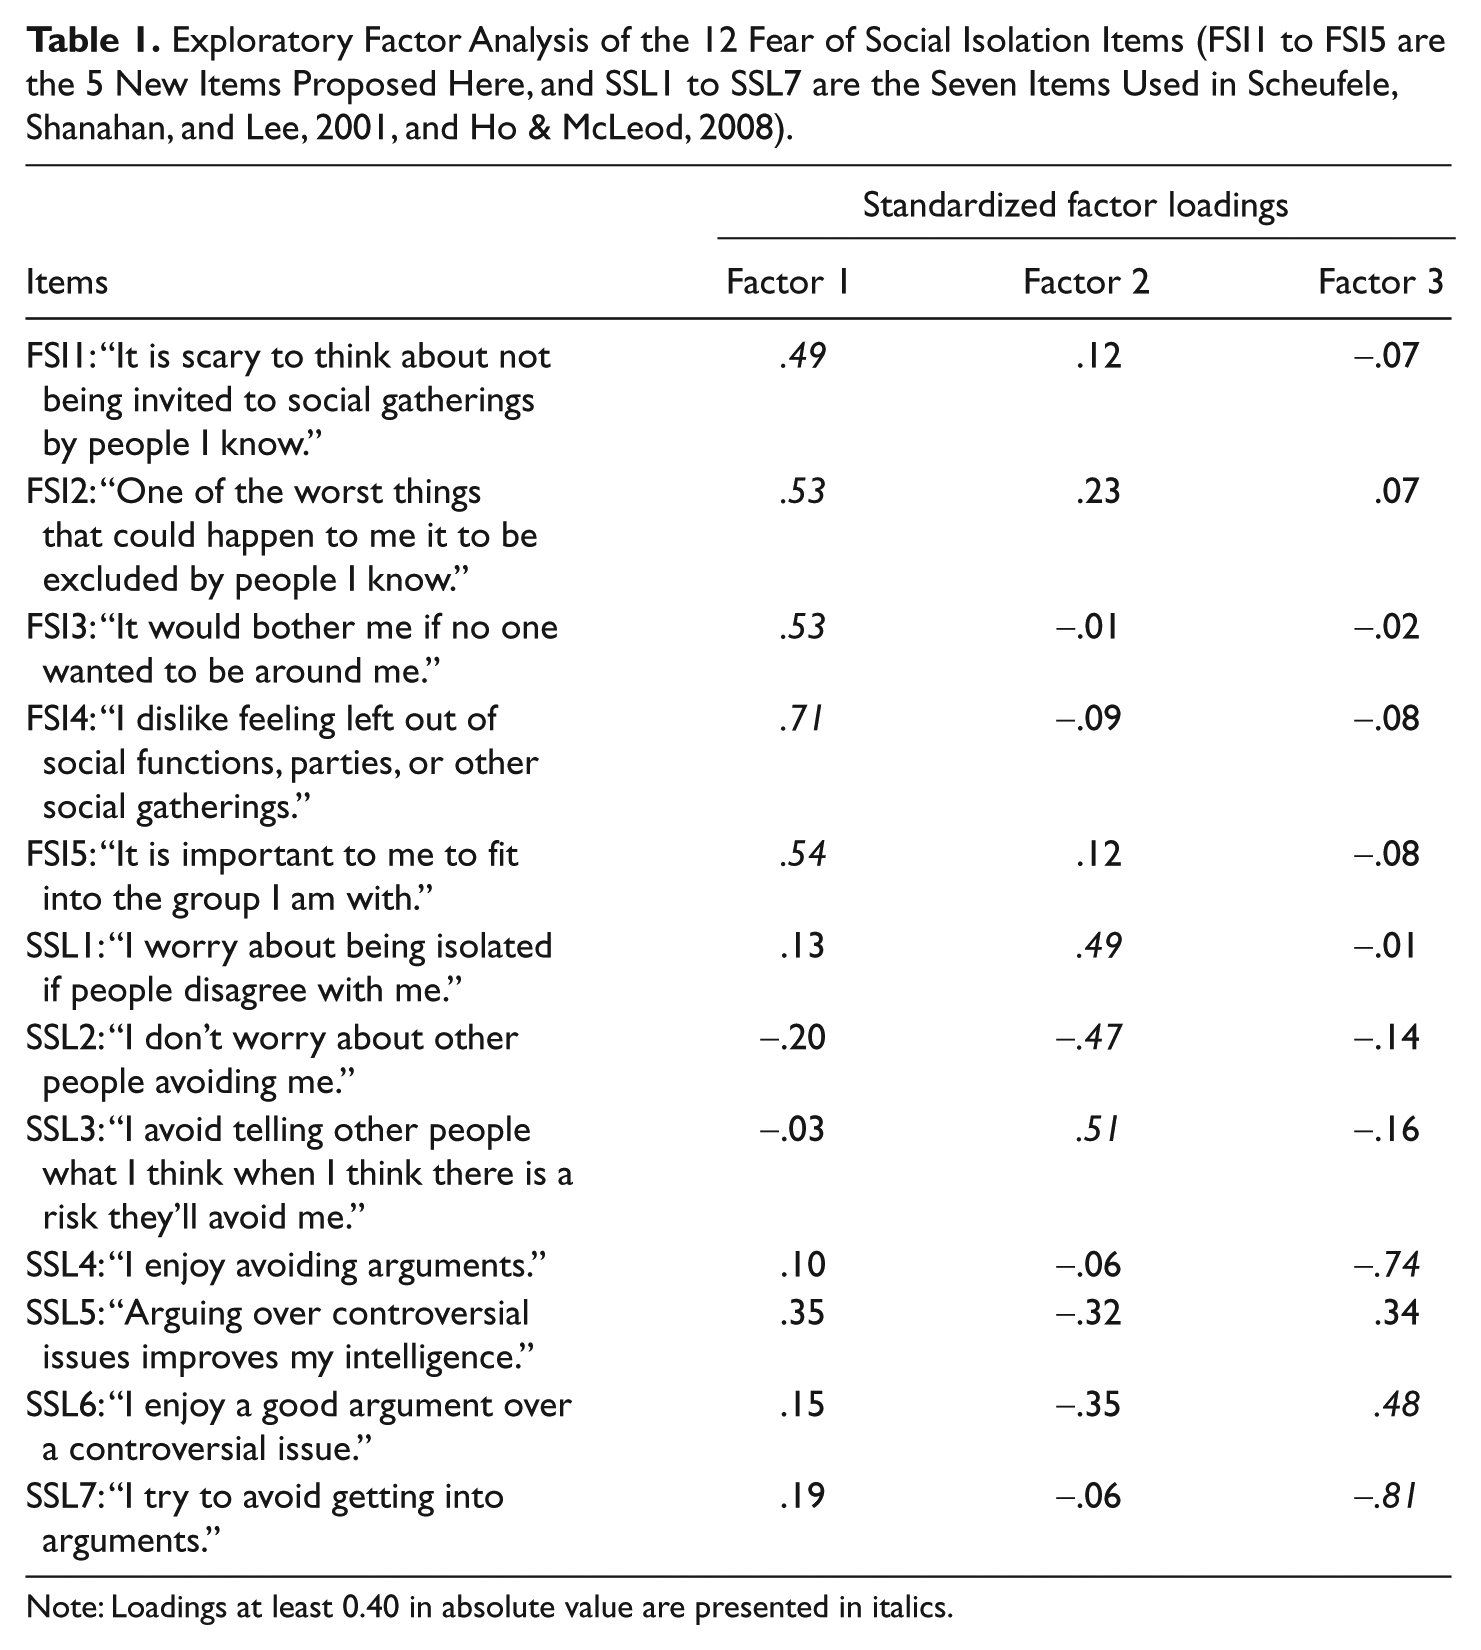
Note: Loadings at least 0.40 in absolute value are presented in italics.
The results of this analysis suggest our five-item measure is statistically distinct from Scheufele et al.’s (2001) measure. But the results of an exploratory factor analysis are often method specific and depend on method of extraction, rotation, approach to assessing dimensionality, and so on. To further probe the dimensionality of these 12 items and assess discriminant validity, we conducted a set of confirmatory factor analyses. The first model, a single-factor model, had all 12 items loading on a single common factor. Second, we fit a two-factor model, with the first factor containing our five items and the second factor containing the seven items from the Scheufele et al. measure. We allowed the two factors to correlate but allowing no cross-loadings. Finally, we fit a three-factor model corresponding to the solution from the exploratory factor analysis, with no cross-loadings, and allowing the factors to intercorrelate. In all three of these models, all indicator error correlations were constrained to zero with the exception of indicator errors for SSL5 and SSL6, as modification indices in all three models suggested this correlation should be estimated rather than fixed to zero.
Figure 1 displays these three models and provides information about their fit to the data. Notice that the three-factor model was the best fitting of these three alternative measurement models by a wide margin. It is of interest to note that that two-factor model consisting of the two FSI scales as separate factors fit worse than the three-factor model by a likelihood ratio test (Δχ2 = 71.13, df = 2, p < .001). Keep in mind that the three-factor model splits the Scheufele et al. (2001) measure into two separate factors. Furthermore, observe that in all models except for the three-factor model, the loadings for the seven Scheufele et al. items are inconsistent in size, with some loadings quite small in some models. By contrast, the loadings for our five items are consistently positive and relatively large, regardless of the model. Finally, observe that the correlation between FSI based on our five items and FSI using the Scheufele et al. items is fairly weak (r = .24). Even when the argumentativeness factor is taken out of the Scheufele scale, the correlation between our FSI measure and the three-item scale is only modest (r = .45). These results combined clearly support our claim that our measure is statistically distinguishable from Scheufele et al.’s and, unlike the Scheufele et al. measure, is unidimensional,. Their scale, which has been treated as unidimensional in studies that use it, is clearly bidimensional and contains an “argumentativeness” factor as well as an FSI factor that quantifies a situation-specific fear relating to the expression of deviant opinions.
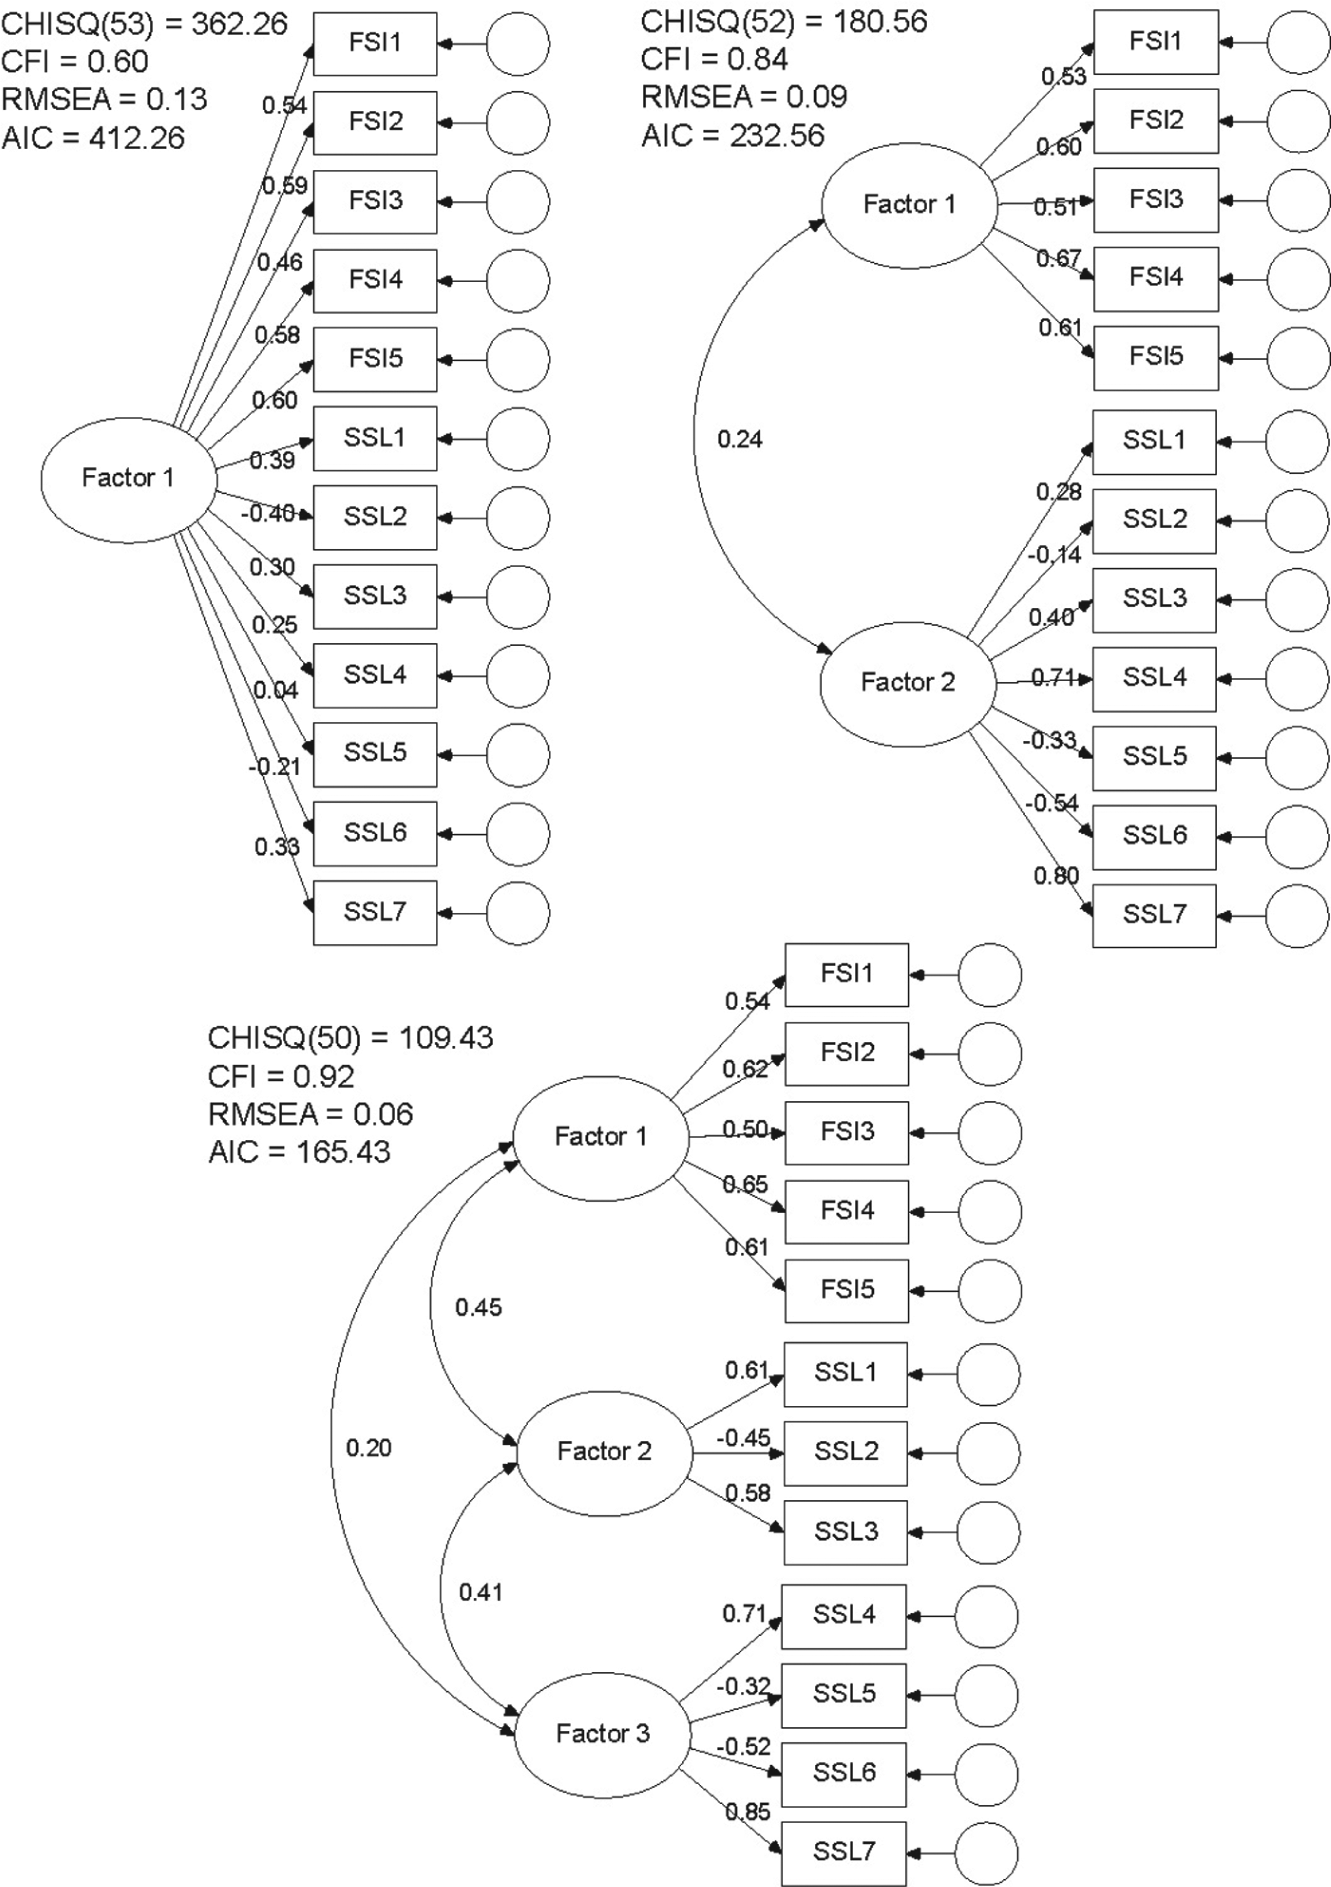
Single-, two-, and three-factor models of the 12 FSI indicators described in the confirmatory factor analysis. Factor loadings are standardized; covariances between factors are correlations. FSI = new items developed in Study 1, SSL = seven indicators used by Scheufele et al. (2001) and Ho and McLeod (2008). See Table 1 for item wordings.
We also sought to generate a measure of fear that was not confounded with social anxiety or the inhibition of communication generated in response to actual or anticipated social interaction with others (a.k.a. “shyness”). To assess our success at meeting this goal, we calculated the composite FSI score (using the average response to the five items) and correlated it with the shyness index constructed from the average responses to the 13-item shyness scale described earlier (α = .87). We also correlated shyness with the average composite FSI based on the seven Scheufele items in order to compare the relative correlations between the two measures and shyness. This analysis revealed a very weak, albeit statistically significant, association between shyness and our proposed five-item FSI scale, r = .16, p < .01. By contrast, the correlation between shyness and the seven Scheufele et al. items was moderate (r = .49, p < .001) and larger than correlation between shyness and our five-item scale (z = 5.09, p < .001, using the Meng, Rosenthal, & Rubin, 1992, test for differences between correlated correlations).
Study 2: Does FSI Predict Opinion Climate Information Seeking?
The prior study verifies that our FSI measure is unidimensional and generates data with adequate reliability. Furthermore, the data the scale yields are statistically distinguishable from data produced by a measure of FSI recently used in the spiral of silence literature, one that is multidimensional even though treated as unidimensional in that literature. And the measure we developed here is only weakly correlated with dispositional shyness.
With a satisfactory measurement instrument developed, we now shift to the primary theoretical goal of this article—to directly test spiral of silence theory’s proposition that FSI stimulates the quasi-statistical organ to tune into the information environment with the goal of discerning the opinion climate. Knowledge of where one’s opinion resides in the opinion landscape is important in so far as a person strives to avoid social isolation by refraining from publicly advocating minority viewpoints. Thus, those who report greater FSI should be more likely to attend to information in the environment about the opinion landscape so as to be aware of what others are thinking. There are at least two sources of information about the opinion climate: the mass media’s reporting about opinion polls and personal experience about the opinions of others. Thus, attention to public opinion polls is a straightforward way of “attentively noting which opinions . . . meet with public approval or disapproval” (Noelle-Neumann & Petersen, 2004, p. 349). We propose
Hypothesis 1: There is a positive relationship between FSI and attention to public opinion polls. Those relatively higher in FSI are more likely to report paying attention to public opinion polls reported in the media compared to those relatively lower in FSI.
The study described below put this prediction to the test. To provide a strong test of this hypothesis, we collected data in eight countries using an identical sampling and data collection method in each country, thereby reducing (but not completely eliminating) the potential for variation between data collection methods or context to affect results—a problem that typically pervades studies of the spiral of silence conducted in more than one country. Our goal is to ascertain whether there is evidence that FSI predicts attention to public opinion polls and examine whether the psychological process this association purportedly represents is a cultural universal. In other words, we are construing this study as a form of cross-cultural replication undertaken simultaneously. It is important to acknowledge that although there are many reasons to contemplate and theorize about cultural variation, and we will examine variations between countries in the analysis we describe below, the focus of this study is not to hypothesize about or explain cross-cultural variation. Thus, we propose a single research question.
Research Question 1: Is the relationship between FSI and attention to public opinion polls homogeneous or heterogeneous across countries?
Method
Participants
The data for this study were collected in the United States, Germany, France, Mexico, China, Chile, the United Kingdom, and South Korea through the use of an international internet survey administered and hosted by Survey Sampling International (SSI) in October 2009. 3 For each country, a sample was drawn from their online access panel, and participants were given an incentive by SSI in exchange for their participation. By contract, SSI provided a minimum of 250 completions in each country. When possible, quota sampling was used to obtain a sample similar to the general population in terms of gender and age. When not possible, diversity on age and sex of respondents was the secondary goal. With the exception of the language of administration, the survey was identical in all countries and included 25 questions, only 10 of which are pertinent to this study.
In total, 2,006 people participated, but some respondents were excluded from analysis. First, we eliminated six cases who reported (based on a question asked at the end of the survey) they weren’t living in the country we actually sampled. In addition, using time-stamp information provided with the data, we eliminated 31 respondents (13 from the United States, 9 from South Korea, and no more than 3 from the remaining countries) who completed the survey in 2 minutes or less because our pilot testing suggested it would be impossible to read, comprehend, and answer each question in so little time. An additional 35 participants were excluded who did not respond to the outcome variable in the analysis (n = 28) or to at least 2 of the questions in the FSI measure (n = 7). This left 1,934 respondents (or 96.4% of the sample) who were ultimately included in the analysis. 4
This procedure retained 77 respondents (4% of the remaining sample) with at least some remaining missing data on the variables used in the analysis. Rather than discard them, we used a hotdeck imputation procedure (see Myers, 2011) for imputing a response for the single question (n = 58) or questions (2 questions, n = 16; 3 questions, n = 3) these respondents failed to answer. Hotdeck imputation replaces a case’s missing value with a randomly selected value from a case in the same “deck” of similar others. Given the multinational sample, we used a conservative definition of similar and replaced each case’s missing value on a variable with someone from that same country. This imputation method preserves the univariate distribution of the variable within the deck, does not require one to make assumptions about the distribution of the variables such as multivariate normality, as many missing data methods require, and it can be used for nominal or discrete ordinal variables as well as continuous ones. For details on hotdeck imputation, see Little and Rubin (2002), Nordholt (1998), or Reilly (1993). 5
Measures
Fear of social isolation
Dispositional FSI was measured with the five-item scale developed and described above. Following the etic approach to multinational research (see Wirth & Kolb, 2003), an extensive translation procedure was followed (Brislin, 1973; Prieto, 1992) with the goal of maintaining constant meaning of each item in all versions while minimizing differences in wording. To accomplish this, the five FSI items were translated from English to Chinese, French, German, Spanish, or Korean by a native speaker of that language who was also fluent in English. These translated versions were then back-translated to English by a second bilingual person. The back-translated versions of the items were compared to the original English versions. Discrepancies between the back translation and the original items were explained to the first translator. The translation was then adjusted accordingly. Finally, the adjusted items were again back-translated to English by the second translator. After a series of iterations, the translations deemed comparable in meaning to the original English version. 6
Attention to public opinion polls
A single item was used to measure attention to public opinion polls. The English version read, “I pay attention to public opinion polls that are published or discussed by the media.”
Respondents were asked to provide a response on a 5-point Likert-type scale. The English version was translated into the predominant language of the country surveyed by a person fluent in both English and that language.
Demographic controls
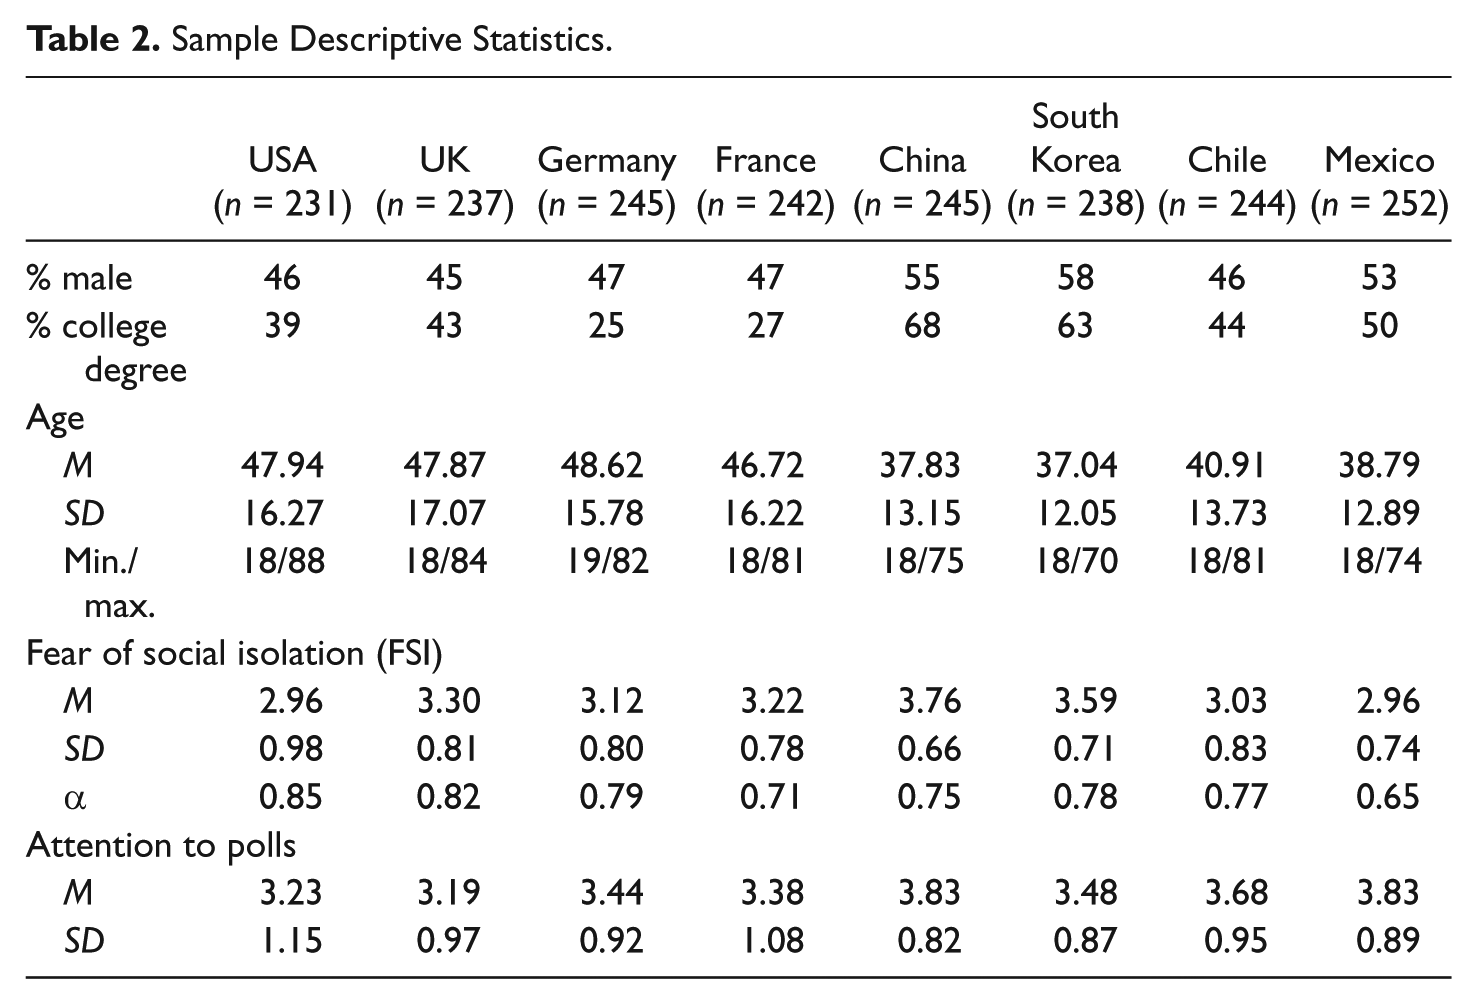
In the analyses we describe next, we estimated the association between FSI and attention to polls both with and without demographic controls that were available and comparable across countries. These controls included sex, age (derived from respondent’s reported year of birth), and whether the respondent reported having a university degree or diploma. Distributional information in the seven countries can be found in Table 2.
Sample Descriptive Statistics.
Analysis
Although we established the unidimensionality of our FSI index in the scale development study described above, we did not assume unidimensionality in all eight countries. Rather, we did a principal axis factor analysis combined with a parallel analysis in each country to empirically assess dimensionality. This analysis revealed only a single factor in each country. We also assessed the fit of a single-factor indicators-as-effects measurement model assuming local independence between indicator errors. In all countries, all factor loadings were positive and statistically significant, and in six of the countries (United States, United Kingdom, France, China, Chile, and Mexico), fit of the model was excellent by commonly used measures (all CFI > 0.98, all TLI > 0.96, all RMSEA < 0.05, all χ2/df < 1.5). Furthermore, the test of the null hypothesis of perfect fit could not be rejected in any of these countries, all χ2(5) < 8.01, all p > .10. In two countries (Germany and South Korea), fit was not quite as good but was still within the range of what most would consider acceptable, Germany: χ2(5) = 11.43, p = .043; χ2/df = 2.29, CFI = 0.98, TLI = 0.96, RMSEA = 0.07; South Korea: χ2(5) = 13.99, p = .02; χ2/df = 2.80, CFI = 0.97, TLI = 0.94, RMSEA = 0.09.
As can be seen in Table 2, in all but one country, an aggregate FSI index constructed as the average response across all five items was sufficiently reliable. In the one country where it was not (Mexico), reliability was only slightly lower than preferred. A test of differences between independent estimates of Cronbach’s alpha revealed significant differences in reliability between countries, χ2(7) = 48.06, p < .001 (see Hakstian & Whalen, 1976). Therefore, in the final analysis examining the association between FSI and attention to polls, we do not use the average response in the analysis, instead opting for a latent variable model.
Establishing unidimensionality and reliability of an unweighted average index in each country does not mean that the five indicators are measuring the same thing in each country. Ideally, we would like to like to be able to establish a form of measurement invariance that is important when testing associations in multiple groups—metric invariance. Specifically, if two cases in country i differ by a unit on the latent variable, we would like to know that this difference maps on to the same difference in what is being measured as it does for cases that differ by the same unit in country j. Metric invariance is established by demonstrating equality of the factor loadings across countries. That is, is the factor loading for item k the same in all countries, and is this true across all k items? As discussed below we cannot establish complete metric invariance here, but we can establish at least partial metric invariance, which is the minimum criterion for cross-cultural comparison of relationships. Partial metric invariance is satisfied if at least two of the factor loadings are identical across countries (e.g., Byrne, Shavelson, & Muthén 1989; Vandenberg & Lance, 2000).
We establish partial metric invariance using a multiple group confirmatory factor analysis and the procedure described by Kline (1998). We freely estimated the variance of the FSI factor in each country and set the factor loadings for FSI2 to 1 in each country (for identification purposes) while freely estimating the remaining factor loadings. This provides a reference χ2 against which model comparisons can be made, χ2(40) = 62.95, p < .01 (CFI = 0.990, TLI = 0.980, RMSEA = 0.049). We then estimated four additional models, each of which constrained the factor loading for a single indicator to be equal in all countries while allowing the loadings for the remaining three indicators to differ across countries. This analysis resulted in a decrement in fit when the loadings for FSI4, or FSI5 were constrained to be equal across countries; in both cases, Δχ2(7) > 13.40, p < .05. However, cross-country equality constraints on the loadings for FSI3 did not produce a significant reduction in fit, Δχ2(7) = 3.77, p > .20, nor did equality constraints for FSI1, Δχ2(7) = 8.65, p > .10. Because the inclusion of equality constraints on FSI3 produced the smallest reduction in fit, we added that constraint and considered it as the new reference model, χ2(47) = 66.72, p = .03, CFI = 0.991, TLI = 0.985, RMSEA = 0.042, and compared it to three models in which we fixed the factor loadings for FSI1, FSI4, or FSI5 to equal in all countries. All of these models resulted in worse fit relative to this reference model; in all cases, Δχ2(7) < 13.60, p < .05.
A close examination of the factor loadings and standard errors in the reference model with equality constraints on loadings for FSI2 and FSI3 showed that additional constraints appeared possible. Specifically, the loadings for FSI4 appeared similar in all countries except China and South Korea, whereas the loadings for China and South Korea for FSI4 appeared similar to each other (but different from the other countries). A model that fixed the loading for FSI4 to equality in the United States, the United Kingdom, France, Germany, Mexico, and Chile, as well as in China and South Korea, did not fit worse than the reference model, Δχ2(6) = 2.83, p > .20. Although further examination suggested some additional constraints might be sensible, we stopped at this point, having established partial measurement invariance with two invariant loadings in all countries and three in six countries. This final measurement model fit very well, and in fact, did not differ significantly from perfect fit, χ2(53) = 69.55, p = .06, CFI = 0.993, TLI = 0.989, RMSEA = 0.036.
Having established partial metric invariance, we can at last progress to testing the association between FSI and attention to public opinion polls. This was accomplished with a multiple group structural equation model treating FSI, estimated as a five-indicator latent variable and as a predictor of attention to public opinion polls. When estimating this model, we imposed the factor-loading-equality constraints on the loadings in the final model described above while freely estimating a path coefficient estimating attention from latent FSI in each country. As before, all indicator error covariances were constrained to zero. We also estimated a similar model with the addition of sex, college degree, and age as controls to rule out the possibility that any association observed between FSI and attention to polls could be spurious. In this second model, we freely estimated the paths from demographics to attention to polls in all countries.
Spiral of silence theory predicts a positive association between FSI and attention to public opinion polls. As can be seen in Table 3, this prediction is confirmed in six of the eight countries. In all but Chile and Mexico, people relatively higher in FSI more strongly endorsed the statement that they paid attention to public opinion polls reported in the media. This pattern was consistent regardless of whether or not demographics were partialled out of the association. Although the generalizability of the positive association across the six countries is noteworthy, we don’t want to overstate the power of this relationship. We also observe that although the association between FSI and attention was positive and different from zero in these six countries, it was generally quite weak, with the proportion of variance in attention explained by FSI never exceeding 0.11.
Model Coefficients and Standard Errors Quantifying Simple (Model 1) and Partial (Model 2) Associations Between Fear of Social Isolation, Demographics, and Attention to Public Opinion Polls (All coefficients are freely estimated in all countries. Coefficients and standard errors are unstandardized).
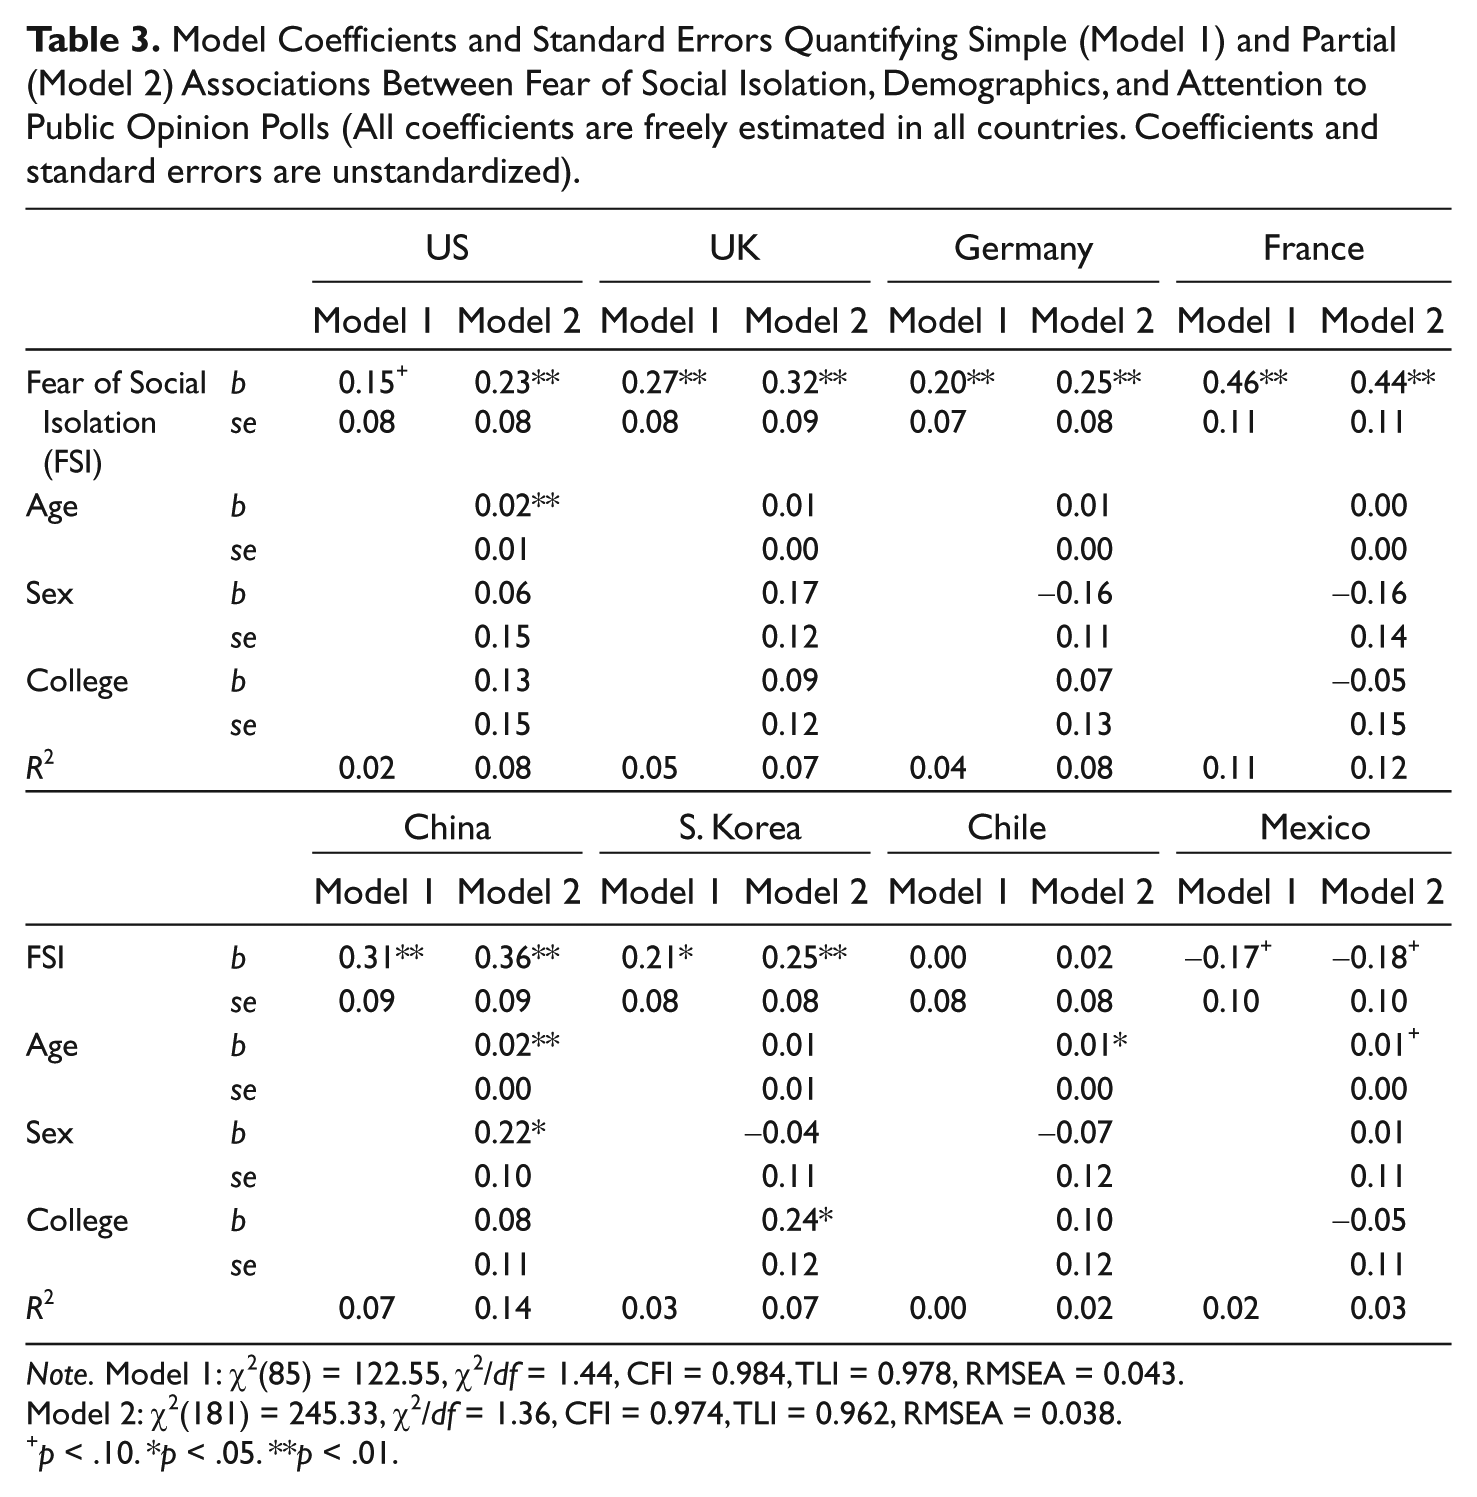
Note. Model 1: χ2(85) = 122.55, χ2/df = 1.44, CFI = 0.984, TLI = 0.978, RMSEA = 0.043.
Model 2: χ2(181) = 245.33, χ2/df = 1.36, CFI = 0.974, TLI = 0.962, RMSEA = 0.038.
p < .10. *p < .05. **p < .01.
Having established partial metric invariance, we are in a psychometrically sound position to conduct a test of differences between countries in the magnitude of the association between FSI and attention to public opinion polls. This comparison was conducted by examining the fit of the model (including demographics) when freely estimating the association in all countries (Model 2) relative to a model (call it Model 3 for the purpose of this discussion) in which the coefficient for FSI is constrained to be equal in all countries. Not surprisingly, given the results displayed in Table 3, the constrained model fit worse, Δχ2(7) = 32.25, p < .001, χ2/df = 1.48, CFI = 0.964, TLI = 0.949, RMSEA = 0.044, suggesting that the relationship is heterogeneous across countries.
That is not to say, however, that all countries differ from each other in the size of the relationship. Figure 2 graphically depicts point estimates and 95% confidence intervals for the coefficient for FSI from Model 2 in Table 3. It is apparent that the association between FSI and attention to polls is roughly the same in the United States, the United Kingdom, Germany, France, China, and South Korea. Indeed, a model that constrains the coefficient for FSI to be the same in those countries (call this “Model 4”) does not fit any worse than Model 2, which freely estimates this coefficient in all countries,Δχ2(4) = 4.493, p > .20, and also fits excellently by absolute standards, χ2/df = 1.34, CFI = 0.974, TLI = 0.963, RMSEA = 0.038. This model allows the coefficient for Mexico and Chile to differ from each other and from the remaining six, and yet Figure 3 suggests the coefficients for Mexico and Chile may not differ from each other. In fact, imposing an additional constraint of equality on the coefficients in Mexico and Chile (call this Model 5) does not reduce fit compared to the prior model that allows them to differ while still constraining the coefficient in all other countries to be the same (model 4), Δχ2(1) = 2.19, p > .20. This model fits excellently in an absolute sense as well, χ2/df = 1.35, CFI = 0.974, TLI = 0.963, RMSEA = 0.043.
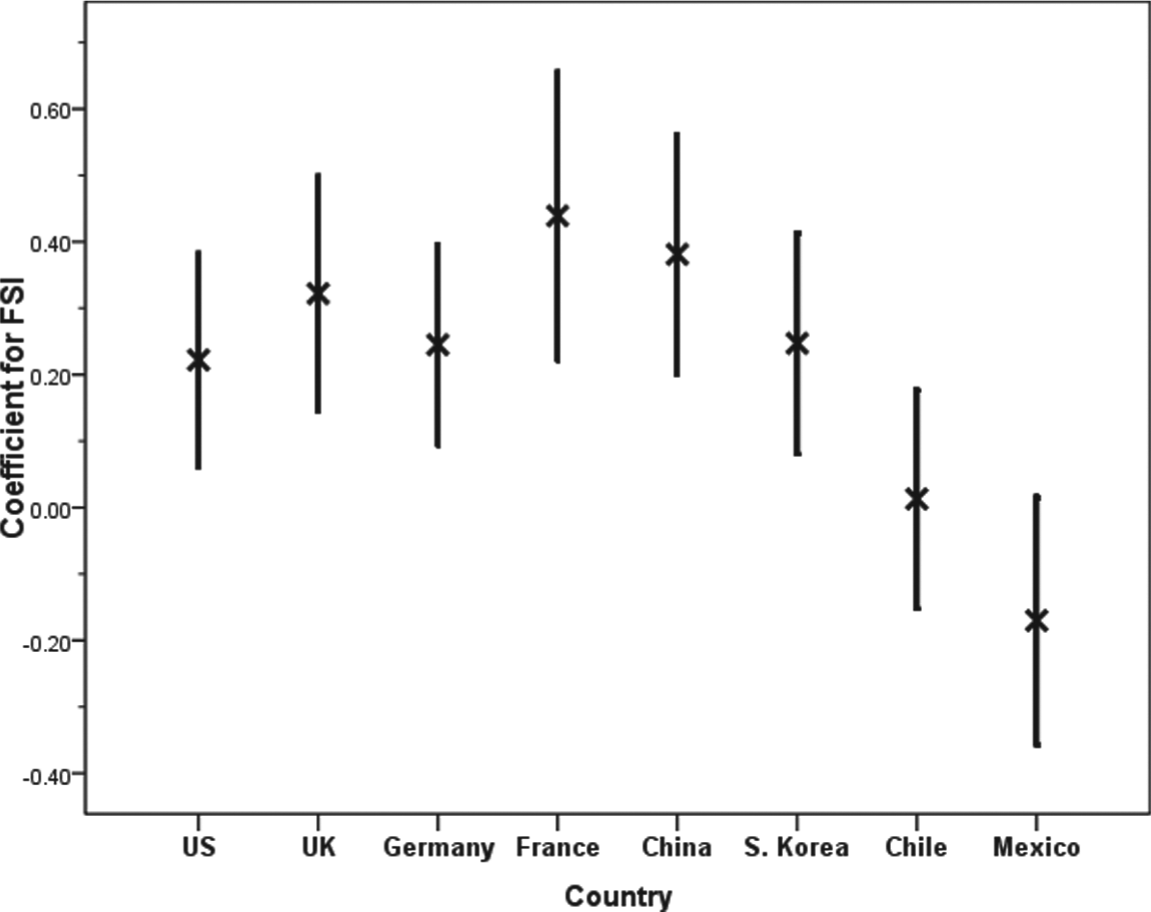
Point and interval estimates for the effect of fear of social isolation on attention to polls (point estimates are X, bars represent 95% confidence intervals).
Another possibility from an examination of Figure 2 is that the relationship in Mexico is different from all others, with the effect in all other countries being the same. Such a model (call this Model 6) does fit better than Model 3, which fixes the coefficients to be the same in all countries, χ2(1) = 18.14, p < .01, and fits excellently by absolute standards, χ2/df = 1.39, CFI = 0.971, TLI = 0.959, RMSEA = 0.046. This leaves one more relevant comparison, and that is between Models 5 and 6, which differ with respect to whether the relationship in Chile is constrained to be the same as Mexico’s or all others’. Unfortunately, these models cannot be statistically compared because they are not nested and require the same number of parameter estimates. A descriptive comparison is all that is possible, using absolute measures of fit. A comparison of these measures (reported above) shows Model 5 is the better fitting of the two, with larger CFI and TLI, and smaller RMSEA and χ2/df.
In sum, this analysis suggests the relationship between FSI and attention to polls is positive and homogeneous in the United States, the United Kingdom, Germany, France, China, and South Korea (with a common coefficient of b = .30, p < .001) but different from the relationship in Mexico and Chile, which are themselves homogeneous in this relationship, where this is no evidence of association (with a common coefficient of b = −.07, p > .20).
Discussion
Does FSI lead people to attend to the social environment in order to assess what people are thinking about the topics and issues of the day? According to spiral of silence theory, it does, but this proposition until now had never been put to empirical test. After developing a new, unidimensional, trait-based measure of FSI, we found that in six of eight countries we examined those who reported relatively greater FSI reported relatively more attention to public opinion polls. Although there are alternative explanations for the association that we cannot completely rule out with these data, our findings suggest that such fear does serve to stimulate the quasi-statistical organ to tune into the signal of public opinion transmitted through the mass media in the form of public opinion poll results.
However, there may be some cultural boundaries to this process. We found remarkable homogeneity in the magnitude of the relationship between individual-level FSI and attention to public opinion polls across six of the eight countries we studied. However, in the two Spanish-speaking countries we sampled (Mexico and Chile), we found no evidence of such association. It is tempting to speculate about whether this reflects some kind of culture- or language-specific boundary condition on spiral of silence processes, but we refrain from indulging in such explanations because we can’t rule out some methodological alternative explanations that are equally plausible. We took great pains to try to minimize between-country variation in the mechanics of data collection. In every country, data collection was conducted with an online survey, using the same company for sampling and web hosting. We restricted our data collection to those who had volunteered to participate in internet survey panels in exchange for various incentives, and we engaged in a rigorous translation of items to minimize between-country variation in the questions actually being asked. Yet in spite of these precautions, our samples differed from each other with respect to the distribution of age and education (see Table 2), perhaps due to demographic differences between countries in internet access. Although such differences cannot explain between-country homogeneity, they could account for between-country heterogeneity. This is one of the inherent difficulties of doing cross-cultural comparative research of this sort. It is virtually impossible to rule out method-based alternative explanations for country-to-country variation entirely, even after satisfying various statistical requirements such as cross-cultural measurement invariance.
Several spiral of silence studies published in the past decade have been motivated by the question as to where in the dynamic system of public opinion evolution FSI resides (e.g., Petrič & Pinter, 2002; Shoemaker et al., 2000). Is FSI merely one of many exogenous variables that only directly influence willingness to speak out? Or does fear indirectly influence public opinion expression through its effects on perceptions of the opinion climate? Or is FSI intermediate (i.e., a mediator) between perceptions of the opinion climate and willingness to speak out? In the remainder of this manuscript we take a stand on some of these questions and offer some proposals of our own.
Our data only support the proposal that FSI can influence perceptions of public opinion through increased attention to information pertinent to the current opinion landscape. We cannot say that fear influences congruence between one’s own opinion and the perceived opinions of others, as some have proposed, although it is possible it could, by influencing accuracy in the perception of public opinion or exacerbating biases in such perceptions. Our trait-based conceptualization of FSI is inconsistent with the proposal that FSI serves as a mediator of the influence of perceptions of congruence between own and others’ opinions and opinion expression, as this fear presumably is not under the influence of situation-specific variables (such as perceived self-public opinion congruence).
We propose that FSI is best conceptualized as antecedent to public opinion perception, directly influencing public opinion expression regardless of perceptions while also moderating the effects of perceived self-other opinion congruence on expression. First, we have established that people who differ in FSI also differ in the attention they pay to mass-mediated information available about the opinion landscape. Presumably, such greater attention is likely to translate into perceptions of the opinion landscape that will differ somewhat from those who are paying less attention to this information (a point we take up in more detail soon). More specifically, our findings suggest the possibility of a relationship between FSI and accuracy in public opinion perception (see Major, 2000). It is routine in spiral of silence research to ask people what they think others think and then use the match between their own opinions and perceptions of the climate as a predictor of willingness to speak out. But individuals frequently fail to appreciate when their opinions are widely shared, or they project their own opinions onto others (Glynn, Herbst, O’Keefe, & Shapiro, 2004). According to our results, people relatively higher in FSI are more likely to attend to information about the opinion climate. Although we have no relevant data to support this claim, it stands to reason that such increased attention would produce greater accuracy in perceptions of the distribution of public opinion. Whether those relatively higher in FSI are indeed more accurate in their perceptions of the opinion climate is a question worth pursuing, and our measure could be used to answer it.
Second, although our data do not allow us to establish that FSI directly influences public opinion expression, this fear is likely correlated to some extent with other individual differences that will influence such expression. Earlier, we criticized prior researchers’ failure to distinguish conceptually between these alternative constructs and FSI. In this study, we attempted to (and had some success) at developing a measure minimally correlated with “shyness.” At the same time, we recognize that many individual differences that predict opinion expression are likely to be correlated with FSI to some extent. It is hard to imagine an FSI measure that is completely purified of other personality characteristics that define those who worry about being alone, socially ostracized, or perceived in low esteem in the eyes of others—characteristics that are certainly related to willingness to speak out regardless of the prevailing opinion climate (see Petrič & Pinter, 2002).
Third, although not formally recognized by research to date within the framework of spiral of silence theory, FSI should also moderate the effects of perceived opinion congruence on public opinion expression rather than just directly influence expression. People who vary in FSI should differ in their use of cues about the opinion climate when deciding whether to publicly voice their opinions. Rephrased, if FSI were the motivating force prompting silence in the face of a dissenting majority, only those who fear isolation to some extent should be willing to silence themselves as a function of perceptions of support for their own opinions. Those who have little fear of isolating themselves should not be affected by their perceptions of the opinion landscape when deciding whether to express their viewpoints publicly. If such a pattern could be empirically substantiated, we can claim more confidently that FSI not only motivates the search for information about the opinion climate but also motivates the silencing of those who perceive their opinions are in the minority.
We close by returning to measurement considerations. Specifically, are we actually measuring FSI rather than something else? We can’t say so unequivocally. Scale validation is a long and extensive process. Yet validation consists in part of assessing whether an instrument purportedly measuring a given construct predicts other outcomes that it should be able to predict according to theory if the instrument is in fact measuring the claimed construct. We have shown that, as predicted and explained by spiral of silence theory, people who differ in their level of FSI also differ in the attention they pay to information in the media environment about what others are thinking. Thus, our results both support spiral of silence theory and attest to the validity of the instrument that we have designed. Of course, further research using this measure will help to determine whether it is measuring this fear or something different altogether.
Footnotes
Declaration of Conflicting Interests
The authors declared no potential conflicts of interest with respect to the research, authorship, and/or publication of this article.
Funding
The authors received no financial support for the research, authorship, and/or publication of this article.
1.
Lee, Detenber, Willnat, Aday, and Graf (2004) conducted a cross-cultural study based on a similar logic, although they also included an individual-level measure of fear of social isolation (FSI).
2.
Parallel analysis is generally recommended over more commonly used methods such as the Kaiser criterion (eigenvalue > 1) or a scree plot because these methods are arbitrary and subjective, whereas parallel analysis is based on empirical criteria and has been shown to more reliably extract the correct number of factors (Fabrigar, Wegener, MacCallum, & Strahan, 1999; Morrison, 2009). A parallel analysis proceeds by first extracting the five eigenvalues from the correlation matrix of original data. These eigenvalues are then compared to the distribution of corresponding eigenvalues when repeatedly sampling from a 5 × 5 population correlation matrix of mutually uncorrelated variables. Those eigenvalues from the real correlation matrix that exceed a prespecified cutoff of corresponding eigenvalues in the distribution of generated when factor analyzing random data represent “real” factors.
3.
4.
Excluded cases were distributed across country disproportionately, χ2(7) = 26.90, p < .001, with the exclusion rate highest in the United States (n = 19, or 8% of the U.S. sample, accounting for 26% of the excluded cases) followed by the United Kingdom (n = 14) and South Korea (n = 12). There was no evidence that excluded cases differed from included ones in sex, χ2(1) = 0.27, p > .20, or whether they possessed a college degree, χ2(1) = 0.10, p > .20. However, cases excluded from were, on average, younger than those retained, t(2002) = −2.20, p < .05, with mean ages of 39.04 and 43.16, respectively.
5.
There was no difference between countries in the need to impute, χ2(7) = 4.46, p > .20, or in the distribution of the number of variables that required imputation, p > .20 by a randomization test.
6.
Copies of the translations are available on the first author’s web page or can be obtained by request through email.