
Abstract
This study tested a causal relationship between international public relations (PR) expenditure and its economic outcome at the country level by using a time-series analysis. International PR expenditures of four client countries (Japan, Colombia, Belgium, and the Philippines) were collected from the semi-annual reports of the Foreign Agency Registration Act (FARA) from 1996 to 2009. Economic outcome was measured by U.S. imports from the client countries and U.S. foreign direct investment (FDI) toward them. This study found that the past PR expenditure holds power in forecasting future economic outcomes for Japan, Belgium, and the Philippines except Colombia.
Keywords
Introduction
The bottom-line effect of public relations (PR) has long challenged scholars because it is, by nature, intangible and difficult to measure in dollar terms. PR expenditure is easily targeted during periods of economic downturn when organizations and nations are in search of means to reduce cost. Is it really worth the investment?
Largely due to methodological challenges, only a few studies have so far offered empirical evidence of the economic outcomes of PR expenditure (Ehling, 1992). Kim (2000) tested several models adapted from advertising and found a positive relationship between an organization’s reputation and its revenue. Kim (2001) also found a positive association between PR expenditures and revenue change, this time mediated by company reputation. Lee and Yoon (2010), testing the bottom-line effect of international PR at the country level, found that the number of PR contracts in the United States is positively related to U.S. direct investments in a client’s host country, the number of in-bound U.S. tourists, and the volume of U.S. imports.
Despite their encouraging outcomes, these studies have not sufficiently refuted a reverse relationship between expenditure and outcomes; nor have they successfully ruled out alternative explanations. It is conceivable that a company’s profit and revenue change (an economic outcome) can trigger PR expenditure because the market share needs to be maintained, if not expanded. Thus, applying a simple regression model may not be appropriate for studies that use country as the unit of analysis because country is not a homogeneous variable. More rigorous model testing is thus necessary to confirm a bottom-line effect.
Scholars have long argued that PR effects are long term (Dozier & Ehling, 1992; L. Grunig, Grunig, &Ehling, 1992; Signitzer & Coombs, 1992), suggesting the importance of the time factor. However, studies that have so far examined the economic returns of PR expenditure share a fundamental limitation of causality. Causality was difficult to ascertain mainly because the relationship was tested based on cross-sectional analyses without considering time order. This study aims to fill this research gap by applying a time-series analysis to test whether PR expenditures actually result in economic outcomes, focusing on PR effects at the country level.
Literature Review
Effectiveness of International PR
People and information today easily cross national boundaries, affecting national policies and priorities. Golan, Johnson, and Wanta (2010) described this phenomenon as the “fall[ing] of barriers,” which is a consequence mainly of advances in communication technology (p. 3). In a heavily connected world, a country’s diplomatic initiatives tend to influence the publics of a target country, not just its government (Kunczik, 1997; Manheim & Albritton, 1984; Signitzer & Coombs, 1992; Signitzer & Wamser, 2006). In other words, it can be said that international politics and a country’s foreign policy are heavily affected by a string of factors, including media coverage, public perceptions, non-state actors, and domestic coalition partners (Entman, 2003; Gourevitch, 1978; Nye, 2004). These potential antecedent variables often demand from governments strong PR strategies to build and manage a favorable relationship with foreign publics. According to Zhang and Swartz (2009), the goal of international PR is to advocate for a client country’s national interest by cultivating and promoting a positive image, mutual understanding, shared norms, and ethics through various types of communication.
In recognition of this, PR scholars and practitioners have been increasingly considering foreign publics, including foreign governments, as target publics (Botan &Hazleton, 2006; J. Grunig, 1993; J. Grunig, Grunig, & Dozier, 2006; Signitzer & Coombs, 1992; Sriramesh & Vercic, 2003). Although debates about the value of international PR persist, many agree that moving the public perception needle toward the positive end in a target country’s media is a valid measure of effect. Thus, those who manage national reputation or image do their best to influence a target country’s news coverage about their client country (Kunczik, 1997, 2003; Lee, 2006, 2007; Manheim & Albritton, 1984; Sriramesh & Vercic, 2003; Taylor & Kent, 2006).
This practice has found some empirical support. Manheim and Albritton (1984) reported multiple instances in which a client country’s PR interventions changed its visibility and the valence with which it is viewed in U.S. news coverage. For example, PR efforts moved the American media’s rather negative perception of South Korea into the positive side. Similarly, Lee (2007) showed that the number of PR contracts of a client country in the United States can influence the prominence of U.S. news coverage about that country after controlling for multiple national traits and social significance predictors, which may also have a bearing on news coverage.
Scholars also note that building relationships and establishing a positive reputation with foreign publics through news media coverage can contribute to the bottom line of an organization or a country in the long run (Campbell, 1993; L. Grunig et al., 1992; Hon, 1997; Lee, 2006). According to Lee (2006), the primary purpose of international PR activities is to boost economic interest for home countries. After analyzing 151 countries’ PR contracts in the United States, Lee (2006) found that meeting government officials, information dissemination, event promotion, media relations, advising and counseling, and speech writing are the most common PR activities that reach and influence the U.S. publics. About 51% of the contracts had economic purposes, mainly related to trade and investment (Lee, 2006).
PR influences an organization’s bottom line—which translates to making or saving money—by building and maintaining positive relationships with its publics (Broom, Casey, & Ritchey, 1997; Campbell, 1993; J. Grunig et al., 2006; L. Grunig et al., 1992; Hon, 1997; Kim, 2000, 2001). PR help organizations make money by establishing positive attitudes among investors, shareholders, and customers (Dozier & Ehling, 1992; J. Grunig et al., 2006; L. Grunig et al., 1992). They help save money by deflecting pressure from activist groups, government regulations, litigation, consumer boycotts, and other negative reactions (J. Grunig et al., 2006; L. Grunig et al., 1992; Hon, 1997).
This conceptual approach has been tested by monitoring factors that are difficult to measure such as attitudes, reputation, brand image, corporate or state identity, and intention (Dozier & Ehling, 1992; J. Grunig, 2006; Hon, 1997). In the search for more tangible evidence, Hauss (1993) found a positive relationship between press releases and consumer inquiries. Kim (2000, 2001) reported a positive relationship between PR expenditure and revenue change mediated by corporate reputation. Lee and Yoon (2010) observed a positive relationship between international PR and economic outcome at the country level. By examining the number and dollar amount of PR contracts of 97 client countries in the United States, they found that the number of PR contracts was positively related to the number of U.S. tourists, the amount of U.S. imports, and the volume of U.S. direct investments, after controlling for the economic size, which was measured by Gross Domestic Product (GDP) of the client country.
Nevertheless, some executives and managers remain unconvinced about the bottom-line effect of PR expenditure (Campbell, 1993; Hon, 1997) mainly because studies that have reported so have tested the relationship indirectly through reputation and media coverage. A time lag does exist between the PR investment and its economic outcomes (e.g., Dozier & Ehling, 1992). This study argues that including time lag to the analysis adds to the validity of the measure. For example, if the time lag between the investment and the economic outcomes does not change over time, the two variables can be tested directly by using the time lag. The following sections explain the concept of time lag in the economic model, and then introduce the model of causality test.
The Lagged Effect of International PR
It takes some time between people’s exposure to a persuasive message and their expected behavioral change. In a similar way, there is a time lag between PR interventions and their desired outcome. The concept of time lag is important because it explains not only actual economic relationship (Fisher, 1925; Jastram, 1955; Palda, 1965) but also enables testing the causal relationship between two variables based on time (Granger, 1969, 1988; Granger & Newbold, 1974; Toda & Yamamoto, 1995). In actual economic relations, economic returns are not direct effects of the investment observed only at a certain point in time, but are instead distributed over time (e.g., Palda, 1965). Incorporating the time lag elicits more powerful causality statements because returns accruing in the future cannot possibly cause investments in the past (Granger, 1969). Fisher (1925) explained that profit tends to increase when producers face higher production costs, which bumps up the price. This is because the total expenditures include expenses incurred before the prices went up, and lesser expenses at an earlier point in time tend to generate larger differences between receipts and expenses than those in the current period. Thus, the expenditure in a certain point of time is related to the outcomes at succeeding time points. In short, the economic outcomes associated with a certain investment are distributed over time.
The lagged effect has been mathematically explained and empirically tested in advertising. According to Jastram (1955), the effect of an advertising expenditure on sales revenue at a given time point is accumulated by the previous expenditure’s lagged effect on a given time point’s sales revenue. Imagine, for example, monthly investments that are identical in amount. In addition, the effect of each investment on sales is seen in 3 months, and that the effect on succeeding months is decreased from 4 to 3, and then to 1. At the first month, the sales figure changes by 4 due to the investment made during the first month. At the second month, due to changes in sales because of the investment at the second month, the sales changes in the second month will be 4. But because it is also cumulated by the lagged effect of the investment at the first month, which affects the second month (i.e., 3), the total change in sales in the second month would be 7. Similarly, the sales changes at the third month would be 8, representing the sum of the effects of investments at the first (lagged), second (lagged), and the third months (Jastram, 1955). The lagged effects at a certain time point cannot last forever; eventually it goes down to 0. Therefore, even though the same dollar amount is invested every month, the actual sales graph is more likely to show an S-curve rather than a horizontal line (because the effects of the investment on sales are lagged and cumulated) or a vertical line graph (because the lagged effects decrease over time and eventually vanish).
Applying this concept, Palda (1965) tested several advertising models to find the one that best predicts product sales for the Lydia E. Pinkham Company from 1907 to 1960. He found that Koyck’s lagged effect model, which is a model that includes the lagged effects, was the most accurate in predicting sales as a function of advertisement expenditures (Palda, 1965).
The lagged effect is also conceptually important because the serialized data of economic outcomes represent other possible effects, including those on investments in the preceding time points. Say, for example, that Yt is the set of serialized data of economic outcomes and Xt is the serialized data of investments. If the variance of Yt is normally distributed over time, the other effects on Yt over time are also normally distributed (Box, Jenkins, & Reinsel, 2008). This is called the “stationarity” assumption, a critical aspect in time-series analysis. The stationarity assumption suggests that the current output of yt can be sufficiently predicted by the past terms of Yt (i.e., yt−1, yt−2, etc.). Thus, a study can test the significance of the effect of Xt on Yt by analyzing the effect of, for example, the significance of xt−1 and xt−2 on yt after controlling for yt−1 and yt−2. This is the essential concept of the Granger causality test. In devising the test, Granger (1969) argued that “if series Y contains information in past terms that helps in the prediction of X, and if this information is contained in no other series used in the predictor, then Y is said to cause X” (p. 430). Consequently, the Granger causality model tests the direct relationship between two or more series after controlling for other possible effects on the dependent series. Considering this statistically controlled relationship that requires careful attention to interpret the results, previous studies have referred to this relationship as “Granger-cause” rather than “cause” (e.g., Magnus & Fosu, 2008). Thus, this study tests whether the international PR expenditures of a client country “Granger-cause” the economic outcomes in a target country.
A number of studies have focused on trade and foreign direct investment (FDI) as economic outcomes of the international PR (Lee & Yoon, 2010; Wang, 2006). Magnus and Fosu (2008) and Majagaiya and Gu (2010) found that FDI produces local economic growth. Therefore, the more international PR expenditure a client country spends on a target country, the more economic outcomes the country can expect to generate over time.
This study posits that
Method
Measures of International PR Expenditure
The U.S. government collects details of PR contracts between foreign clients and their agency firms in the United States. These are compiled in a report mandated by the Foreign Agency Registration Act (FARA), which provides the number and dollar amount of contracts and the main activities each contract involves (U.S. Department of Justice, 2012). FARA reports include PR activities in the United States on behalf of other countries, such as political and quasi-political lobbying, media relations, symposiums to solicit U.S. investments, advertising, and promotional and marketing costs. These specific activities are parts of a broader effort to build and manage positive relationships with various publics in the United States. Although the FARA reports may not capture all activities and events, the reported purposes are considered valid enough to capture international PR activities at the country level.
The FARA reports offer an opportunity to examine international PR activities that have the United States as a target country. PR expenditure by a client country was measured by the dollar amounts specified in the FARA archive from 1996 to 2009. Because the FARA archives are organized as semi-annual reports, 6 months was chosen as the time unit; there were 28 total time points. In time-series analysis, the selection of time point interval varies; it can be daily, weekly, monthly, or even yearly. While the interval is important to test relationships, the number of time points is more critical. It is important whether the same interval is consistently considered in both independent and dependent time series. This is because a time-series analysis is concerned with “differences between units in a pattern of change, or in the effects of a change in one variable on another over time [rather than a change in one time point to the other time point]” (Gonzenbach & McGavin, 1997, p. 120).
Four client countries (Japan, Colombia, Belgium, and the Philippines) were selected based on the size of their international PR expenditure. The second annual FARA reports for 1996, 2002, and 2009 were selected to calculate the mean dollar value of international PR expenditure for 189 countries. After eliminating the countries with mean PR expenditure under US$30,000 (considered negligible as a country-level investment), 74 countries remained on the list. These were then ranked according to dollar amount (from highest to lowest), and then divided into two groups (high vs. low investment countries) cut by median value. Japan and Colombia represent the high international PR expenditure group; Belgium and the Philippines constitute the low expenditure group.
GDP per capita figures, which indicate economic size, were obtained from the 2012 World Bank data. Based on the standards of the Organization for Economic Cooperation and Development (OECD), Japan and Belgium were selected from the high-income group (above US$42,220); Colombia and the Philippines were chosen from the middle-income group (US$7,325-US$1,882; see Table 1).
PR Expenditure in the United States and Gross Domestic Product per Capita.
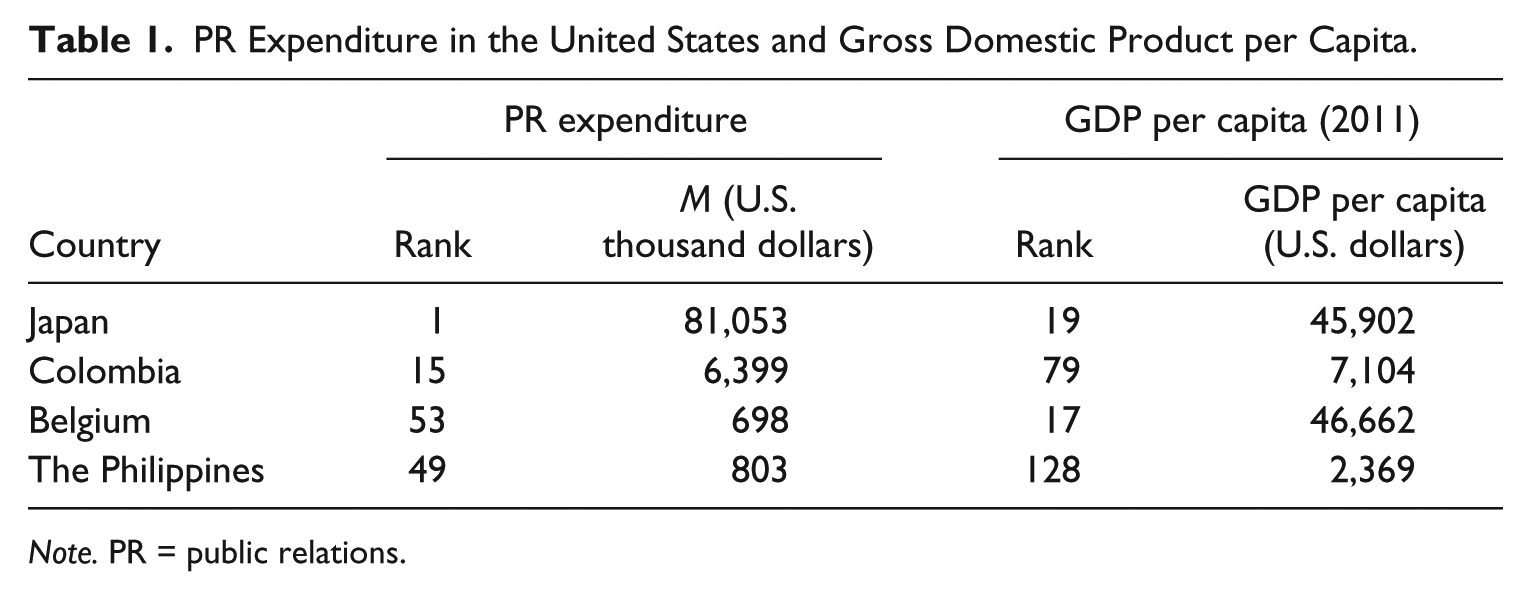
Note. PR = public relations.
Measures of Economic Outcomes
Economic outcome was measured by two indicators: (a) U.S. imports from a client country and (b) U.S. FDIs to a client country. U.S. imports from the four client countries were collected from foreign trade data available from the U.S. Census Bureau (2012). These data, which include government and non-government shipment of goods, were collected from the U.S. Customs and Border Protection Agency of the Department of Homeland Security. Although the data contain reporting and capturing errors, these errors can be treated as random (U.S. Census Bureau, 2012). U.S. FDIs to the four client countries were collected from the Bureau of Economic Analysis of the U.S. Department of Commerce (2012). These quarterly data measured financial outflows resulting from transactions and positions between U.S. parent companies and their foreign affiliates (U.S. Department of Commerce, 2012). Foreign affiliates are enterprises located in a foreign country in which the United States controls 10% or more of the voting stock. This is a valid measure of economic outcome because growth in the number of foreign affiliates is related to the growth of local business.
To analyze the causal relationship between international PR expenditure and U.S. imports, all data series were transformed by natural logarithm. In the following equations and in the resulting tables, LPR stands for a client country’s PR investment in the United States (in U.S. dollars), and LIMP stands for U.S. imports from a client country (in U.S. dollars). To analyze the causal relationship between international PR expenditure and FDI, the data series were not transformed because the original data contain negative values. In the resulting tables, the notation “PR” represents the PR expenditure of a client country in the United States, and FDI stands for U.S. direct investments in a client country.
Time-Series Analysis
Like many econometric studies (Blood & Phillips, 1995, 1997; Granger, 1969, 1988; Granger & Newbold, 1974; Hacker & Hatemi-J, 2006; Magnus & Fosu, 2008; Majagaiya & Gu, 2010; Toda & Yamamoto, 1995), this study used a vector autoregressive (VAR) model. In time-series analysis, the stationarity of the series is strictly required (Box et al., 2008; Brocklebank & Dickey, 2003). Stationarity indicates that covariance is normalized over time within the same time lag; thus, if a data series is assumed to be stationary, the constituent data can be forecast based on time (Box et al., 2008). Otherwise, the series is considered non-stationary. A non-stationary series can be transformed into a stationary series by the process called difference (Box et al., 2008; Brocklebank & Dickey, 2003). Among several “unit root” tests to determine whether a series is stationary or non-stationary, this study used the augmented Dickey-Fuller (ADF) test. In order to select the optimal lag length for a VAR model, the Akaike Information Criterion (AIC) was applied. It gives a specific value when each lag is added to the mode and yields the smallest value of a criterion when the added lag is optimal.
The simple autoregressive distributed lag (ADL) model
If both series are assumed to be stationary, the ADL Granger causality model can be used (Figure 1). The ADL model implements the following regression models in testing the null hypothesis, H0:
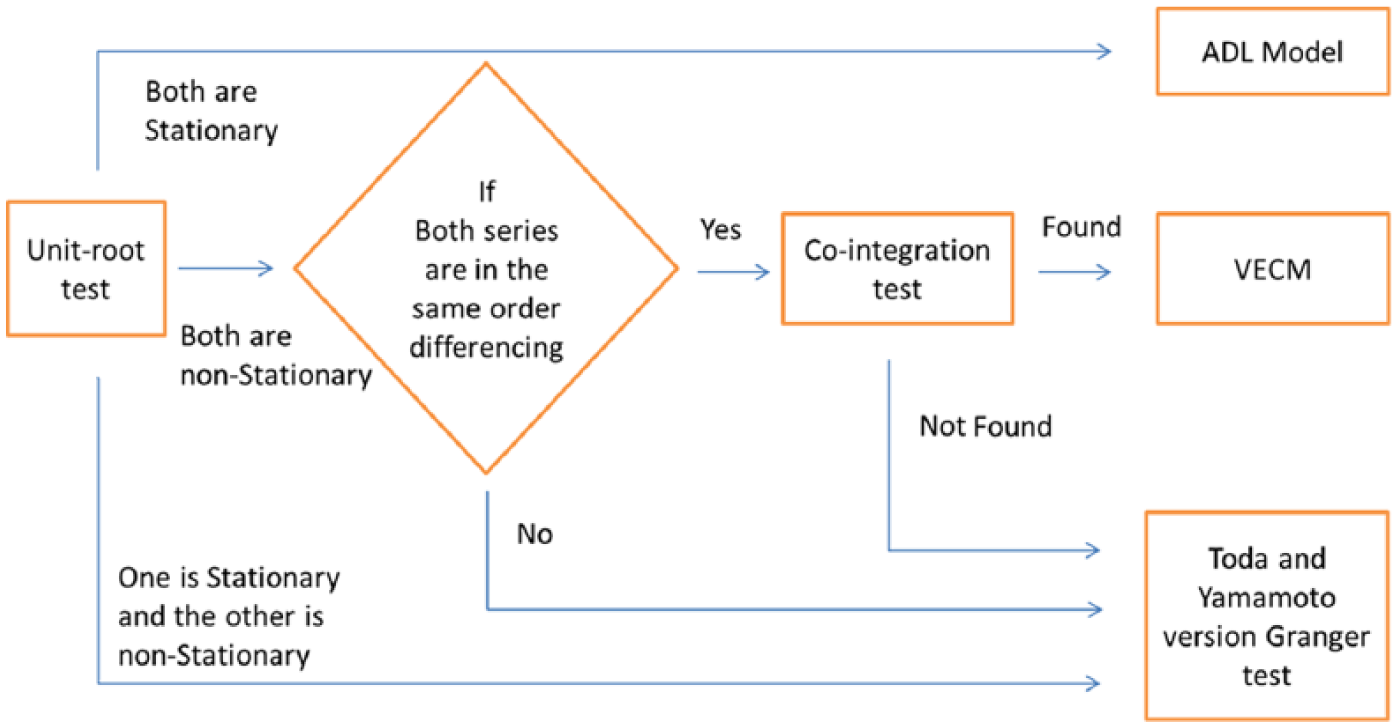
Analysis of the causality test based on pre-test results.
Unrestricted model:

Restricted model:

where k is the optimal lag order of the VAR model.
If the result of the F test rejects the null hypothesis of
The vector error correction model (VECM) Granger causality test
If the non-stationary series is transformed into a stationary series after conducting the same order of difference, the VECM can be used (Figure 1). In this model, the coefficient of the error correction term indicates whether the long-running causal relationship is significant or not (Box et al., 2008; Mehrara, 2007). The VECM Granger causality test for this study was conducted by using the following VAR models.
Unrestricted model:

Restricted model for short-run causality:

Restricted model for long-run causality:

Restricted model for strong causality:

where k is the optimal lag order of the VAR model and ECT is the error correction term.
The null hypothesis of the VECM Granger causality model,
A shortcoming of this model, however, is that it requires the same order of difference. The causal relationship may be spurious if the order of difference is different or if there is no co-integration between the two series (Granger & Newbold, 1974). Co-integration indicates “common trends” in two or more non-stationary series (Box et al., 2008, p. 571). In this study, the Johansen co-integration test was applied (Table 3). The relationship between LPR and LIMP of the VAR models for Japan and the Philippines fell under this case.
The Toda and Yamamoto version of the Granger non-causality test
Another way to handle the problem is to use the Toda and Yamamoto test (hereafter referred to as “the T-Y test”), which offers several advantages. First, it analyzes the original series regardless of whether it is stationary or non-stationary. Thus, it avoids the problems of unit root tests that have a high possibility of falsely rejecting the null hypothesis (Toda & Yamamoto, 1995). Second, the T-Y test does not require a co-integration test, which is known to be too sensitive to sample sizes (Toda & Yamamoto, 1995).
The T-Y test procedure uses the augmented VAR (k + dmax) model, where k is the optimal lag length in the original VAR system, and dmax is the maximal order of integration of the variables in the VAR system (Magnus & Fosu, 2008). For example, if one of the series is stationary that does not require any order of difference, and the other is non-stationary that requires one order of difference, then the maximal order of integration is one. The following VAR models, which tested the null hypothesis,
Unrestricted model:

Restricted model:

where k is the optimal lag order of the VAR system and dmax is the maximal order of integration of the variables.
Although the T-Y test has several advantages, Toda and Yamamoto (1995) emphasized that “it should be regarded as complementing the pretesting method that may suffer [from] serious biases in some cases” (p. 246). Therefore, this study used the simple ADL model and the VECM Granger causality test for countries that satisfy the pre-test results. The T-Y test results for all relationships also are shown so that the results can be compared. Figure 1 diagrams the sequence of analysis based on the pre-test results.
Results
International PR Expenditure and Imports
Based on the result of the ADF test, this study applied first-order difference to both series of LPR and LIMP in the VAR models of the four countries. Table 2 shows the result of the unit root tests for each series.
ADF Unit Root Test for PR and Imports.
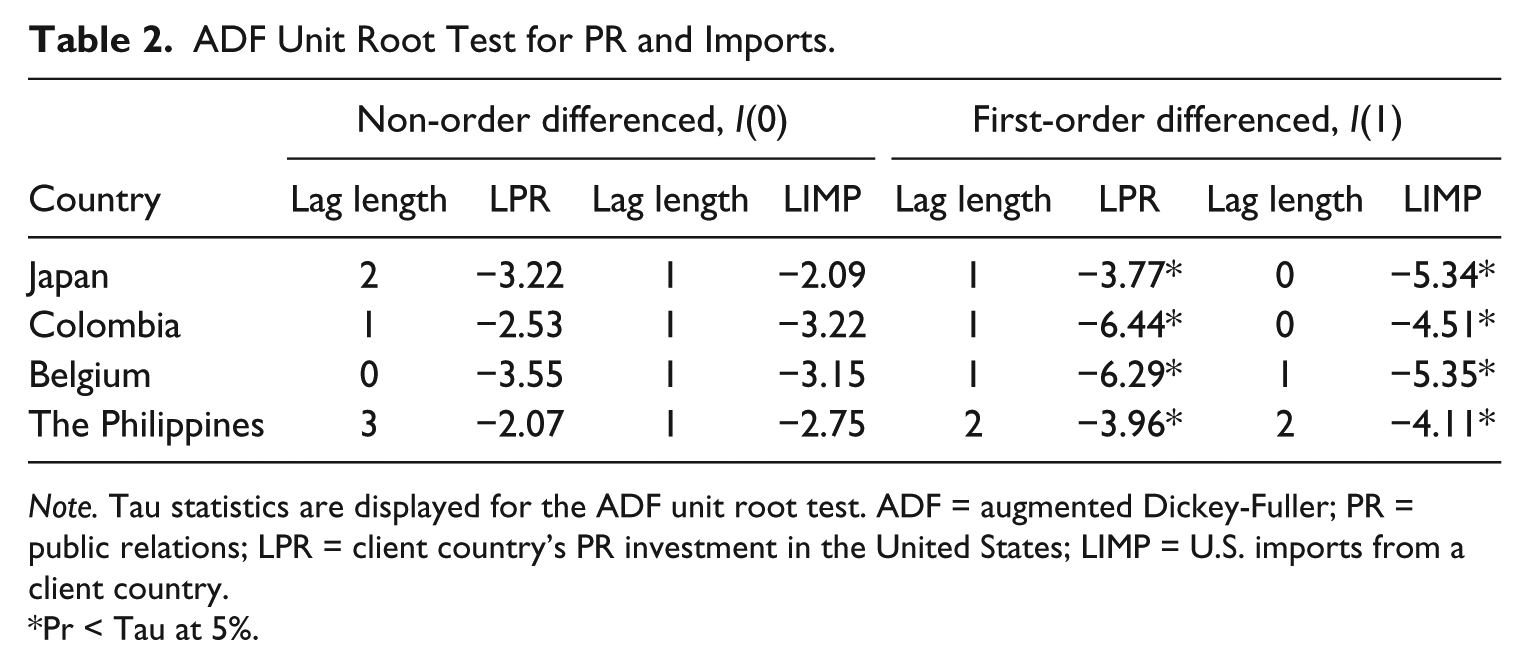
Note. Tau statistics are displayed for the ADF unit root test. ADF = augmented Dickey-Fuller; PR = public relations; LPR = client country’s PR investment in the United States; LIMP = U.S. imports from a client country.
Pr < Tau at 5%.
In order to determine the optimal lag length, the AIC of each lag was compared. The optimal lag lengths for the VAR model of each country were as follows: Japan = VAR (1), Colombia = VAR (1), Belgium = VAR (4), and the Philippines = VAR (2). The Johansen co-integration test was conducted. The results are shown in Table 3.
Johansen Co-Integration Test.
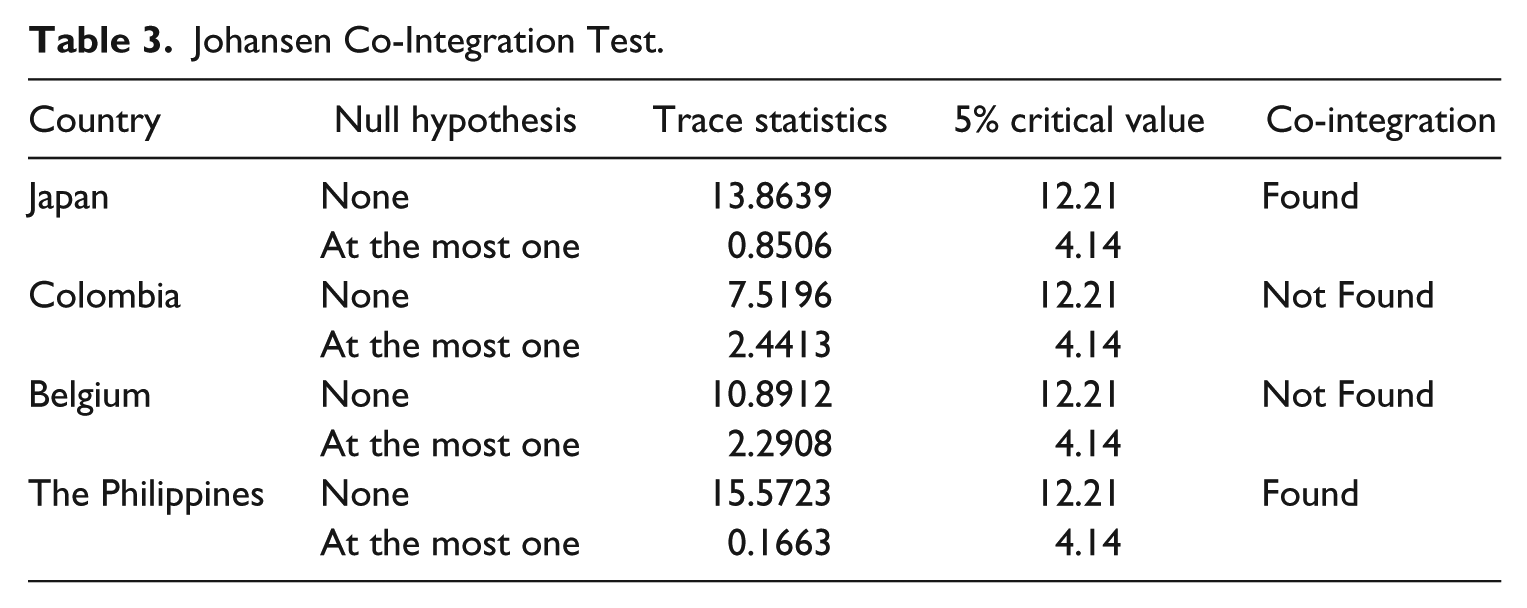
Based on the pre-tests, this study conducted the VECM Granger causality test for Japan and the Philippines and the T-Y test for Colombia and Belgium. Tables 4 and 5 show the details of these causality tests.
Vector Error Correction Model for PR and Imports.

Note.F statistics are displayed with probability values in parentheses. PR = public relations; VAR = vector autoregressive; LPR = client country’s PR investment in the United States; LIMP = U.S. imports from a client country.
p< .05. **p< .01.
Toda and Yamamoto Causality Test for PR and Imports.

Note.F statistics are displayed with probability values in parentheses. PR = public relations; VAR = vector autoregressive; LPR = client country’s PR investment in the United States; LIMP = U.S. imports from a client country.
Indicates the optimal lag order k.
p< .05. **p< .01.
As Table 4 shows, the U.S. imports from Japan were significantly granger-caused by Japanese PR expenditure in the United States. For Japan, which is optimized with the VAR (1) model, the short-run causality (also called the Granger weak causality) showed that LPR significantly influenced LIMP. The long-run Granger causality, which tested the error correction term, also showed a significant causal relationship between LPR and LIMP. The strong Granger causality result for Japan, which jointly tested the long-term and short-term regressors’ coefficient, indicated the same pattern. There was no significant causal relationship in the opposite direction. Thus, the hypothesis was supported for Japan.
For the Philippines, which was optimized with the VAR (2) model, showed no causal relationships between LPR and LIMP. However, there was a strong and significant Granger causality in the reverse order (from LIMP to LPR). Thus, the hypothesis was not supported for the Philippines.
For Colombia, the results on the first lag showed no significant causal relationships in both directions (Table 5). Rather, for Colombia, LIMP granger-caused LPR significantly. The direction of the causality (from LIMP to LPR) was significant at the second, third, and fourth lags. Thus, the hypothesis was not supported for Colombia.
For Belgium, LPR was found to have granger-caused LIMP at every lag. Also, at the fourth lag, a causal relationship at the opposite direction was significant. However, this study regards the causal relationship for Belgium to be unidirectional than bidirectional because the first lag was the optimal lag order for the VAR model. Other than the fourth lag, no causality in the opposite direction was found. Thus, the hypothesis was supported for Belgium.
International PR Expenditure and Foreign Direct Investment
Table 6 shows the results of the ADF unit root test for PR expenditure and U.S. FDI.
ADF Unit Root Test for PR and FDI.
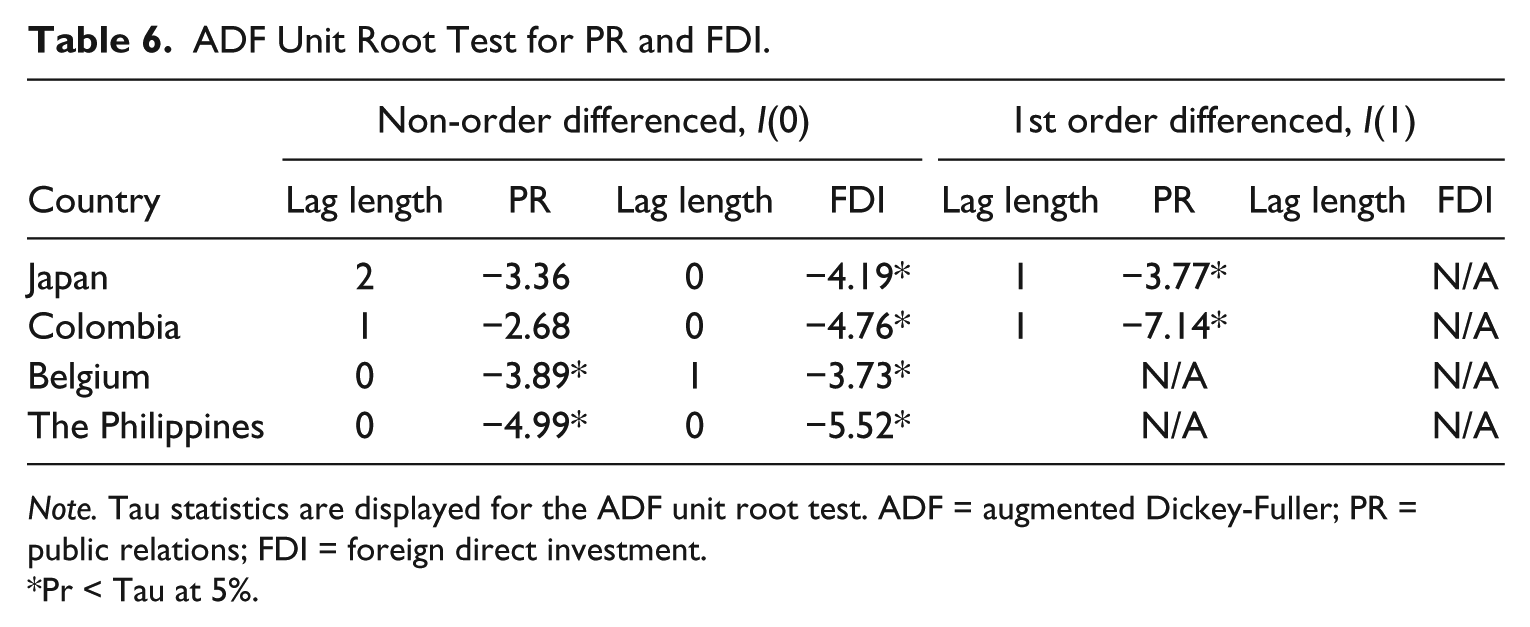
Note. Tau statistics are displayed for the ADF unit root test. ADF = augmented Dickey-Fuller; PR = public relations; FDI = foreign direct investment.
Pr < Tau at 5%.
Based on the assumption of each model (Figure 1), it was not suitable to apply the VECM Granger causality model to test all the relationships between PR and FDI because the data series for Belgium and the Philippines were stationary and the time series for Japan and Colombia were not in the same differencing order. The results of the AIC were compared to determine the optimal lag length. The optimal lag lengths for the VAR model were as follows: Japan = VAR (2), Colombia = VAR (1), Belgium = VAR (1), and the Philippines = VAR (3). Therefore, the simple ADL model Granger causality test was conducted for Belgium and the Philippines (Table 7) and the T-Y test was applied in the case of Japan and Colombia (Table 8).
ADL Model Granger Causality Test for PR and FDI.
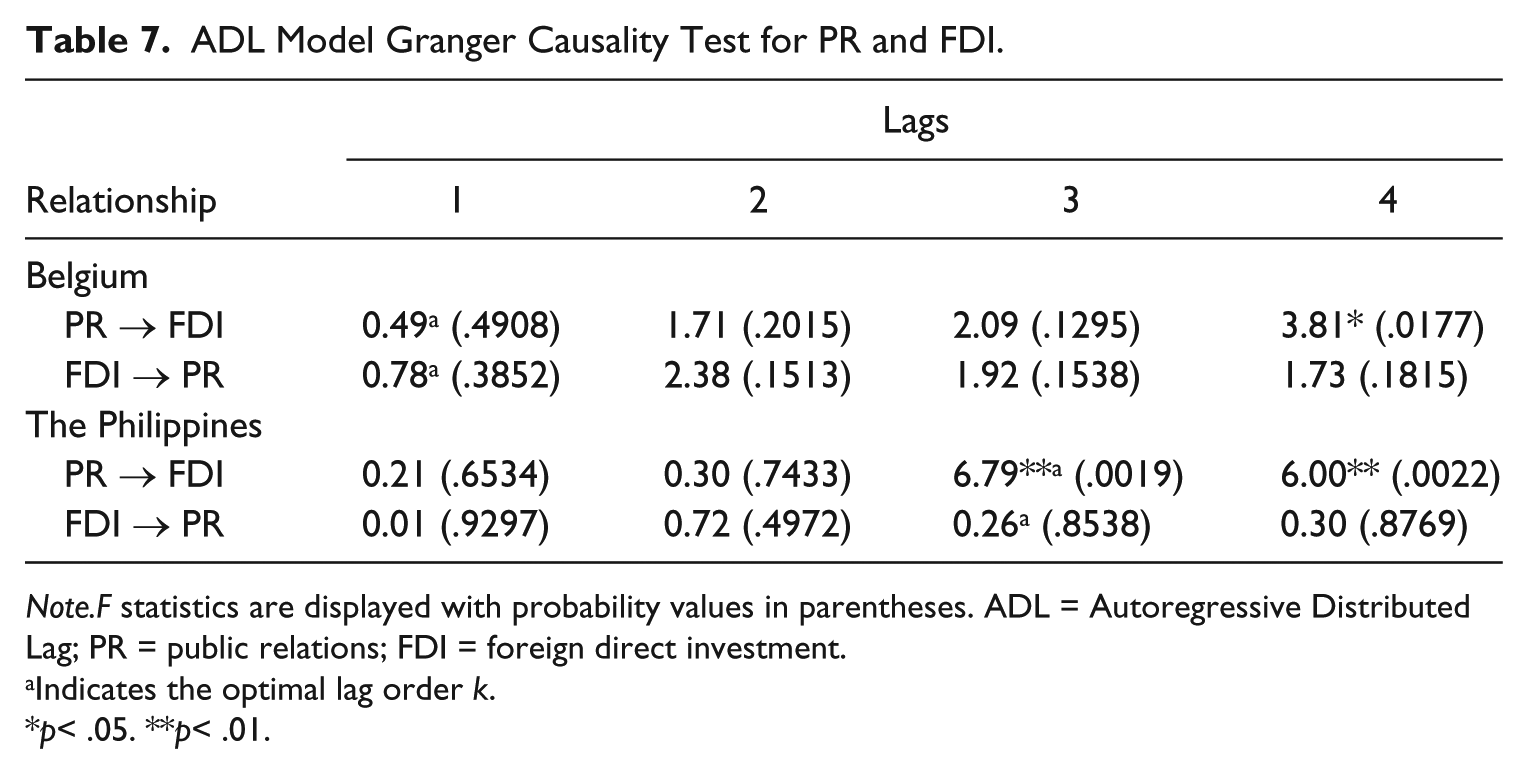
Note.F statistics are displayed with probability values in parentheses. ADL = Autoregressive Distributed Lag; PR = public relations; FDI = foreign direct investment.
Indicates the optimal lag order k.
p< .05. **p< .01.
Toda and Yamamoto Causality Test for PR and FDI.
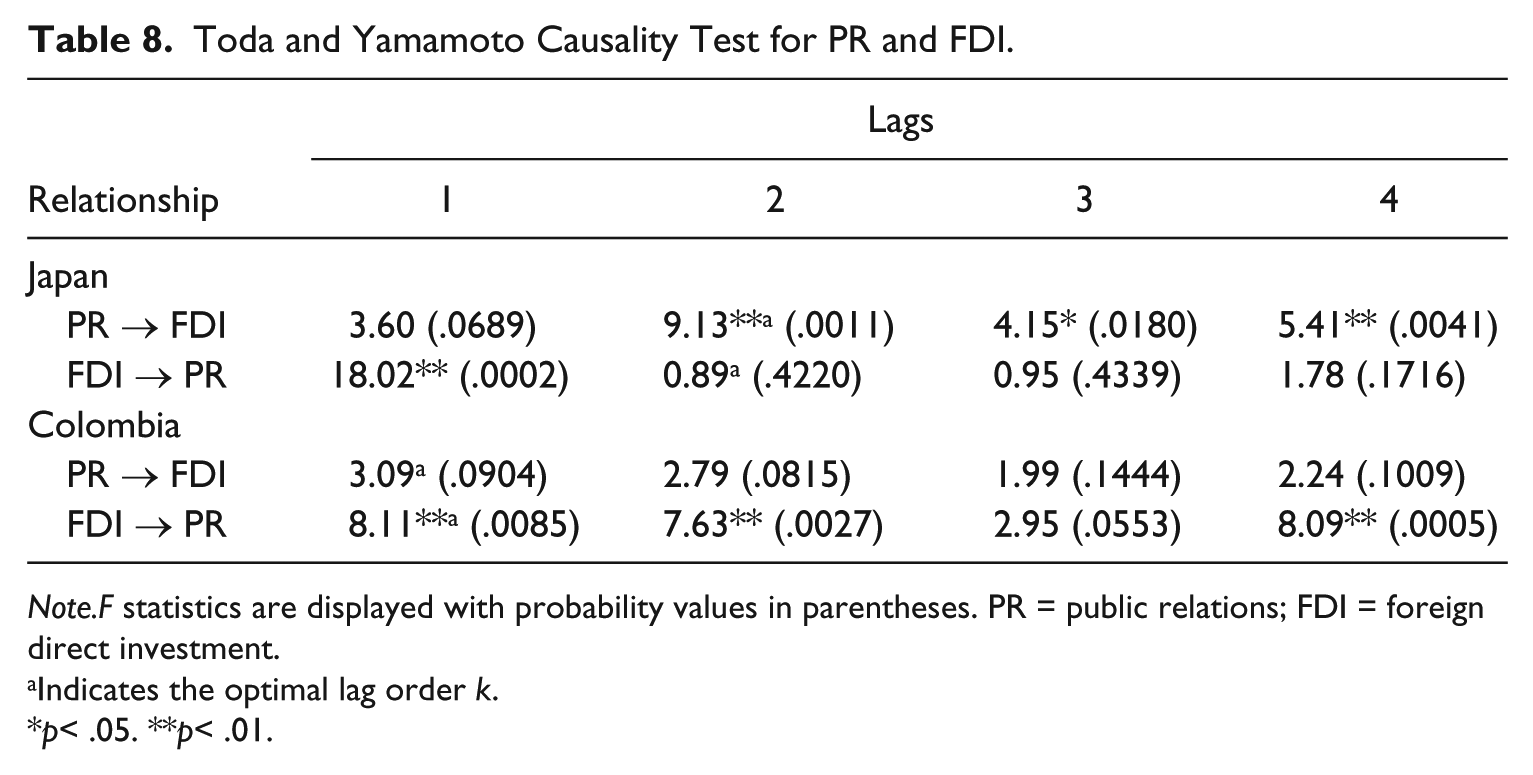
Note.F statistics are displayed with probability values in parentheses. PR = public relations; FDI = foreign direct investment.
Indicates the optimal lag order k.
p< .05. **p< .01.
For Belgium, the findings indicate that PR granger-caused FDI only at the fourth lag. Other causal relationships were not statistically significant. Also, there were no causal relationships detected in the opposite direction. Thus, the hypothesis was supported for Belgium.
For the Philippines, PR was found to have granger-caused FDI at the third and the fourth lags. No significant causality was observed in the opposite direction. At the optimal lag order three, the causality was unidirectional, from PR to FDI. Thus, the hypothesis was supported for the Philippines.
As Table 8 shows, PR was found to have granger-caused FDI at the second, third, and fourth lags for Japan. Causality in the opposite direction was also found at the first lag. However, for the optimal lag order, which is the second lag, the causal relationship was unidirectional. The hypothesis was thus supported for Japan.
For Colombia, PR did not granger-cause FDI at every lag tested. In contrast, FDI was found to have granger-caused PR at the first, second, and fourth lags. The hypothesis was thus not supported for Colombia.
Discussion
Compared with previous works, this study presented a more rigorous test to determine whether international PR expenditure caused or resulted in economic outcomes by conducting a time-series analysis at the country level. It tested the relationships between the data series compiled over 14 years, instead of the correlation between two variables at one point in time. Although correlations can show the variance between two variables at a particular time point, the Granger causality test is more robust because it detects the relationship between two variables (or data series) over time. Because lagged effects exist in economic data and because the dynamic relationship between input and output variables may not be captured correctly through correlation tests, the Granger causality test produces more valid results. Considering the long-term relationship between economic input and output, especially that between international PR expenditure and economic outcomes, a time-series analysis is critical for a rigorous examination of causal relationships. This study took the first step toward this direction.
However, a limitation of the causality test applied in this study needs to be acknowledged. Economic relationships between countries are complex; there are many macroeconomic and political factors that may have an influence on U.S. imports and FDI. Although this study controlled for the time order to make a stronger claim for causality, other confounding variables may have a bearing on economic outcomes beyond international PR expenditure. This study was confined to verifying statistical causal relationships between two time-series data under several assumptions. First, this study verified whether a series is stationary or not by testing the existence of a unit root, which indicates that the series is not an event-driven (i.e., not a radom-walk, according to Box et al., 2008). Second, this study verified whether the patterns showing in the two series display a common trend over time by testing for their co-integration, indicating that the relationship between the two series is not spurious. Third, if each series is explained by time and both series are interrelated, the relationship between the two series can be confirmed by testing whether the independent series significantly influenced the dependent series after controlling for the autocorrelation of the dependent series. Therefore, this study focuses on justifying each step to conclude the relationship. The results of this study should be interpreted with caution in this regard.
With these limitations in mind, this study showed stronger evidence for a relationship between PR and economic outcomes. A hypothesized relationship was tested across four countries with two economic outcomes (imports and FDI). Except for one country (Colombia), there were significant short- and long-term effects of international PR expenditure on economic outcomes. However, as mentioned above, the results should be interpreted on a case-to-case basis with regard to the assumptions.
Japan satisfied all assumptions for a statistical causal relationship and confirmed that international PR expenditure granger-caused the U.S. imports from Japan and the U.S. direct investment to Japan. For many years, Japan has consistently spent large amounts of money on PR in the United States. A spike or sudden change in Japan’s PR expenditure in the United States in the past contributed to forecasting immediate and long-term future economic outcomes (both imports and FDI) from the United States.
The case of the Philippines, which also satisfies all the assumptions for the test, partially confirmed the hypothesized relationship. In this case, PR expenditure in the U.S. granger-caused the U.S. direct investment toward the Philippines, but did not granger-cause the U.S. imports from the Philippines. The Philippines spent less on PR in the United States and ranked low in GDP per capita. A spike (sudden change) in its PR expenditure in the United States in the past contributed to forecasting only long-term future U.S. FDI. There were no short- and long-term effects on U.S. imports.
In order to fully compare and explain the differences between Japan and the Philippines, the analytical model needs to be tested in more countries. As mentioned, confounding variables that may influence the dependent series were statistically controlled for both directions of the relationships. The cases of Japan and the Philippines show that a statistical (granger) causal relationship between international PR expenditures and economic outcomes does exist, and causality in the reverse direction does not.
It is difficult to interpret the results for Belgium and Colombia because there was no co-integration between the independent and dependent series. In Belgium, which also ranked high in GDP per capita but spent relatively less on PR in the United States, a different pattern of PR investment impact on economic outcomes emerged. Like Japan, a sudden spike in its PR expenditure in the past helped forecasting immediate and long-term U.S. imports. However, Belgium’s PR expenditure granger-caused U.S. direct investment to Belgium only in the long term. Although this study found a granger causal relationship between international PR expenditure and U.S. imports for Belgium, this may be spurious because no co-integration was detected between the two series. This suggests that in this context, an index to measure the relationship between countries, which may affect both the PR expenditures and economic outcomes, should be developed. Such an index should be included and controlled in the model to overcome the limitation.
Similarly, the results for Colombia should be carefully interpreted. Colombia spent a lot on PR in the United States but ranked low in GDP per capita. Interestingly, there were reverse causal relationships in the short and long term from past economic outcomes to future PR expenditure. In other words, the current economic relationship (trade and FDI) can lead to international PR expenditure in the future. Considering that the United States is Colombia’s largest trading partner and the history of U.S. aid to this country to help the government fight against the illegal trade of weapons and narcotics (U.S. Department of State, 2012), current PR expenditure appear to be motivated by the desire to secure a long-standing relationship. Even though this study theoretically focused on a bottom-line effect of PR, this reverse causal relationship could be explored for future studies. In this study, this reverse relationship was found only for Colombia and was not observed for Japan, Belgium, or the Philippines.
This study has other limitations. First, U.S. direct investment abroad could have been adjusted to current cost to get more accurate results. Considering that most economic data do not usually satisfy the stationarity assumption, the FDI data series that satisfied the stationarity assumption may be biased. Second, the linear relationship assumption failed for some countries (e.g., the LPR and LIMP of Philippines and the PR and FDI of Japan). Third, the FARA archive allowed for only 28 time points, which may not be fully sufficient for an ideal time-series analysis. Finally, the study does not account for all factors that may affect PR expenditure and economic outcomes.
Despite a few non-significant findings, the overall results for Japan, Belgium, and the Philippines showed that past PR expenditure holds power in forecasting economic outcomes in the short term (less than a year) and the long term (more than a year). Although the findings of this study could not sufficiently verify the hypothesized relations between international PR expenditures and economic outcomes across the four countries, this study suggested a valid and workable model with which to test this important relationship.
Future studies should test the assumptions and the applications of the current model for testing causality because it offers more robust evidence for the impact of PR investments on economic outcomes than one-shot cross-sectional designs. Future time-series analyses can test, for example, the causal relationship between PR investment and the fluctuations of positive and negative news about a country over time.
Footnotes
Declaration of Conflicting Interests
The authors declared no potential conflicts of interest with respect to the research, authorship, and/or publication of this article.
Funding
The authors received no financial support for the research, authorship, and/or publication of this article.