
Abstract
This study reports the results of an experiment (N = 502) investigating how speakers are socially categorized based on accent (Standard American English [SAE] or Nigerian) and race (White or Black) separately and concurrently, as well as the intergroup outcomes of such categorizations as mediated by language attitudes (status, solidary, and dynamism). Findings revealed that SAE-accented speakers were evaluated more favorably than Nigerian-accented speakers on status. Status also mediated the relationship between accent and (a) symbolic threat and (b) social distance. Additionally, Black males were rated higher on solidarity and dynamism than White males. Finally, status mediated the combined effect of the speaker’s race and accent on symbolic threat, intergroup anxiety, and social distance. Theoretical and practical implications are discussed.
Globalization facilitates communication between people from different cultural, ethnic, and racial groups. Results of the most recent U.S. Census suggest the population is becoming more multicultural, with an increase of about 33.8 million people identifying as multiracial (i.e., Black, Hispanic/Latino, Asian, and more than one race). Also, the immigrant population is now higher than ever, with about 66 million U.S. residents (i.e., native-born, legal immigrants, and undocumented immigrants) speaking a language other than English at home (U.S. Census Bureau, 2020). Thus, interacting with immigrants; individuals from varied ethnic and cultural groups; people who speak English with different language varieties; and/or those who identify with or are classified into different racial categories is a likely possibility for everyone.
During interactions, individuals rely on observable features to anticipate how their interlocutors may communicate or behave. One area of research focusing on such evaluations is rooted in language use, wherein explanations are sought for why and how individuals evaluate others based on their language variety (e.g., accents). Specifically, language attitudes research focuses on evaluative responses to language varieties and users (Dragojevic, 2018), such as the frequently examined evaluation of so-called standard and non-standard accented speakers. Standard language varieties reflect norms codifying the correct spoken and written usage of a language, whereas non-standard varieties deviate in some way from these codified norms (Dragojevic, 2018). The term accent describes variation in the pronunciation of a language (Fuertes et al., 2012), including elements such as intonation, stress, and rhythm (Kang, 2010).
Language attitudes research has consistently found that non-standard accents are evaluated less favorably than standard accents. However, Dragojevic et al. (2021) argue that while research has historically featured language attitudes as a “key output of interest” (p. 67), this approach is inadequate for fully explaining how language-based attitudes impact communication. Instead, more theorizing is needed in which language attitudes are treated as explanatory mechanisms that connect accent variety to more distal outcomes. In response to Dragojevic et al. (2021), the current study mobilizes integrated threat theory (ITT; Stephan et al., 1999) and the intersectionality framework (Crenshaw, 1989) to examine the independent and combined effects of accent and race on adult listeners’ language attitudes (i.e., evaluations of a speaker’s status, solidarity, and dynamism), and the potential mediating role of language attitudes in predicting intergroup outcomes.
A few experimental studies (e.g., Hansen et al., 2017; Paladino & Mazzurega, 2020; Rakić et al., 2011) have tested the combined effects of accents, ethnicity, and/or race, albeit in different cultures than the United States. Within the U.S. context, several studies have featured speakers who are both linguistic and racial minorities (e.g., Dragojevic & Goatley-Soan, 2020; Montgomery & Acheme, 2022), but neither operationalized race nor included it as a variable of interest. Thus, to the best of the authors’ knowledge, no language attitudes study set within the U.S. context has specifically operationalized race and investigated its potential role in language attitudes (c.f. Kinzler et al., 2009). We argue that during intergroup interactions, individuals are simultaneously evaluated based on linguistic categorization of ethnicity (i.e., accents) and physical categorization of race (i.e., phenotype). Hence, examining the potential effects of race on language attitudes is essential for understanding race-based and ethnolinguistic intergroup relations, especially due to the contemporary and historical salience of race within U.S. society.
In the current study, the Standard American English (SAE, hereafter) accent is compared to the Nigerian accent. Nigerian English was chosen to be featured for two primary reasons. First, the largest share of African immigrants to the United States are Nigerian (Migration Policy Institute, 2015). Unlike the United States, there is no “standard” accent in Nigeria because over 500 languages are spoken there (World Population Review, 2021), each with its own phonemes, which impacts how a speaker produces sounds in English (Acheme, 2022). Given that it is one of the largest ethnolinguistic groups in Nigeria (Statista, 2020), and one of the largest Nigerian ethnic groups in the United States, the Yoruba accent is featured in this study as the language variety against which the SAE accent is compared. Second, research investigating language attitudes toward African accents is scarce and insights into potential biases ascribed to individuals based on their ethnolinguistic identity are important in extending language attitudes research. Thus, examining the Nigerian Yoruba accent extends language attitudes research to include unexamined ethnolinguistic groups.
This study examines White and Black racial classifications because Blacks are the second-largest racial minority group in the United States (U.S. Census Bureau, 2020). Nigeria is also a predominantly Black nation, which suggests Nigerian speakers are likely to be socially categorized as Black based on their phenotype, and non-standard-accented based on their accent. Additionally, since accent and race are used simultaneously to socially categorize people, we assert there is an intersection of accent and race in communication. Within the social sciences, an intersection signifies the “crossing, juxtaposition, or meeting point, of two or more social categories and axes, or systems of power, dominance, or oppression” (Atewologun, 2018, p. 2). In most face-to-face or video-mediated interactions, people are seen and heard, meaning physical (i.e., race) and vocal characteristics (i.e., accents) are encountered and processed simultaneously (Paladino & Mazzurega, 2020). Thus, singling out social identity markers limits understanding of their combined effects on intergroup outcomes. Furthermore, intersectionality is not restricted to exploration of only race and gender, therefore we chose to focus on the evaluations of males because past research indicates that there is an enormous appetite for Black men misbehaving, and these behaviors are perpetuated by the media (Clarke, 1997). Moreover, prescriptive (Fiske & Stevens, 1993) and national stereotypes are found to be higher for men than women (Koenig, 2018).
Given the pervasiveness of race in the United States and the social group markers elicited from physical and language cues, investigating the independent and combined effects of accents and race may provide important insights into social categorization processes and intergroup outcomes. Insights into such intergroup processes can also offer understandings of how individuals react and respond to dissimilar others and facilitate ways to decrease the stigma, threat, apprehension, and prejudice attached to non-standard accent varieties and racial minority groups in the United States.
Accent, Race, and Intergroup Outcomes
Language Attitudes
Language attitudes, or the evaluative reactions to different language varieties, are theorized as a function of social categorization and stereotyping (Dragojevic, 2018) wherein listeners use accents to infer a speaker’s social group membership then attribute language-based traits associated with the speaker’s inferred ingroup. Language-based stereotypes have been organized along three dimensions: status, solidarity, and dynamism (Dragojevic, 2018). Evaluations of status are based on perceived socioeconomic status wherein standard accents are associated with dominant groups and non-standard accents with subordinate groups (Dragojevic, 2018). Standard accented speakers are typically evaluated higher on the status dimension than non-standard accented speakers (e.g., Birney et al., 2020). Solidarity, also called “attractiveness” (e.g., Kang & Yaw, 2021), describes the social attractiveness of accents. Research findings on the solidarity evaluations of non-standard accents are mixed. Some studies found that non-standard accents were evaluated less favorably than standard accents (e.g., Dragojevic, 2018), whereas other studies reported the opposite (e.g., Acheme & Cionea, 2022). Lastly, dynamism reflects stereotypes about the group’s vivacity. Research indicates that standard-accented speakers are evaluated more favorably on dynamism than non-standard-accented speakers (Acheme & Cionea, 2022). Guided by existing language attitudes literature, we pose the following hypothesis:
H1: Relative to Nigerian-accented speakers, SAE-accented speakers will be evaluated higher on (a) status, (b) solidarity, and (c) dynamism.
Intergroup Outcomes of Language Attitudes
Threat and Anxiety
Given the social categorization and stereotype processes involved in language attitudes, evaluations of an accent reflect one’s dispositions toward the speaker’s group (Montgomery & Zhang, 2018). The consistent finding that outgroup accents tend to be downgraded on evaluations may indicate that ingroup members approach outgroup accents with a sense of threat and anxiety. ITT (Stephan et al., 1999) provides a framework for understanding how perceived threats and anxiety impact intergroup interactions. Per ITT, individuals expect outgroup members to behave in ways that are detrimental to the ingroup, resulting in dissociative behaviors (e.g., avoidance) and negative outcomes (e.g., prejudice) toward outgroup members (Stephan et al., 2002). Four types of threats exist: intergroup anxiety, symbolic threats, realistic threats, and negative stereotypes. The current study features intergroup anxiety and symbolic and realistic threats as dependent variables (negative stereotypes threat is captured by participants’ language attitudes).
Intergroup anxiety stems from feelings of discomfort experienced while interacting with outgroup members. Within language attitudes research, intergroup anxiety is specified as intergroup communication anxiety, an individual-level variable, defined as feelings of discomfort, unease, worry, tension, and apprehension communicating with members of an outgroup (Imamura et al., 2016). Although research has examined the association between contact and intergroup attitudes as mediated by intergroup communication anxiety, only a few studies (e.g., Montgomery & Zhang, 2018) have explored intergroup communication anxiety in the context of language attitudes.
Symbolic threats pertain to the validity of an ingroup’s worldview in the face of perceived threats from outgroup members, such as threats to the ingroup’s norms of language varieties. Realistic threats are behaviors enacted by the outgroup, or the very presence of the outgroup, that are believed to threaten the physical, economic, and political welfare of the ingroup (Stephan et al., 1999). Despite threat being established as a potent predictor of intergroup prejudice, there is scant research applying threats to the language attitudes context (Stephan et al., 2009). In an effort to expand ITT into the language attitudes literature and understand mechanisms underlying intergroup threat, we hypothesize the following:
H2: Status, solidarity, and dynamism will mediate the relationship between the accent of a speaker and (a) symbolic threat, (b) realistic threat, and (c) intergroup anxiety.
Social Distance
Social distance captures an individual’s behavioral intentions through voluntary (dis)associations with outgroup members (Massey et al., 2018). Massey et al. (2018) assert that, as a measure of prejudice, voluntary association is more reliable in eliciting attitudes toward outgroup members than directly asking participants about their attitudes, thus reducing social desirability biases (Esses & Dovidio, 2002). Studies have used social distance toward dissimilar others, such as members of different racial, sexual, or religious, groups, as an indicator of prejudicial attitudes. Similarly, research has studied willingness to communicate with outgroup members (a conceptually similar variable to social distance) in the contexts of language attitudes and immigration (e.g., Montgomery et al., 2021; Montgomery & Zhang, 2018). Continuing this established line of research, the following hypothesis is posed:
H3: (a) Status, (b) solidarity, and (c) dynamism will mediate the relationship between the accent of a speaker and social distance.
Race
Race is defined as a historically driven, socio-cultural construction derived figuratively from the ranking of phenotypic features (such as skin color, hair texture, nose width, lip thickness, and body type) and by ascribing human groups with attributes that conform to a ranking system within a particular culture (Smedley & Smedley, 2012). The focus of this study is on the White and Black racial categories, given the connotations surrounding Whiteness (e.g., the so-called “pure,” unmarked, and invisible category) and Blackness (e.g., “impure,” marked, and visible category; Hartigan, 1997). Race exists because of racialization—a process of othering (Omi & Winant, 2014) and a major form of social differentiation permeating intergroup relations in the United States (Smedley & Smedley, 2012). The social meanings and connotations ascribed to members of different racial groups predispose individuals to react, sometimes unconsciously, to members of different racial groups (Smedley & Smedley, 2005). Although one can identify as a member of a particular race irrespective of physical features, in the United States, color and physiognomy remain symbols of racial difference and identity (Smedley & Smedley, 2012). Thus, the current study operationalizes race as physical differences cued by phenotype—skin color, hair texture, nose width, and lip thickness. We contend that notions of Whiteness and Blackness can impact the trajectory of intergroup interactions between individuals because of racialization and the stereotypes ascribed to members of different racial groups.
Research reports several stereotypes of Whites and Blacks. Stereotypically Black-looking individuals were often associated with crime and violence or portrayed in the media as gangsters and criminals (e.g., Blair et al., 2004). Stereotypical Black faces were also more often associated with stereotype-consistent labels, they were remembered and recategorized correctly as criminals, and, when memory failed, stereotypical Black faces were miscategorized as criminals (Kleider et al., 2012). Other studies have reported implicit stereotypes toward Whites and Blacks. For instance, using an implicit associations test, Feagin (2006) reported that about 90% of White participants associated the faces of Blacks with negative words and traits. Additionally, being presented with photographs of Black faces triggered key areas of White participants’ brains, specifically those areas responsible for perceiving and responding to threats. Based on these findings, and in line with language attitudes research, the following hypothesis is posited:
H4: White males will be evaluated higher on (a) status, (b) solidarity, and (c) dynamism than Black males.
Additionally, we examine the role of race in mediating the relationship between language attitudes and intergroup communication outcomes. However, considering the lack of research in this area and the explanatory nature of this aspect, we pose the following research question:
RQ1: Do status, solidarity, and dynamism mediate the effect of race on (a) symbolic threat, (b) realistic threat, (c) intergroup anxiety, and (d) social distance?
Intersectionality of Accent and Race
As discussed, both accent and race are markers of social identity and can intersect with one another because people are often confronted with their interlocutor’s language use and physical appearance at the same time. Intersectionality is rooted in the racialized experiences of minority women in the United States, derived from the work of Kimberley Crenshaw (1989), who advocated the need to interpret, analyze, and understand the treatment of African American women through the dual lenses of gender and race. Crenshaw applied the term to the consideration of race and gender simultaneously, showing how the effect of one exacerbated the effects of the other. By considering race and gender simultaneously, the experiences of minority women could be fully understood (Else-Quest & Hyde, 2016).
Intersectionality can be defined as an analytical approach that simultaneously considers the meanings and consequences of multiple categories of identity, difference, and inequality (Else-Quest & Hyde, 2016) such as race, accent, gender, and so on. Intersectionality foregrounds individuals’ and groups’ multiple positionality both at the micro (i.e., individual) and macro (i.e., socio-structural) levels by acknowledging how power impacts the construction of social identities, knowledge, and experiences (Atewologun, 2018; Else-Quest & Hyde, 2016). In other words, intersectionality addresses the role of difference, inequalities, and inequities that are associated with social categories beyond race or gender alone (e.g., accentedness; Acheme, 2022). Thus, in this study we follow Crenshaw’s initial reasoning that the effect of one social identity (i.e., accent) can exacerbate the effect of another (i.e., race) and impact intergroup outcomes. Although intersectionality has historically been associated with qualitative research, we extend intersectionality to quantitative research as quantitative designs can provide insights into the intersectional effects (including additive and multiplicative effects) of various social identities and categories (Else-Quest & Hyde, 2016).
Past research has examined intersectionality as it pertains to language use (e.g., voice, accent) and ethnicity in various contexts. For instance, Rakić et al. (2011) investigated whether appearance and accent, separately and concurrently, indicated ethnicity (i.e., German vs. Italian), and whether appearance and accent were used to socially categorize speakers. Their results revealed a similar degree of ethnic categorization by accent and appearance. However, participants relied mainly on the accent of a speaker (as compared to their appearance) in their social categorization. Similarly, Hansen et al. (2017) examined how native German participants evaluated the competence and warmth of job candidates who spoke with an accent that was congruent or incongruent with their appearance (i.e., German or Turkish). Results indicated a strong preference for accent in that Turkish-looking, German-accented speakers were rated as more competent and warmer compared to German-looking, Turkish-accented speakers. In one of the few language studies that explicitly examined race, Paladino and Mazzurega (2020) investigated the combined effect of accent (i.e., native vs. non-native) and race (i.e., European-native or White vs. non-native or Black) on Italian participants’ real-time categorization of a speaker using a mouse-tracker task. Findings suggested that, in the early stages of person perception, presenting speakers with mixed cues (i.e., White speakers with a non-native accent and Black speakers with a native accent) led to simultaneous and parallel activation of ingroup and outgroup representation. Thus, both accent and race were initially processed. However, in later stages of person perception, when accent and race did not match, accent played a major role in the construal of the accented speaker, such that listeners categorized native speakers as ingroup members.
These findings suggest that visual and aural cues are often (perhaps automatically) activated in interactions, that perceivers categorize others based on their voice and race or ethnicity, and that individuals evaluate aural and visual stimuli in interactions, which, in turn, influence assessments and stereotypes about them. Given these empirical findings and based on the logic behind the intersection of accent and race, the following hypotheses are posited:
H5: Relative to Black, Nigerian-accented speakers, White, SAE-accented speakers will be evaluated higher on (a) status, (b) solidarity, and (c) dynamism.
H6: Status, solidarity, and dynamism will mediate the relationship between the combined accent and race of a speaker and (a) symbolic threat, (b) realistic threat, (c) intergroup anxiety, and (d) social distance.
Method
Participants
Participants consisted of 502 1 U.S. adults (Mage = 39.89, SD = 13.68, range = 18–93) recruited through Prolific, a crowd-sourcing research platform. Most participants were White (n = 431), while others indicated Black/African-American (n = 20), another ethnicity (n = 26; e.g., Asian or Hispanic), a combination of ethnicities (n = 21), or did not provide an answer (n = 4). There were 248 men and 245 women in the sample, with two indicating “other” and seven not indicating their sex. Most participants had some college education (n = 403).
Stimuli
For audio stimuli, the verbal guise technique (VGT; Lambert et al., 1960) in which different speakers produce different accents was utilized to ascertain that variations in accent group conditions are, indeed, the result of speakers’ accents. Following pilot tests in which multiple samples of audio recordings of SAE and Nigerian accents were created and evaluated for their accent prototypicality (i.e., prototypical SAE accent and prototypical Yoruba-Nigerian accent; see Acheme, 2022), six speech samples (three SAE and three Nigerian) were selected for inclusion in the study. Recordings were comparable in length, ranging from 0:59 to 1:14 minutes.
For visual stimuli, photographs of White and Black men retrieved from the Chicago Face Database (CFD; https://www.chicagofaces.org) and pilot-tested for prototypicality (i.e., prototypical White-looking or Black-looking male; see Acheme, 2022). Six photos (three White males and three Black males) were selected for use in this study.
Audio-visual stimuli were created by randomly pairing the six audio stimuli and the six photographs, which yielded six combined audio-visual stimuli (three White, SAE-accented and three Black, Nigerian-accented).
Study Design and Procedures
The study manipulated two independent variables, examining their main effects (Accent: SAE/Nigerian and Race: White/Black) and their combined, matched effects (Race-Accent: White-SAE/Black-Nigerian) using a between-subjects experimental design. In other words, the study manipulated accent (three SAE vs. three Nigerian) for the audio-only conditions; race (three White vs. three Black) for the visual-only conditions; and accent and race (three White-SAE vs. three Black-Nigerian) for the race-accent conditions. Participants were randomly assigned to one of these 18 conditions. 2
In the accent-only conditions, participants listened to either an SAE- or Nigerian-accented speaker reading the Rainbow Passage, a segment of prose describing rainbows (Fairbanks, 1960). In the race-only conditions, participants were presented with a photograph of either a White or Black male with the text of the Rainbow Passage typed underneath the photograph. Participants were instructed to look closely at the individual on the screen and imagine them reading the passage. In the race-accent conditions, participants were either presented with a photograph of a White male and an audio recording of an SAE-accented speaker reading the Rainbow Passage or with a photograph of a Black male and an audio recording of a Nigerian-accented speaker reading the Rainbow Passage.
After the experimental stimuli were presented, participants completed manipulation checks ensuring the intended social categorizations had been made. Then, participants completed instruments measuring language attitudes, symbolic and realistic threats, intergroup anxiety, and social distance. Lastly, participants completed a demographic questionnaire before being debriefed. Participants took on average 15.68 minutes (SD = 8.40) to complete the study and were compensated $4.00 for participation. The research was approved by the Institutional Review Board at the authors’ university.
Measures
Speech Evaluation Instrument
A 30-item scale assessed participants’ evaluations of each target’s status, solidarity, and dynamism (Kang & Yaw, 2021). Items were measured on a 7-point semantic differential scale. Status was measured with 12 items such as, “uneducated-educated” (α = .91, M = 5.38, SD = 0.89). Solidarity was measured with 11 items such as, “unfriendly-friendly” (α = .97, M = 5.31, SD = 1.05). Finally, dynamism was measured with 7 items, including “shy-talkative” (α = .86, M = 5.04, SD = 0.88). Higher scores indicate higher evaluations of perceived status, solidarity, and dynamism.
Symbolic Threat
Symbolic threat was measured using Stephan et al.’s (2002) 12-item scale, adapted by replacing “Whites” with “SAE speakers” and “Blacks” with “Nigerian-accented speakers” for the accent-only conditions (e.g., “SAE- and Nigerian-accented speakers have very different values”). For the race-only conditions, the original wording was employed (e.g., “Whites and Blacks have very different values”). For the race-accent conditions, wording from the accent and race conditions was combined (e.g., “White, SAE-accented speakers and Black, Nigerian-accented speakers have very different values”). Items were measured on a 7-point Likert scale ranging from 1 = strongly disagree to 7 = strongly agree. Higher scores indicate higher perceived symbolic threat (α = .88, M = 3.04, SD = 1.08).
Realistic Threat
Realistic threat was measured using Stephan et al.’s (2002) 12-item scale, adapted in a similar manner as symbolic threat items. Examples include, “Nigerian-accented speakers hold too many positions of power and responsibility in this country,” (accent-only conditions); “Blacks hold too many positions of power and responsibility in this country” (race-only conditions); and “White, SAE-/Black, Nigerian-accented speakers hold too many positions of power and responsibility in this country” (race-accent conditions). Items were measured on a 7-point Likert scale ranging from 1 = strongly disagree to 7 = strongly agree. Higher scores indicate higher perceived realistic threat (α = .96, M = 1.96, SD = 1.06).
Intergroup Anxiety
Stephan et al.’s (2002) 12-item adapted scale was used to measure intergroup anxiety. Scale items were adapted for the accent only conditions and the race-accent conditions by asking participants to indicate how they felt interacting with “Nigerian-accented speakers” and “Black, Nigerian-accented speakers,” respectively. For the race-only conditions, the original scale wording referring to Blacks was used. Participants rated items (e.g., “not at all nervous”—“extremely nervous”) on a 7-point semantic differential scale whose stem was, “I feel . . .” with answer choices ranging from 1 = not at all to 7 = extremely. Higher scores on this measure indicate higher intergroup anxiety (α = .95, M = 5.38, SD = 1.15).
Social Distance
Social distance was assessed by adapting Esses and Dovidio’s (2002) 12-item scale and replacing “Blacks” with “Nigerian-accented speakers” for the accent-only conditions (e.g., “I would be willing to marry a person who speaks with a Nigerian accent”), retaining the original wording of the scale for the race-only conditions (e.g., “I would be willing to marry a person who is Black”), and combining the wording from the two conditions for the race-accent conditions (e.g., “I would be willing to marry a Black, Nigerian-accented speaker”). Items were measured on a 7-point Likert-type scale ranging from 1 = not at all willing to 7 = extremely willing. Higher scores on this measure indicate less social distance, meaning more willingness to interact with the target group (α = .88, M = 6.12, SD = 0.90).
Manipulation/Accuracy Check Questions
To ensure that participants identified speakers and/or photographs correctly and socially categorized them as intended, a multiple-choice question asked them what accent (or race, or accent and race, depending on condition) the speaker (or the individual in the photograph, or speaker they have listened to and have just seen, depending on condition) had. Answer choices included “Standard American English Accent,” “A non-U.S. American Accent,” or “I do not know” (audio-only conditions); “White,” “Black,” or “I do not know” (race-only conditions); and “Standard American English accent and White,” “A non-U.S. American accent and Black,” or “I do not know” (race-accent conditions).
Results
First, cross-tabulation analyses were performed to check participants’ accuracy in correctly recognizing the independent variables and condition to which they had been assigned. Each manipulated independent variable was matched with their respective manipulation check question. For accent (i.e., the audio-only conditions), χ2 (4) = 175.02, p < .001, 98.8% of those in the SAE accent conditions correctly recognized the speakers as such, and 96.5% in the Nigerian accent conditions correctly recognized and socially categorized the speaker as non-SAE. For race (i.e., the visual-only conditions), χ2 (4) = 168.48, p < .001, 100% of those in the White photograph conditions correctly recognized and socially categorized the person as a White male, and 100% of those in the Black photograph conditions correctly recognized and socially categorized the person as a Black male. For accent and race combined (i.e., the audio-visual conditions), χ2 (4) = 169.49, p < .001, 100% of those in the White, SAE-accented speaker conditions correctly recognized and socially categorized the person as a White male with a SAE accent, while 100% of those in the Black, Nigerian-accented speaker conditions correctly recognized and socially categorized the person as a Black male with a non-SAE accent. Thus, the independent variables were manipulated successfully.
Once aggregate variables were created via mathematical averaging, responses across the three conditions for each level of an independent variable were averaged to form a composite score. For instance, for accent, responses for the dependent variables of all three SAE accented speaker conditions were combined, forming one composite score for each dependent variable in the SAE accent condition. The same procedure was conducted for all the other conditions. Finally, we controlled for participants’ sex (dummy coded as male or female), ethnicity (dummy coded as White or non-White), and age in all analyses.
H1 predicted that, compared to the Nigerian accent, the SAE accent would be rated higher on status (H1a), solidarity (H1b), and dynamism (H1c). A multivariate analysis of covariance (MANCOVA) provided partial support for H1. The multivariate test for accent was significant, Wilks’ Lambda = .64, F(3, 159) = 29.39, p < .001, η2p = .36. There was a significant main effect of accent on status: evaluations of the SAE accent (M = 5.80, SE = 0.08) were significantly higher than the Nigerian accent (M = 4.99, SE = 0.08), F(1, 161) = 47.46, p < .001, η2p = .23. Thus, H1a was supported. There were no significant differences between the two accents on solidarity, SAE accent: M = 5.42, SE = 0.11; Nigerian accent: M = 5.50, SE = 0.11; F(1, 161) = 0.27, p = .60, η2p = .00, or dynamism, SAE accent: M = 5.04, SE = 0.10; Nigerian accent: M = 5.10, SE = 0.10; F(1, 161) = 0.17, p = .68, η2p = .00. Hence, H1b and H1c were not supported. For the covariates, participants’ sex, Wilks’ Lambda = .95, F(3, 159) = 2.87, p < .05, η2p = .05, had a significant effect on solidarity, F(1, 161) = 7.94, p < .01, η2p = .05. Perceived solidarity with the speakers evaluated was lower for men (M = 5.27, SE = 0.06) than it was for other participants (women or the few who indicated other or did not answer the question; M = 5.35, SE = 0.07).
H2 predicted that status, solidarity, and dynamism would mediate the effect of accent on symbolic threat (H2a), realistic threat (H2b), and intergroup anxiety (H2c). H2 was tested using Model 4 (with 10,000 bootstrap iterations, bias-corrected, and accelerated 95% confidence intervals) of Hayes’ (2022) regression-based PROCESS macro for SPSS (version 4.1) and conducted using three separate analyses, one for each dependent variable. Prior to data analysis, experimental conditions were dummy coded—SAE accent was coded as the reference group, 0, and the Nigerian accent was coded as the comparison group, 1. Indirect effects were considered significant when the 95% bias-corrected and accelerated confidence interval (95% BCa CI) did not contain zero, indicating the indirect effect differed significantly from zero (Hayes, 2018).
For H2a, results indicated a significant model predicting symbolic threat, F(7, 158) = 4.14, p < .001, R2 = 0.15. The mediation was significant only for status, meaning status mediated the effect of accent on symbolic threat. There were no significant indirect effects of accent on symbolic threat through solidarity or dynamism. Thus, H2a was partially supported (see Table 1 3 ).
Direct and Indirect Effects of Accent (X) on Symbolic Threat (Y) through Status (M1), Solidarity (M2), and Dynamism (M3).

Note. Model predicting status (X on M1): F(4, 161) = 13.17, p < .001, R2 = 0.25; solidarity (X on M2): F(4, 161) = 2.29, p = .06, R2 = 0.05; dynamism (X on M3): F(4, 161) = 0.87, p = .48, R2 = 0.02. Total effect of accent on symbolic threat was not significant, b = −.16, t(161) = −1.11, p = .27.
p < .05. **p < .01. ***p < .001.
For H2b, results indicated a significant model predicting realistic threat, F(7, 158) 4.39, p < .01, R2 = 0.16. However, none of the indirect effects of accent through status, solidarity, or dynamism were significant, indicating that H2b was not supported (see Table 2).
Direct and Indirect Effects of Accent (X) on Realistic Threat (Y) through Status (M1), Solidarity (M2), and Dynamism (M3).
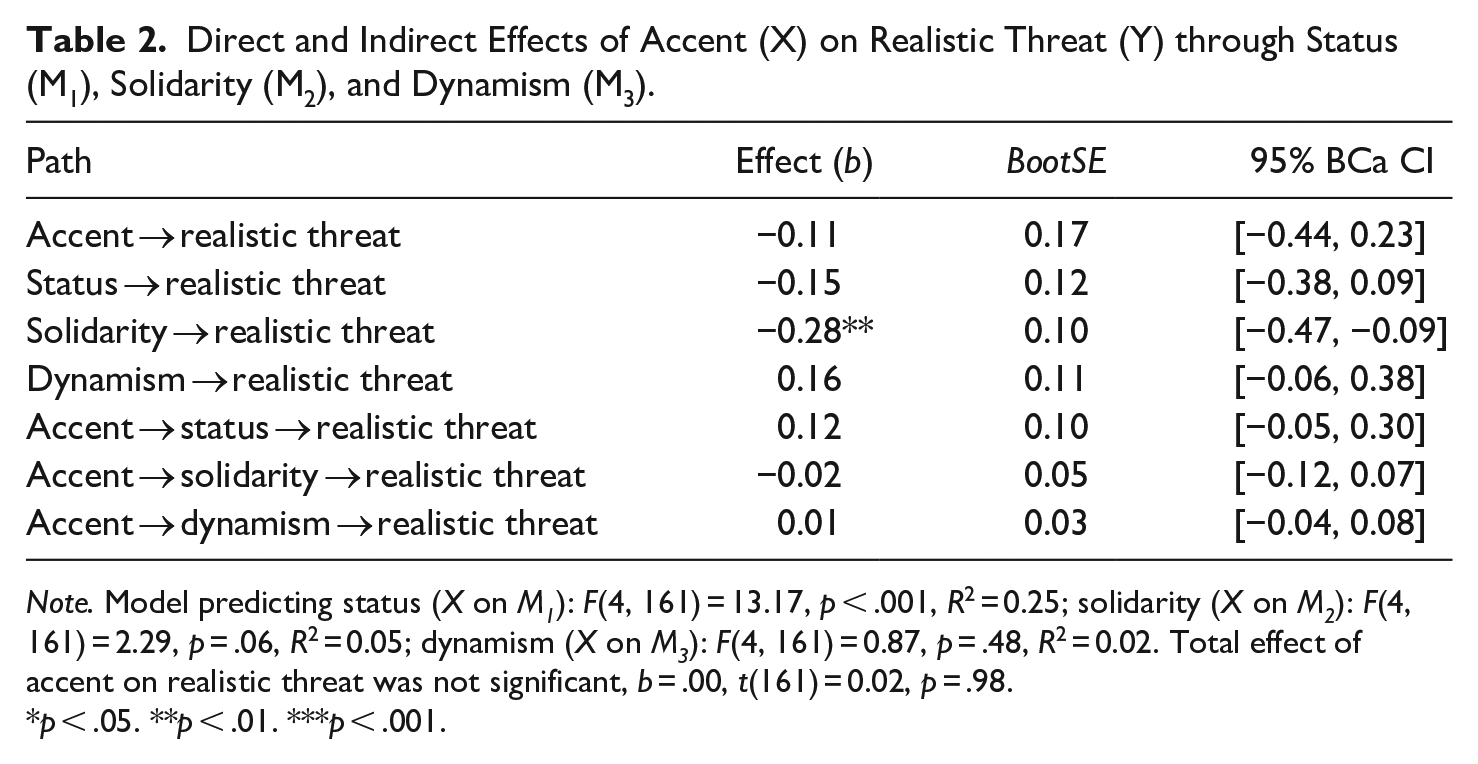
Note. Model predicting status (X on M1): F(4, 161) = 13.17, p < .001, R2 = 0.25; solidarity (X on M2): F(4, 161) = 2.29, p = .06, R2 = 0.05; dynamism (X on M3): F(4, 161) = 0.87, p = .48, R2 = 0.02. Total effect of accent on realistic threat was not significant, b = .00, t(161) = 0.02, p = .98.
p < .05. **p < .01. ***p < .001.
For H2c, results indicated a model that significantly predicted intergroup anxiety, F(7, 158) = 4.22, p < .001, R2 = 0.16. However, there were no significant indirect effects of accent on intergroup anxiety, through status, solidarity, and dynamism. Thus, H2c was not supported (see Table 3).
Direct and Indirect Effects of Accent (X) on Intergroup Anxiety (Y) through Status (M1), Solidarity (M2), and Dynamism (M3).
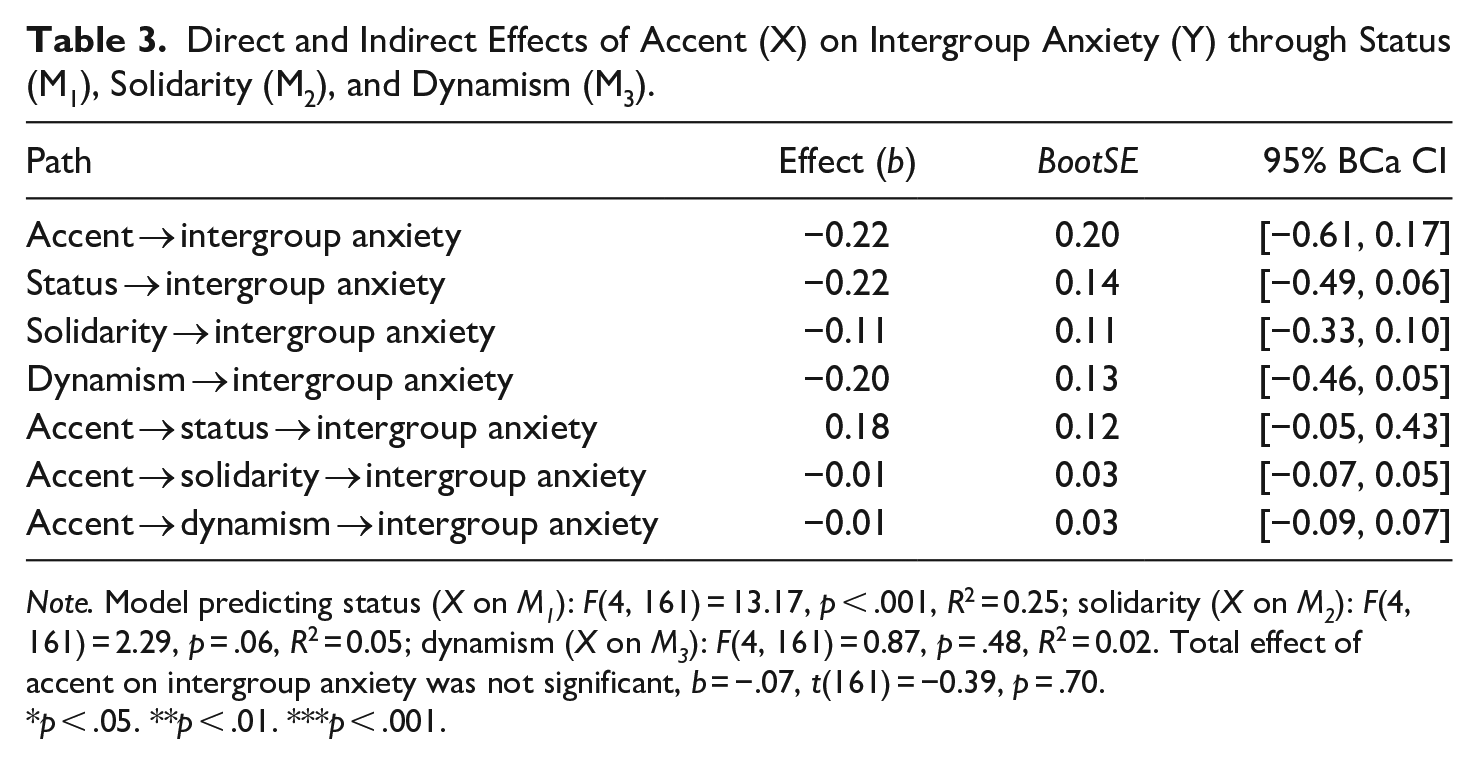
Note. Model predicting status (X on M1): F(4, 161) = 13.17, p < .001, R2 = 0.25; solidarity (X on M2): F(4, 161) = 2.29, p = .06, R2 = 0.05; dynamism (X on M3): F(4, 161) = 0.87, p = .48, R2 = 0.02. Total effect of accent on intergroup anxiety was not significant, b = −.07, t(161) = −0.39, p = .70.
p < .05. **p < .01. ***p < .001.
H3 predicted that status, solidarity, and dynamism would mediate the effect of accent on social distance. H3 was tested in the same manner as H2. Results indicated a model that significantly predicted social distance, F(7, 158) = 6.00, p < .001, R2 = 0.21. There was a significant indirect effect of accent on social distance through status, but not through solidarity or dynamism. Hence, H3 was partially supported (see Table 4 4 ).
Direct and Indirect Effects of Accent (X) on Social Distance (Y) through Status (M1), Solidarity (M2), and Dynamism (M3).
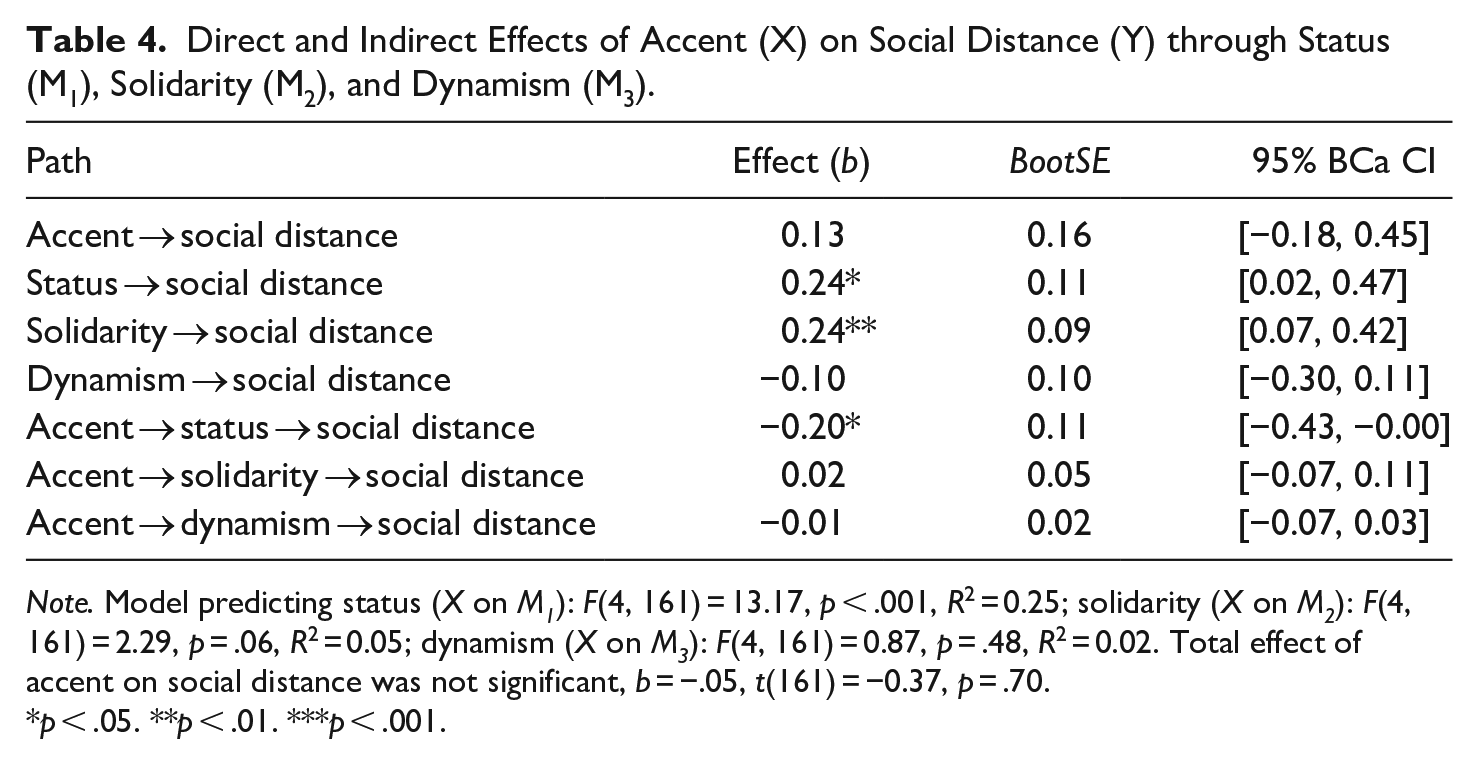
Note. Model predicting status (X on M1): F(4, 161) = 13.17, p < .001, R2 = 0.25; solidarity (X on M2): F(4, 161) = 2.29, p = .06, R2 = 0.05; dynamism (X on M3): F(4, 161) = 0.87, p = .48, R2 = 0.02. Total effect of accent on social distance was not significant, b = −.05, t(161) = −0.37, p = .70.
p < .05. **p < .01. ***p < .001.
Finally, for the covariates, participants’ sex had a significant effect on solidarity, β = 0.44, SE = 0.16, p < .01, the same result found for H1. Another covariate, age, had a significant effect on realistic threat (β = 0.02, SE = 0.01, p < .001 in the full model with all predictors) and social distance (β = −0.01, SE = 0.01, p < .01, also in the full model), indicating that older participants perceived higher realistic threat but less social distance than younger participants when evaluating speakers based on their accents.
H4 predicted that, compared to Black males, White males would be rated higher on status (H4a), solidarity (H4b), and dynamism (H4c). H4 was also tested using MANCOVA. The multivariate test for race was significant, Wilks’ Lambda = 0.86, F(3, 157) = 8.63, p < .001, η2p = .14. There was a significant main effect of race on solidarity and dynamism but not on status, Whites: M = 5.25, SE = 0.10; Blacks: M = 5.19, SE = 0.10, F(1, 159) = 0.22, p = .64, η2p = .00. Thus, H4a was not supported. For solidarity, results revealed that evaluations of Black males (M = 5.40, SE = 0.12) were significantly higher than evaluations of White males (M = 4.79, SE = 0.12), F(1, 159) = 12.41, p < .001, η2p = .07. For dynamism, evaluations of Black males (M = 5.16, SE = 0.09) were also significantly higher than evaluations of White males (M = 4.88, SE = 0.10), F(1, 159) = 4.40, p < .05, η2p = .03. Thus, contrary to prediction, Black males were rated higher on solidarity and dynamism compared to White males, indicating that H4a and H4b were not supported as initially formulated. None of the covariates had any significant effects.
RQ1 asked if status, solidarity, and dynamism mediated the relationship between the race of a speaker and symbolic threat (RQ1a), realistic threat (RQ1b), intergroup anxiety (RQ1c), and social distance (RQ1d). The research question was tested in the same manner as H2 and H3, conducting separate analyses for each dependent variable. Experimental conditions were dummy coded—White was coded as the reference group, 0, and Black was coded as the comparison group, 1. For RQ1a, results indicated a model that did not significantly predict symbolic threat, F(7, 156) = 1.27, p = .27, R2 = 0.05. Thus, there were no significant indirect effects of race through status, solidarity, and dynamism (see Table 5 5 ).
Direct and Indirect Effects of Race (X) on Symbolic Threat (Y) through Status (M1), Solidarity (M2), and Dynamism (M3).
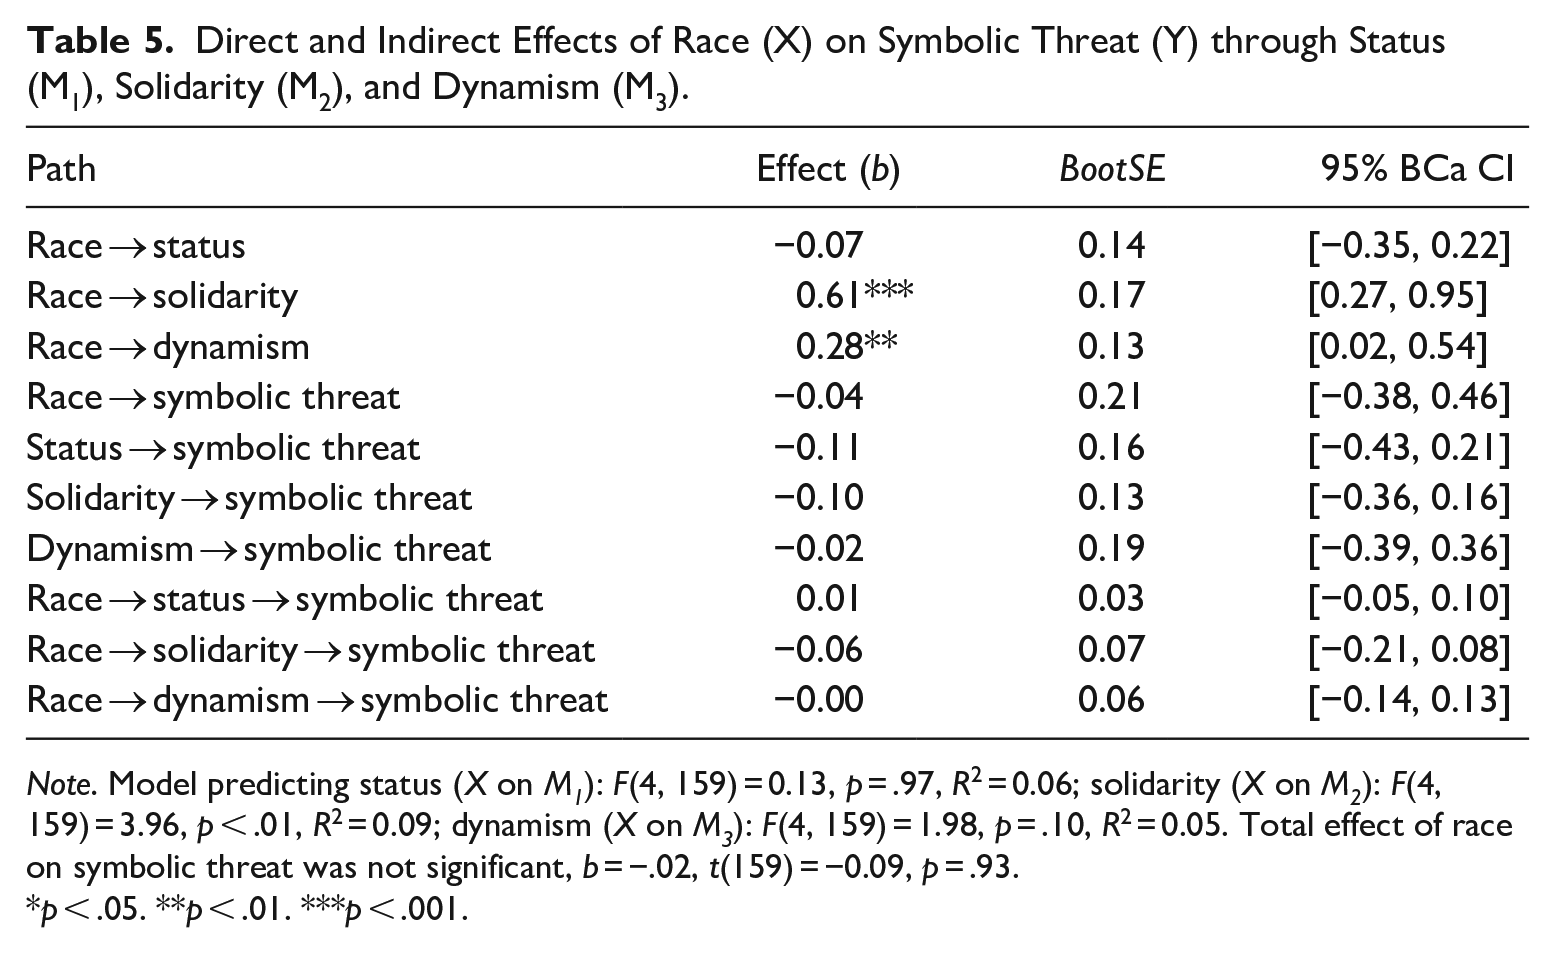
Note. Model predicting status (X on M1): F(4, 159) = 0.13, p = .97, R2 = 0.06; solidarity (X on M2): F(4, 159) = 3.96, p < .01, R2 = 0.09; dynamism (X on M3): F(4, 159) = 1.98, p = .10, R2 = 0.05. Total effect of race on symbolic threat was not significant, b = −.02, t(159) = −0.09, p = .93.
p < .05. **p < .01. ***p < .001.
For RQ1b, results also indicated a model that did not significantly predict realistic threat, F(7, 156) = 1.48, p = .18, R2 = 0.06. Thus, there were no significant indirect effects of race through status, solidarity, and dynamism (see Table 6).
Direct and Indirect Effects of Race (X) on Realist Threat (Y) through Status (M1), Solidarity (M2), and Dynamism (M3).
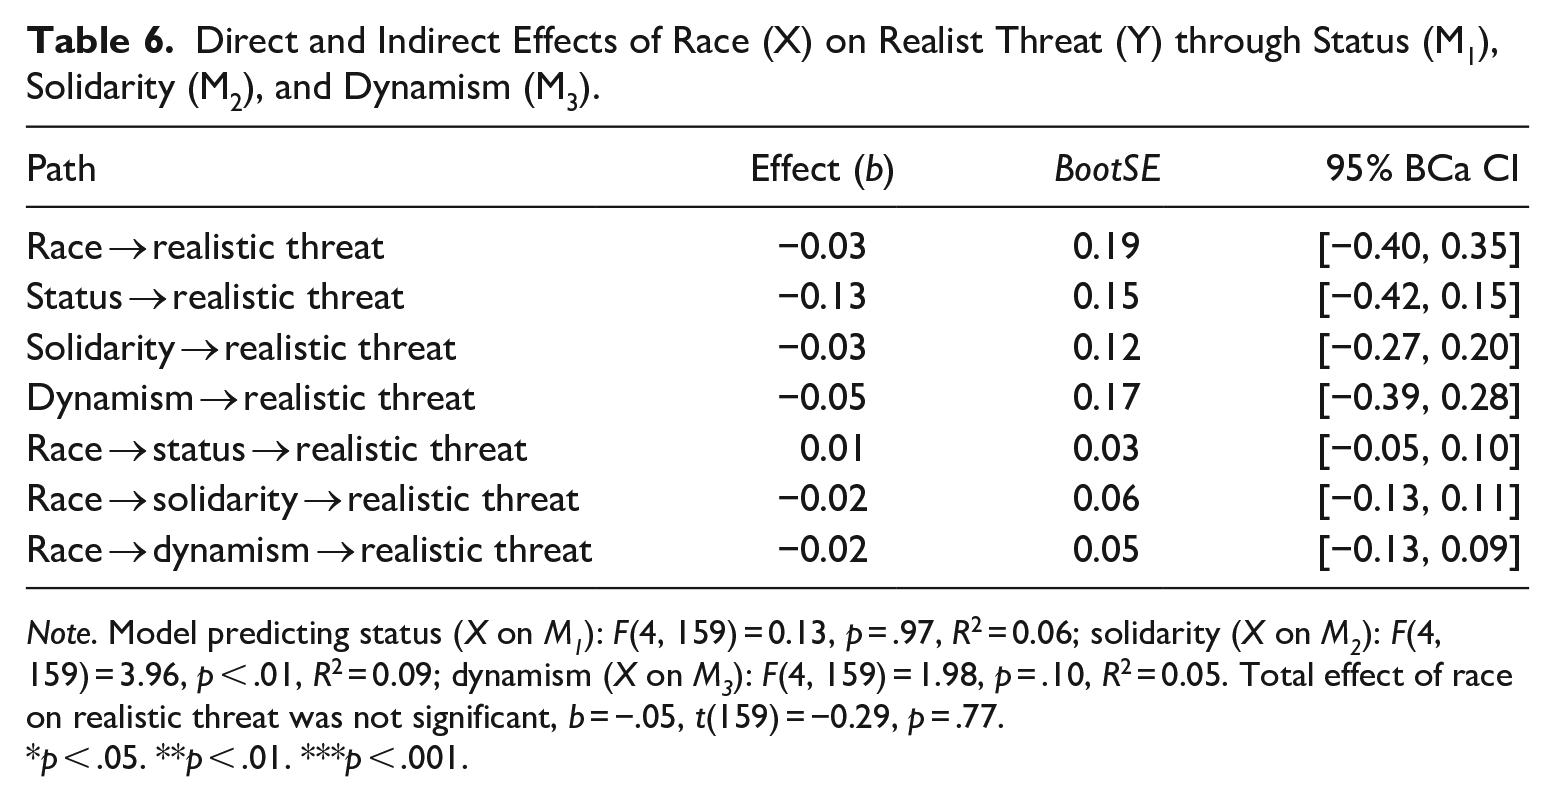
Note. Model predicting status (X on M1): F(4, 159) = 0.13, p = .97, R2 = 0.06; solidarity (X on M2): F(4, 159) = 3.96, p < .01, R2 = 0.09; dynamism (X on M3): F(4, 159) = 1.98, p = .10, R2 = 0.05. Total effect of race on realistic threat was not significant, b = −.05, t(159) = −0.29, p = .77.
p < .05. **p < .01. ***p < .001.
For RQ1c, results indicated a model that marginally predicted intergroup anxiety, F(7, 156) = 2.00, p = .06, R2 = 0.08. However, there were no significant indirect effects of race through status, solidarity, and dynamism (see Table 7).
Direct and Indirect Effects of Race (X) on Intergroup Anxiety (Y) through Status (M1), Solidarity (M2), and Dynamism (M3).

Note. Model predicting status (X on M1): F(4, 159) = 0.13, p = .97, R2 = 0.06; solidarity (X on M2): F(4, 159) = 3.96, p < .01, R2 = 0.09; dynamism (X on M3): F(4, 159) = 1.98, p = .10, R2 = 0.05. Total effect of race on intergroup anxiety was not significant, b = .10, t(159) = 0.50, p = .62.
p < .05. **p < .01. ***p < .001.
For RQ1d, results indicated a model that did not significantly predict social distance, F(7, 156) = 1.52, p = .16, R2 = 0.06, and there were no significant indirect effects of race through status, solidarity, and dynamism (see Table 8).
Direct and Indirect Effects of Race (X) on Social Distance (Y) through Status (M1), Solidarity (M2), and Dynamism (M3).
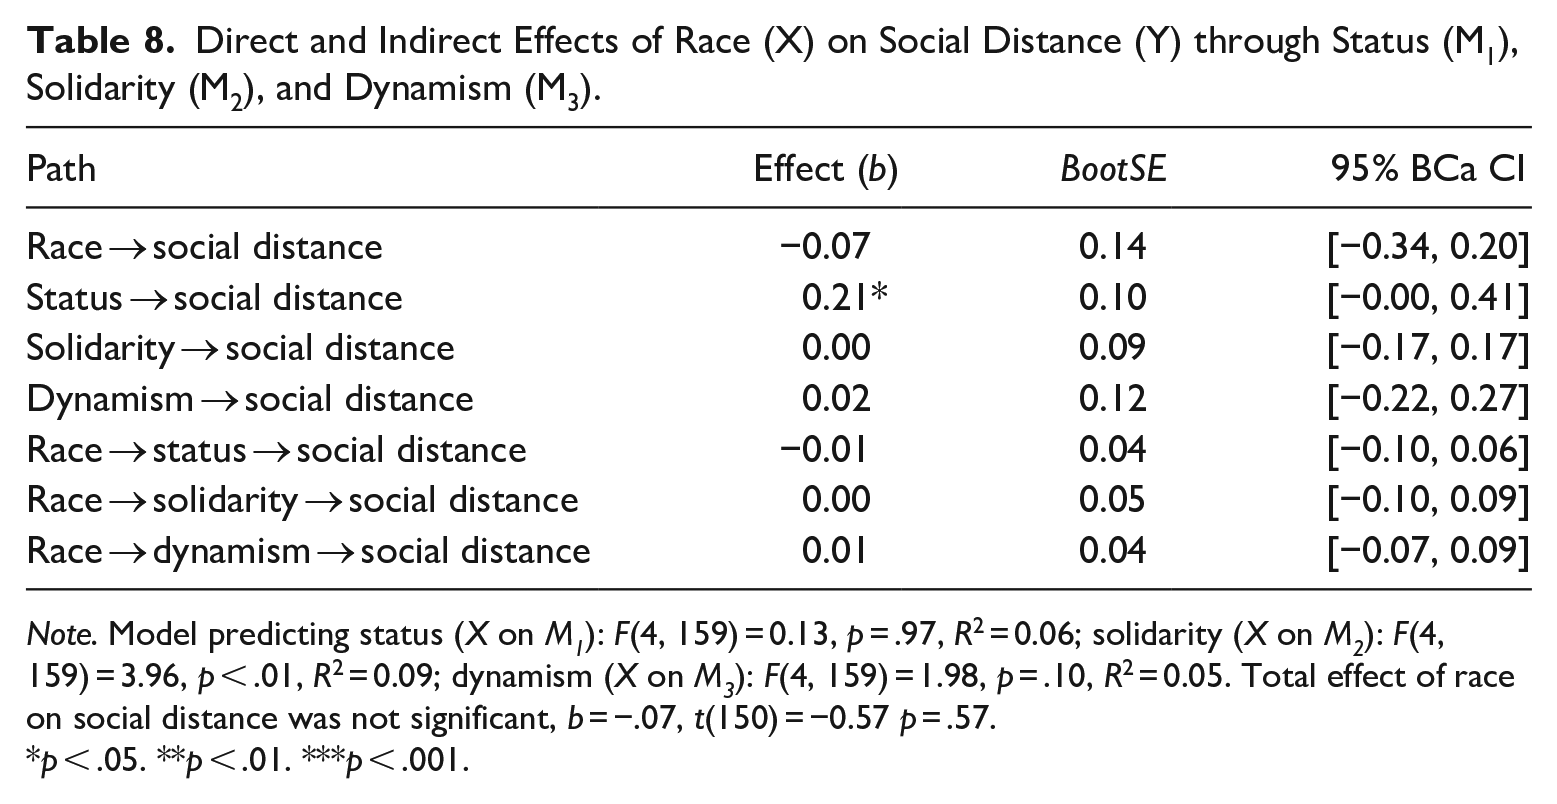
Note. Model predicting status (X on M1): F(4, 159) = 0.13, p = .97, R2 = 0.06; solidarity (X on M2): F(4, 159) = 3.96, p < .01, R2 = 0.09; dynamism (X on M3): F(4, 159) = 1.98, p = .10, R2 = 0.05. Total effect of race on social distance was not significant, b = −.07, t(150) = −0.57 p = .57.
p < .05. **p < .01. ***p < .001.
Finally, for the covariates, participants’ sex had a significant effect on symbolic threat, β = −.42, SE = 0.20, p < .05 (in the full model with all predictors), meaning perceived symbolic threat from the individuals in photographs was higher for men than it was for other participants. Another covariate, age, had a significant effect on realistic threat (β = .01, SE = 0.01, p < .05 also in the full model; it was non-significant in the direct effect model, β = .01, SE = 0.01, p = .055), indicating that, when language attitudes evaluations were also made, older participants perceived higher realistic threat than younger participants from the photographs evaluated. Age also had a significant direct effect (β = −.02, SE = 0.01, p < .05) albeit not an indirect effect (β = −.01, SE = 0.01, p = .06) on intergroup anxiety, suggesting that older participants experienced less intergroup anxiety when evaluating photographs of the stimuli individuals than younger participants.
H5 predicted that, compared to the Black-Nigerian accented speakers, White-SAE accented speakers would be rated higher on status (H5a), solidarity (H5b), and dynamism (H5c). H5 was tested using MANCOVA. Results provided partial support for H5. The multivariate test was significant, Wilks’ Lambda = .64, F(3, 156) = 28.93, p < .001, η2p = .36. There was a significant main effect of combined accent and race of a speaker on status, in that evaluations of White, SAE-accented speakers (M = 5.69, SE = 0.09) were, indeed, significantly higher than evaluations of Black, Nigerian-accented speakers (M = 4.83, SE = 0.09), F(1, 158) = 49.07, p < .001, η2p = .24. Thus, H5a was supported. There was also a significant main effect of combined accent and race of a speaker on solidarity, but in the opposite direction than predicted. Black, Nigerian-accented speakers (M = 5.59, SE = 0.10) were evaluated higher than White, SAE-accented speakers (M = 5.22, SE = 0.10) on solidarity, F(1, 158) = 6.69, p < .05, η2p = .04. Thus, H5b was not supported as originally phrased. Finally, there was no significant difference based on combined accent and race of a speaker on dynamism between White, SAE- (M = 5.03, SE = 0.09) and Black, Nigerian-accented (M = 5.14, SE = 0.09) speakers, F(1, 158) = 0.72, p = .40, η2p = .01. So, H5c was not supported. For the covariates, the multivariate test for age was significant, Wilks’ Lambda = .89, F(3, 156) = 6.63, p < .001, η2p = .11. Significant differences existed for status, F(1, 158) = 7.08, p < .01, η2p = .07, solidarity, F(1, 158) = 7.39, p < .01, η2p = .05, and dynamism F(1, 158) = 7.87, p < .001, η2p = .08, based on age. Albeit small, the correlations between age and solidarity, r(501) = .11, p < .05, and dynamism, r(501) = .16, p < .001, were significant, suggesting that older participants showed more solidarity with and evaluated the experimental stimuli individuals to be more dynamic than younger participants.
H6 predicted that status, solidarity, and dynamism would mediate the relationship between the combined accent and race of a speaker and symbolic threat (H6a), realistic threat (H6b), intergroup anxiety (H6c), and social distance (H6d). H6 was tested in the same way as H2, H3, and RQ1 and conducted using four separate analyses, one for each dependent variable. Experimental conditions were dummy coded—White-SAE was coded as the reference group, 0, and Black-Nigerian was coded as the comparison group, 1.
For H6a, results indicated a model that significantly predicted symbolic threat, F(7, 155) = 3.59, p < .01, R2 = 0.14. There was a significant indirect effect of combined accent and race of a speaker but only through status, and no significant indirect effects through solidarity or dynamism (see Table 9). Values for all direct and indirect paths are reported in Table 9. 6
Direct and Indirect Effects of Race and Accent (X) on Symbolic Threat (Y) through Status (M1), Solidarity (M2), and Dynamism (M3).

Note. Model predicting status (X on M1): F(4, 158) = 15.74, p < .001, R2 = 0.28; solidarity (X on M2): F(4, 158) = 4.48, p < .01, R2 = 0.10; dynamism (X on M3): F(4, 158) = 3.66, p < .01, R2 = 0.08. Total effect of RaceAccent on symbolic threat was not significant, b = −.05, t(158) = −0.34, p = .74.
p < .05. **p < .01. ***p < .001.
For H6b, results indicated a model that did not significantly predict realistic threat, F(7, 155) = 0.57, p = .78, R2 = 0.03. Thus, there were no significant indirect effects of combined race and accent of a speaker through status, solidarity, and dynamism (see Table 10).
Direct and Indirect Effects of Race and Accent (X) on Realistic Threat (Y) through Status (M1), Solidarity (M2), and Dynamism (M3).

Note. Model predicting status (X on M1): F(4, 158) = 15.74, p < .001, R2 = 0.28; solidarity (X on M2): F(4, 158) = 4.48, p < .01, R2 = 0.10; dynamism (X on M3): F(4, 158) = 3.66, p < .01, R2 = 0.08. Total effect of RaceAccent on realistic threat was not significant, b = −.13, t(158) = −0.70, p = .49.
p < .05. **p < .01. ***p < .001.
For H6c, results indicated a model that significantly predicted intergroup anxiety, F(7, 155) = 3.78, p < .001, R2 = 0.15. There was an indirect effect of combined accent and race of a speaker but only through status, with no significant indirect effects through solidarity or dynamism (see Table 11).
Direct and Indirect Effects of Race and Accent (X) on Intergroup Anxiety (Y) through Status (M1), Solidarity (M2), and Dynamism (M3).

Note. Model predicting status (X on M1): F(4, 158) = 15.74, p < .001, R2 = 0.28; solidarity (X on M2): F(4, 158) = 4.48, p < .01, R2 = 0.10; dynamism (X on M3): F(4, 158) = 3.66, p < .01, R2 = 0.08. Total effect of RaceAccent on intergroup anxiety was not significant, b = .04, t(158) = 0.24, p = .81.
p < .05. **p < .01. ***p < .001.
For H6d, results indicated a model that did significantly predicted social distance, F(7, 155) = 2.06, p = .05, R2 = 0.09. However, there was an indirect effect of combined accent and race of a speaker but only through status; the indirect effects of combined accent and race of a speaker on social distance through solidarity or dynamism were not significant (see Table 12).
Direct and Indirect Effects of Race and Accent (X) on Social Distance (Y) through Status (M1), Solidarity (M2), and Dynamism (M3).
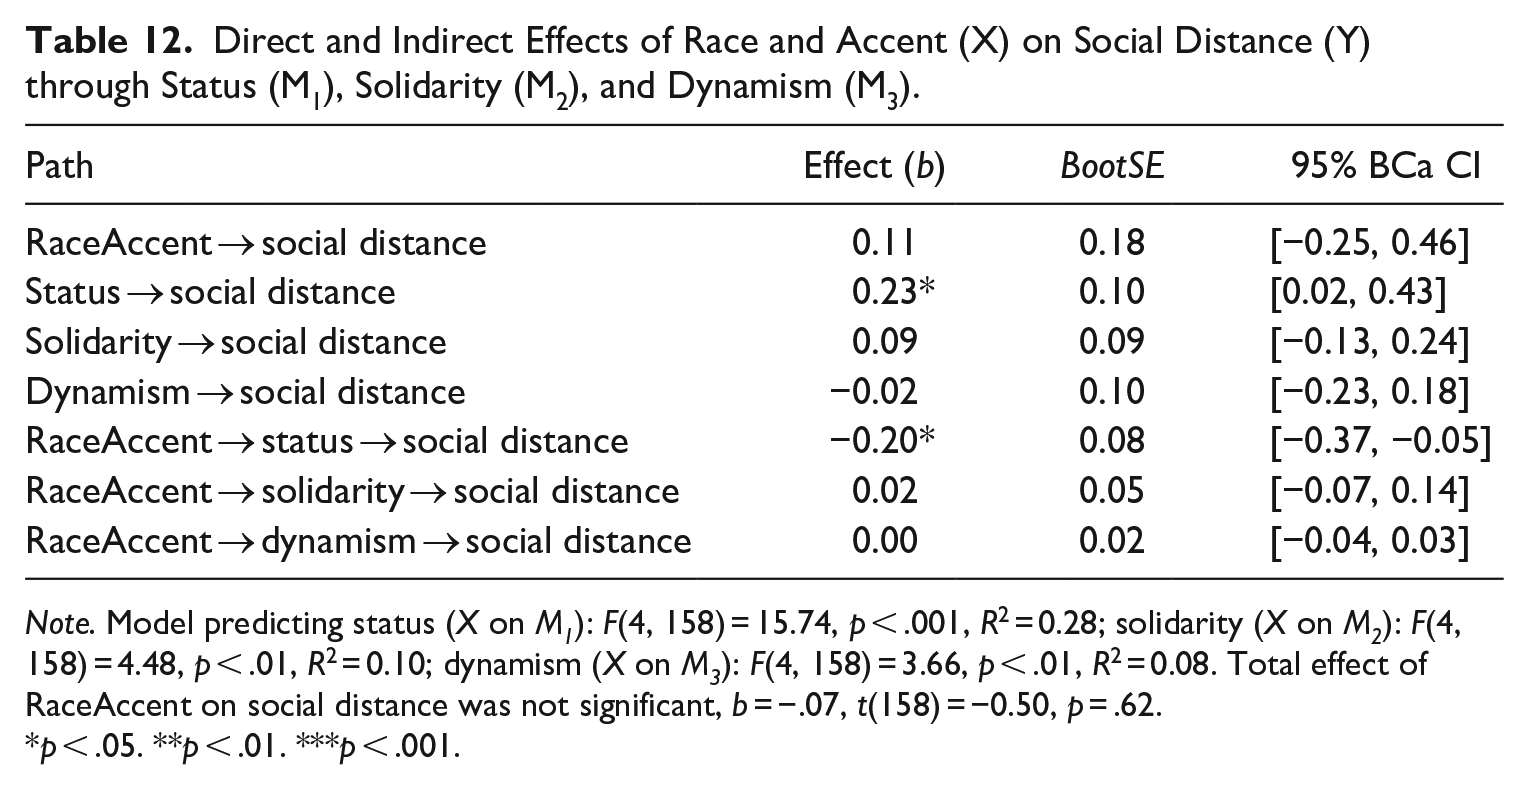
Note. Model predicting status (X on M1): F(4, 158) = 15.74, p < .001, R2 = 0.28; solidarity (X on M2): F(4, 158) = 4.48, p < .01, R2 = 0.10; dynamism (X on M3): F(4, 158) = 3.66, p < .01, R2 = 0.08. Total effect of RaceAccent on social distance was not significant, b = −.07, t(158) = −0.50, p = .62.
p < .05. **p < .01. ***p < .001.
Finally, for the covariates, age had a significant effect on all three language attitudes measures: β = 0.02, SE = 0.005, p < .001 for status, β = 0.02, SE = 0.01, p < .01 for solidarity, and β = 0.02, SE = 0.005, p < .001 for dynamism. In all three cases, older participants rated the stimuli individuals higher on status, solidarity, and dynamism compared to younger participants.
Discussion
Social categorization is based on individuals’ accent (e.g., Birney et al., 2020; Montgomery & Acheme, 2022) but also on their race (e.g., Paladino & Mazzurega, 2020). Thus, accent and race can affect the process of social categorization and stereotyping independently and concurrently, and, in turn, impact communicative outcomes. Findings from this study revealed the SAE accent was rated higher on status compared to the Nigerian accent. These results support and replicate empirical evidence from past research indicating standard accents are evaluated more favorably than non-standard accents on status (e.g., Birney et al., 2020). Within the U.S. context, immigrants are part of the minority and usually have lower socioeconomic status compared to the White majority dominant group. Thus, beliefs about the socioeconomic status of immigrant groups may have triggered lower status evaluations of Nigerian accents.
Additionally, evaluations of status hinge on ideological beliefs about standard accents as being the “correct” and “acceptable” form of speaking (Dragojevic et al., 2013). Thus, favorable ratings for the SAE accent relative to the Nigerian accent provide empirical evidence about beliefs and language-based stereotypes regarding competence, superiority, and intelligence. Signaling popular beliefs about standard varieties promoted as the “official” and legitimate form of speaking English (Dragojevic et al., 2013). Moreover, considering that the non-SAE comparison group was the Nigerian accent, ideologies and beliefs about Africa may have also played a role in evaluations of status given that negative stereotypes about Africa are constantly perpetuated in the media (e.g., Adegbola et al., 2018).
Furthermore, findings indicated status mediated the relationship between accent and (a) symbolic threat and (b) social distance. Compared to SAE-accented speakers, listeners rated Nigerian-accented speakers lower on status, which, in turn, resulted in higher perceptions of symbolic threat and more social distance towards Nigerian-accented speakers, in general. U.S. American listeners perceived the lower status of Nigerian-accented speakers as a challenge to U.S. American values, morals, customs, and language, as well as unwillingness to interact with these non-SAE-accented speakers. Symbolic threat and social distance stemming from immigrants is commonplace in popular media (e.g., Atwell Seate & Mastro, 2016). Anti-immigrant sentiment may have contributed to participants’ perceptions that the presence and low status of Nigerian-accented speakers jeopardize U.S. American values. Thus, language-based stereotypes of status serve as underlying mechanisms impacting feelings of symbolic threat and social distance toward accented speakers.
We also investigated the impact of race-based social categorizations on language attitudes. Contrary to prediction, Blacks were evaluated higher on solidarity and dynamism compared to Whites. These findings support past research contending that not all stereotypes are negative (e.g., Acheme, 2021; Acheme & Cionea, 2022), but rather contain ambivalent beliefs (i.e., not only negative but also positive attributes) reflecting relationships between groups (Fiske at al., 2002). One possible explanation is that participants’ favorable evaluations of Black males may have been triggered by current socio-cultural discourses surrounding the treatment of Blacks in the United States (e.g., Black Lives Matter). Another explanation, though, is that these results are an isolated occurrence. Thus, additional studies that reveal similar findings would be needed before we can draw definitive conclusions regarding the effects of socio-political events on the assessment of Black males in the United States.
Examining the combined effects of a speaker’s accent and race on language attitudes, and further on intergroup communication outcomes as mediated by language attitudes, revealed higher status evaluations for White, SAE-accented speakers than Black, Nigerian-accented speakers. Also, contrary to prediction, Black, Nigerian-accented speakers were rated higher on solidarity than White, SAE-accented speakers. These results are consistent with Acheme and Cionea’s (2022) study in which non-SAE-accented (i.e., Nigerian) speakers were rated higher on solidarity than SAE-accented speakers. The findings are also consistent with the notion of mixed stereotypes for outgroup members, per the stereotype content model (Fiske et al., 2002). By placating disadvantaged outgroups and ascribing them with socially desirable but subordinating stereotypes, mixed stereotypes function to promote existing ideological beliefs and systems of privilege and dominance (Ridgeway, 2001). Compared to the White, SAE-accented speakers, the Black, Nigerian-accented speakers were stereotyped as more socially attractive but lower in status, which reinforces ideological beliefs that standard accents are often spoken by the (assumed White) dominant, upper middle-class in U.S. society. Hence, higher evaluations of the White, SAE-accented speaker reflect a racialized notion of speech in which the connotations surrounding racial group membership impact stereotypes attributed to group members (Smedley & Smedley, 2005).
Findings from this study also point to a more complex picture of intersectionality in social categorization and intergroup outcomes. In the accent-race conditions, White, SAE-accented speakers were rated higher on status but lower on solidarity relative to Black, Nigerian-accented speakers. Audio stimuli may have triggered a different information processing mechanism for U.S. listeners than visual stimuli or vice versa. In other words, the social perceptions activated by the facial markers of race may have been different from those elicited by auditory markers of accents, which, in turn, influenced stereotypes of status for SAE-accented speakers and stereotypes of solidarity for Black males.
Results also revealed status mediated the relationship between the combined accent and race of a speaker and symbolic threat, intergroup anxiety, and social distance. Results point to a similar pattern of findings for accent and race as observed for the indirect effect of accent on symbolic threat, as mediated by status. With respect to intergroup anxiety, findings showed that lower status evaluations of Black, Nigerian-accented speakers resulted in more feelings of anxiety and anticipation of negative outcomes in intergroup communication. These findings provide empirical support for the underlying factors impeding (anticipated) intergroup interactions. U.S. listeners’ responses revealed that the combined effect of a speaker’s accent and race triggers feelings of anxiety through a mediated process in which Black, Nigerian-accented speakers were ascribed lower status, which then increased anxiety. This result is consistent with past intergroup research. For instance, Riek et al. (2006) reported that negative stereotypes were directly and indirectly associated with intergroup anxiety and negative attributes ascribed to outgroup members impacted feelings of anxiety. Thus, social group membership affects feelings of intergroup anxiety, as was observed in this study.
Lastly and with respect to social distance or (un)willingness to engage in future interactions with a target group, findings indicated that status mediated the relationship between a speaker’s accent and race and social distance. Lower status evaluations of Black, Nigerian-accented speakers resulted in less willingness to engage in interactions with this group. These results are plausible because ideological beliefs and the socioeconomic status of host nationals affect attitudes and feelings of social distance (Koçak, 2021). Furthermore, given social distance is a measure of prejudice (Massey et al., 2018), lower evaluations of status for Black, Nigerian-accented speakers resulting in greater social distance are reflective of the prejudicial attitudes of U.S. listeners toward Black Nigerians as a group. These results are consistent with past research on relational openness and willingness to interact with outgroup members (e.g., Carlson et al., 2019). They also indicate that status evaluations are negatively associated with prejudice (i.e., social distance) for Black, Nigerian-accented speakers. Negative attitudes and stereotypes about race and accent result in avoidance of future interactions with such individuals. The stigma associated with non-standard accents and racial minority group membership can preclude social interactions.
Finally, it is worth noting that there were some small effects based on participants’ demographic characteristics, mainly their age, which affected how participants evaluated individuals in the experimental stimuli. In our study, participants’ language attitudes were more positive as their age increased. In the presence of other variables (i.e., accent, race), age also affected intergroup outcomes such as experiences of intergroup anxiety, or perceived realistic threat. These results did not significantly change the pattern of findings reported for the research question and hypotheses, but they do suggest that as people age, their evaluations of others and the social categorization processes they undertake may change. As such, research with only younger, college-aged students lacks important nuances for our understanding of social interactions.
Theoretical and Practical Implications
This study has several theoretical implications. First, findings provide empirical support for ITT by explaining the antecedents of intergroup threat and anxiety. Evaluations of Black, Nigerian-accented speakers’ status were identified as an underlying mechanism affecting how threatened and anxious U.S. American listeners feel towards Black Nigerians as a group. While ITT explains the role perceived threats play in intergroup relations, our findings describe the antecedents of threat, which include the accent and race of a speaker as well as evaluations of the speaker’s status. An individual’s accent and race work together to impact evaluations of intelligence, competence, socioeconomic class, which in turn influence how uneasy, worried, and threatened people feel in potential interactions with such outgroup members. Indeed, perceived threats play a role in intergroup relations; however, social categorization and stereotyping processes are predictors of intergroup threat.
Second, the premise underlying social categorization is a function of social identity/group membership. Thus, our results, although not directly tested, support assumptions of social identity theory (SIT; Tajfel & Turner, 1979), positing that evaluations of one’s ingroup are determined through social comparisons with specific outgroups. By rating the SAE accent more favorably, U.S. listeners ascribed positive social identity to members of their language group, supporting the applicability and heuristic value of SIT constructs in the context of language attitudes. Third, positive evaluations of Black males relative to White males on the dimensions of solidarity and dynamism were unexpected but suggest that outgroup behavior is not always evaluated negatively. Per SIT, social identity processes trigger intergroup comparisons, resulting in ingroup favoritism and outgroup discrimination (Tajfel & Turner, 1979); however, this was not the case in this study. Findings contribute to SIT by indicating that there may be conditions in which members of the ingroup do not necessarily discriminate against outgroups, but can have favorable attitudes toward outgroup members because of socio-cultural awareness, allyship, sensitivity against prejudice and discrimination toward Blacks, etc. Hence, the mere social categorization of an outgroup member does not necessarily result in discrimination.
Furthermore, the combined effect of a speaker’s accent and race on threat, anxiety, and social distance contributes to intersectionality theory by providing empirical evidence of the intersectionality of social identities. One of the study’s goals was to examine intersectionality, a critical framework traditionally used in qualitative research. Findings expand intersectionality by not only applying it within a new (quantitative) research context, but also indicating its heuristic value by demonstrating that, indeed, social identities exacerbate each other’s effects. Evaluations of a speaker’s accent affect evaluations of their race and vice versa. Ideologies and connotations surrounding markers of race and accent impact intergroup processes. In other words, both audio and visual markers are not only used to socially categorize others but are also relied upon in ascribing speakers with stereotypes which, in turn, impact feelings of threat, anxiety, and social distance. Indeed, socially constructed, marked, and abstract categories such as race and accent cues can have detrimental consequences for (anticipated) intergroup communication.
Results also have several practical implications for intergroup communication and relations. Speaking with a non-SAE accent impacts evaluations of competence, intelligibility, confidence, socioeconomic class, level of education, and so forth. Given that interactions with non-U.S. American speakers are more widespread, ideologies and stereotypes regarding the status of a non-standard accented speaker can have effects in various virtual, mediated, online or in-person settings such as exchanges online, where individuals may have only cues about another person’s race or mediated contexts where they may only hear the other person’s accent. Similar effects could exist in various contexts such as employment, education, promotion, and social influence, which could limit access and opportunities for immigrants seeking to adapt and be integrated into U.S. society. For example, despite their English proficiency, a non-standard-accented speaker in a position of authority may be disrespected or ignored by their subordinates because of perceptions surrounding language use and competence. Similarly, in customer service settings where customer satisfaction is of utmost priority, a representative’s non-SAE accent could pose a threat to evaluations of their competence and/or customer satisfaction due to expectations of how English should be spoken, consequently leading to negative impressions that influence assessments of that speaker and the company’s image.
The implications of the study extend beyond the U.S. context, though. Similar stereotyping and categorization processes may be triggered when non-standard accents are compared to the preferred, standard accent in a culture, or when racial differences among individuals in society become the basis for differential treatment and discrimination. The influx of immigrants in European countries, for example, could reveal that similar negative language and intergroup attitudes emerge in such interactions. Thus, such results point to the need for further interventions that raise cultural awareness about language ideologies and racial differences in intergroup communication episodes, whether in the United States or other cultures and countries that have linguistically and racially diverse populations.
In addition, popular rhetoric, beliefs, and policies surrounding immigration affect the treatment and acceptance of immigrants (Montgomery & Zhang, 2018). Feelings of threat, anxiety, and unwillingness for voluntary associations with Black, non-SAE speakers can influence the climate and outcomes of interactions for both host nationals and immigrants. For host nationals, attitudes toward immigrants can also influence the stringency of immigration policies, affect the number of immigrants admitted into the country each year, as well as the types of support offered to new immigrants. Furthermore, for immigrants, knowledge about the stereotypes host nationals ascribe to Black, non-SAE immigrants may affect immigrants’ adaptation to U.S. society. The constant reminder of their non-U.S. accents can impede interactions with host nationals, affecting immigrants’ sense of belonging, identification, integration, and sense of efficacy within the society in which they are also citizens.
Limitation and Future Direction
Like any scientific effort, this study also has limitations. First, it examined attitudes towards males only. Therefore, the findings do not necessarily generalize to other gender identities. Future research would benefit from examining how individuals are evaluated not only based on the intersectional effects of their accent and race but also sex and/or gender, and how the intersectionality of these social identities impacts intergroup outcomes. Second, we did not measure additional variables such as strength of ethnic or racial identity or national identification, which may affect perceptions about intergroup outcomes, especially in cases where tensions between culturally diverse co-nationals exist. Although participants’ race and ethnicity did not reveal any significant effects on the dependent variables in this study, future research could explore whether identification with various cultural groups affects evaluations of linguistically and racially diverse others. Additionally, it is possible that just looking at a photograph of a White or Black male and/or listening to an audio recording along with their photos may not have exemplified a realistic face-to-face scenario for participants. Moreover, the binary created, wherein the SAE accent was associated with Whites and the Nigerian accent represented Blacks, may have oversimplified intersectionality. Non-SAE is not always Black, and neither is SAE always identical to White; the complexity of these socially constructed markers of identity is more nuanced. Therefore, future research could replicate the present study but record interactions between members of different races who speak with different accents to investigate how social identity markers impact communication outcomes in in-person settings, such as the classroom, workplace, or jury duty.
Here, we contend that the social identity markers of accent and race impact language attitudes, which, in turn, affect feelings of threat, anxiety, and social distance toward Nigerian-accented and Black, Nigerian-accented speakers, in general. The study provided empirical evidence regarding the underlying mechanisms and antecedents shaping intergroup outcomes (i.e., accent, race, and status evaluations). With rising globalization, migration, and multiculturalism around the world, there is a need to improve intergroup relations; this study takes an initial step in this direction by providing explanations for U.S. Americans’ feelings of threat, intergroup anxiety, and social distance in intergroup interactions.
Footnotes
Acknowledgements
The authors wish to thank Doris Acheme’s dissertation committee members, Drs. Claude Miller, Elena Bessarabova, and Meta G. Carstarphen, for their helpful commentary and support.
Declaration of Conflicting Interests
The authors declared no potential conflicts of interest with respect to the research, authorship, and/or publication of this article.
Funding
The authors received no financial support for the research, authorship, and/or publication of this article.