
Abstract
Voters using Voting Advice Applications (VAAs) often struggle with comprehension, leading to satisficing behavior. Conversational Agent VAAs (CAVAAs) aim to improve understanding by allowing users to ask a chatbot comprehension questions. While early research shows positive effects, studies have only compared CAVAAs to basic VAAs, not to enhanced VAAs (VAA+s) with clickable information buttons. Current study compares four versions: a basic VAA, a VAA+, a CAVAA, and a CAVAA+, tested on desktop (Study 1) and smartphone (Study 2). Results show that all three information-rich versions reduce non-directional answers and positively impact political and tool evaluation measures, suggesting that added information, regardless of format, improves response quality and user experience. Interestingly, users request more information in the enhanced web-based VAA+ than via the chatbot. We discuss these and other findings in the paper.
Keywords
Introduction
If citizens were asked whether they agree with political statements such as “Companies need to increase their contributions for the carbon emissions they produce”, they would likely need additional information before expressing their opinion. For instance, they might question the precise meaning of “carbon emissions”, or whether companies are currently financially accountable for these emissions. One might expect citizens to ask these questions of someone they know, or for them to look up the answers via a search engine.
When responding to comparable attitude statements in Voting Advice Applications (VAAs), however, users typically exert little cognitive effort and rarely seek additional information (Kamoen & Holleman, 2017). Instead, they tend to “satisfice” (Krosnick, 1991; Roberts et al., 2019), meaning that they provide quick answers that require only limited effort. Such satisficing behavior reduces the validity of the resulting voting advice, as users stereotypically choose non-directional answers like “neutral” or “no opinion” particularly often and use them interchangeably as if they were to have the same meaning (Kamoen & Holleman, 2017). This, in turn, may also influence actual vote choice, given that many users take the outcome of a VAA seriously (Tromborg & Albertsen, 2023; Wall et al., 2014).
One promising approach to mitigate both comprehension issues and satisficing, is the integration of additional information directly into VAAs. Conversational Agents (CAs) in the form of chatbots can provide on-demand, tailored answers to user queries. When embedded in a VAA, the tool is referred to as a Conversational Agent Voting Advice Application (CAVAA; Kamoen & Liebrecht, 2022). Studies indicate that CAVAAs reduce non-directional answers, signaling fewer comprehension problems and less satisficing behavior (Kamoen et al., 2026). Moreover, they enhance metrics that indicate the tool’s success: political knowledge and tool evaluations improved compared to traditional VAAs (Kamoen et al., 2026; Kamoen & Liebrecht, 2022).
While promising, it remains unclear whether these benefits stem from the conversational format of the CA, or from the mere presence of additional information. The current study addresses this by comparing four VAA types: a basic VAA, a VAA with additional information in the web-environment (VAA+), a CAVAA that offers a chatbot, and a combined tool (CAVAA+). This comparison provides an insight into how users’ comprehension process of VAA statements is best supported and how their tendency to spend minimal effort is best mitigated, contributing to theories from the domain of survey research on these topics (e.g., the Krosnick, 1991; Tourangeau et al., 2000). Additionally, it is relevant to evaluate the tool’s effectiveness considering its main aim to inform users about political parties’ positions (De Graaf, 2010). Therefore, we compare the four tool types on (a) the amount of political information requested, (b) political outcome measures (political knowledge, voting intention) and (c) tool evaluation measures (ease of use, usefulness, playfulness). These comparisons are not only theoretically relevant, but also have societal implications as today some VAA brands provide additional political information through clickable buttons on their web-environment, whereas other brands refrain from doing so.
The sample in the present research consists of young voters. This group is particularly relevant to study, as young people are still in the process of developing their political identity (Rekker et al., 2017), tend to be early adopters of new technologies (Van der Goot & Pilgrim, 2020), and constitute the primary target audience of VAAs (Van de Pol et al., 2014). The increasing reliance on smartphones among this group (RTL Nieuws, 2017) raises additional questions about how the device used affects outcome measures. Desktops offer large screens and precise input, while smartphones prioritize mobility, but have limited space and require scrolling (Buskirk & Andrus, 2014; Huang, 2009), which may result in different preferred ways to present additional information. To address these differences, we compare the four VAA versions on desktops (Study 1) and smartphones (Study 2), which allows for an exploration of how the affordances of each device influence non-directional responding, information uptake, tool evaluations, and political outcome measures.
Theoretical Framework
Cognitive Processes of Question Answering and Satisficing Behavior
A VAA can be seen as a survey at its core, since it asks individuals to respond to statements on political topics. When respondents answer such statements, whether in a survey or in a VAA, they typically follow four cognitive steps (Tourangeau et al., 2000). In the first stage (comprehension), respondents interpret the statement by constructing a semantic representation of its meaning (comprehension of the question; Rips, 1995) and enriching it with world knowledge to form a pragmatic understanding (comprehension about the questions; Rips, 1995). In the second stage (retrieval), respondents recall relevant information from long-term memory, activating accessible beliefs about the issue. During the third stage (judgment), they integrate these beliefs into an evaluative judgment. Finally, in the fourth stage (response), they map this judgment to one of the provided answer options.
Ideally, respondents go through all four cognitive stages thoroughly, to provide an answer that most accurately represents their underlying opinion. When respondents put in such effort, this is referred to as optimizing behavior (Krosnick, 1991; also see Roberts et al., 2019). However, especially when the task is cognitively demanding or when respondents lack sufficient motivation and/or ability, they may take mental shortcuts, a process known as satisficing (Krosnick, 1991; also see Roberts et al., 2019). Satisficing occurs when respondents only partially engage with one or more stages of the question-answering process: they may interpret the question superficially, recall only the most accessible information, skip the evaluative integration, or select a neutral or socially acceptable answer without much reflection.
Filling out a VAA easily invites satisficing behavior, as responding to political attitude statements is cognitively demanding and not all VAA users are able and motivated to perform this task accurately. Evidence for both the difficulty of such a task and the likelihood of satisficing comes from a think-aloud study among 60 VAA users (Kamoen & Holleman, 2017). Their analyses in this study showed that comprehension problems occurred in about 20% of the cases in which a respondent answers a VAA statement. Roughly 40% of these comprehension problems involved semantic ambiguities, such as difficulties interpreting tax names, or geographical references. Another approximately 35% of comprehension issues concerned pragmatic gaps, where respondents understood the literal meaning of the statement, but lacked contextual knowledge to judge it properly.
Importantly, Kamoen and Holleman’s findings also reveal that users are rarely motivated to resolve these comprehension problems through additional information seeking, for instance by looking up the desired information through a search engine (this happened in only 1.5% of the cases). Instead, most respondents relied on assumptions about the statement’s meaning and then proceeded to select an answer. This answer was often a non-directional response such as “neutral” or “skip this question” rather than a directional “agree” or “disagree” response. This non-directional responding is known to be characteristic of both comprehension difficulties and satisficing behavior (Baka et al., 2012; Sturgis et al., 2014).
Additional Information Through Conversational Agents
VAAs are designed to increase citizens’ political knowledge (De Graaf, 2010). However, when users misunderstand attitude statements and/or engage in satisficing behavior, this informational goal is compromised. This is particularly so because in these cases the non-directional answers “neutral” and “no opinion” are used seemingly interchangeably (Kamoen & Holleman, 2017), whereas they have a different role in the calculation of the voting advice: neutral answers are taken into account for the calculation of the voting advice and hence matched to party stances whereas no-opinion answers are not taken into account in advice calculations.
To mitigate both comprehension problems and satisficing behavior VAAs can be enriched with additional information. Additional information may be provided via a Conversational Agent (CA) in the form of a chatbot, so in a CAVAA (Dieing, 2025; Kamoen & Liebrecht, 2022; Van Zanten & Boumans, 2023). In CAVAAs, users can access tailored information directly through the chatbot. This is beneficial because lower information-access effort increases the likelihood of information usage (Galesic et al., 2008). By integrating on-demand explanations within the same environment, CAVAAs may enhance users’ motivation and ability to resolve comprehension problems, reducing satisficing (Krosnick, 1991) and improving question comprehension.
Empirical evidence supports these assumptions. Kamoen et al. (2026) found that the proportion of non-directional answers to attitude statements decreased significantly when users interacted with a CAVAA rather than with a traditional VAA, suggesting that question comprehension was improved and satisficing behavior effectively mitigated. Interestingly, the usage of a CAVAA was also evaluated more positively than the traditional VAA and the CAVAA scored better on political outcome measures (Kamoen & Liebrecht, 2022).
Information Provision Via a CA or the Web
While CAVAAs have primarily been developed and tested in research contexts, a new type of VAA called VAA+ has emerged in practice. A VAA+ is a VAA that contains additional information along the VAA statements within the web-environment. An example from the Dutch context is StemWijzer, where users can access definitions of terms, additional information about the topic, and party stances. Like a CAVAA, a VAA+ has the potential to mitigate comprehension problems and satisficing behavior, as additional information is easily accessible. A difference with a CAVAA is that the amount of extra information is more limited, as there is a maximum to the number of buttons one can add in a web-environment; at the same time, as only clicking is required, this information is perhaps more easily available.
Current study examines how comprehension problems and satisficing behavior can best be mitigated: with a VAA+, a CAVAA, or a tool that combines an enriched web-environment and a conversational agent (CAVAA+). These three information-rich tool types are compared to a standard VAA without supplementary information. To assess effectiveness, we first focus on the number of non-directional responses (e.g., “neutral” or “no opinion”) provided to attitude statements, an unobtrusive proxy for both satisficing behavior and comprehension difficulties (Baka et al., 2012; Sturgis et al., 2014). We expect the three information-rich versions to lead to less non-directional answers as compared to the regular VAA without extra information (compare: Kamoen et al., 2026):
In addition to response behavior, we examine political outcome measures (perceived and factual knowledge, voting intention) and tool evaluation measures (ease of use, usefulness, playfulness), which are indicators of the success of VAAs. Based on findings in previous studies (Kamoen et al., 2026; Kamoen & Liebrecht, 2022) we hypothesize:
While H1–H3 are about the expected relation between the three information-rich versions and the standard VAA, our study will also examine any differences between the VAA+, the CAVAA, and the CAVAA+. For these three versions, not just non-directional answers, tool evaluations and political outcome measures can be compared, but also the actual uptake of information, which is practically relevant for assessing if there are differences between tool types in how frequently certain information is requested. We will merely explore these differences as contrasting hypotheses can be formulated based on earlier research.
On the one hand, providing information directly within the web-environment in a VAA+ might already be sufficient for users. Previous research suggests that VAA users often prefer easily accessible information, such as clickable buttons (Kamoen & Liebrecht, 2022), over more effortful interactions like typing or voice commands (Liebrecht et al., 2023; Van Zanten & Boumans, 2025). Since VAA users are already familiar with the web-environment, integrating clickable buttons in this channel represents a minor change that could effectively motivate users to access additional information in a simple, digestible format. This would in turn lead to more information uptake and probably also higher scores on tool evaluation and political outcome measures.
On the other hand, the conversational features of a CAVAA may outperform the static nature of the VAA+, because chat affordances can offer tailored information that exceeds what is feasible through buttons alone (Mygland et al., 2021), such as semantic explanations of a broad range of terms or party-specific stances toward the VAA statements. Additionally, young voters, the target group of the current study, may appreciate the novelty and interactivity of conversational technology as they are often considered “early adopters” (Van der Goot & Pilgrim, 2020). Given the potential strengths of each type, current study will explore the difference between the three information-rich tools with respect to non-directional answers, information uptake, tool evaluation and political outcome measures.
The Role of Device
Given the increasing prevalence of smartphone use, it is important to examine how the device on which users interact with a VAA influences their experience. Although most users complete VAAs on desktops or laptops, usage via smartphones is rising (RTL Nieuws, 2017); a trend that mirrors survey completion in general (Couper et al., 2004). This shift is noteworthy, because different devices have different affordances that affect layout, design, and user interaction (Buskirk & Andrus, 2014; Huang, 2009). Desktops and laptops, with large screens and precise mouse-and-keyboard input, are well-suited for information-rich tools. In a VAA+, buttons can be displayed side by side beneath the statement, leaving space for texts that provide detailed information. Multiple political profiles can be compared simultaneously, and if a chatbot is integrated, it can appear alongside the VAA statement without obstructing other elements. Smartphones, by contrast, prioritize mobility and accessibility, enabling users to engage with VAAs on the go, but they come with limitations such as smaller screens and the need for scrolling. Buttons are typically displayed vertically, and information is revealed only after expanding each button. When a chatbot is included, it opens on top of the VAA interface, requiring users to switch between the VAA and the chat.
Survey research on smartphone versus desktop usage highlights advantages and challenges. Smaller screens can increase cognitive load, reduce readability, and potentially lead to greater satisficing behavior, such as reliance on immediately visible response options or shorter answers to open-ended questions (Couper et al., 2004; De Bruijne & Wijnant, 2014; Mavletova, 2013). On the other hand, smartphones can enhance enjoyment, offer more intuitive interactions through touch input, and reduce the time required to answer questions (Bosnjak et al., 2010; Buskirk & Andrus, 2014). Some other studies, however, find no difference between desktop and smartphone (De Bruijne & Wijnant, 2014; Wells et al., 2014).
Based on these findings, there is no strong reason to expect systematic differences in the effects of the VAA versions when accessed on desktops or smartphones. Nevertheless, given the distinct affordances of each device, it is relevant to examine how differences between tool types vary across device. Therefore, the above hypotheses are tested separately for desktops (Study 1) and smartphones (Study 2).
Method
Design
In two experimental studies, we implemented a between-subjects design in which participants were randomly assigned to a basic VAA without any information (VAA), a VAA with additional information in the web-environment (VAA+), a VAA without information in the web-environment, but with a conversational agent (CAVAA), and a VAA with additional information in the web-environment and a conversational agent (CAVAA+). Our studies hence both had a 2 (type of web-environment: with or without information buttons) × 2 (type of tool: with or without a chatbot) design. The tool types are compared with respect to (1) the proportion of non-directional answers to the political attitude statements, (2) tool evaluation measures, (3) political outcome measures, and (4) the information uptake in the three information-rich tools. Studies have been conducted in the lead-up to the European Parliament election in the Netherlands on June 6, 2024. Approval was obtained from the Research Ethics and Data Management Committee of Tilburg University (REDC2013.13b).
Experimental Materials
Structure of the (CA)VAA(+)
The basic VAA used in both studies was derived from the well-known Dutch VAA brand StemWijzer, developed by ProDemos, who permitted usage of their tool in a modified format. The tool, designed for the 2024 European Parliament elections, presented users with 30 political statements (e.g., “Ukraine should become a member of the European Union”). These statements were created by ProDemos to reflect the key political debates at the time. Participants could respond to each statement using a three-point scale: “Agree,” “Neither agree nor disagree,” or “Disagree.” They also had the option to “Skip” each statement. Once participants answered the final statement, the tool showed the percentage of agreement with all political parties (sometimes referred to as voting advice).
The VAA+ contained supplementary information that was accessible via buttons in the web-environment. In the official StemWijzer there are three types of information: Party positions, a general “more information” about the statement, and Semantic information—the latter is indicated by a highlighted term in the statement that can be clicked on. We retained the highlighted term that provides semantic information, but changed the labels on the information buttons so that the buttons read: “What is the current situation?,” “Pros and cons,” and “Party stances,” corresponding to the most frequently occurring comprehension problems VAA users experience (Kamoen & Holleman, 2017). The “What is the current situation?” button provided up-to-date information about the status quo of the political issue. The “Party stances” button displayed a table listing all political parties and their positions on the statement. We added a “Pros and cons” button, presenting a bullet-point list of up to three arguments for and against the statement without party names.
The information that could be accessed via the buttons was drawn from reputable sources, such as government websites, while party stances were provided directly by the political parties. To compile the pro and con arguments, we analyzed all party stances and distilled the most frequently mentioned arguments. To prevent the number of arguments from serving as a heuristic cue, we kept the number of pro and con arguments equal (see Figure 1). We rebranded the tool under the name KiesWijs, with changes to the name, logo, and design (e.g., a purple color for the headings instead of the original blue color StemWijzer uses). This was done to make sure participants knew they interacted with an experimental version.
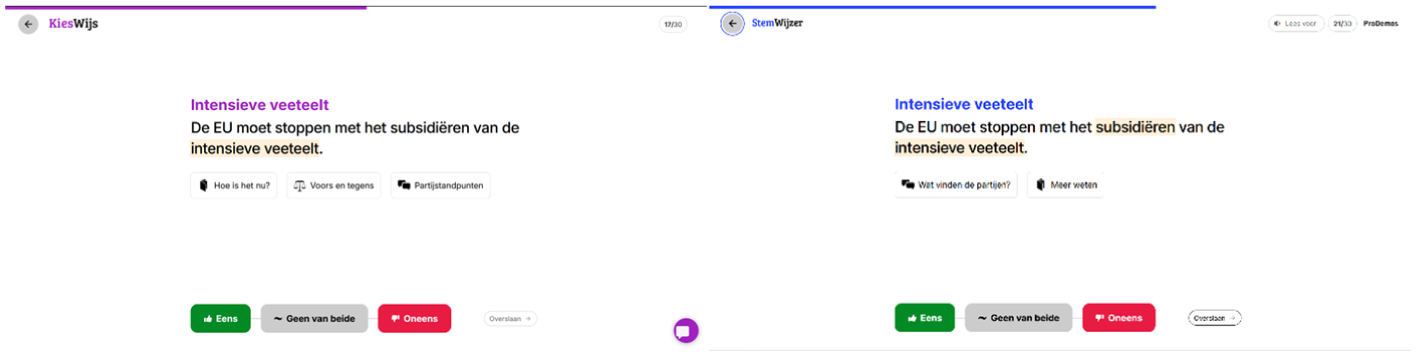
An example of the same statement in KiesWijs (on the left) and StemWijzer (on the right) next to each other for comparison. As you can see, the buttons underneath the statement differ, as well as the color and logo. StemWijzer’s also has two highlighted terms, whereas KiesWijs only has one. You can also see a purple circle (with a message icon) in the lower right corner of KiesWijs, this is the chatbot.
Conversational Agent Features
In the CAVAA conditions, we integrated a chatbot called Lina into the VAA(+). Lina’s main function was to provide clarification and guidance throughout the tool. For each statement, users could click one of four buttons in the chat to ask for further information: “X?” (e.g., “Intensive animal farming?”) for semantic information, “What is the current situation?” for Pragmatic information “Pros and cons,” and “Party stances.” Clicking on one of the information buttons led to the same information that was available under the highlighted term and the buttons in the VAA+ condition.
Besides these four pre-set buttons, users could also type questions into an open chat window and hence had the opportunity to request more information than in the VAA+ condition (see Figure 2). To answer these open questions, the chatbot followed a rule-based system. It could detect a range of question types, such as pragmatic (e.g., “How much. . .?”), and political party-related inquiries (e.g., “What does Party X think?”). It was trained to answer all questions that could be asked using the buttons and more. For example, the chatbot was trained to explain other difficult terms that could appear in de VAA statements or supplementing information, answer general questions about the election (e.g., “Which states are part of the European Union?”), and provide information about the workings of the tool (e.g., “Click on the arrow on the upper left to go to the previous statement.”). The tool was also equipped with conversational features, like responding to greetings, and could handle misunderstandings or inappropriate comments by utilizing various repair strategies. The AI model identified the intent behind user questions; all responses were manually written by our research team and informed by trusted sources such as dictionaries, government sites, and party platforms. Our team cross-checked all responses for accuracy, non-biased wording, and understandability. For a demonstration of the CAVAA+ version, see https://surfdrive.surf.nl/files/index.php/s/KwJG82jQvuLFezr.
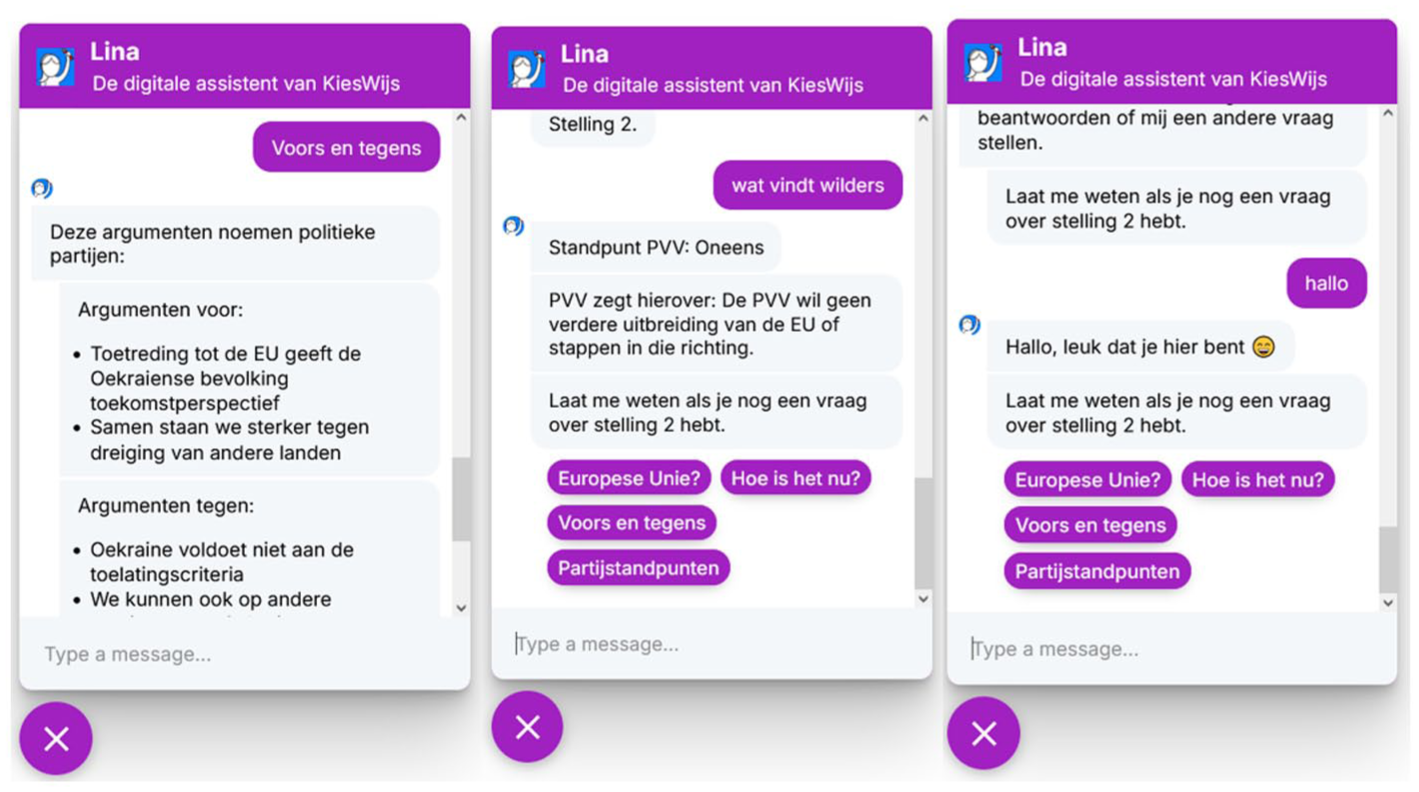
Examples of possible interactions with Lina, a button-click (left), a typed question (middle), and a greeting (right).
Procedure
Participants completed the study on a desktop in a soundproof research booth at Tilburg University (Study 1) or on a smartphone (Samsung Galaxy S10) in one of the silent working areas in the various buildings (e.g., public libraries) across two Dutch cities (i.e., Tilburg and s-Hertogenbosch; Study 2). At the start of the experiment, participants were shown that two tabs were open in their browser: one displaying the (CA)VAA(+) and the other a Qualtrics survey. Before starting the study, the researcher ensured that both tabs were properly opened and that the (CA)VAA(+) tab was accessed via a link in the Qualtrics survey. This process allowed Qualtrics to generate a unique random number, which was sent to the (CA)VAA(+) to enable the connection of survey data with usage data later on.
Upon starting the experiment, participants first read the study instructions and provided their informed consent in Qualtrics. Then they switched tabs and used the (CA)VAA(+). After having answered the 30 statements and having received voting advice, participants returned to the Qualtrics tab to complete a questionnaire designed to measure the other dependent variables of the study. This survey also included demographic questions and items measuring general political interest. Finally, participants were thanked and received their participation credits (Study 1) or a treat (a mandarin or candy bar; Study 2). Full experimental materials are available via Dataverse: https://doi.org/10.34894/RHAEJ6.
Measures and Analysis
Proportion of Non-Directional Answers
For each of the 30 statements we monitored whether a directional answer was provided (“Agree” or “Disagree”) or a non-directional one (“Neither agree nor disagree” or “Skip this question”). To analyze the response behavior (the proportion of non-directional answers), we constructed a multi-level model in which the Logit of the proportion of non-directional answers is the DV. In the fixed part, the proportion of non-directional answers is estimated for each condition and these proportions are allowed to vary between items (as some items may be more difficult than others), respondents (as some respondents may find answering questions more difficult; this level is cross-classified with the item-level) and the interaction between the two. The mean Logit proportions for each IV can be compared in a contrast test, that gives a χ2-distributed test statistic (also see Quené & Van den Bergh, 2004, 2008).
Tool Evaluation and Political Outcome Measures
In the survey, participants responded to several attitude statements on a seven-point Disagree-Agree scale. The constructs ease of use, usefulness, and playfulness, based on the Technology Acceptance Model (TAM; Davis, 1989; also see Ahn et al., 2007), were each measured with three items (e.g., “The application was user-friendly”). The reliability of the ratings was good (ease of use: αstudy 1 = .82; αstudy 2 = .62; usefulness: αstudy 1 = .76; αstudy 2 = .63, and playfulness: αstudy 1 = .81; αstudy 2 = .74).
We also measured the perceived political knowledge with three items (compare Kamoen & Liebrecht, 2022). The reliability of this scale, however, was poor in Study 1 (α = .44) and marginally acceptable in Study 2 (α = .65). This was because in Study 1 the item “This VAA motivates me to further deepen myself into politics” did not correlate highly with the other two items (“Due to using this tool I better understand the stances of political parties” and “I better understand the political landscape because of working with this tool”). Removal of this item resulted in an acceptable reliability of the latter two items (αstudy 1 = .69; αstudy 2 = .61); the mean score of these two items were used for data analysis.
As a final perceptual measure, we asked two questions related to voting intention: “I feel informed to vote in the EU elections” and “I am planning to vote during the EU elections.” These two items did not cluster well together (αstudy 1 = .55; αstudy 2 = .37) and were therefore analyzed separately.
Besides perceptual measures, respondents were also asked to judge the truth value (true/false/don’t know; also see Dolan, 2011) of seven statements regarding the EU elections (e.g., “The PVV supports an EU army”). We summed the total number of correct answers per participant and used that as a proxy for the factual political knowledge of participants.
To analyze the survey data, we ran a two-way ANOVA with the type of web-environment (with or without buttons) and the type of tool (with or without chatbot) as IVs. If an interaction effect was found, we specified this effect by comparing groups using a t-test.
Information Uptake
Clicking Behavior
Given that reduced effort in accessing information is known to enhance the likelihood of its utilization (Galesic et al., 2008), we additionally examined user click behavior on the tools’ information buttons as a measure for their information uptake. For the three information-rich versions (VAA+, CAVAA and CAVAA+) we monitored per attitude statement whether (1) or not (0) the respondent requested the four available information types through the buttons in the web-environment and/or chatbot. To analyze this data, we hence chose to count information requests as a binary variable and not as a continuous variable; this choice was made as respondents hardly ever request the same information twice. In Logit multi-level models per information type, we subsequently analyzed this proportion accounting for the structure of the data by the implementation of a cross-classified model (with item variance, respondent variance, and interaction variance).
Typing Behavior
To obtain additional insights into the value of an open text field in the CAVAA and CAVAA+, we performed a content analysis on the types of questions participants requested via the chat and how well the bot performed in answering them. For coding the type of information requests, we distinguish between five categories: (1) Semantic information (e.g., “What is EU?”); (2) Pragmatic information (e.g., “What are the regulations now?”); (3) Pro and con information (e.g., “What are the benefits?”); (4) Party stances (e.g., “What does VVD think of this?”), and (5) Other (e.g., “What are the EU’s requirements?,” “Thank you”). Furthermore, we coded the chatbot-responses in four categories: (1) the response was correct and matched the user request; (2) the bot signaled a nonunderstanding and responded with a preprogrammed repair strategy; (3) the bot response was incorrect and there was hence misunderstanding; and (4) the bot lacked a response because of a technical error. Two authors double coded all chats. For both studies, the reliability of the coding was good to perfect. 1
Participants
Study 1
Study 1 was conducted between May 13th and May 30th, 2024. We recruited participants from the student pool at Tilburg School of Humanities and Digital Sciences, offering participation credits in exchange for enrollment. All participants were higher educated (HBO or WO) young voters, and eligible to vote when administering the experiment. Of the 143 participants, 1 participant was excluded due to inconclusive matches between the survey in Qualtrics and the response data, leaving 142 participants for analysis. Of these, 98 identified as female (69.0%), 43 as male (30.3%), and 1 differently (0.7%). The average age of the participants was 21.52 years (SD = 2.75), ranging from 18 to 34. We checked the male/female ratio and the average age of participants between conditions and found no differences (in all cases: χ2(1) > .67, p > .41 and F(1, 138) < 0.43, p > .51). This increases the confidence that any possible effects are due to the manipulation rather than to a priori differences between groups.
Study 2
Study 2 was conducted between May 14th and June 4th, 2024. Participants were recruited at the public library and different locations of higher education institutions. Participants received a small treat (a candy bar or mandarin), and in a rare instance a course credit. While 162 higher-educated respondents completed the survey, data from 12 respondents were excluded due to inconclusive matches between the survey data and the VAA response data. The rate of inconclusive matches was higher than Study 1, likely due to several factors, including unstable internet connections in some of the locations where participants were recruited. This instability caused the system to occasionally fail in transmitting the ID number to the chatbot. Due to the relatively higher number of mismatches, we decided to run the analyses on the survey data twice. We use the dataset with 150 cases as the primary sample and report differences with the larger sample in footnotes.
Of the 150 participants, 66 (44.0%) identified as male, 82 as female (54.7%), and another two respondents (1.3%) did not indicate their gender. The mean age of respondents was 20.73 (SD = 2.18). We again checked the distribution of respondents across the four conditions in the sample and found no differences in terms of gender (in both cases: χ2(1) < 1.57, p > .21) and age (in all cases: F(1, 143) < 3.12, p > .08). This indicates that there is no reason to assume a priori differences between groups.
Results
Study 1: Desktops
Proportion of Non-Directional Answers
We first examined whether users of the information-rich versions provided less neutral or no-opinion answers compared to users of the basic VAA. Table 1 displays the proportion of non-directional answers for each condition. A comparison of these proportions reveals two main effects: participants are more likely to provide directional answers when (1) the VAA’s web-environment includes clickable buttons (χ2(1) = 16.16, p < .001, Cohen’s ditems = 2.26) and (2) a chatbot is added (χ2(1) = 4.69, p = .03, Cohen’s ditems = 1.26). The interaction between these two variables is not significant (χ2(1) = 0.76, p = .38). Overall, these findings suggest that both adding clickable buttons and including a chatbot independently reduce the likelihood of non-directional answers. The sizes of these effects are large (Cohen, 1988) relative to the between-item standard deviation, and also substantive in terms of percentages as the difference between the VAA and the CAVAA+ amounts to a decrease in non-directional answers with 12.6% (a proportional reduction of 55%). As two main effects are observed, this suggests that a system with both a chatbot and buttons leads to the least non-directional answers.
The Proportion of Non-directional Answers Per Condition in Proportions and in Logits Used for the Analysis.

Note. The variances are only displayed in logits.
Tool Evaluation and Political Outcome Measures
Table 2 shows the mean scores per experimental condition for the various dependent variables measured through survey items.
Means and Standard Deviation (Between Brackets) on the Survey DVs.

Note. Scores are expressed on a scale from 1 (lowest) to 7 (highest).
For ease of use, playfulness, and the extent to which participants indicate they are planning to vote, we found no statistically significant differences between the VAA, VAA+, CAVAA, and CAVAA+ (in all cases: F(1, 138) = 3.76, p > .06). For the other DVs, however, differences were observed. These will be discussed in more detail below.
For usefulness, while we did not observe a main effect of the type of web-environment (with or without buttons; F(1, 138) = 1.96, p = .16) or the type of tool (with or without chatbot; F(1, 138) = 3.34, p = .07), we did find an interaction between the two (F(1, 138) = 12.02, p < .001, Cohen’s d = 1.08). The interaction can be read such that a CAVAA is more useful than a basic VAA (t(70) = 3.69, p < .001, Cohen’s d = 0.87), but a VAA+ and a CAVAA+ are perceived to be equally useful (t(68) = 1.37, p = .14). The CAVAA does not differ from the CAVAA+ (t(72) = 1.13, p = .13) and the VAA+ (t(72) = 0.37, p = .71). Overall, this indicates that the CAVAA, VAA+, and CAVAA+ are perceived as more useful than the basic VAA, while no significant differences are observed among these three information-rich tools. The difference between the three information-rich tools and the basic VAA can be classified as large relative to the standard deviation (Cohen, 1988).
Similar results are found for perceived knowledge. For this variable, we observed a main effect of both the type of web-environment and the type of tool (F(1, 138) = 6.07, p = .015, Cohen’s d = 1.70 and F(1, 138) = 20.76, p < .001, Cohen’s d = 0.97), as well as an interaction between the two (F(1, 138) = 4.91, p = .012, Cohen’s d = 0.68). The interaction can again be read such that a CAVAA is more useful than a basic VAA (t(70) = 3.07, p = .003, Cohen’s d = 0.73), but a VAA+ and a CAVAA+ are perceived to be equally useful as the CAVAA (t(68) = 0.20, p = .85). The CAVAA does not differ from the CAVAA+ (t(72) = 1.67, p = .10) and from the VAA+ (t(72) = 1.65, p = .10).
For the extent to which users feel informed to vote, there are two main effects (Type of web environment: F(1, 138) = 5.73, p = .018, Cohen’s d = 0.78; Tool type: F(1, 138) = 18.22, p < .001, Cohen’s d = 1.45), but there is no interaction (F(1, 138) = 1.92, p = .168). Unlike the findings for usefulness and perceived knowledge
The results for factual knowledge are somewhat like those for feeling informed to vote, as the interaction effect does not reach significance (F(1, 138) = 1.09, p = .298). However, a significant main effect of the type of web-environment (F(1, 138) = 4.11, p = .045, Cohen’s d = 0.59) and a marginally significant main effect of tool type (F(1, 138) = 3.46, p = .065, Cohen’s d = 0.56) are observed. As both effects are somewhat comparable in terms of their effect size, we interpret these findings such that the inclusion of buttons in the web-environment and the addition of a chatbot—independently of one another—contribute to an increased factual knowledge.
All in all, results are partially in line with H2 and H3, since not all survey DVs show the same effects. Nevertheless, the overall picture arising is that including information, albeit in the form of buttons, a chatbot, or both, is superior to not including any information in a VAA. For some variables, we found the inclusion of buttons and the inclusion of a chatbot to have separate effects, whereas for other variables the condition including both (CAVAA+) was rated at the same level as the VAA+ and the CAVAA.
Information Uptake
Clicking Behavior
Table 3 presents the proportions of attitude statements for which each of the four information types was requested, across the three information-rich tool types. A key initial observation concerns the general trend in information requests. In real-life VAAs, additional information typically focuses on the meaning of terms (semantic information) and party stances. However, as Table 3 illustrates, users access this information far less often than pragmatic information about the status quo or pro and con arguments in the debate. We will explore this further in the discussion section.
Percentage of Times a Certain Type of Information was Requested Via the Web-Environment and/or Chatbot.

As for the comparison between the VAA+, the CAVAA and the CAVAA+, results show that semantic information is accessed with equal frequency across all three tool types (in all cases: χ2(1) < 2.90, p > .16), suggesting that the medium of access—through chatbot or clickable terms in the web-environment—does not impact how frequently this information is requested.
For the VAA+, pragmatic information, information on pros and cons, and party stances could be accessed by clicking the buttons below the attitude statement in the web-environment. Similarly, in the CAVAA, these types of information were available via buttons in the chatbot, while in the CAVAA+, both options were provided. Results indicate that all three types of information were accessed more frequently in the VAA+ and the CAVAA+ than in the CAVAA (in all cases: χ2(1) < 8.43, p < .01, Cohen’s d > 1.28). No differences are observed between the VAA+ and the CAVAA+ (in all cases: χ2(1) < 0.20, p > .67).
When summing the proportion of cases in which at least one of the four information types was requested, a clear pattern again emerges: information is accessed significantly more often in the web-environment (in the VAA+ and the CAVAA+) than through the chatbot (CAVAA: χ2(1) > 20.1, p < .001, Cohen’s d > 1.78). The differences between the VAA+ and the CAVAA+ on the one hand and the CAVAA on the other hand can—in all cases—be classified as large relative to the between-item variance (Cohen’s d > 1.28), and their effect size is also huge both in absolute and relative percentages (see Table 3).
The above comparisons focus solely on button clicks, either in the web-environment or the chatbot. A theoretical advantage of a chatbot, however, is that users can request additional information by typing questions into the open chat. To account for this, we also measured how often respondents typed questions (about any possible topic) and calculated a new proportion score reflecting the total frequency of information requests. This score is only slightly higher than the score based on button clicks alone. Statistical comparisons further highlight large differences between conditions: even when including typed questions, information is requested more frequently via the web-environment than the chatbot (in both cases: χ2(1) = 19.63, p < .001).
Typing Behavior
In total, the open chat field in the chatbot was used 68 times. Some participants typed in multiple questions per statement; in 52 unique respondent-items combinations, respondents typed a question in the open chat, which is in 2.3% of all respondent-items combinations. The division of questions over the CAVAA and CAVAA+ conditions was exactly equal.
Half of all information requests (n = 34; 50.0%) fell into one of the four information types accessible via the information buttons. Requests most frequently concerned party positions (n = 19; 27.9%), followed by pragmatic information about the status quo (n = 7; 10.3%) and semantic information clarifying the meaning of terms used in the questions (n = 7; 10.3%). Pro and con arguments were rarely requested via the chat (n = 1; 1.5%). In addition, the “other” category contained 34 requests (50.0%). These were mainly questions for more clarification to the statement (e.g., “What is the potential for abuse?”), and follow-up questions to the topic (e.g., “Why does Ukraine want to join the EU?”).
As for the chatbot performance, the chatbot answered 28 information requests correctly (41.2%), and used a preprogrammed repair strategy on 3 occasions (4.4%). In nine cases (13.2%), no bot response appeared because of a technical error. In the remaining 28 cases (41.2%), a misunderstanding occurred. This entails that the bot did provide an answer but that it did not match the user’s request. Most of these misunderstandings were caused by participant questions the chatbot was not trained to handle. For instance, participants often posed questions that were more specific than the chatbot’s training covered (e.g., “What does development aid consist of?”; “What is the policy in France?”).
Results Study 2
Proportion of Non-Directional Answers
Table 4 displays the proportion of non-directional answers per condition when the (CA)VAA(+) is accessed via a smartphone. Differences between conditions are not significant (in all cases: χ2(1) < 1.61, p > .32), indicating that—contrary to H1
The Proportion of Non-directional Answers Per Condition in Proportions and in Logits Used for the Analysis.

Note. The variances are only displayed in logits.
Tool Evaluation and Political Outcome Measures
In Table 5, the means and standard deviation can be found for the survey measures.
Means and Standard Deviation (Between Brackets) on the Survey DVs.
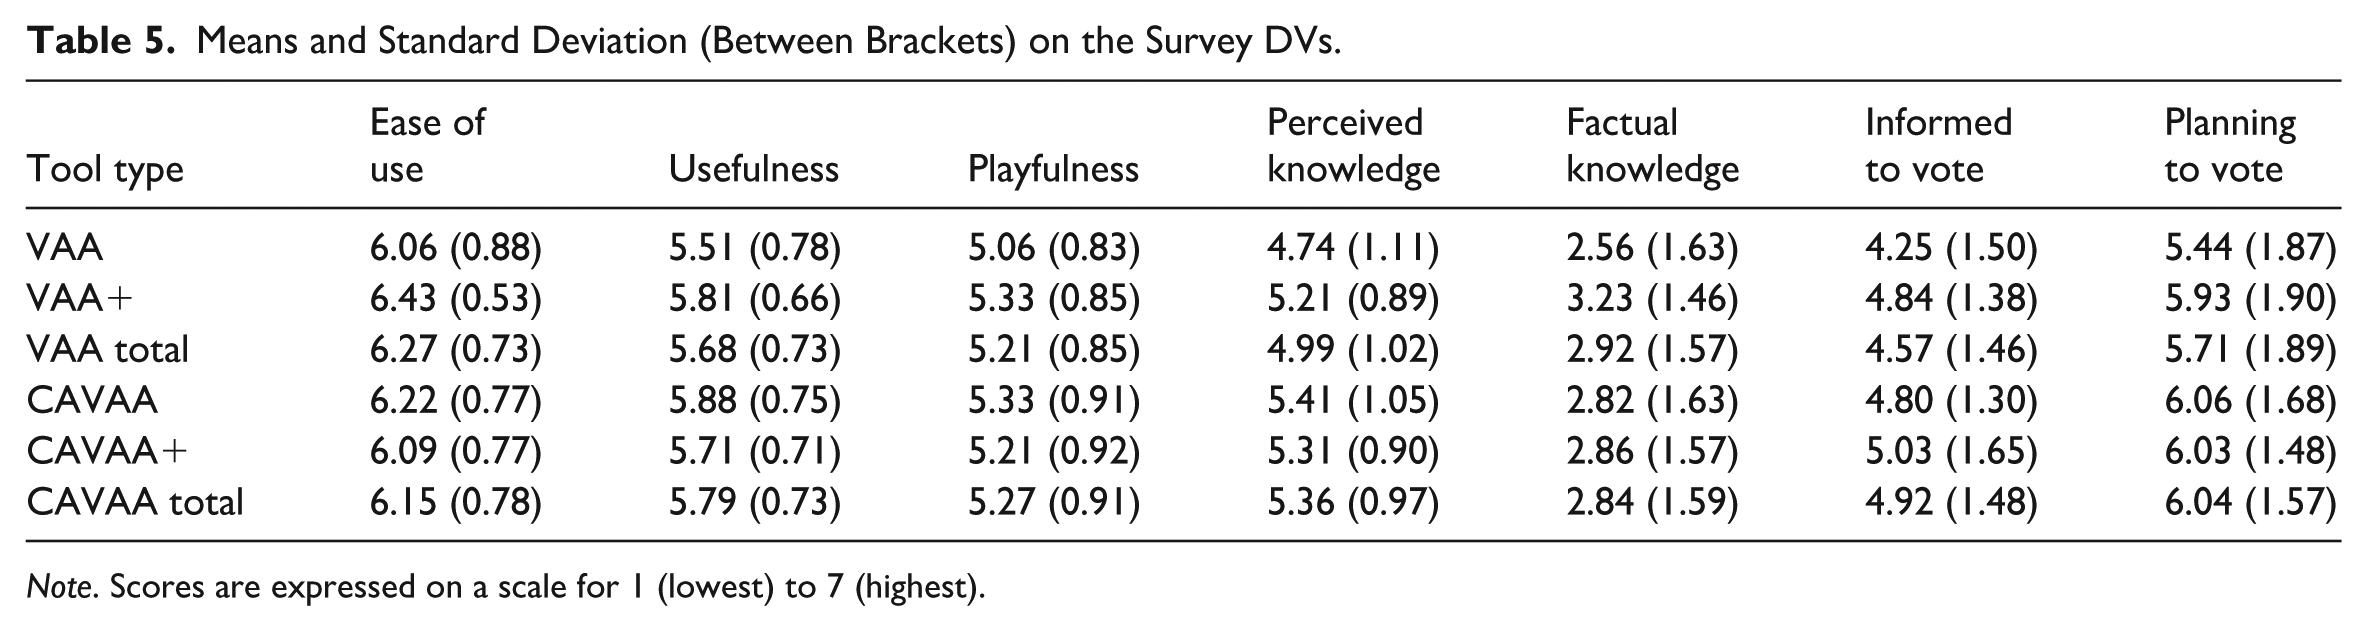
Note. Scores are expressed on a scale for 1 (lowest) to 7 (highest).
Comparable to our finding in Study 1, we observed no differences for playfulness (in all cases: F(1, 146) < 1.84, p > .18) and voting intention (in all cases: F(1, 146) < 1.54, p > .22). In addition, and in contrast to Study 1, we found no statistically significant differences between conditions for factual knowledge (in all cases: F(1, 144) < 1.93, p > .17) and the extent to which respondents feel informed to vote (in all cases: F(1, 146) < 2.90, p > .09). For the other survey measures, the following differences were observed.
For ease of use, we observed an interaction effect between the type of web-environment and tool type (F(1, 145) = 4.18, p = .04, Cohen’s d = 0.68), while the two main effects failed to reach significance (in all cases: F(1, 145) < 0.92, p > .34). Interestingly, the interaction differs from the interaction effects observed in Study 1, as the VAA and the CAVAA are equally easy to use (t(69) = 0.77, p = .45). However, when the web-environment includes buttons, the presence of a chatbot reduces the perceived ease of use (t(76) = 2.37, p = .02, Cohen’s d = 0.52). All in all, this suggests that on the smaller screen of a smartphone, the CAVAA+ also has certain disadvantages.
For usefulness there were no main effects of tool type or web-environment (F(1, 146) = 1.25, p = .27; F(1, 146) = 0.35, p = .55). However, we found a marginally significant interaction effect (F(1, 146) = 2.17, p = .05, Cohen’s d = 0.65). Consistent with Study 1, the CAVAA was rated as more useful than the VAA (t(69) = 2.01, p = .048, Cohen’s d = 0.48); the VAA+ and CAVAA+ did not differ in perceived usefulness (t(77) = 0.65, p = .52).
Concerning perceived knowledge, there was a main effect of the availability of a chatbot (F(1, 146) = 5.71, p = .02, Cohen’s d = 0.78), but the main effect of the type of web-environment and the interaction were not significant 2 (F(1, 146) = 1.27, p = .26 and F(1, 146) = 3.22, p = .08 respectively). When accessed on a smartphone the presence of a chatbot hence boosts the perceived knowledge scores. Thus, data are partly in line with H2 and H3.
Information Uptake
Clicking Behavior
Regarding users’ information uptake on a smartphone, Table 6 shows the percentage of cases in which information is requested via the buttons and in the chatbot. As for the comparison between the three information-rich conditions, and consistent with findings on desktop devices, no significant differences were observed in the frequency of semantic information requests across the VAA+, CAVAA, and CAVAA+ conditions (in all cases: χ2(1) < 2.17, p > .16). Similarly, aligning with earlier findings, both pragmatic information, and information about pros and cons were requested significantly more often in the VAA+ and CAVAA+ conditions compared to the CAVAA condition (in all cases: χ2(1) > 5.58, p < .03, Cohen’s ditems > 2.95), and also the summed proportion of information requests was higher in the conditions (in all cases: χ2(1) > 7.88, p < .01, Cohen’s ditems = 1.79). As for party stances, this type of information was requested more frequently in the VAA+ condition than in the CAVAA condition (χ2(1) = 7.05, p < .01, Cohen’s ditems > 1.86). However, the difference between the CAVAA+ and CAVAA conditions did not reach statistical significance this time (χ2(1) = 1.66, p = .32).
Percentages of How Frequently Information was Requested Via the Buttons Via the Web-Environment and/or Chatbot.
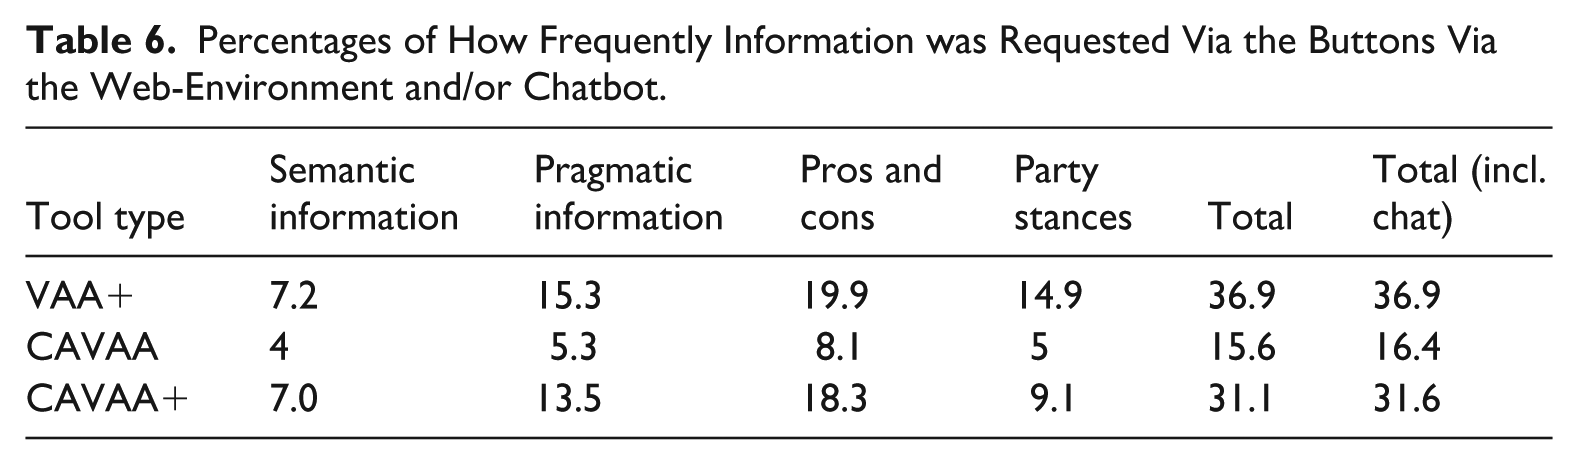
Overall, the differences between conditions closely resemble those observed on desktop devices. Interestingly, when comparing the absolute percentages in Tables 4 and 6 by eye, it appears that the ratio of requests across the four information types remains relatively consistent, while all four types are requested less frequently on a smartphone compared to desktops. This seems to suggest that on a desktop people are more likely to request additional information.
Typing Behavior
In this study on smartphones, participants used the open chat field in the chatbot 63 times with 44 unique respondent-items combinations (2.1% of all respondent-items combinations). Slightly less than half of the requested information types (n = 28; 44.4%) can be classified under the four information types the chatbot was trained on: participants most often asked questions related to semantic information (n = 13; 20.6%), followed by pro and con arguments (n = 11; 17.5%), pragmatic information about the status quo (n = 2; 3.2%), and party stances (n = 2; 3.2%). The other category contained 35 requests (55.6%). In terms of the chatbot-performance: 15 information requests were answered correctly (23.8%), and 13 times (20.6%) a preprogrammed repair strategy was used. Technological errors appeared four times (6.3%); in all other cases a misunderstanding happened (n = 31; 49.2%).
Discussion
Current study compared a basic VAA without additional information with three information-rich VAAs that either offered information within the web-environment (VAA+), via a chatbot (CAVAA), or both (CAVAA+). We hypothesized that the three information-rich versions would help users to understand the VAA statements and would also mitigate low effort processing of the statements known as satisficing behavior (Krosnick, 1991). Therefore, we expected that all enhanced VAAs would lead to fewer non-directional responses, and would positively impact information uptake, tool evaluation and political outcome measures. These hypotheses were tested in two experiments in which young voters used either one of the tools on a desktop (Study 1) or a smartphone (Study 2).
The Added Value of Information Provision Within a VAA
First and foremost, results show that information provision within a VAA is valuable, and that participants indeed actively obtain information about the political issues at stake via the tools that are enriched with information. This finding is in line with earlier research on satisficing behavior in surveys, demonstrating that the lesser effort respondents must make to access information, the more likely they are to do so (Galesic et al., 2008). The most frequently accessed information type concerned pro and con arguments and status quo information, while party stances and semantic definitions were requested less often. This is a remarkable finding since the latter two information types are already incorporated in some real-life VAAs (e.g., StemWijzer), whereas arguments and information about the status quo is oftentimes absent.
Providing information also reduces the proportion of non-directional answers to the VAA statements. Our findings are in line with H1 that users of an information-rich tool provide neutral and no-opinion answers less frequently than users of a basic VAA (Study 1). Both the addition of clickable buttons in a VAA+ and the addition of an interactive chatbot in a CAVAA reduced the proportion of non-directional answers, with the combined CAVAA+ performing best. The differences between these three information-rich types and the basic VAA without information were large, both in terms of the statistical effect size and in terms of their practical relevance (with a reduction of up to 50% of non-directional answers). As non-directional answers are an important sign of comprehension issues and satisficing behavior (Baka et al., 2012; Sturgis et al., 2014), these results suggest that providing users with accessible information within the tool mitigates comprehension challenges and satisficing behavior.
An eyeball comparison of the results on smartphones seemed to show similar effects, but no statistically significant differences between the four tool conditions appeared. In terms of percentages, however, the decrease in non-directional answers for the three information-rich versions can still be called substantive (an absolute decrease of almost 5%, which boils down to a relative decrease of 37%). An explanation for this lack of significance may be found in the relatively large between-person variance in Study 2 (where young voters worked on smartphones) in comparison to Study 1 (in which desktops were used). This suggests that users’ information uptake may vary more from person to person on a smaller screen. Alternatively, while participants in Study 1 reserved 30 min of their time to engage in a lab study, participants in Study 2 were approached on the spot which may have led to a less active usage of the available information options, resulting in a smaller reduction of non-directional answers. To further investigate this latter explanation, it would be valuable to re-run the study on smartphones under similar conditions as Study 1.
Not only did users’ response behavior point to a preference for information-rich designs, but this same trend was clearly found in the users’ perceptions as measured in a survey (partly confirming H2 and H3). While there were no differences between the four tool types in terms of playfulness or voting intention, the three information-rich versions consistently outperformed the basic VAA in perceived usefulness and perceived political knowledge. Moreover, on a desktop device, the factual knowledge and the extent to which users feel informed to vote were higher. This provides a strong indication that information-rich VAAs do not only decrease satisficing response behavior but also help VAAs to obtain their main goal of informing voters about political parties and their stances. It would be interesting to further investigate these effects using more refined measures of political knowledge (e.g., campaign interest), in line with recent VAA studies (Heinsohn et al., 2019).
Buttons or Bots?
Since tailored, on-demand explanations via a chatbot, and easily accessible but static information via a VAA+ both have their pros and cons, no hypotheses were formulated about differences between the three information-rich types. Results show that there is no unambiguous answer as to what works best. In this section, we discuss the findings that were consistent for both desktop and smartphone users.
First, regardless of the device that was used, the three information-rich types score equally high on playfulness—which is a finding that is consistent with previous work in which no differences between several CAVAA versions were found (e.g., Liebrecht et al., 2023). Thus, this also holds for information provision via buttons in a web-environment.
However, for both desktop and smartphone users, it was found that the CAVAA+ was perceived as more useful than the VAA+ and the CAVAA. This finding empathizes that what is “best” depends not only on the task and on the device but also on the user. It seems that the CAVAA+ with both a dynamic chatbot and a rich web-environment offers something for users preferring chatbots and for users preferring a more standard set-up. Users can decide for themselves how to obtain additional information. Future research should investigate when and why certain users prefer either one (or both) of the channels. Furthermore, current study focuses on highly educated young adults; for future research it is important to examine how different demographics, such as older adults or individuals with lower education levels, engage with (CA)VAAs and what types of information they find most helpful.
Our study also revealed that CAVAA+ users, when the tool was accessed on a desktop, felt more informed to vote, and they less frequently showed non-directional response behavior to the VAA statements. These findings can be related to the actual usage of the information options available. Our content analysis of the information users requested via either one of the tools showed that participants engaged with the web-environment (VAA+ and CAVAA+) more frequently than the chatbot (CAVAA), with statistically and practically significant differences in usage of the buttons. A likely explanation lies in the simplicity and familiarity of the web interface, which already included rich informational elements based on the most frequently occurring comprehension issues (Kamoen & Holleman, 2017). By contrast, the chatbot—despite its potential to offer open-ended responses—did not attract significant additional use. This raises the question as to why users did not ask more questions.
One possibility is that the effort required to manually type questions discouraged engagement, aligning with earlier studies that showed a preference for buttons in a chatbot instead of an open-ended typing function (Kamoen & Liebrecht, 2022). This suggests that a non-typing chatbot could lower this barrier and may better fit with the limited effort users of these applications are willing to spend (Kamoen & Holleman, 2017). Another explanation may be dissatisfaction with the chatbot’s limitations, as it was unable to answer all user queries. In the current study, AI was only used for intent recognition and the chatbot responses were entirely pre-programmed, with no real-time AI-generated answers. Future research could examine how incorporating greater flexibility in chatbot responses—while maintaining ethical standards—might enhance user engagement (Dieing, 2025).
Interestingly, while we observed that the buttons in the web-environment were used more frequently than in the chatbot, this was only true for three out of four information types offered—pragmatic information, pros and cons, and party stances—and not for the semantic information. Like the lay-out of StemWijzer, semantic information in our study was accessed via highlighted terms in the web interface, whereas other information types were available through explicitly labeled buttons. Post-study feedback revealed that participants often did not realize these highlighted terms were clickable, instead interpreting the highlighting as an emphasis of importance. This stresses the need for improved design and clearer visual cues. On smartphones, however, the addition of another button for semantic information may be constrained by screen size, further complicating the design challenge (Buskirk & Andrus, 2014; Huang, 2009).
Device Type
Next to comparing the dynamic conversational character of conversational agents to the static web-environment of a VAA+ on user behavior and perceptions, we also explored the role of the device on which users interact with the tool: desktops (Study 1) or smartphones (Study 2). The studies revealed different findings of the three information-rich versions and users’ levels of factual knowledge and their intention to go voting. While all information-rich types differed on these aspects compared to a basic VAA, we did not find differences between the three information-rich types for desktop users but we did, however, find a difference on these political outcome measures for smartphone users: when accessed on a smaller screen, the CAVAA+ turned out to be significantly less easy to use than both the VAA+ and the CAVAA. Given the lower scores by smartphone users, the combined version in which information was accessible via both the web-environment and the chatbot (CAVAA+) may be less easy to use when accessed on a smaller screen. This finding indicates that while on a large screen, the CAVAA+ with both a dynamic chatbot and a rich web-environment offers something for users preferring chatbots and for users preferring a more standard set-up, these options combined are considered less user friendly on a small smartphone device. Rather, the results suggest that designers should carefully manage the limited screen space available for providing additional information and include multiple information options only when screen size permits.
The type of device also influenced how participants perceived and interacted with the tools. Desktop users engaged with information-rich environments more extensively, both in terms of the number of information requests and their overall appreciation of the tools. On desktops, the CAVAA+ stood out as the most effective design, combining the strengths of clickable buttons and chatbot interactivity to deliver higher levels of perceived knowledge and factual understanding. In contrast, smartphone users rated the CAVAA+ less favorably, citing user-friendliness issues. These findings underline the challenges of adapting complex, feature-rich tools to smaller screens, where the risk of overwhelming users is higher. Moreover, they confirm and extend insights on the constraints of smartphone-oriented design (Buskirk & Andrus, 2014; Huang, 2009).
Practical Implications
From a practical standpoint, our results demonstrate the importance of incorporating additional information into VAAs. Pragmatic details, such as arguments and status quo descriptions, were highly valued by participants and frequently accessed, suggesting that they should be a standard feature in VAA designs. Providing richer information not only enhances user satisfaction but also improves response quality by reducing satisficing behavior, ultimately leading to more valid voting advice. However, the design of such tools must carefully balance richness and usability, particularly for smartphones, where simplified layouts may be more effective.
Conclusion
In conclusion, this study confirms that providing additional information in VAAs helps users overcome comprehension difficulties, but the effectiveness of information-rich designs also depends on the channel through which the information is presented and the device used. While desktops allow for more extensive engagement, smartphone users prefer a design that does not combine a chatbot with an information-rich web-environment. By addressing these challenges and tailoring tools to the needs of diverse user groups, VAAs can continue to serve as valuable resources in supporting informed political decision-making.
Footnotes
Acknowledgements
We would like to thank Elke van Veggel, Doris Verbunt, and Lotte Tiebosch for their help with collecting the data for this study.
Ethical Considerations
The Research Ethics and Data Management Committee of Tilburg School of Humanities and Digital Sciences granted permission to conduct the study (reference number: REDC2023.13b).
Consent to Participate
All participants provided written informed consent before taking part in the study.
Funding
The authors disclosed receipt of the following financial support for the research, authorship, and/or publication of this article: The development of the materials was supported by ProDemos - House for democracy and the rule of law.
Declaration of Conflicting Interests
The authors declared no potential conflicts of interest with respect to the research, authorship, and/or publication of this article.
Open Practices
Full experimental materials are available via Dataverse: https://doi.org/10.34894/RHAEJ6. For a demonstration of the CAVAA+ version, see ![]() .
.
Data were de-identified prior to sharing to protect participant confidentiality. All analyses reported in this article can be reproduced using the shared materials.