
Abstract
The Offender Assessment System (OASys) is the risk assessment and management system routinely used in the National Offender Management Service (NOMS), the prison and probation service for England and Wales. This study describes the construction and validation of a new actuarial violence risk measure, the OASys Violence Predictor (OVP), using OASys and Police National Computer data. Ordinal logistic regression identifies static and dynamic risk factors predictive of violent recidivism among convicted offenders (N = 15,918). These form the basis of a user-friendly 100-point scale (OVP). OVP achieves significantly greater predictive validity than existing actuarial scores available within NOMS (the original OASys risk prediction score; the Offender Group Reconviction Scale, Version 3; and the V scale of the Risk Matrix 2000) on a later validation sample (N = 49,346). The discussion considers explanations for this improvement, examines the utility of dynamic risk factors in violence prediction, and describes the application of OVP in the NOMS treatment allocation and risk management practice.
Empirical developments in forensic risk assessment have been pivotal in increasing the accuracy of decisions about the likely risk an offender poses to the public (Gottfredson & Moriarty, 2006) and identifying criminogenic factors for intervention (Andrews & Bonta, 2006). A range of risk assessment tools for violent reoffending is now available (Hanson, 2005; Heilbrun, Yasuhara, & Shah, 2009). However, research examining the role of dynamic risk factors (Brown, St. Amand, & Zamble, 2009; Douglas & Skeem, 2005) and proposals for new measures and approaches (Edens & Douglas, 2006; Howells, 2009; Walters, 2007) continue to be developed and debated.
Some researchers question whether it is possible to produce new, more accurate predictors of violent recidivism. According to this view, inherent unpredictability in offending behavior and the criminal justice system impose a “ceiling” on predictive validity that may now have been reached (Campbell, French, & Gendreau, 2007; Yang, Wong, & Coid, 2010). High levels of intercorrelation and content overlap are found among predictors of violent reoffending (Campbell et al., 2007; Kroner, Mills, & Reddon, 2005; Yang, Wong, et al., 2010) and actuarial predictors of sexual reoffending. In some circumstances, however, there is a strong case for the development of a new violence risk assessment instrument.
We describe the construction and validation of such a tool for the National Offender Management Service (NOMS) of England and Wales. NOMS is responsible for the supervision of offenders aged 18 and over serving sentences in custody and the community, numbering 83,500 (June 2009) and 174,000 (December 2009), respectively (Ministry of Justice, 2010a). NOMS’s primary risk/needs assessment instrument is the Offender Assessment System (OASys), a tool that has seldom been studied in forensic psychology and is described in detail in the Materials section of this article.
OASys has been broadly successful in providing an effective structure for risk assessment with which probation staff is comfortable (Mair, Burke, & Taylor, 2006). NOMS is committed to staff development and quality assurance procedures that aim to ensure that offender management practice addresses the risks and needs identified in assessments (National Probation Service, 2006). However, significant problems relating to predictive validity have been evident. The original OASys scoring system was shown to be an inadequate predictor of general reoffending (Howard, 2006) and, in subsequent unpublished analysis, violent reoffending. NOMS policy makers mandated that the scoring system should be revised, with particular attention paid to the prediction of harmful recidivism.
Valid prediction of harmful recidivism is necessary to assess future risks correctly when reporting to courts (National Probation Service, 2009) and the Parole Board (HM Prison Service, 2009), determining intensity of probation supervision (National Probation Service, 2008), and allocating places in offending behavior programs (Palmer et al., 2009). Instruments specifically designed to assess the risk of violent recidivism, including Historical, Clinical, Risk Management-20 (HCR-20) (Webster, Douglas, Eaves, & Hart, 1997) and Violence Risk Appraisal Guide (VRAG) (Quinsey, Harris, Rice, & Cormier, 1998), are already used to assess some offenders in the NOMS caseload, such as those serving lengthy prison sentences. However, NOMS policy makers determined that the additional time required to complete these assessments precluded their general introduction, given the large caseloads handled by NOMS staff (Ministry of Justice, 2010a) and intensifying budgetary pressures (HM Treasury, 2010). The only practical options for widespread violence risk prediction in the NOMS caseload would be the use of rapidly scored static actuarial tools—Offender Group Reconviction Scale, Version 3 (OGRS3; Howard, Francis, Soothill, & Humphries, 2009) or the V scale of Risk Matrix 2000 (RM2000/V; Thornton, et al. 2003), described below—or the development of a predictor within OASys, as its continued use by NOMS is certain for the foreseeable future. The decision was therefore made within NOMS that an OASys-based violence predictor should be developed. Its predictive validity could then be compared with the original OASys score, OGRS3, and RM2000/V, and a decision made on whether to implement it as a revision to the operational OASys.
The existing literature offered some evidence for the likely success of an OASys-based predictor. First, scales from assessment tools designed on risk/needs principles can predict violence well. For example, Campbell et al. (2007) and Yang, Wong, et al. (2010) found that Level of Service Inventory-Revised (LSI-R) (Andrews & Bonta, 1995) had similar validity to several other tools. Campbell et al. also found very large effect sizes for Level of Service/Case Management Inventory (LS/CMI) (Andrews, Bonta, & Wormith, 2004) in a small number of studies. Second, this study develops a predictor using a mixture of OASys items, many of which are scored through structured professional judgment (SPJ), and static actuarial items such as age and criminal history. Douglas, Yeomans, and Boer (2005) found that HCR-20’s SPJ ratings and VRAG’s static actuarial risk bins made independent contributions to predictive validity.
Development of a NOMS Predictor of Violent Offending
The new predictor, named the OASys Violence Predictor (OVP), is intended to be easy to use while rigorously combining static and dynamic risk factors. It must support key NOMS requirements by being quick and simple enough to use as part of its day-to-day processes such as case prioritization and intervention targeting, reflecting changes in risk over the course of a sentence, and upholding its public protection objective (National Probation Service, 2006).
Pressures on the time spent assessing and managing each offender make it imperative that changes to OASys do not increase its complexity. OVP’s criminal history items should be simple enough to be calculated reliably by the auxiliary staff who often complete the OASys static risk components. The scoring system should allow offender managers to understand the association between an individual offender’s risk factors and his or her OVP score. OASys users were consulted to ensure that OVP fulfilled these practical requirements, as described later.
As OASys assessments are administered repeatedly over the course of a sentence, offenders’ scores include dynamic risk factors that will change over time. The potential for significant change improves the value of OVP in processes that typically occur late in the sentence, including parole hearings and evaluation of progress on interventions designed to address offending behavior. The integrity and defensibility of the parole process requires that risk assessment instruments used must use offenders’ individual characteristics at the time of the parole hearing, maximize predictive validity, identify risk of recidivism at different time points, be relevant to male and female offenders, and enable assessors to determine the risk of onset and persistence of violent offending.
NOMS’s public protection objective requires the identification of offenders likely to commit violent offenses that cause the most serious harm. As the sexual recidivism risk of all known sex offenders is already assessed using Risk Matrix 2000/S (Thornton, et al. 2003) and, after treatment, the Structured Assessment of Risk and Need (Thornton, 2002), OVP focuses on valid estimation of serious nonsexual violent reoffending risk.
Method
Measures
Offender Assessment System
The OASys (Home Office, 2006) is a structured clinical risk/needs assessment and management tool constructed on risk/need/responsivity principles. It is used throughout NOMS. Before sentence, it is used to inform court reports on convicted offenders. Later, it is used to help manage offenders serving custodial sentences of at least 12 months (which are usually partially served in the community) or community sentences involving supervision. Assessments are reviewed periodically over the course of the sentence. In 2008-2009, approximately 830,000 assessments were completed on 360,000 offenders by 12,000 staff. All staff are trained in offending behavior theories, assessment-related skills (e.g., interviewing offenders, clinical case formulation), and the use of OASys itself. All assessments are countersigned by a more senior officer, and samples of assessments are scrutinized more thoroughly in quality assurance exercises. OASys has strongly influenced the design of the offender assessment systems of several other European countries (van Kalmthout & Durnescu, 2008).
OASys consists of four main components: an analysis of offending-related factors, a risk of serious harm analysis (RoSH), a summary sheet, and a sentence plan. The offending-related factors component includes 13 sections covering criminal history, analysis of (current) offenses, assessment of 10 dynamic risk factors (this study’s dynamic factors; see Table 2 later in this article), and suitability to undertake sentence-related activities (e.g., unpaid work, offending behavior programs). Each dynamic risk factor is assessed using between 4 and 10 questions, each scored on a 0/2 or 0/1/2 basis. The RoSH component provides a structure for clinical case formulation and a Risk Management Plan for offenders considered likely to commit harmful acts in the future. The summary sheet component automatically scores predictors of recidivism using IT functionality.
Before the implementation of OVP, the summary sheet calculated a total OASys score. This combined scores from each of the offending-related factors, with item weights set by OASys’s original designers before reconviction studies had been conducted. Howard (2006) showed that the OASys score had only moderate predictive validity. The summary sheet now instead presents scores on OVP and the complementary OASys General reoffending Predictor (OGP), a predictor of nonviolent reoffending described in Howard (2009). OVP scores are also presented to assessors during the RoSH. The Sentence Plan assesses responsivity factors, which are then combined with the dynamic risk factors and RoSH to determine case management strategies and interventions. These should fulfill sentence requirements, manage the offender’s risk of serious harm, and reduce the likelihood of reoffending. Violent reoffending is therefore the focus of many Risk Management and Sentence Plans, as well as reports provided to decision makers such as sentencers and the Parole Board. Despite this, until the implementation of OVP, OASys did not specifically assess offenders’ risk of future violent offending.
Moore (2009) examined the internal reliability and construct validity of the 10 dynamic risk factor sections and the criminal history section. Eight of these sections were described by single factors, but 3 split into two factors each, and a further violence factor emerged. Morton (2009) produced promising but methodologically weak interrater reliability results. Howard and Moore (2009) compared item and section (risk factor) scores over series of assessments during community supervision periods of up to 2 years. They found that many of OASys’s risk factors are dynamic in several key respects. Most item scores changed between 5% and 20% of original–final assessment pairs. Only 30% of such assessment pairs included no changes in any dynamic item score, and changes in section scores between first and second assessments were predictive of recidivism at third assessment.
The Offender Group Reconviction Scale
OGRS is used slightly more frequently than OASys, as it is also used for oral court eports and nonrehabilitative sentences such as Community Orders involving unpaid work. It is a purely actuarial calculation of the probability of proven reoffending for most recordable offenses, combining criminal history and demographic variables in a logistic function. It has been periodically revised and recalibrated, and version 3 (OGRS3; Howard et al., 2009) has recently been introduced. OGRS achieved a weighted, adjusted area under curve (AUC) of .71 from two violence prediction studies in Yang, Wong, et al.’s (2010) meta-analysis.
Risk Matrix 2000/V
RM2000 (Thornton, et al. 2003) is an actuarial predictor of the likelihoods of reconviction for sexual offenses (S scale), nonsexual violent offenses (V scale), and either of these offense groups (C scale). Although it was constructed to predict for adult male sex offenders, the V scale has been successfully validated on a sample of prisoners without histories of sexual offending (Thornton, et al. 2003). It is scored from three factors: age, violent appearances, and having any convictions for burglary. This yields a score from 0 to 8, which is banded into four risk categories. RM2000/V has seldom been included in validation studies not exclusively focused on sex offenders, but obtained a weighted, adjusted AUC of .69 from three studies in Yang, Wong, et al.’s (2010) meta-analysis.
Previous sanctions and proven reoffending
Previous sanctions for an offense group are the number of formal criminal sanctions (convictions, cautions, reprimands, and final warnings) the offender received for that offense group up to and including the index sanction. Proven reoffending comprises offenses committed within 24 months of the date of community sentence or release from custody, leading to formal criminal sanction no more than 12 months after the end of this follow-up period.
Proven violent reoffending is classified in OVP as any proven reoffending involving offense(s) of homicide and assault, threats and harassment, violent acquisitive offenses (robbery and aggravated burglary), public order, criminal damage, and/or weapon possession. These offenses are coded from lists maintained by the UK Home Office. Howard and Dixon (2011a) examined patterns of index offense content and dynamic risk factors in 230,000 OASys assessments, and associations between previous violent sanctions, dynamic risk factors, and recidivism in the present study’s 2002-2004 data sample. They determined that this classification of violent offending was likely to aid prediction of future homicide and assault, including a subset of the most serious offenses named homicide and wounding (i.e., murder, attempted murder, nonvehicular manslaughter, and grievous bodily harm with intent). Contact sexual offenses were excluded from this violent offense classification as they were shown to be unlikely to aid such prediction. To reiterate Howard and Dixon’s point, this does not imply that sexual offenses are not harmful. OVP uses this classification to determine which offenses count as previous violent and nonviolent sanctions, and which count as proven violent reoffending. The validation comparisons checked predictions of violent but also homicide/assault and homicide/wounding proven reoffending outcomes. These additional checks ensure that OVP does improve prediction of these more serious subsets of offenses.
Procedure
The Police National Computer (PNC) research database
The PNC is the operational system used by all 42 police forces in England and Wales. It records details of suspected and proven offenders, as well as details of crimes solved and under investigation. The Ministry of Justice’s PNC research database (MoJPNC) contains extracts of PNC criminal records data on cautioned and convicted offenders. It is available to researchers through the Ministry of Justice’s Analysis and Statistics group and is the source of data on previous sanctions and proven reoffending.
The OASys research database
Completed assessments are copied to the OASys Data Evaluation and Analysis Team (O-DEAT), a research and statistics office within NOMS headquarters. Data completeness and integrity checks are undertaken before producing subsets for analysis.
Participants
Offenders
Two sets of OASys assessments were used. Assessments completed between January 2002 and September 2004 were used to construct the logistic regression model and develop OVP’s scoring system. Assessments completed between October 2004 and September 2005 were accessed after OVP’s content was finalized and were used as a formal validation sample.
All OASys assessments of offenders subject to Pre-Sentence Reports, commencing community sentences, or supervision upon release from custody were obtained from the O-DEAT database. At this point, the 2002-2004 data set contained 198,103 assessments, and the 2004-2005 dataset contained 172,146 assessments. The assessments were systematically filtered to ensure complete data on dynamic risk factors and key matching variables, and to remove duplication of assessments relating to the same offender and sentence. Missing sentence details caused heavy attrition, especially in the 2002-2004 period before improvements in data linkage between OASys IT and case management systems. Selection bias related to geographical area rather than offender characteristics such as age, gender, criminal history, or dynamic risk. The remaining assessments were matched with the MoJPNC database on age, sex, and index offense conviction date. Those successfully matched on age, sex, and index offense conviction date were traced back from the conviction date to ascertain criminal history and traced forward from the sentence/release date to ascertain proven reoffending rates. The matched 2002-2004 data set comprised 15,918 assessments, and the matched 2004-2005 data set comprised 49,346 assessments. (A further 10,701 assessments from the 2002-2004 data set were initially used as a validation sample to meet NOMS’s need for timely provisional results. These results are reported in Howard, 2009, and are not reported here.) The 2002-2004 data set had a mean age of 29.7 years (SD = 9.9 years) and included 14% female offenders, 7% of non-White ethnicity and a further 7% of unknown ethnicity. Thirty-four percent had an index offense included in OVP’s classification of violent offenses (Howard & Dixon, 2011a). The 2004-2005 data set had a mean age of 30.2 years (SD = 10.1 years) and included 13% female offenders, 8% of non-White ethnicity and a further 9% of unknown ethnicity, and 35% with an OVP-class index offense.
OASys users
Senior and main grade probation officers in 4 of NOMS’s 42 probation areas participated in two pilot exercises during the development of OVP. Each officer scored OVP on several OASys-assessed offenders under their supervision. They later completed a questionnaire and/or participated in a focus group seeking their views on OVP’s scoring system and its utility in their assessment and case management practice. A central steering group met before and after each pilot and at key points in the subsequent implementation process. Its membership included managers from the pilot areas, policy makers, information technology managers, and researchers from NOMS headquarters, and representatives of associated government agencies (e.g., the Parole Board).
Analysis
Overview
Analysis was conducted in four steps to construct and validate OVP in accordance with NOMS’s three key requirements. First, an ordinal logistic regression model was fitted to the 2002-2004 construction data set, predicting proven violent reoffending using static and dynamic risk factors. Second, the results of this model were manipulated to create simplified scoring systems. Each significant risk factor became a component of a weighted 100-point scale; a further 100-point scale with rounded factor weights and a unit-weighted scale were also created. The predictive validity of the original model and these three new scales were calculated for the 2004-2005 validation data set. These results were combined with feedback from OASys users, enabling a decision on which of the four scoring options achieves the best balance of predictive validity and user friendliness. The process of generating predicted reoffending probabilities for fixed follow-up durations from the selected rounded 100-point scale (the OVP score) is described. Third, the predictive validities of OVP, the OASys score, OGRS, and RM2000/V were compared, using the validation sample, to signal whether OVP produced any worthwhile improvement in predictive validity. OGRS and RM2000/V are NOMS’s only realistic alternatives to OVP. These actuarial tools satisfy the simplicity requirement but are not dynamic. Fourth, the predictive validity of OVP for key subgroups—male and female offenders, and those with and without a history of violent offending—was checked using the validation sample.
Ordinal logistic regression modeling
An ordinal logistic regression model was fitted on the 2002-2004 construction sample (N = 15,918). Ordinal logistic regression models produce predicted probabilities in a similar way to standard (binary) logistic regression models but allow multiple outcomes that can be meaningfully ordered: in this instance, ranging from very rapid recidivism to less rapid recidivism to no recidivism. The dependent variable had 25 outcome categories: proven violent reoffending within 1, 2, . . ., 24 months, and no proven violent reoffending within a 24-month follow-up period. The model was fitted by a forward stepwise procedure with p = .05.
Four static risk factors were initially included: the number of previous sanctions for violent and nonviolent offenses (including the index offense), age, and gender. Age and previous sanction groups were created by successively dividing the distributions into increasing numbers of groups until further divisions failed to improve model fit or irregular patterns suggested a danger of overfitting the model. A fifth, binary, static variable for any previous (known) criminal history status was created to reflect the substantially lower odds of proven reoffending of those with no known criminal history before the index offense.
The 32 dynamic factors were included: the 10 OASys section scores, Moore’s (2009) within-section and violence factors, and other OASys questions that were not previously scored, including binary indicators of characteristics of the current offense, domestic violence perpetration, and mental health problems. Some scales were disaggregated, following the observation by Mills et al. (2007) that the inclusion of individual items with limited associations with reoffending can damage model performance. To avoid overfitting, interactions were only modeled where a strong theoretical case for their existence was presented; none of these interactions proved significant, and they are not discussed further. Correlations between risk factors in the selected model confirmed that multicollinearity was absent. The ratio of events (i.e., reoffenders) to risk factors considered for model inclusion exceeded 40, whereas Harrell, Lee, and Mark (1996) recommend a ratio of at least 10 and preferably over 20 to achieve adequate statistical power.
Simplification of the model to a 100-point scale
To transform the logistic regression parameters into scores out of 100, the minimum and maximum possible scores based on the logistic regression parameters results were calculated. The range on each risk factor was expressed as hundredths of the overall range between the minimum and maximum. For example, the overall range of logistic regression parameters was 8.33 (from –3.14 to 5.19) and the range for accommodation was 0.17. Therefore, 2 points (100*0.17/8.33) were available for accommodation. Some small changes to these scores were necessary to overcome rounding effects and obtain a total of 100. Constant terms for a range of possible follow-up periods were then estimated by re-entering the score into a further ordinal logistic regression model with 25 outcome categories, as in the previous step.
This scale was tested by OASys users in the first pilot. These staff criticized the resulting uneven distribution of item weights as unwieldy. Also, the low total weight of dynamic factors (26 of the 100 points) undermined the user requirement that the score should reflect an individual’s progress over the course of their sentence. To deal with these two problems, a revision simplified the weighting system. Static factors were weighted at multiples of 5 and dynamic factors at multiples of 2, which rounded the weights considerably without causing too much disruption to the original model. Moreover, multiples of 2 suit OASys dynamic items well, given that these are scored 0/1/2 or 0/2. The total weight for dynamic factors was raised from 26 to 40. (Simplified algorithms can replace regression results when combining scales into easily usable overall scores; Steyerberg, 2009.) OASys users who trialed this version of the scoring system in the second pilot found it much easier to comprehend. A still simpler unit-weighted version was also created, reducing all risk factor weights to 0/1/2 or 0/2. A robust nonparametric test for correlated measures (DeLong, DeLong, & Clarke-Pearson, 1988) was used to compare AUC predictive validity statistics for the original logistic regression model, original and revised 100-point score, unit-weighted score, and the 60-point static and 40-point dynamic subscales of the revised score, for the validation sample (N = 49,346) in SAS software version 9.2. Associations between the four scoring algorithms were measured with Spearman’s rank correlation to understand any differences in (rank-based) AUC statistics.
The revised 100-point scale was selected as the OVP score (see the Results). Feedback from both pilots confirmed that users understood the distinction between the 100-point score and the 12- and 24-month probabilities, which are now routinely and automatically calculated on OASys summary sheets. (Predictions for the other 22 follow-up periods may be incorporated into parole procedures.) Examples are presented of predicted 24-month rates of violent reoffending and also homicide/assault and homicide/wounding reoffending, produced using a similar model, across a range of OVP scores. The OVP scores of violent reoffenders and non-reoffenders are illustrated.
Comparisons with other general and violence risk assessment tools
The OGRS3 and RM2000/V scores were calculated from PNC data. The total OASys score was already included in the OASys assessments. RM2000/V is presented both in its usual categorized form, which takes four values between low and very high, and in the 9-point uncategorized score to check whether any differences in predictive validity between OVP and RM2000/V are primarily due to the restricted range of the categorized version of RM2000/V. The static and dynamic subscales of OVP are also presented.
Using the validation sample, AUC scores were produced for three 24-month proven reoffending outcomes: any violent offense, homicide/assault offenses, and homicide/wounding. The DeLong et al. (1988) test for significance of differences between AUCs determined whether the OVP score improved upon the predictive validity of the other tools for each of the three outcomes.
To illustrate the practical effects of such improvements in predictive validity, the distribution of OVP was equalized onto that of RM2000/V—the most predictive of the other tools—to eliminate OVP’s longer range and thus permit fair comparison. In addition to AUCs, sensitivity and specificity statistics were calculated to contrast actual and predicted reoffending when RM2000/V categories were used as the basis of three possible decision thresholds. (Similarly, OVP scores are reported as low, medium, high, or very high within the OASys summary sheet and RoSH.) When presenting these results, the size of the validation data set was standardized to 10,000 for ease of comparison and generalization.
Comparisons of offender subgroups
AUCs were calculated to check the predictive validity of the OVP score for four subgroups of offenders: females, males, those with no known history of violent offending, and those with known history of such offending.
Results
Ordinal Logistic Rregression Modeling
Table 1 shows the initial logistic regression model of proven violent reoffending. It selects five static risk items and seven dynamic risk items. The static risk factors selected include gender, a 10-point categorization of age, a 9-point categorization of violent criminal history, and a 4-point categorization of nonviolent criminal history. Further discrimination between offenders with limited criminal careers is achieved through the “any previous criminal history” item. The dynamic risk factors selected include two socioeconomic scales, alcohol misuse, two items related to mental health and cognition, one item on attitudes toward the current offense, and one scale relating to attitudes toward crime, society, and reoffending. OASys dynamic risk sections that did not contribute to the selected model were financial management and income, relationships, lifestyle and associates, and drug misuse.
Logistic Regression Model of Proven Violent Reoffending Within 12 and 24 Months (N = 15,918)
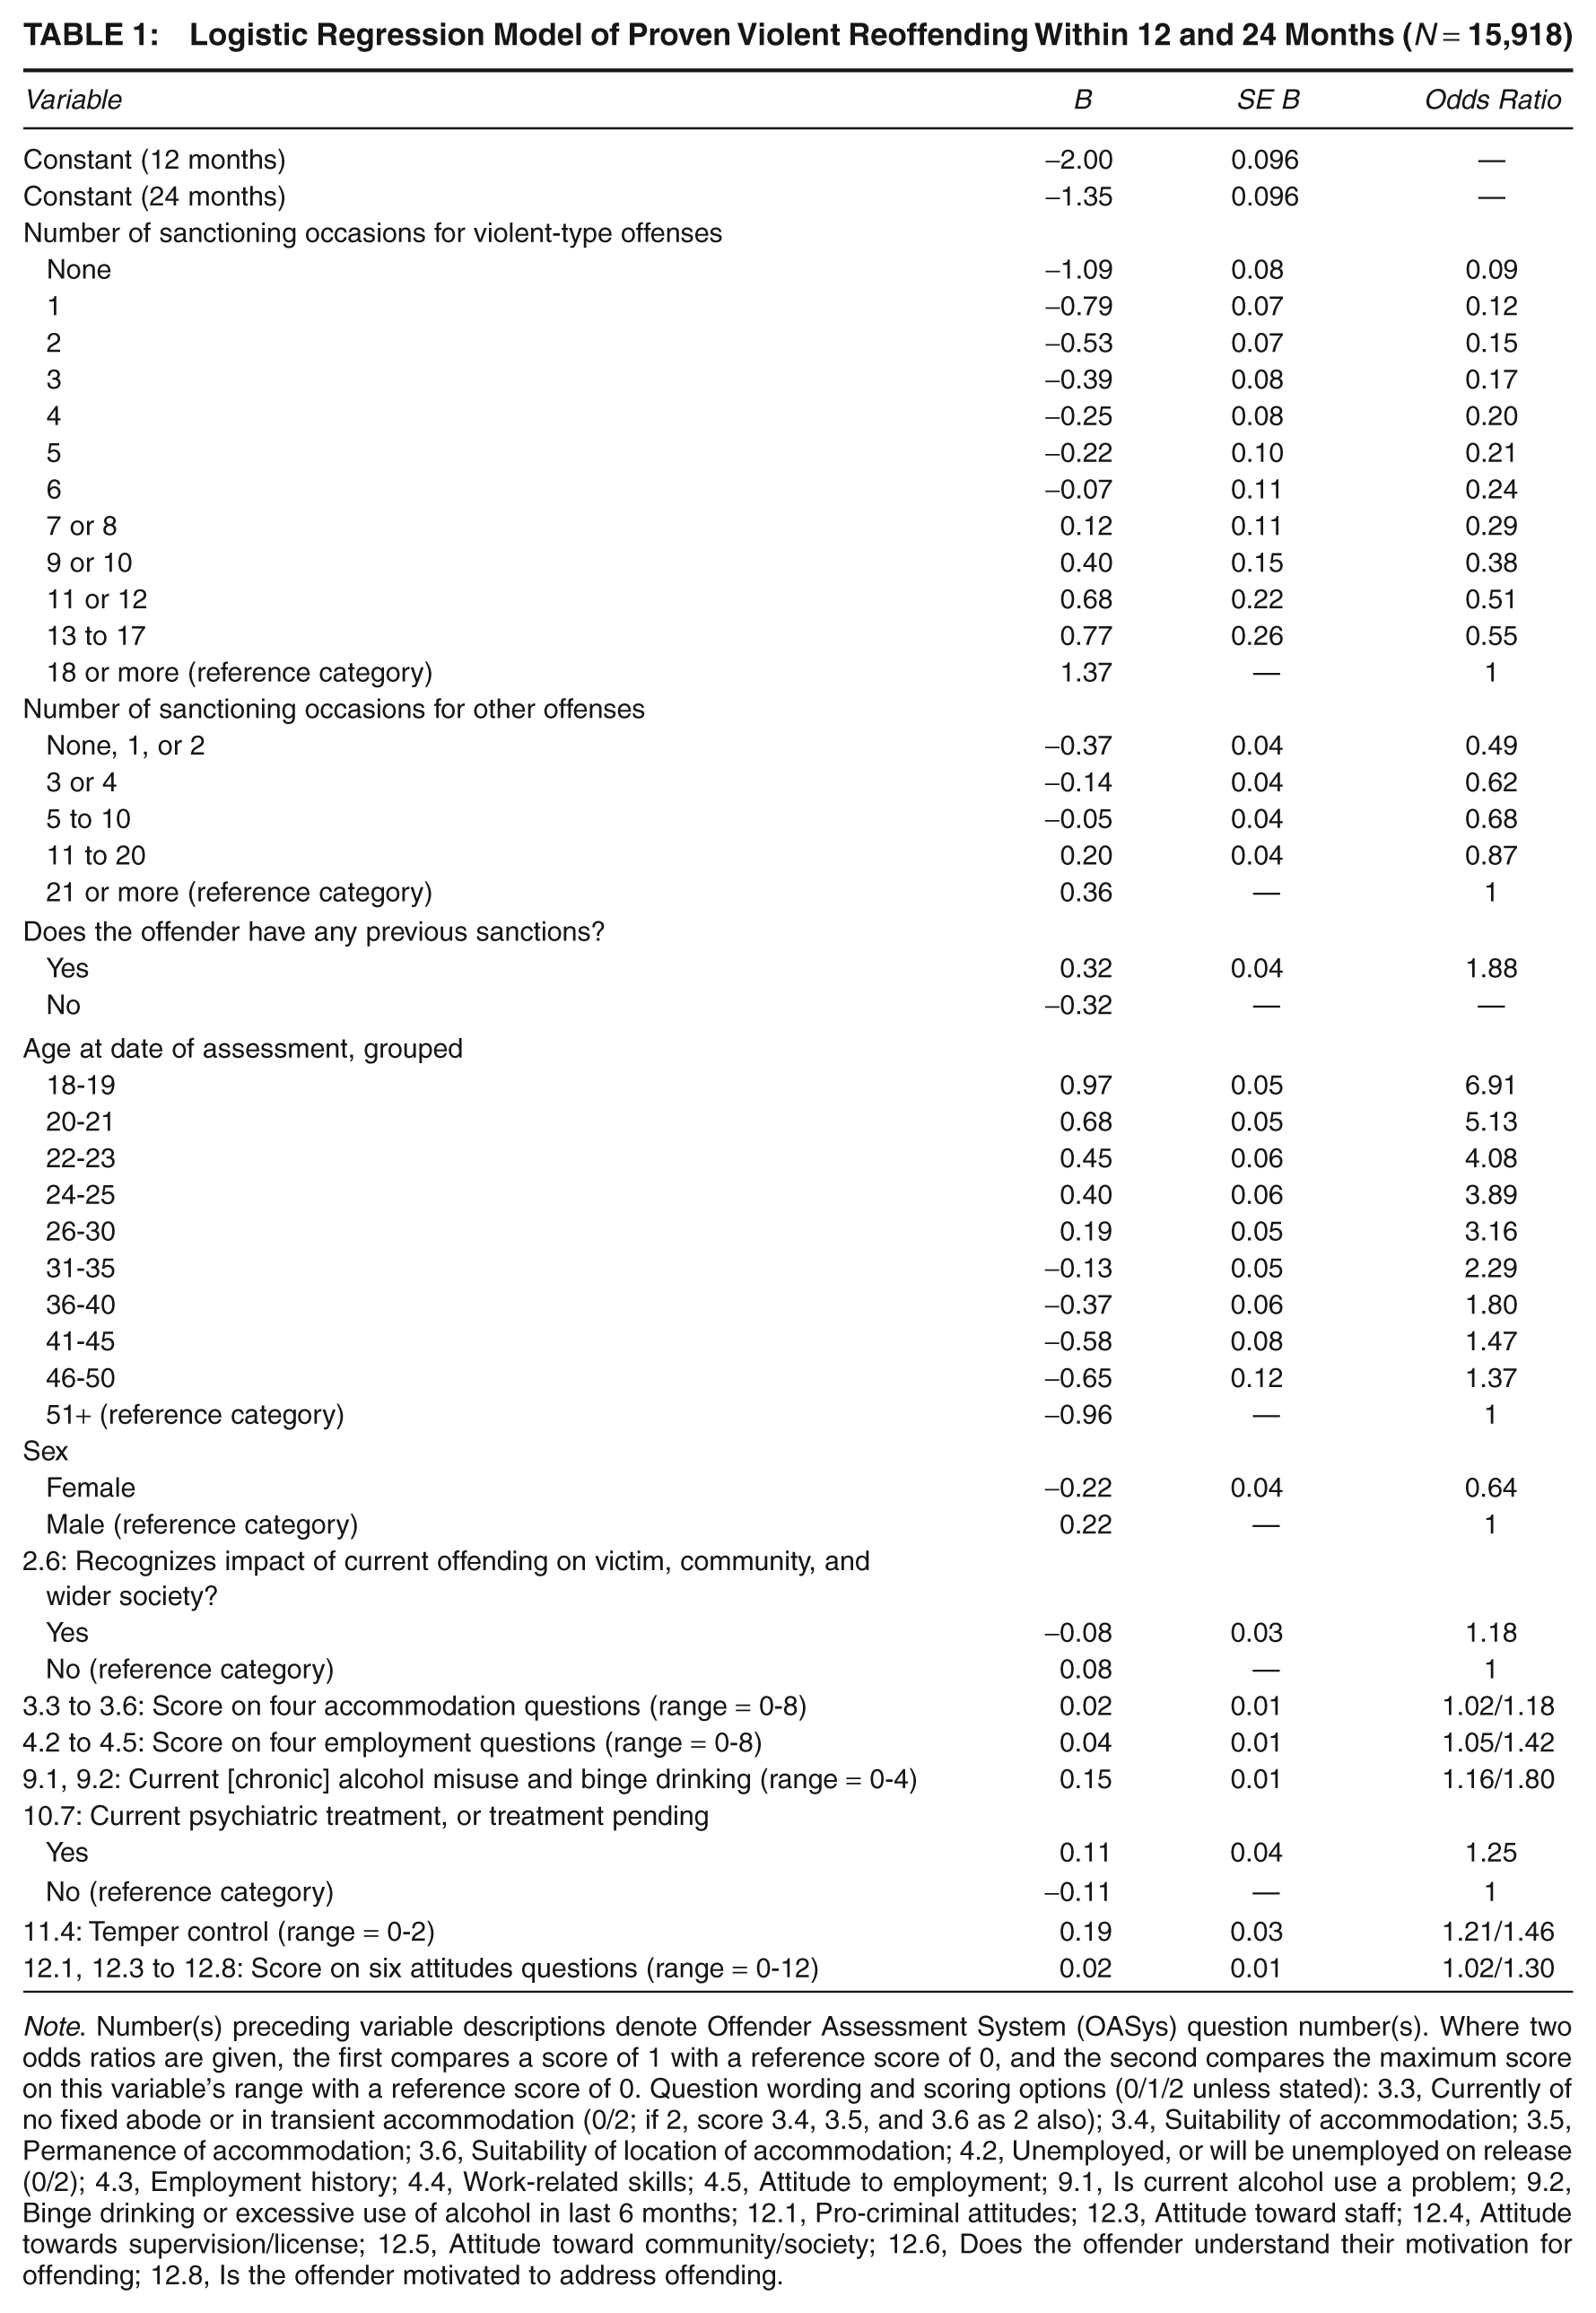
Note. Number(s) preceding variable descriptions denote Offender Assessment System (OASys) question number(s). Where two odds ratios are given, the first compares a score of 1 with a reference score of 0, and the second compares the maximum score on this variable’s range with a reference score of 0. Question wording and scoring options (0/1/2 unless stated): 3.3, Currently of no fixed abode or in transient accommodation (0/2; if 2, score 3.4, 3.5, and 3.6 as 2 also); 3.4, Suitability of accommodation; 3.5, Permanence of accommodation; 3.6, Suitability of location of accommodation; 4.2, Unemployed, or will be unemployed on release (0/2); 4.3, Employment history; 4.4, Work-related skills; 4.5, Attitude to employment; 9.1, Is current alcohol use a problem; 9.2, Binge drinking or excessive use of alcohol in last 6 months; 12.1, Pro-criminal attitudes; 12.3, Attitude toward staff; 12.4, Attitude towards supervision/license; 12.5, Attitude toward community/society; 12.6, Does the offender understand their motivation for offending; 12.8, Is the offender motivated to address offending.
Simplification of the Model to a 100-Point Scale
Table 2 displays the minima, maxima, and ranges of each coefficient of the logistic regression model; the transformation of these ranges into scores on the original 100-point scale; and the revised 100-point and unit-weighted scales. Table 3 gives further details of the scoring of the revised 100-point scale. In both 100-point scales, previous violent sanctions and age carried the highest weights, while alcohol misuse was the highest weighted dynamic factor. Some disproportionate changes occurred due to the simplification of weights and the transference of 14 points from static to dynamic risk factors for the revised scale. The weights for nonviolent sanctions and the “any previous criminal history” item were reduced sharply, while the weights for recognizing the impact of offending and accommodation were doubled.
Scaling and Adjustment of Logistic Regression Results to Produce Three Simplified Scores
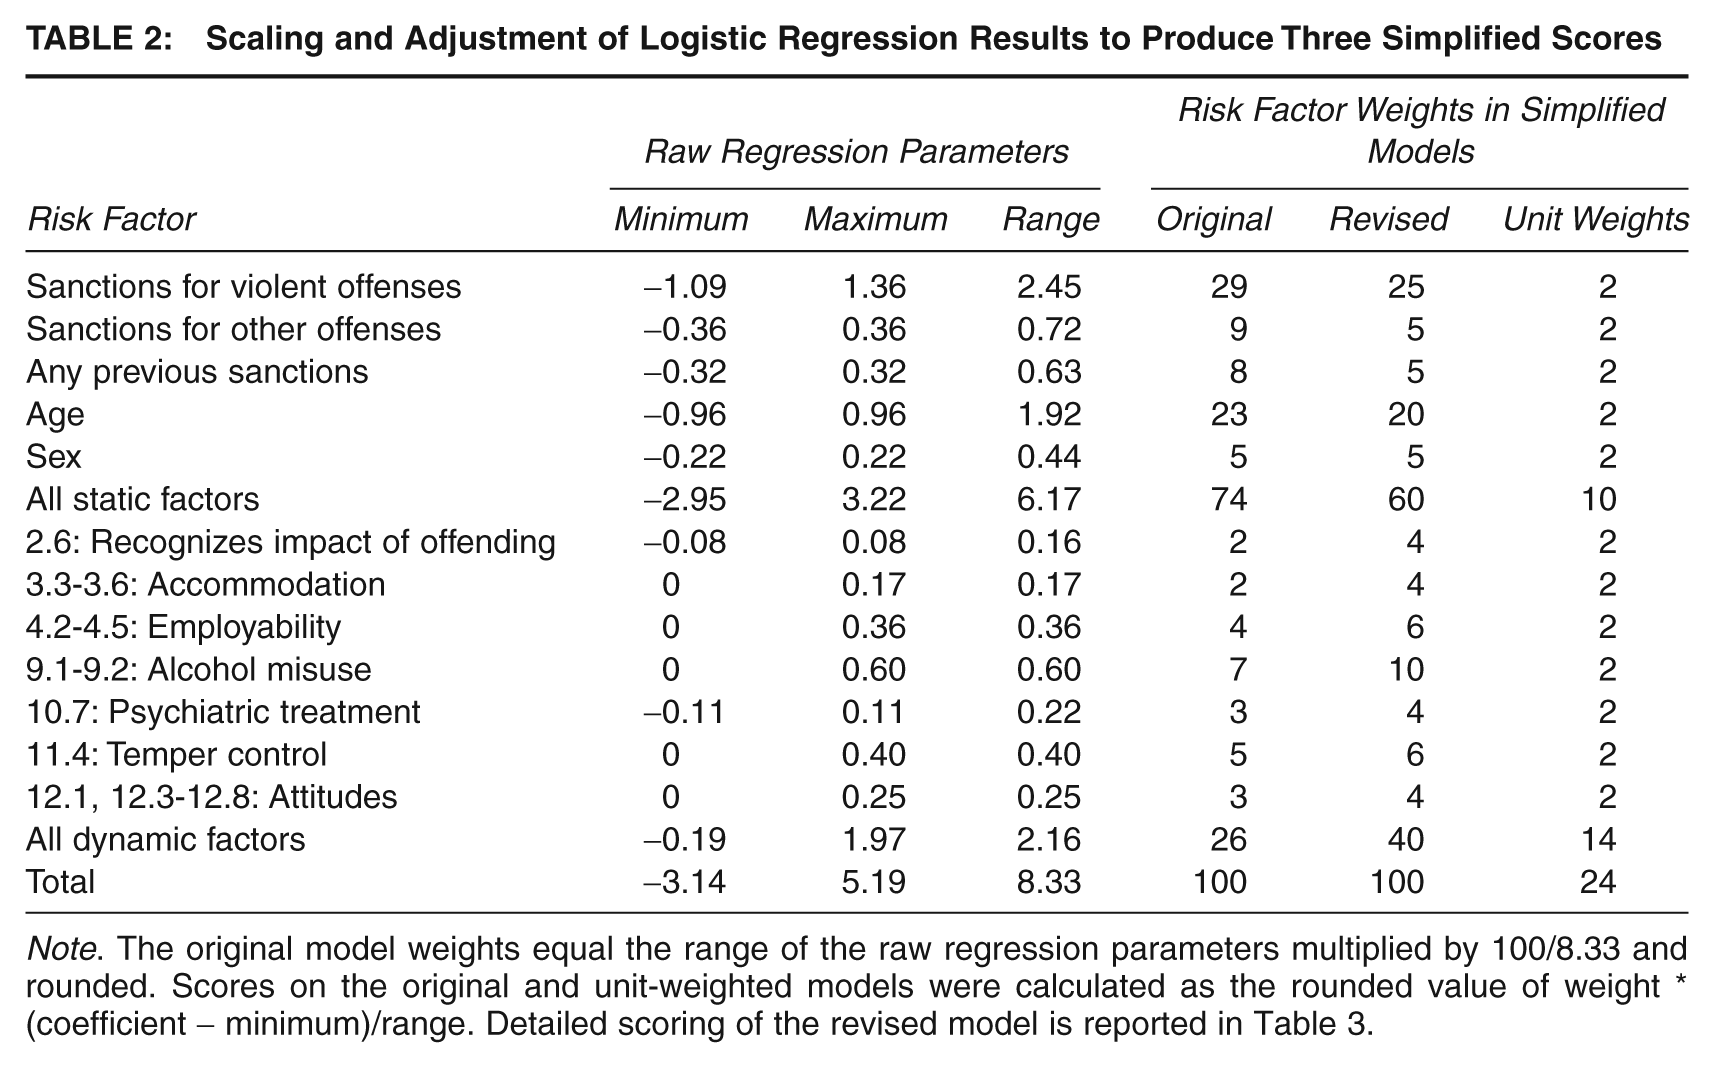
Note. The original model weights equal the range of the raw regression parameters multiplied by 100/8.33 and rounded. Scores on the original and unit-weighted models were calculated as the rounded value of weight * (coefficient − minimum)/range. Detailed scoring of the revised model is reported in Table 3.
Scoring of OVP From Static and Dynamic Risk Factors

Note. An accommodation score of 7 is not possible, as Question 3.3 can only be scored 0 or 2, and if it is scored 2 then Questions 3.4, 3.5, and 3.6 are also scored 2. OVP = OASys Violence Predictor.
Predicted probability = e(z)/1 + e(z), where z = –4.522 + (0.0722 * score) [12 months] or z = –3.877 + (0.0722 * score) [24 months].
Table 4 shows that validation sample AUCs for the logistic regression model and the two 100-point scales differed with neither clinical nor statistical significance for homicide/wounding reoffending. Comparisons of the logistic regression model with the revised score were statistically significant for both homicide/assault (χ2 = 6.14, p = .013) and all violent reoffending (χ2 = 37.80, p < .001), but the AUC differences remained no greater than .003 and thus had little clinical significance. The unit weighting produced a considerably lower AUC for all three outcome measures. Spearman’s correlations between the logistic regression scores and other scores were .99 (original 100-point), .98 (revised 100-point), and .88 (unit-weighted). This shows that the original and revised 100-point scales had minimal effects on the rank orders of offenders’ scores and thus on AUCs, whereas applying unit weighting had an appreciable effect. On the basis of these results and the views of OASys users, the revised 100-point scale was selected (OVP).
Predictive Validity of Raw Logistic Regression Parameters and Three Simplified Scores (N = 49,346)
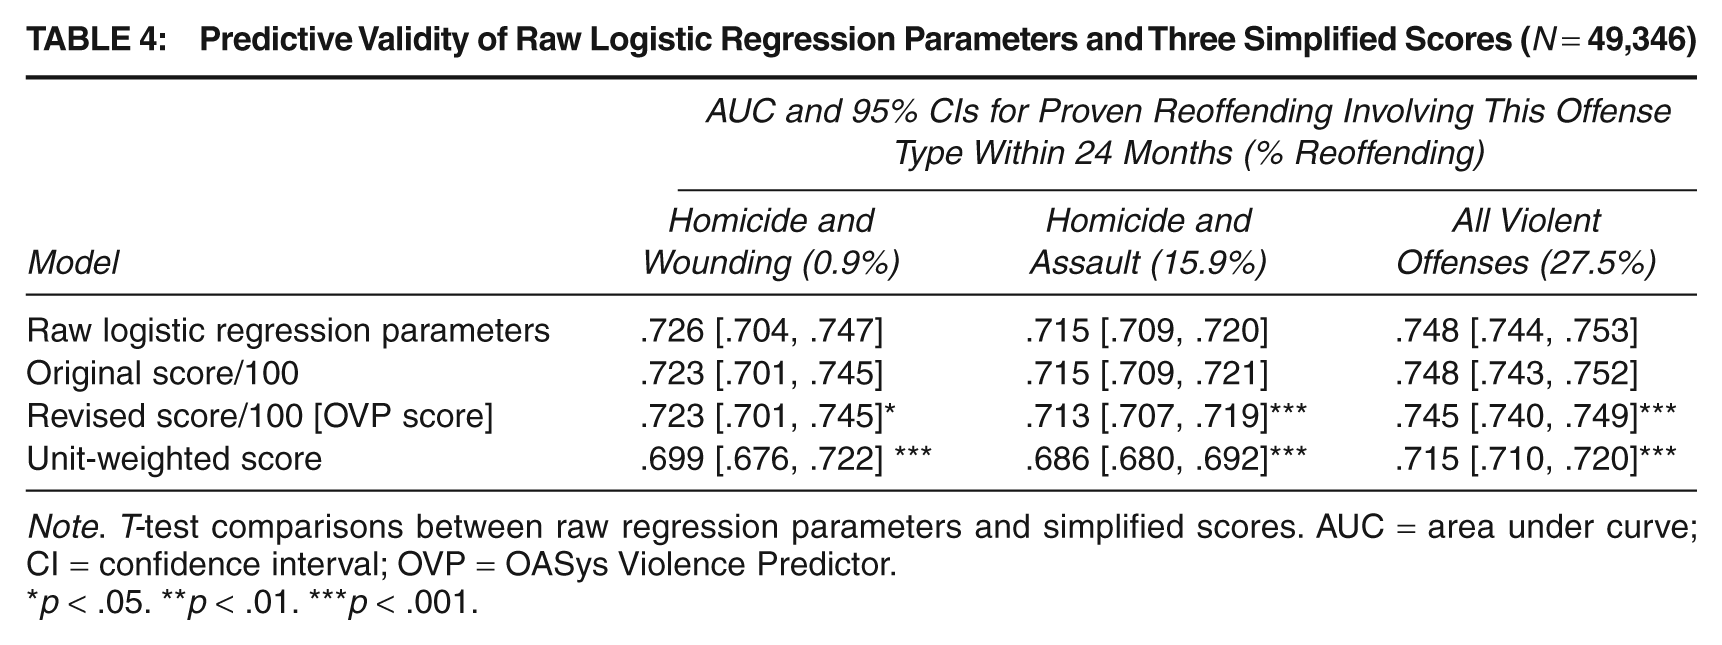
Note. T-test comparisons between raw regression parameters and simplified scores. AUC = area under curve; CI = confidence interval; OVP = OASys Violence Predictor.
p < .05. **p < .01. ***p < .001.
Table 5 presents predicted 24-month proven reoffending probabilities for a range of OVP scores, covering homicide/wounding, homicide/assault, and all violent reoffenses. The fitted probabilities for homicide/wounding indicate the concentration of this outcome among those with the highest OVP scores. Figure 1 shows that 100-point scores among 24-month reoffenders and non-reoffenders for all violent offenses were both approximately normally distributed, with mean 47.7 and standard deviation 12.0 among reoffenders and mean 36.0 and standard deviation 12.9 among non-reoffenders.
Predicted Probability of Homicide and Wounding, Homicide and Assault, and All Violent Offenses, for a Range of OVP Scores
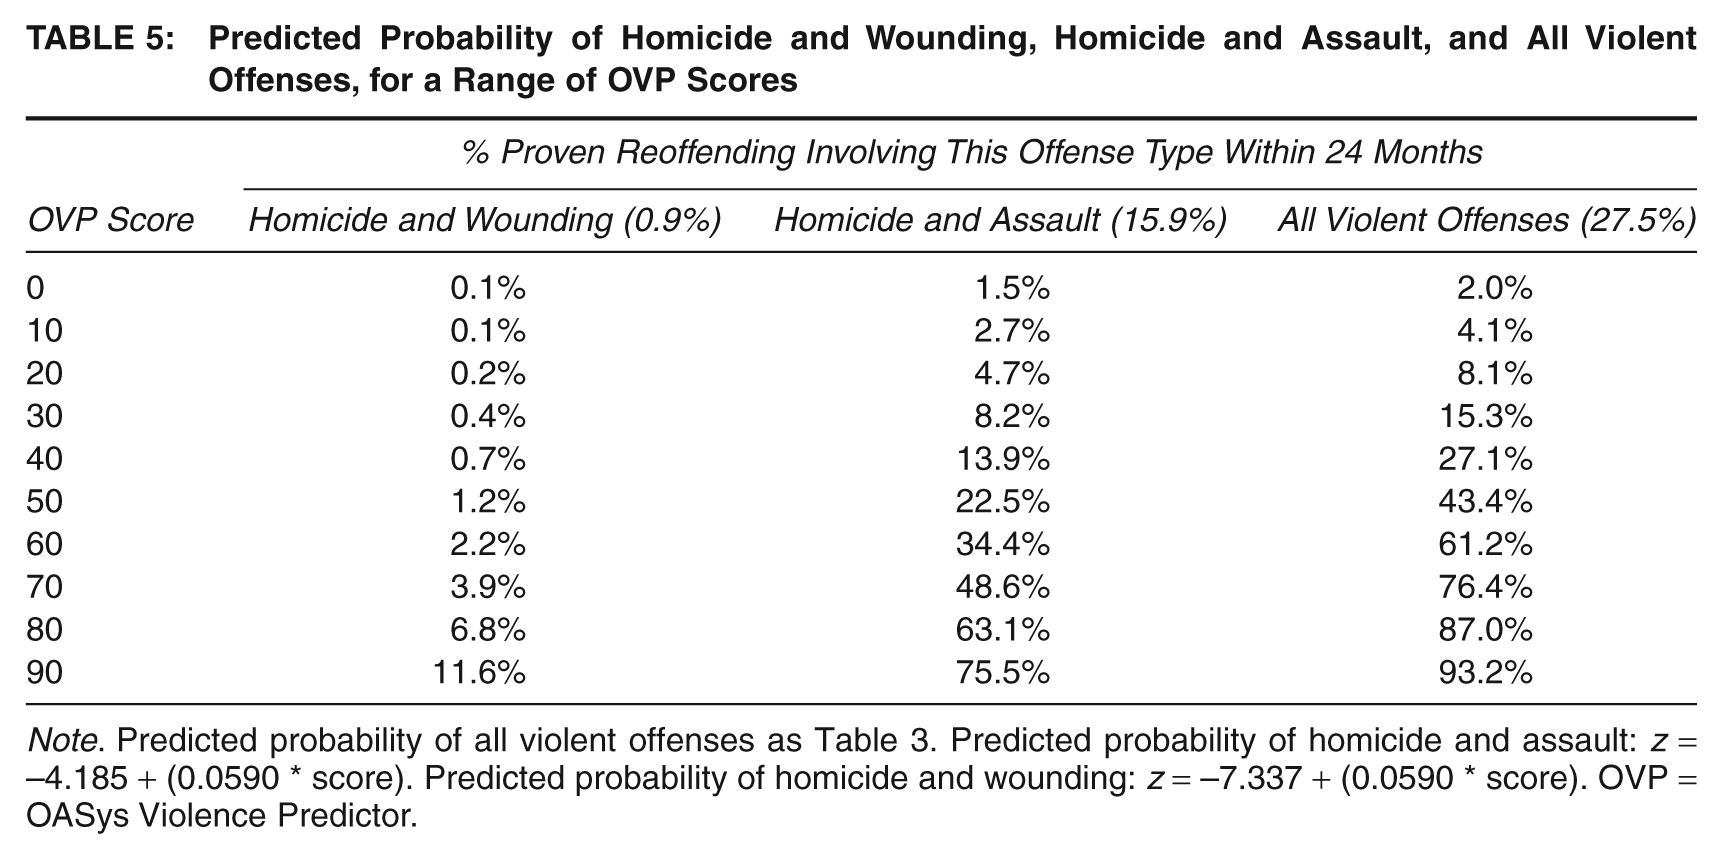
Note. Predicted probability of all violent offenses as Table 3. Predicted probability of homicide and assault: z = –4.185 + (0.0590 * score). Predicted probability of homicide and wounding: z = –7.337 + (0.0590 * score). OVP = OASys Violence Predictor.
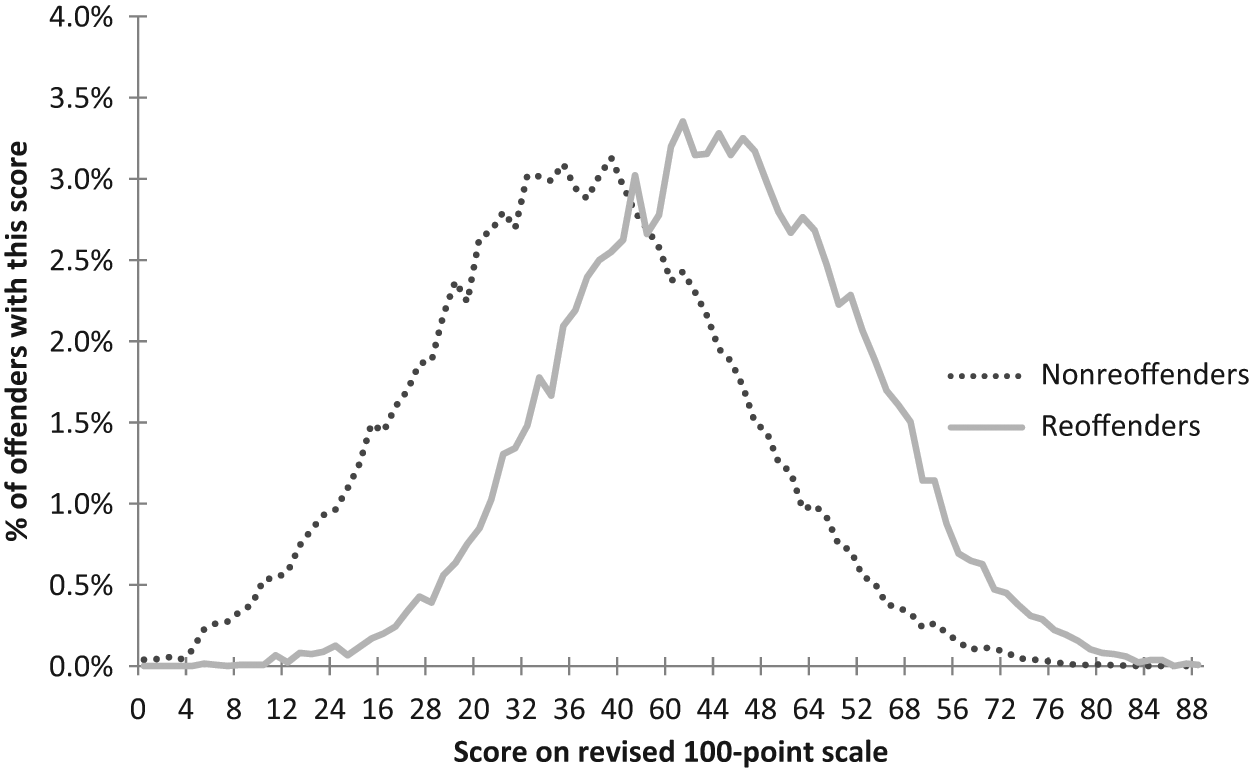
OVP Score Distributions of Reoffenders and Nonreoffenders
Table 6 compares the predictive validity of OVP and the other risk assessment tools. Rice and Harris (2005) suggest that AUCs of .71 or higher are good and AUCs of .64 or higher are moderate. OVP achieved AUCs of .74 for all violent offenses, compared to .66-.70 for the four other tools. The intermediate outcome of homicide/assault was most difficult to predict, with AUCs of .71 for OVP and .63-.68 for other tools. The most serious outcome, homicide/wounding, was predicted with AUCs of .72 for OVP and .65-.68 for other tools. All comparisons between OVP and other tools were significant at p < .001. RM2000/V performed better as a 9-point raw score (0-8) than in four categories. When OVP was synchronized with the four RM2000/V categories, thus eliminating its range advantage, this four-category OVP had AUCs of .699 [.677, .721], .690 [.684, .695], and .719 [.714, .723] for homicide/wounding, homicide/assault, and all violent reoffending, respectively. The paired comparison test with the four-category RM2000/V returned p values of .0109, < .001, and < .001, respectively. Taken together, these results show that OVP’s superior predictive validity was partially due to distributional effects (i.e., its longer range), but partially—and still statistically and clinically significantly—due to better discrimination between reoffenders and non-reoffenders after controlling for such effects.
Comparisons of Predictive Validity Between OVP Total Score and Other Predictors (N = 49,346)
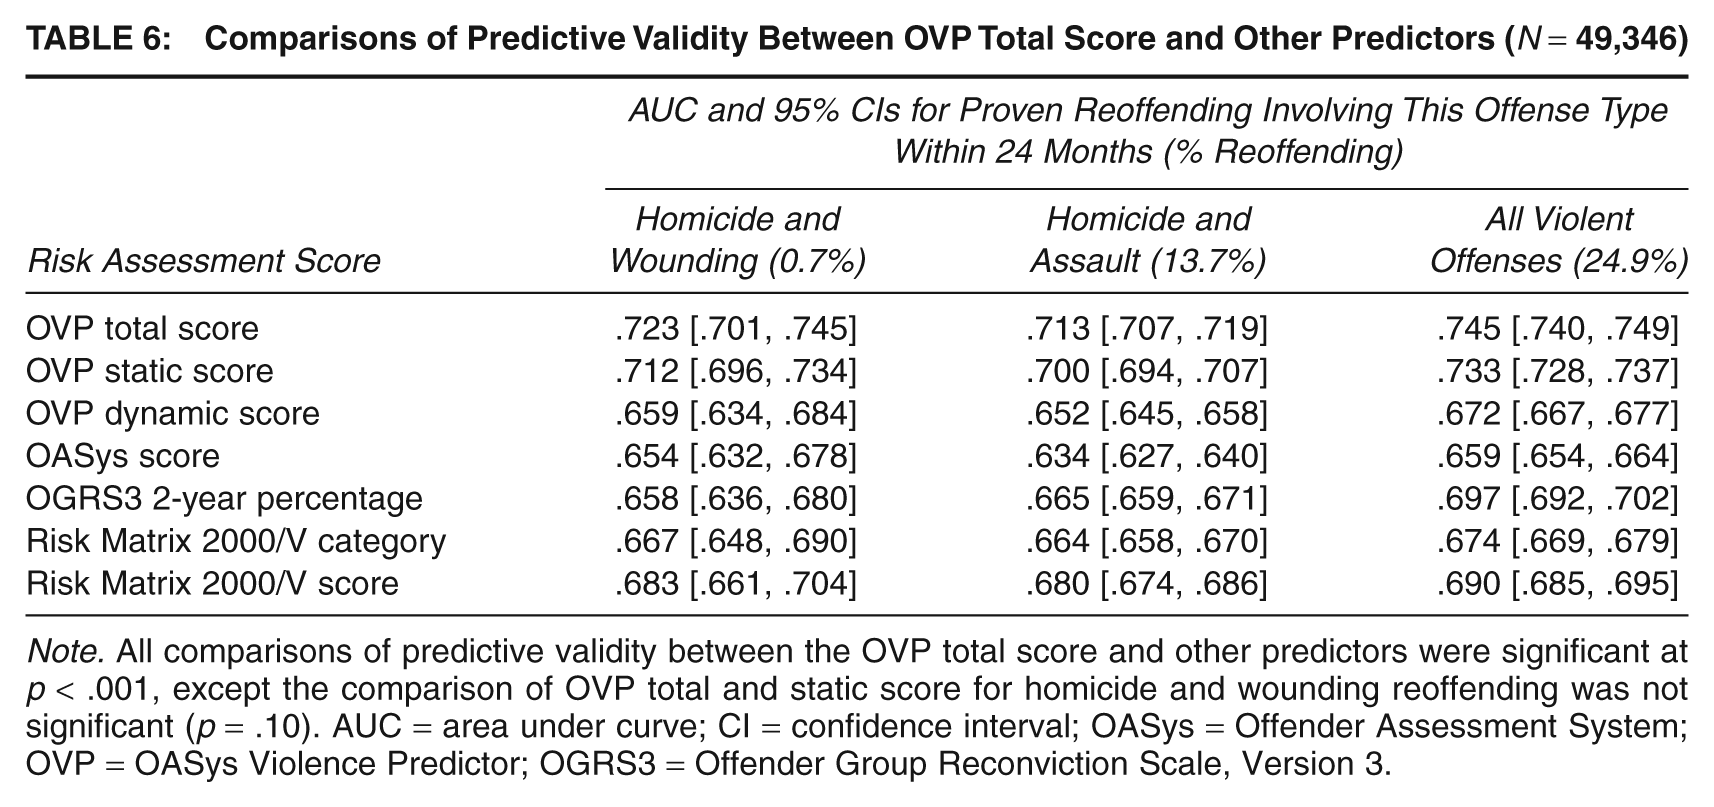
Note. All comparisons of predictive validity between the OVP total score and other predictors were significant at p < .001, except the comparison of OVP total and static score for homicide and wounding reoffending was not significant (p = .10). AUC = area under curve; CI = confidence interval; OASys = Offender Assessment System; OVP = OASys Violence Predictor; OGRS3 = Offender Group Reconviction Scale, Version 3.
The static subscale of OVP was a better predictor than RM2000/V, with AUCs of .70-.73. It was a significantly weaker predictor than the total OVP score for homicide/assault and all OVP offenses (p < .001), but not for homicide/wounding (p = .10). The dynamic subscale was moderately predictive, with AUCs of .65-.67 for the three outcomes.
Table 7 compares the sensitivity and specificity of OVP and RM2000/V, standardizing OVP’s distribution onto the RM2000/V categorization as described above. In a caseload of 10,000, using OVP rather than RM2000/V results in an identically sized very high risk category being used for an additional 9 of the 90 homicide and wounding reoffenders, 38 of the remaining 1,502 less serious assault reoffenders, and 79 of the remaining 1,158 reoffenders convicted of other OVP-class violent (i.e., robbery, aggravated burglary, threats and harassment, weapon possession, public order, and/or criminal damage) reoffenses. OVP’s low risk category includes 28 of the less serious assault reoffenders compared to RM2000/V’s 43, and 16 rather than 38 other violent reoffenders. (Both predictors’ low risk categories include one homicide and wounding reoffender.) As the Discussion details, this resource-neutral categorization shift evidently gives corrections staff many additional opportunities to intervene to prevent harmful reoffending.
Sensitivity and Specificity of OVP and Risk Matrix 2000/V categories
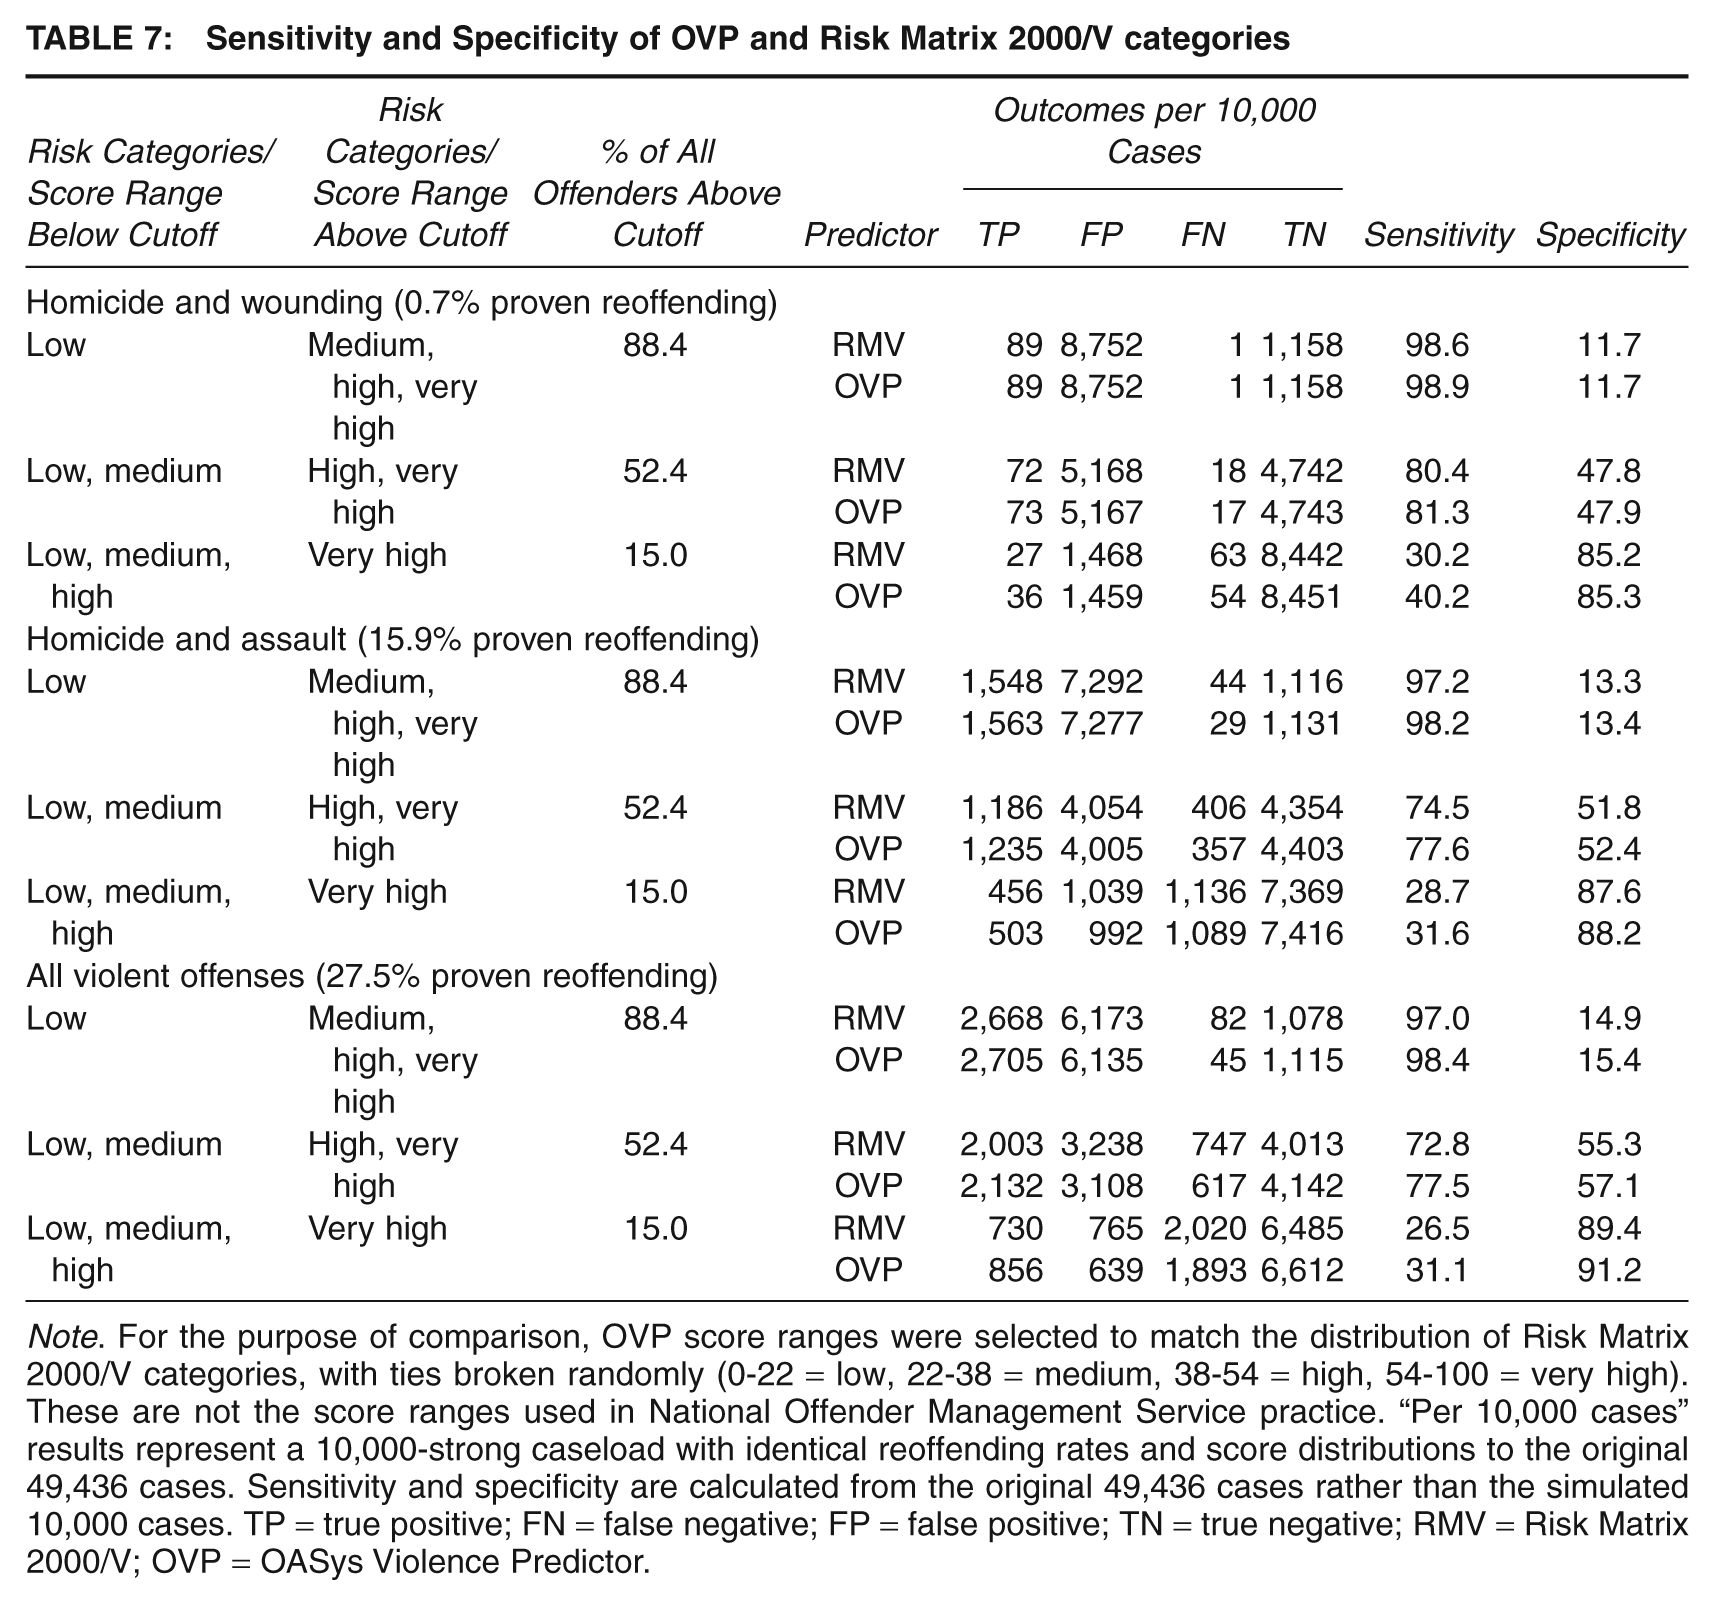
Note. For the purpose of comparison, OVP score ranges were selected to match the distribution of Risk Matrix 2000/V categories, with ties broken randomly (0-22 = low, 22-38 = medium, 38-54 = high, 54-100 = very high). These are not the score ranges used in National Offender Management Service practice. “Per 10,000 cases” results represent a 10,000-strong caseload with identical reoffending rates and score distributions to the original 49,436 cases. Sensitivity and specificity are calculated from the original 49,436 cases rather than the simulated 10,000 cases. TP = true positive; FN = false negative; FP = false positive; TN = true negative; RMV = Risk Matrix 2000/V; OVP = OASys Violence Predictor.
Comparisons of Offender Subgroups
Table 8 reports the AUCs and confidence intervals of OVP as a predictor of the three outcomes among the four offender subgroups, as well as the rates of these outcomes. Most of these AUCs are somewhat lower than those in Table 4. This was expected, as the subgroups were homogeneous on particular risk factors for violent reoffending (i.e., gender or violence history) and therefore spanned narrower ranges of relative risk (Hanson, 2008). All three outcomes had higher AUCs among female (n = 6,368; 13% of the sample) than male (n = 42,978; 87%) offenders; paired comparison tests returned p values of < .001 for the two more frequent outcomes but were not significant for homicide/wounding. The difference between female and male rates was far greater for homicide/wounding (odds ratio [OR] = 0.32) than homicide/assault or all violent offending (ORs = 0.68 and 0.56, respectively). AUCs were higher among those with no known history of violence than those with known history, with p values of < .001 for the two more frequent outcomes, and no significant difference for homicide/wounding. Reoffending rates were far lower among those with no history of violence but were not negligible; these offenders comprised 26% of the sample (n = 12,671), 11% of violent and homicide/assault reoffenders, and 8% of homicide/wounding reoffenders.
Comparisons of the Predictive Validity of OVP Between Offender Subgroups (N = 49,346)
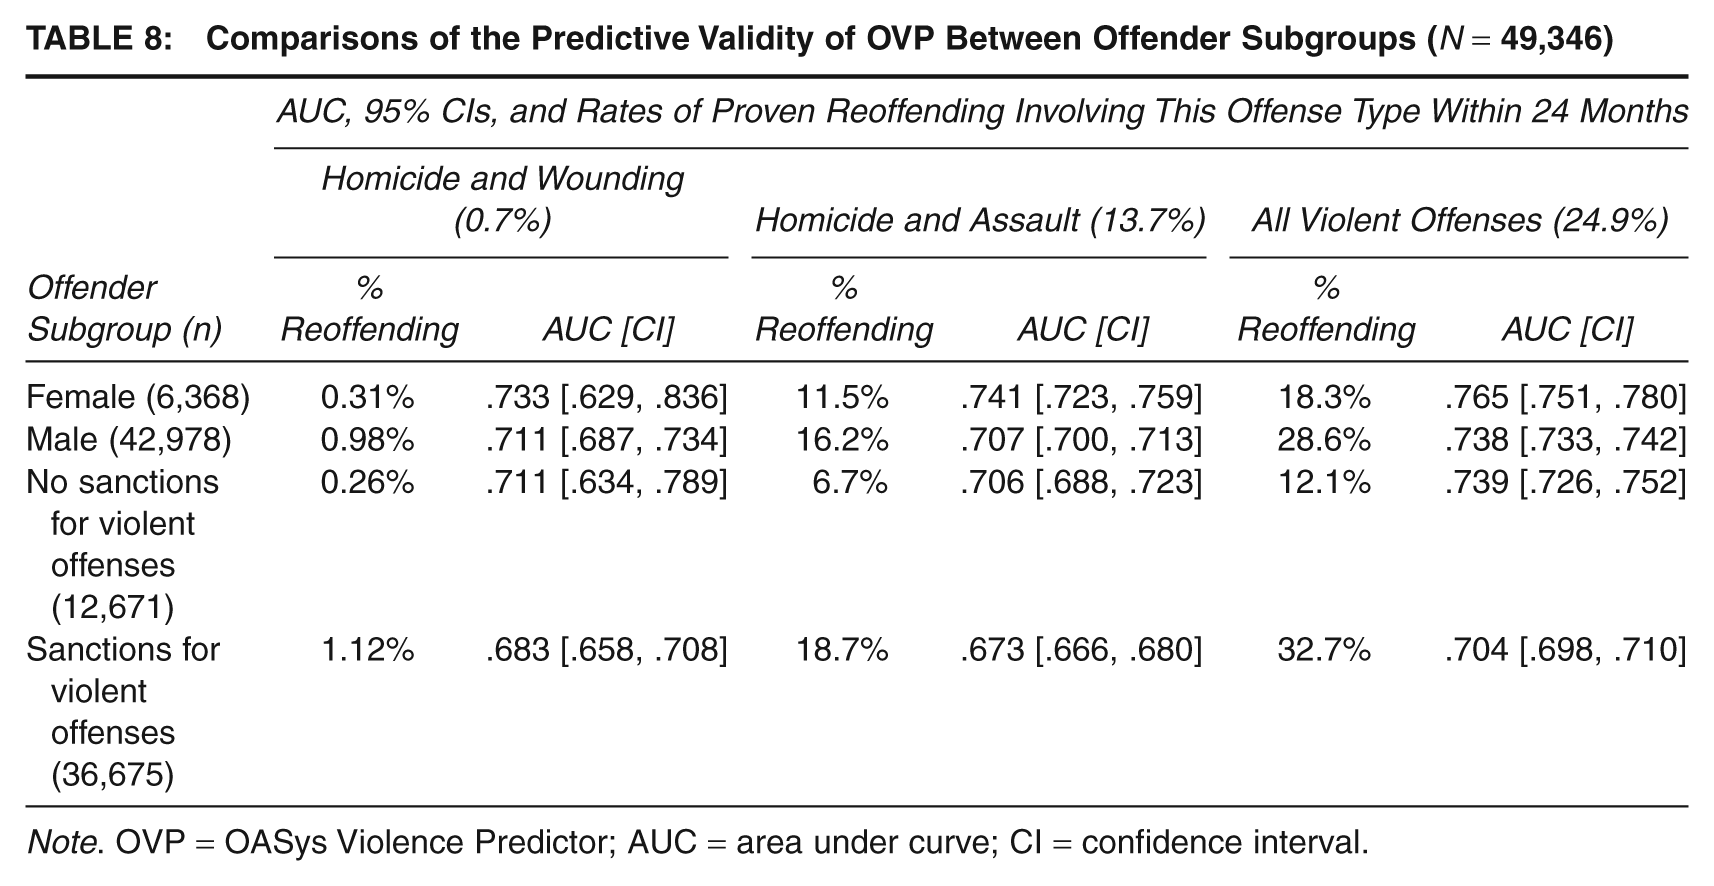
Note. OVP = OASys Violence Predictor; AUC = area under curve; CI = confidence interval.
Discussion
This study used data from a general risk/needs assessment tool (i.e., OASys) to improve the ability of a large correctional organization (i.e., NOMS) to concentrate resources on offenders at the greatest risk of violent recidivism. The resultant impact on NOMS and potentially on other jurisdictions, explanations for OVP’s success, and implications for future violence prediction research are explored below.
The Development and Implementation of OVP
An ordinal logistic regression model was fitted, using a very large sample of OASys assessments matched with official offending data. It selected static risk factors encompassing age, gender, and general and violent criminality domains, and dynamic risk factors encompassing socioeconomic, substance misuse, mental health, cognitive, and attitudinal domains. Considerable simplification and rounding of the model coefficients created a more user-friendly scoring system while sacrificing very little predictive validity. A further simplification to unit weighting would have incurred a far greater loss of validity and was rejected. The resulting OVP substantially improved predictive validity for nonsexual violent recidivism, whether defined narrowly or broadly, compared to predictors of general and nonsexual violent recidivism routinely available in NOMS. It also demonstrated moderate to high levels of predictive validity within offender subgroups. OVP has now been implemented in an upgrade of OASys, which revised its criminal history section and summary sheet. The summary sheet’s IT functionality improves OVP’s field validity by automatically calculating predictor scores. Offenders identified as higher risk receive more intensive supervision, supervision by senior staff members, and prioritization for treatment on accredited groupwork programs (NOMS, 2010). They may also be subject to enhanced management under Multi Agency Public Protection Arrangements (Ministry of Justice, 2010b).
A separate predictor of nonviolent reoffending, the OASys OGP, was introduced simultaneously, and the existing “OASys score” withdrawn (Howard, 2009). OGP is structured in the same way as OVP, but with differences in composition, including the use of OGRS3 as the static risk component and the presence of drug misuse and absence of alcohol misuse among the dynamic risk factors.
Improvements in Predictive Validity
The difference in predictive validity between OVP and the other tools runs contrary to some recent conclusions. While OVP is the only viable static/dynamic predictor for widespread use in NOMS, it is feasible for other predictors to be used for offenders serving long or indeterminate prison sentences. For these offenders, further studies should check whether OVP improves on the validity of existing violence risk predictors and/or can be beneficially used in combination with them, that is, achieves incremental validity. Such studies would ideally directly capture complete scores or SPJ risk judgments on each major instrument and be sufficiently large to detect moderate differences (e.g., 2 to 4 points of AUC) in effect sizes. Conversely, OASys is not routinely used in forensic mental health settings or outside England and Wales. It is not certain that OVP’s advantage would be maintained in these other settings. Patterns of offending behavior may vary, or criminal justice systems could operate differently (e.g., affecting the size of the gap between true and officially recorded offending), affecting the validity of dynamic and static risk factors, respectively. It may be feasible for other European jurisdictions using risk assessment systems based on OASys (van Kalmthout & Durnescu, 2008) to calculate OVP scores from existing research data sets and thereby compare it with any other predictors in routine use.
The prospects for OVP to demonstrate strong predictive validity in further studies seem reasonable. It combines a strong focus on relevant static factors—principally age and previous violence—with a range of clinically relevant dynamic risk factors in a novel manner: “Although actuarial guides could, in theory, include causal dynamic risk factors, extant measures heavily weight static variables, nearly to the exclusion of dynamic ones” (Douglas & Skeem, 2005, p. 352). Of the other tools in the current study, OGRS3 and RM2000/V fail to cover all relevant static factors, omitting previous violence and gender, respectively. Further validation studies would be required to allow comparison with other instruments. Of the existing tools, LSI-R and LS/CMI are most similar to OASys and have performed well in recent meta-analyses. We suggest that their prediction of violent recidivism could improve if selected items were used to create a violence-specific scale, in the same way as OVP selects specific OASys items that are relevant to violence risk. As a more general point, future research is unlikely to identify radical changes in prediction methodology that can produce and sustain massive improvements in predictive validity. Rather, making technical efficiencies (such as OVP’s empirically based violence classification) and combining the best features of existing approaches can lead to incremental improvements that appear modest on a case-by-case basis but provide substantial real-world benefit when applied to large correctional caseloads. It may be more difficult to prove the value of such approaches in organizations with smaller caseloads, where sample sizes may be insufficient to detect these moderate improvements in predictive validity.
Assessment of Dynamic Risk Factors
The full static/dynamic OVP score was only slightly more predictive than the static OVP score, despite the moderate association between the dynamic OVP score and recidivism. The limited improvement in predictive validity attributable to dynamic risk factors is consistent with recent research on NOMS offenders (Yang, Liu, & Coid, 2010). In OASys, dynamic risk assessment is not only useful as a source of predictive validity, with the benefits in case management and resource allocation outlined above; risk factors identified in OASys are also key indicators of need and responsivity when setting sentence plans and allocating treatment (NOMS, 2010). In settings where assessments are used for risk prediction alone, the predictive benefits of dynamic factors would have to exceed the costs of assessing them.
Although our results might imply pessimism about the predictive value of dynamic risk factors, our method follows the common research assumption that risk is assessed only once, at the start of community supervision. This creates an inbuilt bias against genuinely dynamic risk factors, which must be reassessed periodically to remain relevant. Recent research (Brown et al., 2009; Jones, Brown, & Zamble, 2010; Olver, Wong, Nicolaichuk, & Gordon, 2007) has favorably examined the predictive utility of dynamic factors in the more realistic context of repeated assessment. Further research (Howard & Dixon, 2011b) has examined the dynamic elements of OVP in the context of NOMS practice, where OASys assessments are reviewed every few months. This has determined that most of the risk factors in OVP’s dynamic element do have the properties of causal dynamic risk factors, with changes in the probability of violent recidivism occurring after changes in risk factor scores (Kraemer et al., 1997). Rigorously testing these qualities in OVP’s risk factors addresses a topic of considerable research interest. In NOMS practice, it provides evidence that OASys identifies valid treatment targets and that reassessment during ongoing correctional supervision is a worthwhile activity. Changes in causal dynamic risk factors could potentially be measured in treatment evaluations, both as interim outcomes before reoffending data become available and later to help explain the intervention’s success or failure in reducing reoffending.
Methodological Strengths and Ll
This study benefited from an extremely large sample size, which provided narrow confidence intervals for parameter estimates. It was therefore possible to apply nonunit weights while avoiding shrinkage (loss of model fit), contrary to the unit-weighting recommendations of earlier, smaller studies (e.g., Grann & Langstrom, 2007, where N = 404). Item weights were however smoothed, creating a practitioner-friendly and fairly dynamic scoring system. This incurred only minimal loss of predictive validity.
OVP’s predictive validity might be improved further if OASys included a broader range of (putatively) dynamic risk factors. The present psychiatric treatment item seems crude but reliable: Unlike other items in Section 10 (Emotional Well-Being), only basic information and training are required to score it. Most OASys assessments record little or no direct information on personality disorder, psychopathic personality features, or active psychotic symptoms. Some domains included in other risk assessment instruments—such as HCR-20’s risk management subscale—are not assessed in OASys and therefore were not considered for inclusion in OVP. The predictor’s blanket rejection of drug misuse ignores the probable link between use of illegal stimulants (e.g., amphetamines, cocaine) and violence (Boles & Miotto, 2003). (OASys does record use of a range of different drugs, but data completeness was poor during the period in which our construction assessments were completed.)
Although versions of OASys are used internationally, our data set covers only England and Wales, and OVP’s validity in other jurisdictions is therefore untested. Even within NOMS, OASys is seldom used with groups largely ineligible for supervision and rehabilitative programs—those serving custodial sentences of under 12 months duration, or community unpaid work and curfew sentences—and OVP scores are thus neither validated nor routinely available for such offenders.
The use of actuarially scored tools such as OVP is founded on the principle that they produce meaningful predictions for individual subjects. However, two recent papers argue that the “precision intervals” of these predictions are so wide as to be essentially meaningless (Cooke & Michie, 2010; Hart, Cooke, & Michie, 2007). Several authors, most recently Hanson and Howard (2010), have criticized the statistical reasoning and conclusions of these papers. NOMS research managers concur with these criticisms and are therefore content to use OVP and other actuarial tools. OVP and, for known sexual offenders, Risk Matrix 2000/S scores provide a firm objective basis for risk of serious harm ratings and therefore treatment and supervision intensity. Nevertheless, allowance is made for cautious clinical modifications on the basis of “human judgement and experience” (Gottfredson & Moriarty, 2006, p. 17).
Conclusion
The introduction of OVP represents a considerable improvement on the predictors routinely available in NOMS practice. The improvements in predictive validity detected and cross-validated here are modest on a per case basis but create considerable public benefit when applied on the scale of a large correctional system. OVP provides valid information on violence risk for a very large group of offenders responsible for a substantial number of harmful reoffenses. Its potential for application in forensic mental health settings, where risk assessment tools such as HCR-20, VRAG, and PCL-R are available, should be considered carefully, and the approach taken could be replicated in other jurisdictions using comprehensive risk/need assessment systems.
Footnotes
This research was supported by the National Offender Management Service. This article forms part of Philip Howard’s doctoral thesis. We would like to thank the reviewers for their perceptive comments on this article.