
Abstract
Assessing the predictive accuracy of actuarial risk assessment tools requires consideration of discrimination (the differences between recidivists and nonrecidivists) and calibration (the credibility of the recidivism rates associated with test scores or categories). Currently, there are no conventions for reporting calibration effect sizes for offender risk tools. This article explains one promising calibration effect size statistic (the Expected/Observed [E/O] index) and provides an illustrative example of how it can be calculated and interpreted. Briefly, the E/O index is the ratio of the expected number of recidivists to the observed number of recidivists. Guidance is provided for calculating the E/O index with fixed follow-up data as well as from survival data. This article also discusses alternative approaches to examining calibration and provides references to other studies using the E/O index to assess the calibration of offender risk scales.
Many offender risk scales are criterion-referenced prediction tools. The items and total scores of such prediction measures are justified by their relationship to the outcome of interest (Glaser, 1963), in our case, recidivism. When any risk tool is used in an applied setting, it is appropriate (and often legally required) to inform decision makers about the accuracy and errors of the assessment tools used. Although it would be tempting to summarize predictive accuracy in a single number (e.g., “It is accurate 75% of the time”), prediction tools support two quite different inferences, the accuracy of which is difficult to express as a single number. One inference concerns how risky the offender is compared with other offenders, which is indexed by measures of discrimination. The other inference concerns the proportion of similar offenders expected to reoffend, which is indexed by calibration statistics.
Regardless of the base rate of recidivism, discrimination assesses whether higher risk offenders are more likely to reoffend compared with lower risk offenders. In other words, it assesses how well the risk scale ranks offenders in their likelihood of recidivism. Statistics for assessing discrimination accuracy are discussed elsewhere (e.g., Helmus & Babchishin, 2016). This article is focused on the second type of predictive accuracy: calibration (also referred to as absolute accuracy).
Calibration assesses the credibility of the recidivism rate estimates asserted by the scale developers. In other words, how similar are the predicted recidivism rates and observed recidivism rates in independent validation studies? If a risk scale predicts that 40% of offenders with a given score (or category) will reoffend within 5 years, then the scale is well calibrated when validation studies find recidivism rates close to 40% for that score/category. Given that actuarial risk scales are the only type of structured risk scales that include empirically derived estimates of recidivism probability (Dawes, Faust, & Meehl, 1989), calibration is only applicable to actuarial scales, whereas discrimination can be assessed for all types of risk scales.
The discriminative accuracy of offender risk scales is widely researched and has been the primary focus of meta-analyses (Campbell, French, & Gendreau, 2009; Hanson, Helmus, & Bourgon, 2007; Hanson & Morton-Bourgon, 2009; Olver, Stockdale, & Wormith, 2009; Smith, Cullen, & Latessa, 2009; Viljoen, Mordell, & Beneteau, 2012). Unfortunately, calibration is rarely assessed. For example, Hanson and Morton-Bourgon’s (2009) meta-analysis of sex offender risk assessment scales included 63 replications of the discriminative accuracy of Static-99. However, at that time, only two studies had been published examining the calibration of the same scale (Doren, 2004; Harris et al., 2003).
There are also no current conventions and little available guidance on what statistics to use to evaluate calibration. The limited studies available on calibration of offender risk scales have either presented descriptive information without statistical tests (Mills, Jones, & Kroner, 2005; Snowden, Gray, Taylor, & MacCulloch, 2007) or have used the chi-square goodness-of-fit statistic to assess correspondence between observed and predicted recidivism rates (Doren, 2004; Harris, Rice, & Cormier, 2002; Harris et al., 2003). Although the chi-square is a plausible statistic, it is a null hypothesis significance test and provides no information about the direction, magnitude, or importance of potential differences. Authors aspiring to follow reporting standards for psychological research (American Psychological Association, 2009) need an effect size indicator for calibration.
Calibration studies are important for assessing potential bias in prediction tools. In agreement with Reynolds (1982), an unbiased prediction measure is one in which the regression equations are not meaningfully different across subgroups (i.e., the predicted values for each score are the same for all). Wilson and Gutierrez (2014), for example, examined potential ethnic bias in the Level of Service Inventory–Ontario Revision (LSI-OR) for Indigenous offenders by comparing fixed logistic regression equations for Indigenous and non-Indigenous offenders. They found that the predicted recidivism rates were similar for Indigenous and non-Indigenous offenders with moderate or high risk scores, but low risk Indigenous offenders had higher recidivism rates than low risk non-Indigenous offenders. In other words, the scale was not well calibrated for Indigenous offenders with lower risk scores (it underpredicted recidivism). A major advantage of the logistic regression approach to examining calibration in this study was the ability to plot estimate recidivism rates to easily visualize the interaction and identify where poor calibration was most pronounced. Comparing logistic regression coefficients, however, is not an intuitive effect size measure for calibration.
Purpose of the Current Article
The purpose of this article is to explain the E/O index as an effect size statistic and provide an illustrative example of how it can be used in diverse risk scale validation studies (e.g., to examine overall calibration or calibration within subgroups). Although the E/O index is not unknown to researchers in corrections (Helmus, Thornton, Hanson, & Babchishin, 2012; Leguízamo, Lee, Jeglic, & Calkins, 2015), increased use of the E/O index should help decision makers assess the credibility of the recidivism rate estimates associated with commonly used actuarial risk tools. The content of this article is not intended to be novel; instead, it is intended to provide an accessible explanation of this valuable effect size statistic to researchers previously unfamiliar with this approach.
The E/O Index
The E/O index is the ratio of the expected number of individuals with a particular outcome (e.g., recidivism) to the observed number of individuals with that outcome. The statistic originated in the medical field to examine calibration of models designed to predict a dichotomous outcome (e.g., does the number of observed breast cancer cases match the number predicted by a screening tool? Gail & Pfeiffer, 2005; Rockhill, Byrne, Rosner, Louie, & Colditz, 2003). In the context of prognostic models (such as actuarial risk assessment scales), the statistic can be used to compare observed recidivism rates to any kind of expected number (typically obtained from the official recidivism estimates for the scale). The statistic provides both a statistical significance test and an effect size measure.
If a scale has perfect calibration, the number of observed recidivists will match the number of expected recidivists, producing an E/O index of 1. If the ratio is below 1, that means the number of expected recidivists was lower than the number of observed. In other words, the risk scale has underpredicted recidivism. If the ratio is above 1, that means the number of expected recidivists exceeded the number of observed, or the risk scale overpredicted recidivism. Because this statistic is a ratio, it is fairly straightforward to interpret the magnitude of over- or underestimation of recidivism. An E/O index of 2 means the scale predicted twice the number of actual recidivists. In contrast, an E/O index of 0.5 means the scale underpredicted recidivism by half. An E/O index of 0.80 could be described as predicting 80% of the observed recidivism rate.
The most straightforward way of calculating the E/O index is by dividing the expected number of recidivists (E) by the observed number of recidivists (O; Method M0 from Viallon, Ragusa, Clavel-Chapelon, & Bénichou, 2009). This calculation method is appropriate and unbiased with complete and fixed follow-up information (i.e., when all offenders have the same length of follow-up). Note that it is possible to have zero expected or observed recidivists. In this case, the E/O index cannot be calculated. It is necessary to use the number of recidivists and not the recidivism rate (i.e., as a proportion), given that the statistical power of this test is determined by the absolute number of recidivists (which will be explained further below).
Data Requirements
The ideal calculation scenario requires data with an unbiased and complete fixed follow-up period (though an alternative is discussed in the next paragraph). When calculating a fixed 5-year follow-up, this requires using all cases with a minimum of 5 years of follow-up data, regardless of recidivism status or time to recidivism. For example, if an offender recidivated within 2 years of release, but their last follow-up date was only 4 years post release, they would be excluded from the fixed follow-up analysis. Although we know the offender definitely reoffended within 5 years, including them in the calculations would bias the recidivism rates upward because nonrecidivists with less than 5 years of data are excluded. Conversely, offenders who reoffended after 6 years of follow-up would be counted as nonrecidivists in the fixed 5-year follow-up because they were nonrecidivists at 5 years (information after the fixed follow-up is not considered).
Viallon and colleagues (2009) provide and evaluate adjustments for calculating the E/O index and its confidence interval (CI) when the follow-up period varies. When working with traditional survival data where the follow-up ends after varying intervals for offenders, the observed number of recidivists can be easily estimated through Kaplan–Meier survival analyses. A detailed example of how to obtain this value in SPSS is provided in Appendix A.
CIs, Power, and Interpretation
Following Rockhill et al. (2003), the 95% CI for the E/O index can be calculated using the Poisson variance for the logarithm of the observed number of cases (O):
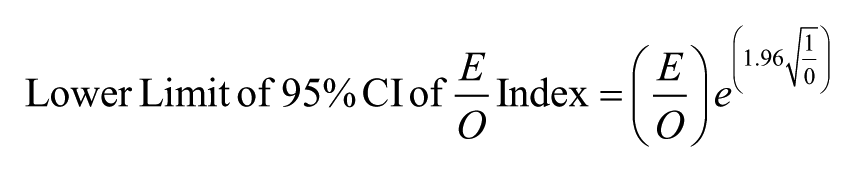
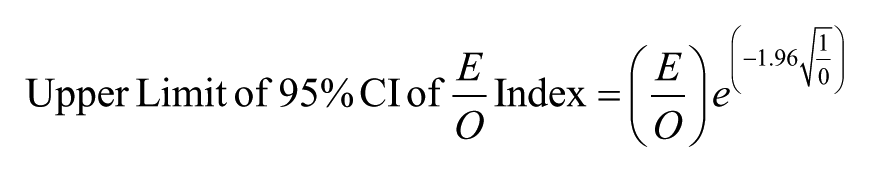
The formula above looks daunting but it is manageable with careful attention to the order of operations or, to minimize the work even further, you can use the SPSS syntax included in Appendix B. Given that an E/O of 1 means the expected number of recidivists matches the observed number, then a 95% CI that includes 1 means there is no statistically significant difference between observed and expected recidivism rates (p > .05). In contrast, a 95% CI that does not include 1 means that the expected and observed recidivism rates significantly differ (p < .05).
In terms of statistical power, note that the CI formula only includes the sample size for the observed number of recidivists, not the expected number (or the number of nonrecidivists). This means the power is derived from the validation study and is unaffected by the precision/quality of the norms that are used to obtain the expected number. Also, the index and its statistical power are based solely on the number of recidivists, not the total sample size or the proportion of recidivists. In other words, a study of 1,000 sex offenders with 50 recidivists (5% recidivism rate) would have the same statistical power as a study of 100 offenders with 50 recidivists (50% recidivism rate). This means the statistic is equally applicable to any base rate of recidivism; the determinant of power is the total sample size of recidivists.
Possible Applications of the E/O Index
For evaluating the calibration of offender risk scales, the expected number of recidivists would often be obtained from the normative data for the risk scale (i.e., the recidivism estimates endorsed by the scale developers). It is also possible to define expected recidivists from previous validation studies of the scale. This would be particularly useful for scales without official recidivism estimates, or if a researcher wants to compare calibration to a particular group examined in another study (e.g., from another jurisdiction or setting). A general assumption of the statistic is that the current data are being compared with a population value. In other words, the E/O index is analogous to a single-sample t test, where the current data are compared with a known value (this is why only the current data are incorporated in the CI calculation). In some contexts, researchers may want to communicate calibration using the O/E index rather than the E/O index (e.g., to say the observed rate of recidivism is twice as high as the expected rate). When this is the case, simply inverse the E/O index and the upper and lower values of its CI.
Illustrative Example
For this example, I will use hypothetical data to evaluate the calibration of the Static-99R sexual offender risk assessment tool (www.static99.org; Helmus, Thornton, Hanson, & Babchishin, 2012). I will examine calibration for the overall sample, as well as within each risk category, which can provide a more detailed examination and highlight particular areas of miscalibration. Examining calibration at each score would provide even greater detail, but few studies have sufficient sample size for this type of analysis (for an exception, see Helmus, 2015), so examining risk categories is a more practical application. I will also report discrimination accuracy, given that the two should be reported together.
To bring this hypothetical examination to life, imagine that a new island has been discovered in the Pacific Ocean called Akuarl Atoll. Although the rest of the world was oblivious to this island, Akuarl Atoll had studied the rest of the world in great detail and was using the Static-99R for all convicted sex offenders. They collected 5-year follow-up data for 1,100 convicted sex offenders and wanted to assess the scale’s utility with their population, given recent Akuarl Atoll media concerns that there are important cultural differences with the Akuarl Atolli population, causing people to question whether the scale was applicable on this island. They sent me their data to analyze.
Table 1 summarizes the raw data from Akuarl Atoll, presenting each Static-99R score, the risk category for that score (following Hanson, Babchishin, Helmus, Thornton, & Phenix, 2016), the number of offenders with that score, the number of sexual recidivists, and the recidivism rate (as a percentage). From Table 1, the overall sexual recidivism rate for this sample was 7.5% after 5 years. As would be expected, the distribution of risk scores was largely clustered around the average risk category, with sample sizes getting smaller for the highest risk scores. None of the 1,100 offenders scored higher than 10 on Static-99R. Discrimination accuracy in this sample was moderate, area under the curve (AUC) = .68, 95% CI = [0.62, 0.74], which is comparable to a recently published meta-analysis of the scale (AUC = .69; Helmus, Hanson et al., 2012).
Hypothetical Observed Data From Study Validating Static-99R
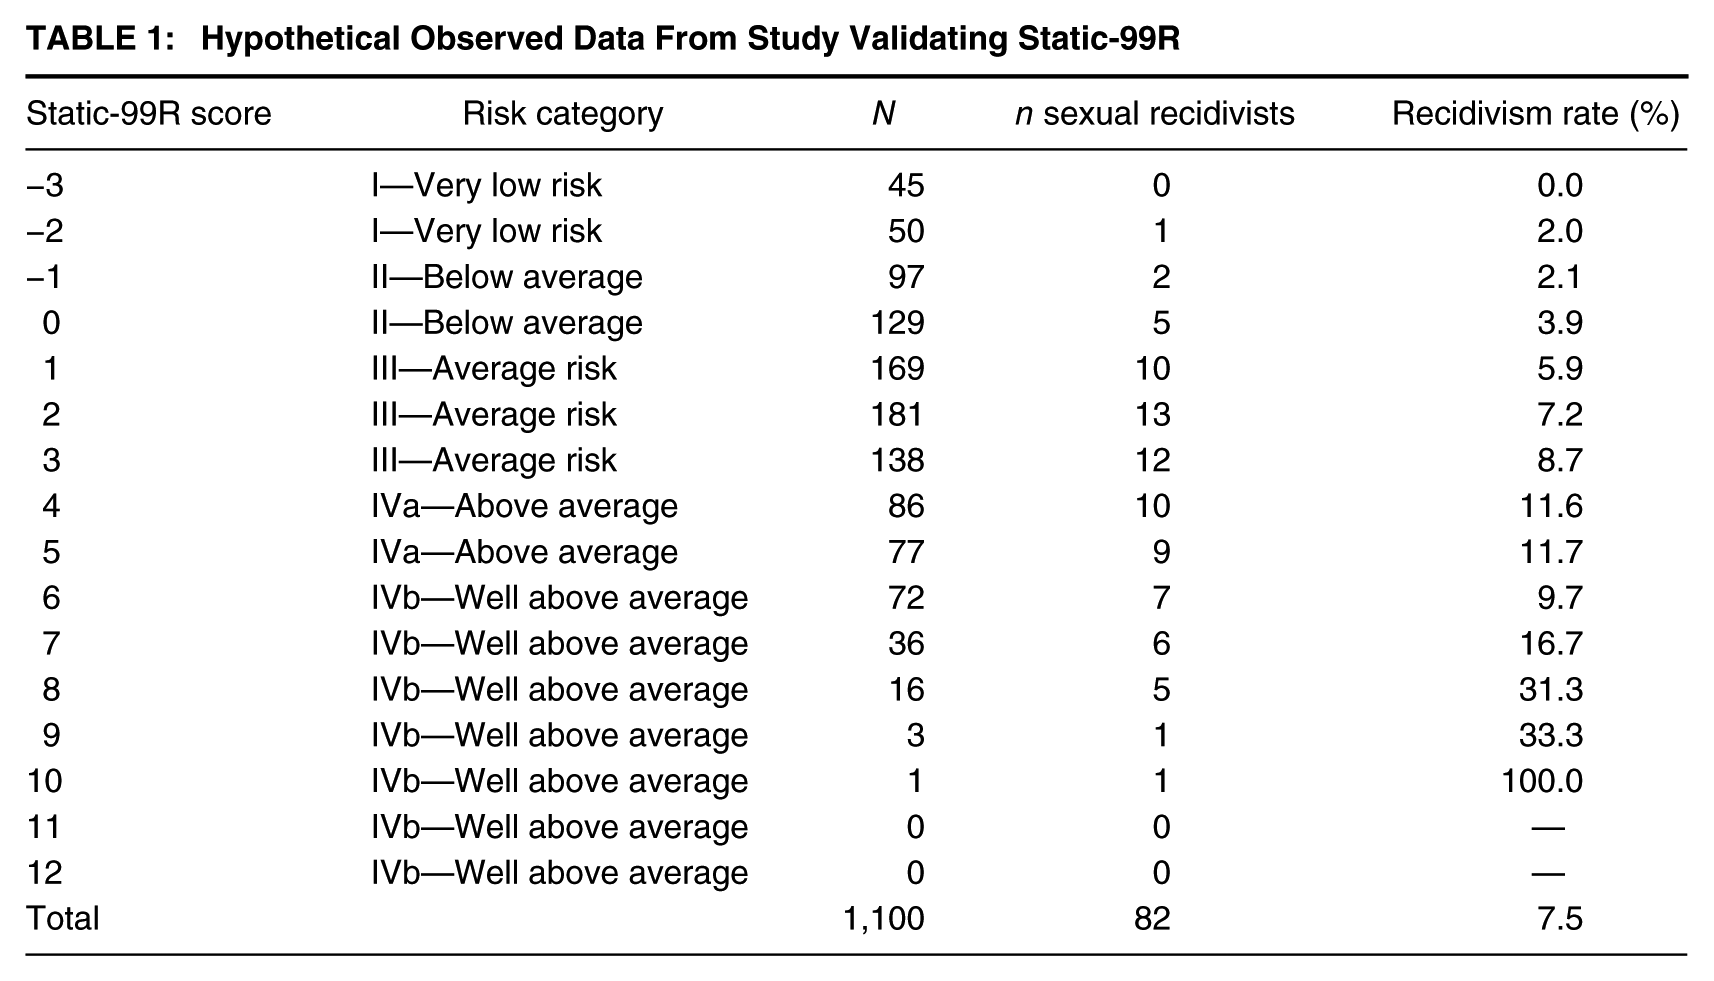
To calculate the E/O index, the information required is the number of observed recidivists (available in Table 1) and the number of expected recidivists. I will obtain the expected number of recidivists from the 5-year predicted recidivism probabilities for Static-99R in routine/complete (i.e., fairly unselected) samples. This information is available in the Static-99R and Static-2002R Evaluator Workbook (Phenix, Helmus, & Hanson, 2016, p. 8). Table 2 reproduces each Static-99R score and category, and provides the observed sample size and the number of recidivists (from the hypothetical data in Table 1), and the expected recidivism percentages from the Static-99R norms (page 8 of the Static-99R and Static-2002R Evaluator Workbook, 2016; for ease of tracking, I have listed this information as both a percentage and a probability). In the last column, I have calculated the expected number of recidivists for the Akuarl Atoll study by multiplying the proportion (from the normative data) and the sample size with that score (from the current study).
Identifying Observed and Expected Recidivists
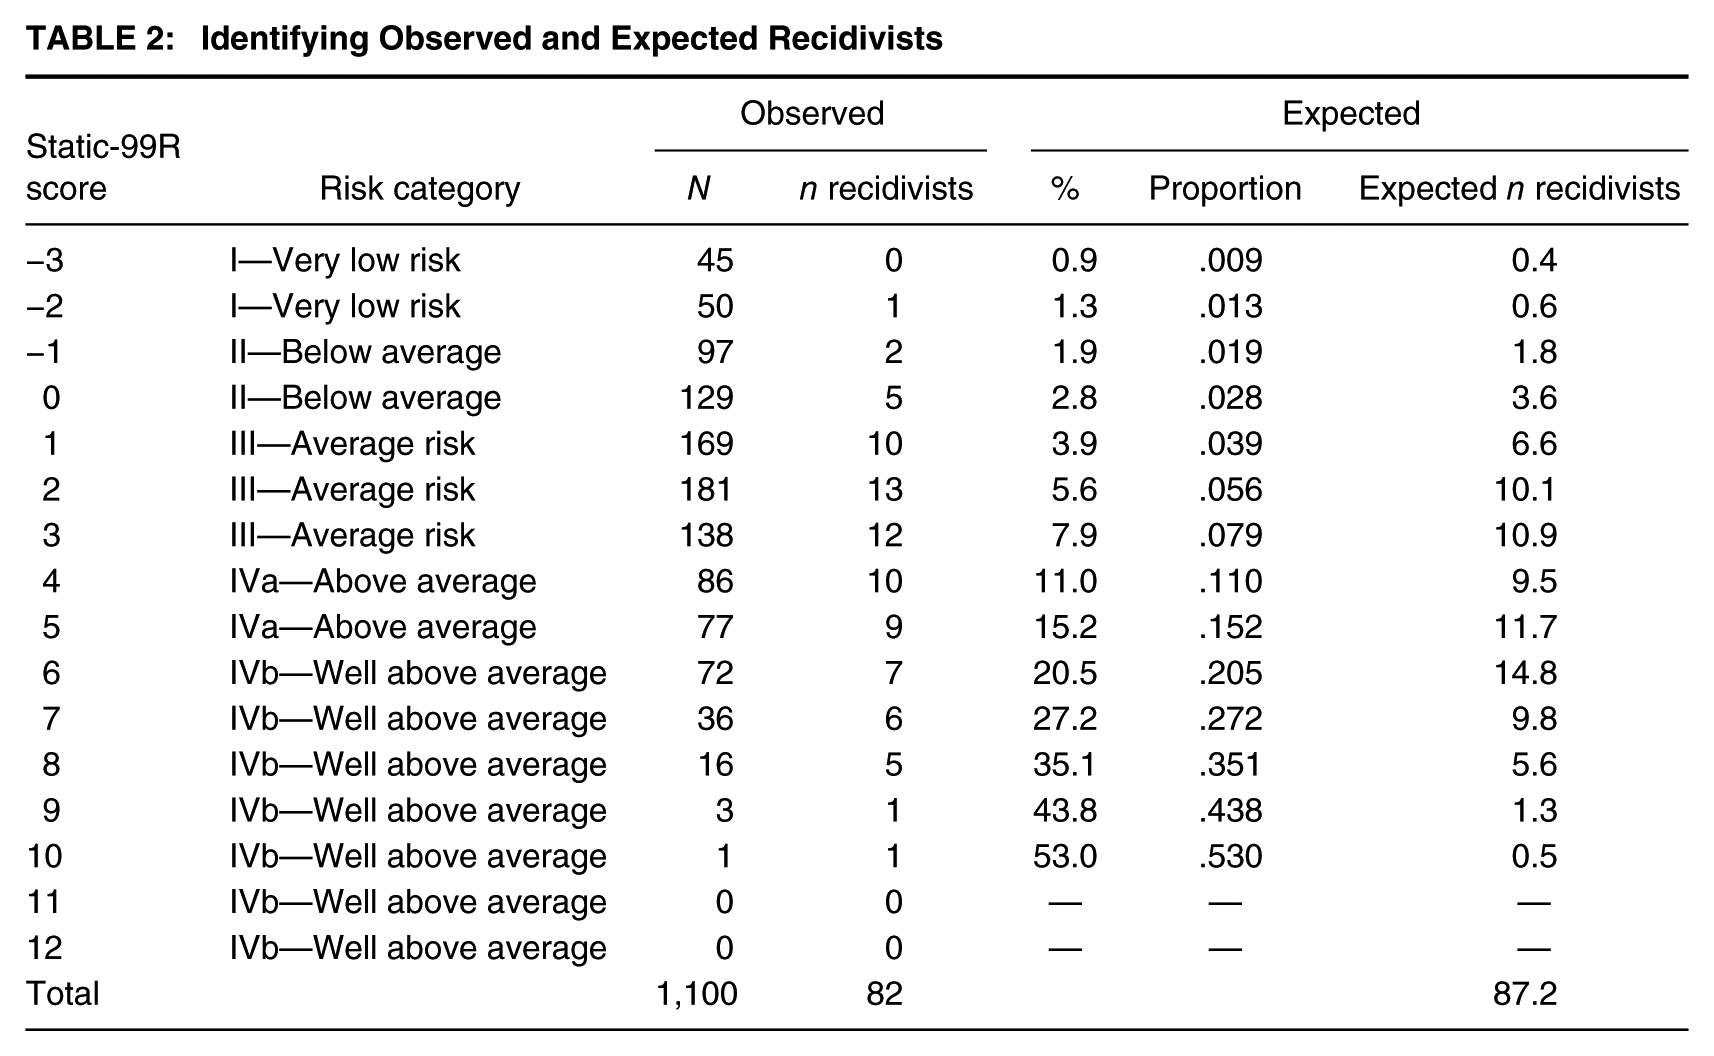
There are a few things to note at this step. First, I have reported expected recidivists to one decimal place. Although it is not possible to have fractions of a recidivist, I have allowed the use of decimals here for greater precision in calculations. This is particularly useful in the lowest scores, which have small samples sizes and small expected recidivism probabilities. Second, although I ultimately want to examine calibration for each risk category, I must calculate the expected number of recidivists for each score because that is how the normative data are presented for Static-99R (Phenix et al., 2016), and this will allow the greatest precision in calculations. After identifying the expected number of recidivists for each score, I can then aggregate this information for each category.
From Table 2, we see that the current study of 1,100 sex offenders from Akuarl Atoll had 82 sexual recidivists. Based on the distribution of Static-99R scores and the predicted probability of recidivism per score from the scale’s Static-99R and Static-2002R Evaluator Workbook (Phenix et al., 2016), we can see that the Static-99R would have predicted 87.2 sexual recidivists for this sample. This does not seem to be hugely different from the observed number of recidivists. We can also examine correspondence at each score. For example, 129 offenders in this study scored a 0 on Static-99R, and of those, five are sexually reoffended. Based on the normative data for the scale, 3.6 offenders would have been predicted to reoffend. Looking in the higher risk ranges, 36 offenders scored a 7 on Static-99R, and six of them sexually reoffended, whereas the scale would have predicted about 10 recidivists (specifically, 9.8).
Now it is time to calculate the effect sizes to summarize the information on correspondence between observed and expected recidivism. This step is presented in Table 3. First, I aggregated the data in Table 2 to describe each risk category. The number of observed recidivists for each category was obtained by summing the number of observed recidivists in each score within that category (from Table 2). The expected recidivists are also summed. The E/O index was obtained by dividing the expected number by the observed number. Last, the 95% CIs were computed following the formula presented above (SPSS syntax for computing the E/O index and its CI is provided in Appendix B; the calculations can also be done in commonly available spreadsheets, such as Excel).
E/O Index and 95% CI
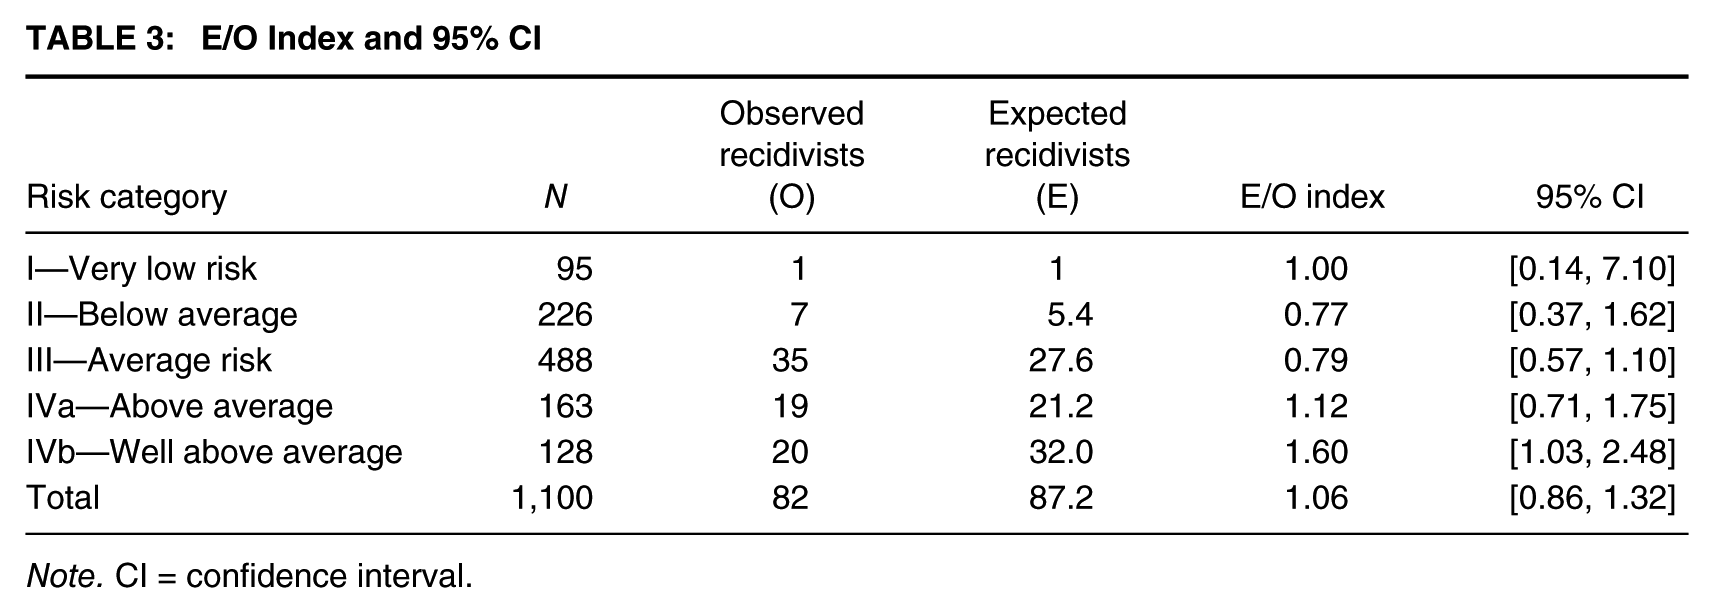
Note. CI = confidence interval.
Examining Table 3, the study from Akuarl Atoll had 82 recidivists, whereas the recidivism norms for Static-99R would have predicted 87.2 recidivists, based on the distribution of scores in this sample. The E/O index for the total number of recidivists was 1.06, which is very close to the ideal ratio of 1. Although the Static-99R recidivism norms overpredicted recidivism in this validation study, the difference was small. Specifically, the scale predicted 6% more recidivists compared with what was observed, and the difference between expected and observed recidivists was nonsignificant, as evidenced by a 95% CI = [0.86, 1.32] that overlapped with 1. Consequently, from this analysis, it appears as though Static-99R was well calibrated for Akuarl Atoll.
It is often helpful to examine subgroups of offenders as there may be differences. For example, the scale may overpredict or underpredict for certain risk categories or groups (e.g., based on age, victim type, offense type, etc.). In this example, I looked in more detail at risk categories. Calibration was perfect for the lowest risk category (E/O Index = 1.0; the scale predicted one recidivist, and there was only one). Note that the 95% CI for the lowest risk category was exceptionally wide (from 0.14 to 7.10) because the E/O Index was calculated based on only a single recidivist. Consequently, this had very low power. Had one additional offender in this category reoffended, the E/O Index would have halved from 1 to 0.5, indicating how unstable this estimate is with only one recidivist.
The scale was also well calibrated for offenders in Category IVa, where 19 offenders reoffended, and the scale would have predicted 21.2 recidivists. Specifically, the E/O index was 1.12, which means the scale predicted about 12% more recidivists than what was observed, which was a slight overestimation and not statistically significant (the 95% CI includes 1). Static-99R underpredicted recidivism for Risk Categories II and III, but, again, the differences were not significant. Specifically, Static-99R predicted about three quarters of the observed number of recidivists in Category II (E/O Index = 0.77) and four fifth of those in Category III (E/O = 0.79). There was a significant difference between observed and expected recidivism rates in the highest risk category (IVb; E/O = 1.60, 95% CI = [1.03, 2.48]). For this category, the scale predicted 60% more recidivists than what was actually observed. From this hypothetical study, it is reasonable to conclude that, overall, there was acceptable calibration for Static-99R in Akuarl Atoll, but that the scale tended to underestimate recidivism for low and moderate risk offenders (this difference was not statistically significant) and overestimate recidivism for higher risk offenders.
This pattern of calibration results may or may not be problematic depending on the purpose of the assessment. If the scale is used to estimate the recidivism rates of the highest risk offenders, then decision makers should interpret the results cautiously because the Static-99R significantly overestimated the recidivism rates of this category of sexual offenders in Akuarl Atoll. On the contrary, if the scale is used to classify offenders in the middle of the risk distribution (or lower), decision makers can have reasonable confidence that the recidivism rates in this jurisdiction are similar to norms asserted by the test developers.
Discussion and Conclusion
Describing the accuracy of criterion-referenced prediction schemes requires reporting both discrimination and calibration. Whereas the discrimination accuracy of offender risk tools has been extensively studied, calibration has been largely ignored. One impediment to calibration research has been the lack of conventions for reporting the magnitude and direction of differences the recidivism rates predicted by a risk tool and the recidivism rates observed in validation studies. The current article aimed to fill this gap by presenting the E/O index as a generic effect size statistic for calibration. It is easy to calculate, intuitive to interpret, and flexible enough to address diverse research questions.
The E/O index is most appropriate given recidivism rate norms asserted by the test developers, which can inform the calculation of the expected values. Different effect size statistics are recommended when comparing the recidivism rates of two groups, neither of which takes priority. In such cases, conventional relative risk indices are recommended, such as rate ratios, odds ratios, or hazard ratios (Fleiss & Berlin, 2009; Hanson, Babchishin, Helmus, & Thornton, 2013). Like the E/O index, these risk ratios are ratios of two risks (variously defined). However, instead of one being considered a population value, both risks are considered to be estimates measured with error (see Fleiss & Berlin, 2009).
Another valuable option for estimating calibration is to compare the stability of regression equations (Reynolds, 1982). The simplest regression equation includes two parameters: the intercept (predicted outcome for score of 0) and slope (how much change in outcome is associated with a unit change in scores). Given a dichotomous outcome (recidivism), logistic regression is often the most appropriate regression model. Examples of assessing calibration of risk tools using logistic regression can be found in Hanson, Lunetta, Phenix, Neeley, and Epperson (2014) and Wilson and Gutierrez (2014). When multiple subgroups are examined simultaneously (e.g., White, Black, Hispanic), the differences between groups can be tested using cumulative meta-analysis (Hanson & Broom, 2005, as in the example of Hanson et al., 2014).
Like E/O indices, calibration plots are another easy and intuitive way to visualize correspondence between observed and expected data points (Altman, Vergouwe, Royston, & Moons, 2009; for an example from offender risk assessment, see Lehmann et al., 2013).
Although good calibration is an important feature of valid prediction schemes, it is but one of two essential features. Good risk scales also differentiate offenders in terms of their relative risk for recidivism. For example, a scale may predict recidivism rates for low, moderate, and high risk offenders as 15%, 18%, and 20%, respectively. Validation studies may repeatedly replicate these expected recidivism rates. However, the differences between the groups would be too small to make practical differences. In the extreme, betting the base rate without using any risk tool at all may result in virtually perfect calibration (E/O = 1.0), but no discrimination (AUC = .50; Cohen’s d = 0.00).
This article was intended to promote and encourage calibration studies of offender risk tools. Calibration research, of course, requires normative recidivism rates to be asserted by the test developers. This is not always the case, and many of the commonly used risk tools do not associate recidivism rates with risk categories (e.g., all the structured professional judgment [SPJ] measures). Currently, most of the offender risk studies using the E/O index have focused on the Static-99/R (Hanson et al., 2014; Helmus, Thornton, et al., 2012; Leguízamo et al., 2015; Montana et al., 2012; Rettenberger, Haubner-MacLean, & Eher, 2013), for which recidivism rates tables are available (Hanson, Thornton, Helmus, & Babchishin, 2016; Phenix et al., 2016). The E/O index has also been used to examine the calibration of other related measures such as the Brief Assessment of Recidivism Risk (BARR-2002R; Babchishin, Hanson, & Blais, 2016), the Multisample Age-Stratified Tables of Sexual Recidivism (MATS-1; Helmus & Thornton, 2016), and the Risk of Administrative Segregation Tool (RAST; used to identify offenders at risk of placement in segregation; Helmus, 2015; Helmus, Johnson, & Harris, 2014). Researchers using the E/O index for the first time may be interested in reviewing the above examples for how other researchers have applied, reported, and interpreted this statistic.
Footnotes
Appendix A
Appendix B
Acknowledgements
The author would like to thank Maaike Helmus, Kelly Babchishin, and the anonymous reviewers for helpful comments on this manuscript. The views expressed are those of the author and not necessarily those of Public Safety Canada.