




Abstract
The Psychological Inventory of Criminal Thinking Styles (PICTS) is commonly used to assess criminal thinking (thoughts related to criminal behavior); however, the item wording may not be an appropriate assessment for individuals without a criminal history (laypersons) who still may be at risk of engaging in crime. Therefore, a layperson version of the PICTS may more accurately assess criminal thinking among this group. This study examined the psychometric properties of the PICTS–Layperson–Short Form (PICTS-L-SF). Participants were 619 college students without a criminal justice involvement history. Analyses of the PICTS-L-SF indicated that a bifactor model fit the data better than a one- and two-factor model (general criminal thinking; proactive and reactive criminal thinking). Results provide strong evidence for the reliability and validity of the PICTS-L-SF, suggesting it can be used with individuals who are not criminal justice involved to assess criminal thinking.
Keywords
Criminal thinking is one of the “Big Four” risk factors for engaging in criminal activity (see Andrews & Bonta, 2010). Not surprisingly, criminal thinking has been a focus of both research and treatment among individuals involved in the criminal justice (CJ) system, as it is a dynamic factor that can be altered to reduce an individual’s criminal risk (Walters, 2014). To aid assessment and treatment efforts, Walters (1990) created the 80-item Psychological Inventory of Criminal Thinking Styles (PICTS) to assess criminal thinking. However, the PICTS is specifically designed for individuals with CJ involvement. Therefore, individuals without a history of CJ involvement have difficulty responding to item content that does not apply to them (e.g., the item “I rarely considered the consequences of my actions when I was in the community” does not apply to individuals who are not incarcerated). An assessment of criminal thinking that is designed for laypersons (i.e., individuals without a history of involvement in the CJ system) may aid in the assessment of criminal thinking among individuals who have the propensity for criminal, antisocial, or unethical behavior. This may allow for a preemptive intervention with individuals who report thinking styles consistent with criminal behavior.
The PICTS is a valid and reliable measure of criminal thinking for male and female incarcerated offenders and is associated with other methods of assessing criminality in offender groups (e.g., number of previous arrests, number of previous commitments, age of first arrest, age of first offense, disciplinary infractions, psychopathy; Gonsalves, Scalora, & Huss, 2009; Walters, 2006; Walters & Mandell, 2007; Walters & Schlauch, 2008). Furthermore, offenders in maximum-security correctional facilities have significantly higher PICTS scores than offenders in minimum and medium security facilities (Walters, 1995), and criminal thinking scores are positively correlated with future disciplinary infractions among offenders in a medium security prison (Walters, 1996). Meta-analytic research suggests that general criminal thinking (GCT) is related to criminal recidivism beyond variance accounted for by age and criminal history (Walters, 2012). Taken together, these studies suggest that the PICTS is a suitable assessment of criminal thinking.
Although there has been a significant amount of research on the use of the PICTS among offender groups, the PICTS has not been normed in nonoffender groups. This is concerning because literature suggests that people who do not become involved in the CJ system may still engage in criminal activity without being caught (e.g., Grant, Chamberlain, Schreiber, & Odlaug, 2012; Jambon & Smetana, 2012). Therefore, they are likely also engaging in criminal thinking. Criminal thinking might also affect an individual’s propensity to engage in unethical or risky behaviors that are not illegal. For example, data from the 2002 to 2004 National Survey on Drug Use and Health indicate that 37.5% to 38.5% of young adults ages 18 to 22 used illicit drugs (e.g., marijuana, cocaine, hallucinogens, stimulants, methamphetamine) in the past year (Substance Abuse and Mental Health Services Administration [SAMHSA], 2005), and many of these young adults had not encountered the CJ system, regardless of their illegal substance use. Furthermore, young adults are more likely than other groups to drive under the influence of alcohol and marijuana (McCarthy, Lynch, & Pederson, 2007; Paschall, 2003). In addition to those potentially life-threatening illegal behaviors, people also participate in less dangerous illegal activity, such as illegal music downloading (Jambon & Smetana, 2012), shoplifting (Grant et al., 2012), and property crimes (McCoy et al., 2006) that may not result in CJ involvement. This literature suggests that persons who are not yet CJ involved engage in illegal behavior, which may be a product of criminal thinking. A layperson version of the PICTS may provide a mechanism for identifying these at-risk individuals.
The development of a layperson criminal thinking measure may also allow for clearer assessment of criminal thinking among non-CJ populations. Gross and Morgan (2013) reported that 33 of the 94 participants from an acute inpatient psychiatric facility either declined to complete the PICTS or responded in a manner that invalidated the PICTS. Anecdotally, the researchers noted that several of the participants on the inpatient psychiatric unit became confused or frustrated when trying to complete the PICTS because they generally felt that the items did not apply to them. Specifically, items on the PICTS suggested that participants had engaged in illegal behavior, been incarcerated, or were CJ involved in some way, though the participant may not have had these experiences. It is possible that this may have resulted in incomplete PICTS or invalid score reports. Therefore, a criminal thinking measure for non-CJ–involved individuals may increase participants’ ability to answer items assessing criminal thinking.
In continued effort to examine criminal thinking styles among university students, Walters, Felix, and Reinoehl (2009) used an 80-item version of the PICTS created by James Kaufman for the layperson without a history of CJ involvement, the PICTS–Layperson Edition (PICTS-L; G. D. Walters, personal communication, March 2011). The PICTS-L item wording was altered so not to be specific to CJ-involved individuals (see the description of the Psychological Inventory of Criminal Thinking–Layperson Edition–Short Form [PICTS-L-SF] in the “Measures” section) and yielded the same criminal thinking style scales as the PICTS. The results revealed that the PICTS-L was composed of two primary factors, proactive criminal thinking (PCT) and reactive criminal thinking (RCT) that evidenced configural and factorial gender invariance. PCT is premeditated, intentional, and goal directed, whereas RCT is not premeditated and is impulsive (Walters, 2006). However, the psychometric properties of the short form of the layperson version of the PICTS have not been examined.
The purpose of the current study was to assess the psychometric properties and factor structure of a brief 35-item version of the PICTS-L (PICTS-L–Short Form [SF]) in a sample of college students without a history of CJ involvement (i.e., no reported misdemeanors or felonies), who may have engaged in illegal behavior. The PICTS-L-SF was modified from the PICTS-L and the items that were chosen correspond with the PICTS-SF. Consistent with previous studies (e.g., Walters et al., 2009; Walters, Hagman, & Cohn, 2011), we examined differences in model fit between one-factor (GCT), two-factor (PCT, RCT), and bifactor models (GCT; PCT, RCT). In addition, we hypothesized that each factor would evidence good reliability, and would be significantly positively associated with criminal attitudes, Antisocial Personality Disorder (ASPD) traits, and engagement in illegal and risky behaviors.
Method
Participants
The current sample consisted of 619 college students in the southwest United States who did not report a history of CJ involvement (i.e., no misdemeanor and/or felony charge). The participants ranged in age from 18 to 54 years (M = 19.29, SD = 2.67; 26 participants [4.2%] did not provide their age). Most the participants were female (n = 434, 70.1%) and 184 participants identified as male (29.7%), although one participant (0.2%) did not respond to this item. Although Caucasians (n = 442, 71.4%) composed much of the sample, other racial groups were represented in this sample as well, such as African Americans (n = 59, 9.5%), Hispanics/Latinos (n = 119, 19.2%), Native Americans (n = 7, 1.1%), Asian Americans (n = 20, 3.2%), and participants who identified themselves as “Other” (n = 7, 1.1%).
Measures
Demographic Questionnaire
A self-report demographic form was used to obtain information regarding participants’ age, gender, race/ethnicity, history of involvement with the CJ system (e.g., incarceration, misdemeanor, and felony offenses), and psychiatric history.
PICTS-L-SF
The PICTS-L-SF (Walters, 2006; Walters et al., 2009) is a 35-item, self-report assessment using a four-point ordinal response metric (1 = disagree, 2 = uncertain, 3 = agree, 4 = strongly agree). Congruent with the other versions of the PICTS, the purpose of the PICTS-L-SF is to assess thought patterns that are affiliated with criminal behavior (Walters, 2006). This shortened layperson version of the PICTS was developed by selecting the items on the PICTS-L (Walters et al., 2009) that corresponded to the items on the PICTS-SF. For example, the item “I have used alcohol or drugs to eliminate fear or apprehension before committing a crime” on the PICTS was reworded as “I have used alcohol or drugs to eliminate fear or apprehension before doing something risky” on the PICTS-L to allow for application to populations without CJ involvement. Higher scores indicate elevated criminal thinking. The psychometric properties of this scale are presented and discussed in the “Results” section.
Criminal Sentiments Scale–Modified (CSS-M)
The CSS-M (Wormith & Andrews, 1984) is a 41-item self-report assessment of “attitudes, values, and beliefs related to criminal behavior” (Wormith & Andrews, 1984). The CSS-M items are on a three-point ordinal metric response scale. The items are scored “0” if the participant endorses a prosocial statement or disapproves of an antisocial statement, “1” if the participant is undecided, and “2” if the respondent endorses an antisocial statement or disapproves of a prosocial statement (Simourd, 1997; Simourd & Olver, 2002). There are five subscales within the CSS-M: Attitude Toward the Law (Law), Attitude Toward the Court (Court), Attitude Toward the Police (Police), Tolerance for Law Violations (TLV), and Identification with Criminal Others (ICO; Simourd, 1997; Simourd & Olver, 2002; Simourd & van de Ven, 1999). The first three subscales are combined to make a broader subscale, Law-Court-Police (LCP), which identify attitudes toward both the legal and CJ system (Simourd & Olver, 2002). Higher scores indicate greater criminal attitudes. Many studies have demonstrated that the CSS-M is a reliable and valid tool when used with adult offenders, although it has not been normed in a nonoffender sample (Andrews, Wormith, & Kiessling, 1985; Roy & Wormith, 1985; Wormith & Andrews, 1984). Cronbach’s alphas for the CSS-M subscales as listed above are as follows: .74 (Law), .71(Court), .76 (Police), .74 (TLV), .56 (ICO), and .86 (LCP). The CSS-M total score yielded a Cronbach’s alpha of .89.
The Structured Interview for DSM-IV-TR Axis II Personality Disorders–Patient Questionnaire (SCID-II-PQ)
The SCID-II-PQ (First, Spitzer, Gibbon, Williams, & Benjamin, 1997) is a self-report adaptation of the clinical interview version of the assessment (i.e., the SCID-II). For this study, we only utilized the 31 items that assess ASPD symptoms. Participants could select “yes” if the question completely or mostly applied to them and “no” if the question did not apply to them. “Yes” responses were then summed to produce a total score where high scores represent higher ASPD symptoms. The internal constancy reliability for the SCID-II-PQ ASPD items in the current study was good, yielding a Cronbach’s alpha of .82.
Painful and Provocative Events Scale–Illegal Risk Behaviors (PPES-IRB)
The PPES-IRB (Mitchell, Jahn, & Cukrowicz, 2014) is a 10-item assessment of the frequency of engagement in risky or illegal behaviors. Responses include 1 = never, 2 = once, 3 = 2-3 times, 4 = 4-20 times, or 5 = more than 20 times. Scores were summed where higher scores indicate more frequent engagement in illegal or risky behaviors. These items mirrored wording used in the PPES (Bender, Gordon, Bresin, & Joiner, 2011) and the same response options as the PPES. The PPES-IRB included questions regarding driving after drinking alcohol, underage consumption of alcohol, use of illegal drugs, being in jail or prison, driving over the speed limit, other traffic infractions, sexual intercourse under the age of consent, and perpetrating sexual assault. See Mitchell et al. (2014) for more detail about the development of these items. Cronbach’s alpha was .82, which suggests good internal consistency.
Procedure
The participants were recruited from Introduction to Psychology courses at a large southwest university. The procedures were in accordance with an institution review board–approved protocol. There were no inclusion criteria for participation; however, participants with a history of CJ involvement were excluded in the current study. Participants were recruited via an online experiment registration portal. Students who choose to sign up for the study provided informed consent and answered all items anonymously through an online survey program. The measures following the demographic information form were presented in a random order to control for sequencing effects.
Results
Data Screening and Preparation
Participants’ responses were gathered online and exported directly to an SPSS-20 (IBM Corporation, 2011) data file without requiring manual data entry. The categorical confirmatory factor analyses (CFAs) were conducted using Mplus version 7.11 defaults (Muthén & Muthén, 1998-2012). Weighted least squares means and variances (WLSMV) estimation and delta parameterization were utilized in the categorical CFAs. WLSMV estimation allows fit indices to be calculated for categorical variables (Eaton et al., 2011).
SPSS-20 was used to conduct the validity analyses. Prior to calculating subscale and total scores, Little’s Missing Completely at Random Test (MCAR; Tabachnick & Fidell, 2007) was used to identify patterns of missing data. The results suggested that the data were MCAR, χ2(50,561, N = 619) = 18,627.12, p = 1.0, and only 0.83% of the data were missing. Because the data were MCAR, expectation maximization (EM) was used to impute missing data (Tabachnick & Fidell, 2007). The imputed scores were used to calculate subscale and total scores for the assessments.
Statistical Analyses
Categorical CFAs were conducted to examine the factor structure of the PICTS-L-SF in congruence with previous factor solutions (i.e., Walters et al., 2009; Walters et al., 2011). We utilized categorical CFAs as opposed to CFAs with continuous indicators because the PICTS-L-SF is comprised of ordinal metric response options, which are inherently categorical. Model fit was evaluated by examining the comparative fit index (CFI), Tucker–Lewis index (TLI), and the root mean squared error of approximation (RMSEA). Hu and Bentler (1999) suggest that a CFI or TLI greater than .95 indicates good model fit, .90 to .95 indicates borderline model fit, and less than .90 indicates poor model fit. In addition, an RMSEA value less than .06 indicates good model fit, .06 to .08 indicates fair model fit, .08 to .10 indicates borderline model fit, and greater than .10 indicates poor model fit (Hu & Bentler, 1999). Mplus difference tests (i.e., DIFFTEST) were used to compare fit across models (Muthén & Muthén, 1998-2012).
One-Factor Categorical CFA
The standardized pathways for the relations between the manifest (i.e., PICTS-L-SF items) and latent variable can be found in Table 1. The categorical CFA loadings were freely estimated based on the correlation matrix, and the variance of the latent variable (i.e., GCT) was constrained at unity. The GCT categorical CFA model had 560 degrees of freedom (df) indicating the model was testable. The one-factor GCT model yielded poor to fair model fit, χ2(560, N = 619) = 2,416.80, p < .001, CFI = .88, TLI = .87, RMSEA = .07 (90% CI = [.07, .08]), 140 free parameters.
Standardized Coefficients for the Two-Factor (PCT and RCT), the One-Factor (GCT), and the Bifactor Categorical CFA Models of the PICTS-L-SF
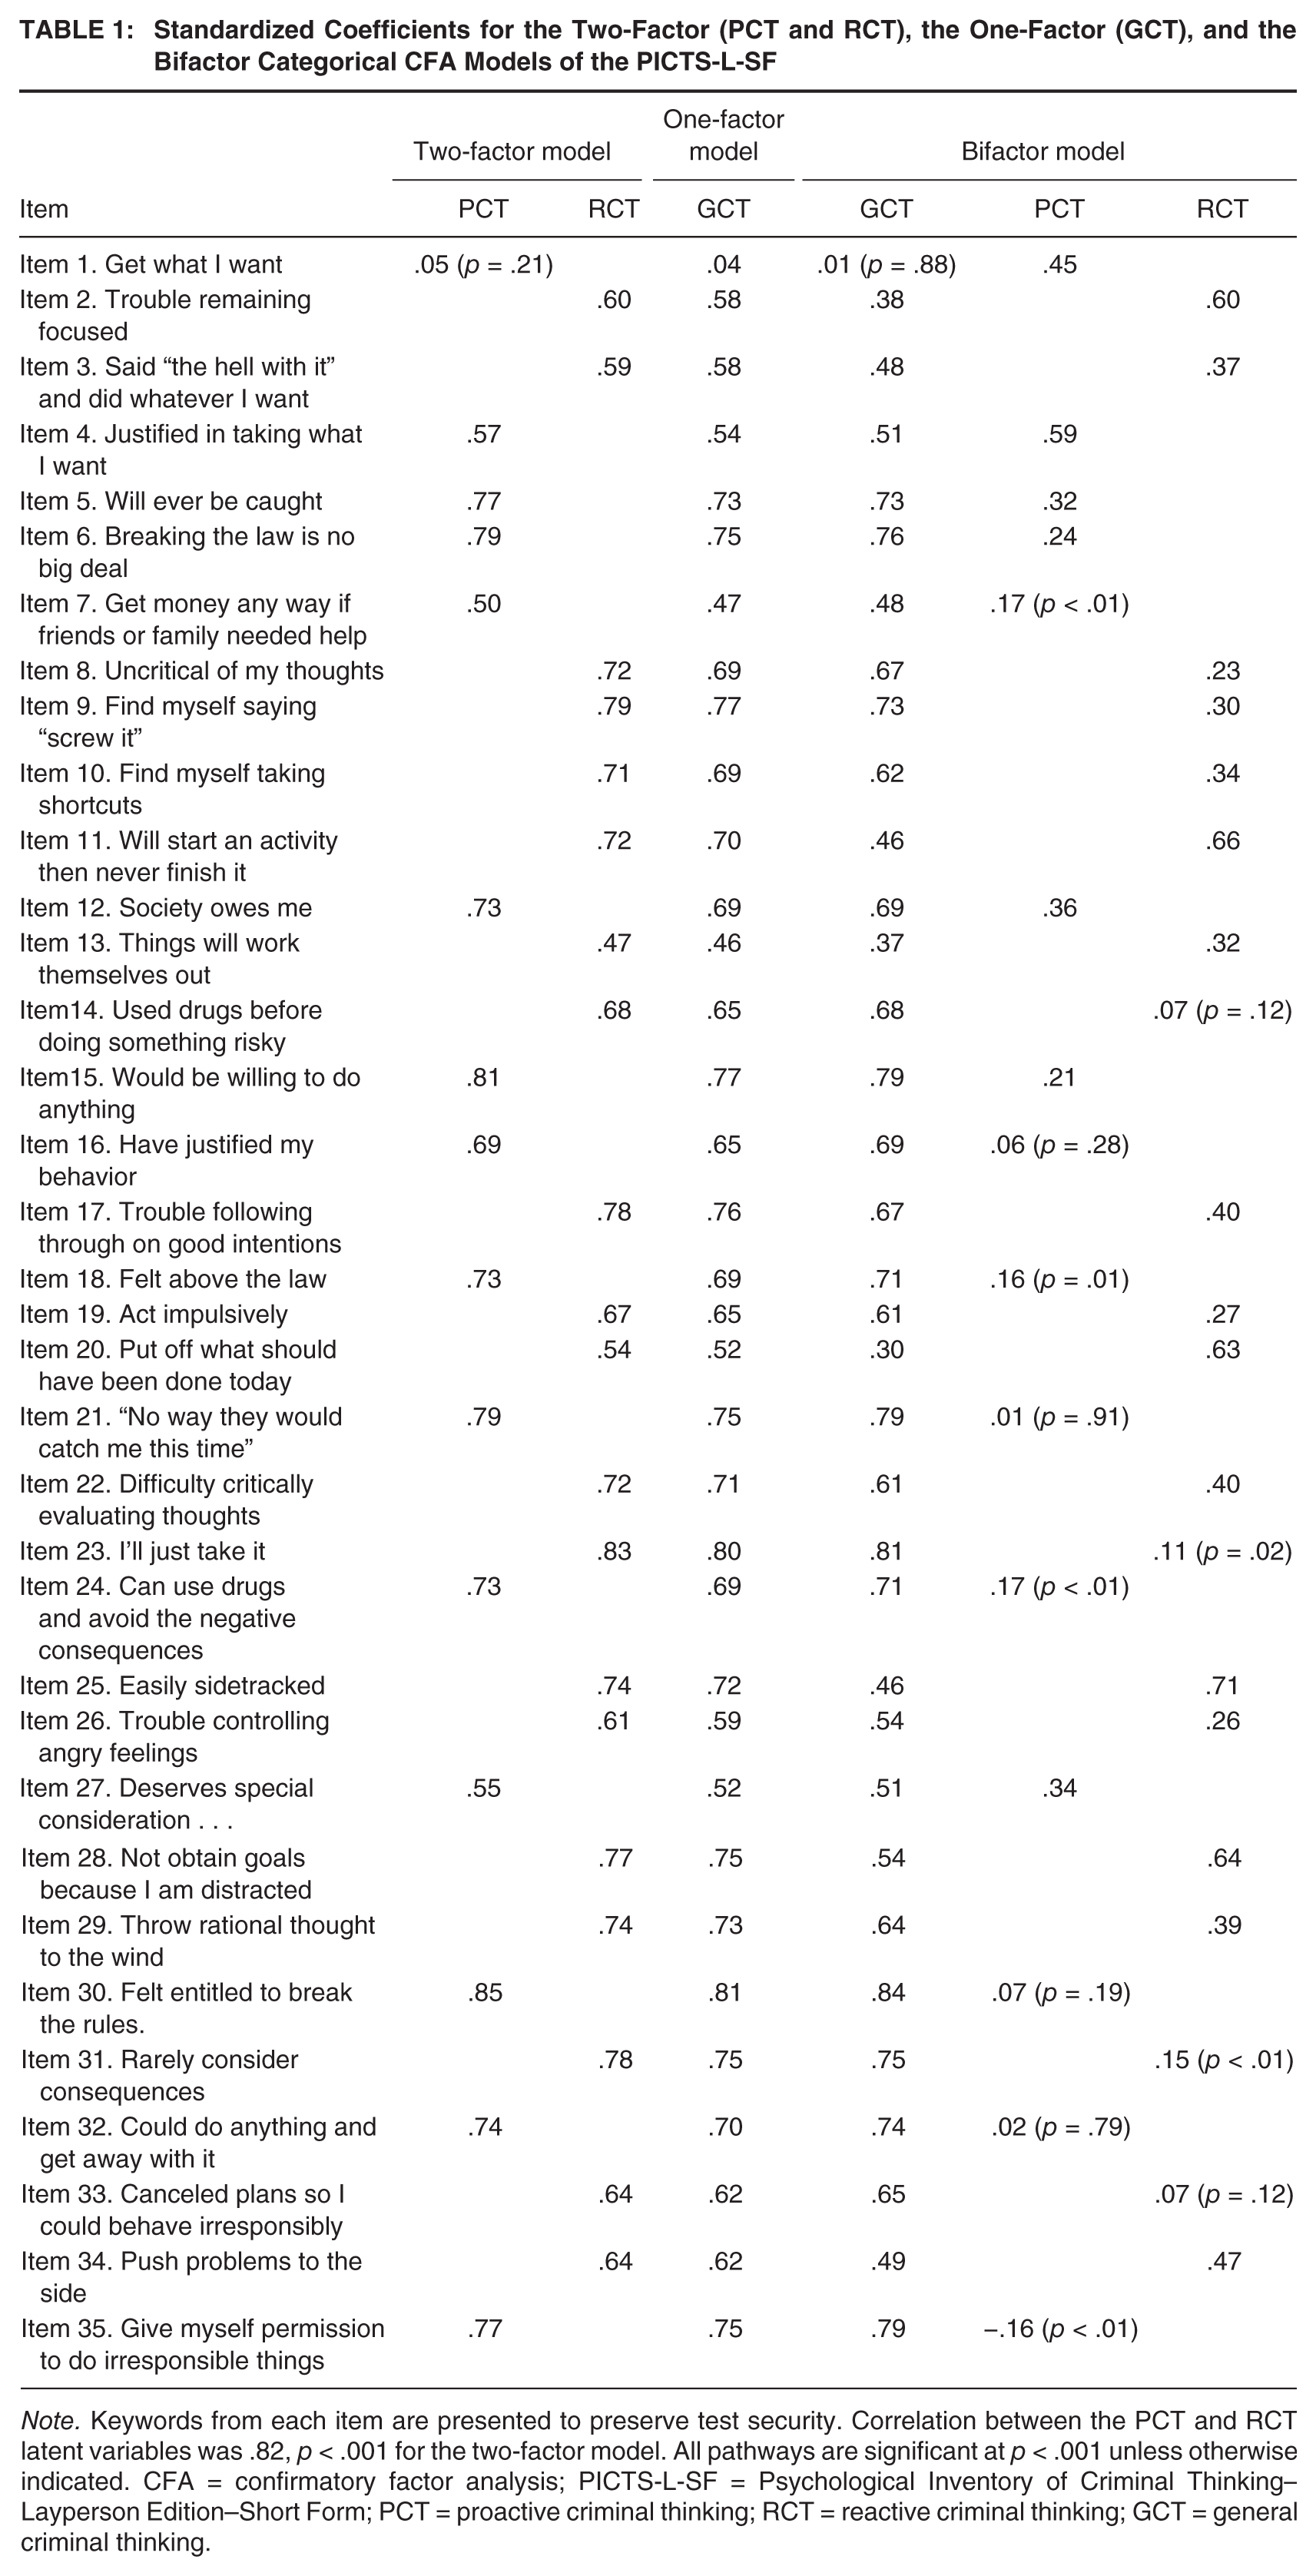
Note. Keywords from each item are presented to preserve test security. Correlation between the PCT and RCT latent variables was .82, p < .001 for the two-factor model. All pathways are significant at p < .001 unless otherwise indicated. CFA = confirmatory factor analysis; PICTS-L-SF = Psychological Inventory of Criminal Thinking–Layperson Edition–Short Form; PCT = proactive criminal thinking; RCT = reactive criminal thinking; GCT = general criminal thinking.
Two-Factor Categorical CFA
We also examined a two-factor model (i.e., PCT and RCT). The standardized pathways for the relations between the manifest and latent variables can also be found in Table 1. As in the previous categorical CFA, the loadings were freely estimated based on the correlation matrix and variances of the two latent variables were constrained at unity. The two-factor model was also testable with 559 df. The two-factor model fit yielded borderline to fair model fit, χ2(559, N = 619) = 2,031.77, p < .001, CFI = .90, TLI = .90, RMSEA = .07 (90% CI = [.06, .07]), 141 free parameters.
Bifactor Categorical CFA
Finally, we conducted a bifactor categorical CFA. The standardized pathways for the relationships between the manifest variables, CGT, PCT, and RCT are presented in Table 1. The loadings were freely estimated based on the correlation matrix, the variance for the latent variables was constrained at unity, and the latent variables were not allowed to correlate. The bifactor model was also testable with 525 df. The model fit yielded good model fit, χ2(525, N = 619) = 1,176.71, p < .001, CFI = .96, TLI = .952, RMSEA = .05 (90% CI = [.04, .05]), 157 free parameters.
Comparison of Model Fit
Due to the WLSMV estimation, we conducted a Mplus difference test to examine differences in fit between the different models (Muthén & Muthén, 1998-2012). The two-factor model (PCT and RCT) fit significantly better than the one-factor model (GCT), χ2(1, N = 619) = 126.02, p < .001. Therefore, the two-factor model was retained and compared with the bifactor model. The bifactor model fit significantly better than the two-factor model, χ2(34, N = 619) = 600.80, p < .001.Taken together, these results suggest that the bifactor model evidenced good fit and fit the data significantly better than the one- and two-factor models. 1
Reliability
Omega (ω) reliability coefficients (see Rodriguez, Reise, & Haviland, 2016, for review) were calculated using Microsoft Excel for GCT from the one-factor model (ω = .96), and for the PCT and RCT for the two-factor model (ω = .96, ω = .97, respectively). For the best fitting bifactor model, GCT, PCT, and RCT evidenced excellent reliability (ω = .97, ω = .94, ω = .96, respectively). In addition, we calculated Omega Hierarchical (ωH) and Omega Hierarchical Subscale (ωHS) for the bifactor model to examine the proportion of variance accounted for by the PCT and RCT factors beyond the GCT factor. Most of the reliable variance in the total scores was accounted for by GCT (ωH = .85). After controlling for the variance accounted for by the GCT, PCT accounted for 8% (ωHS = .08) of the variance that was not explained by GCT, and RCT accounted for 30% (ωHS = .30) of the variance not explained by GCT. Overall, these results suggest that GCT accounts for most of the variance in the items, RCT accounts for a moderate amount of variance, and PCT accounts for a small amount of variance.
Validity
Correlations and descriptive statistics are presented in Table 2. To evaluate the concurrent validity of the PICTS-L-SF, the GCT, PCT, and RCT scores were correlated with the scores from the CSS-M and the SCID-II-PQ ASPD scale. As hypothesized, GCT, PCT, and RCT were significantly (p < .001) positively correlated with the CSS-M scores and the SCID-II-PQ ASPD score.
Pearson’s r Correlations and Descriptive Statistics
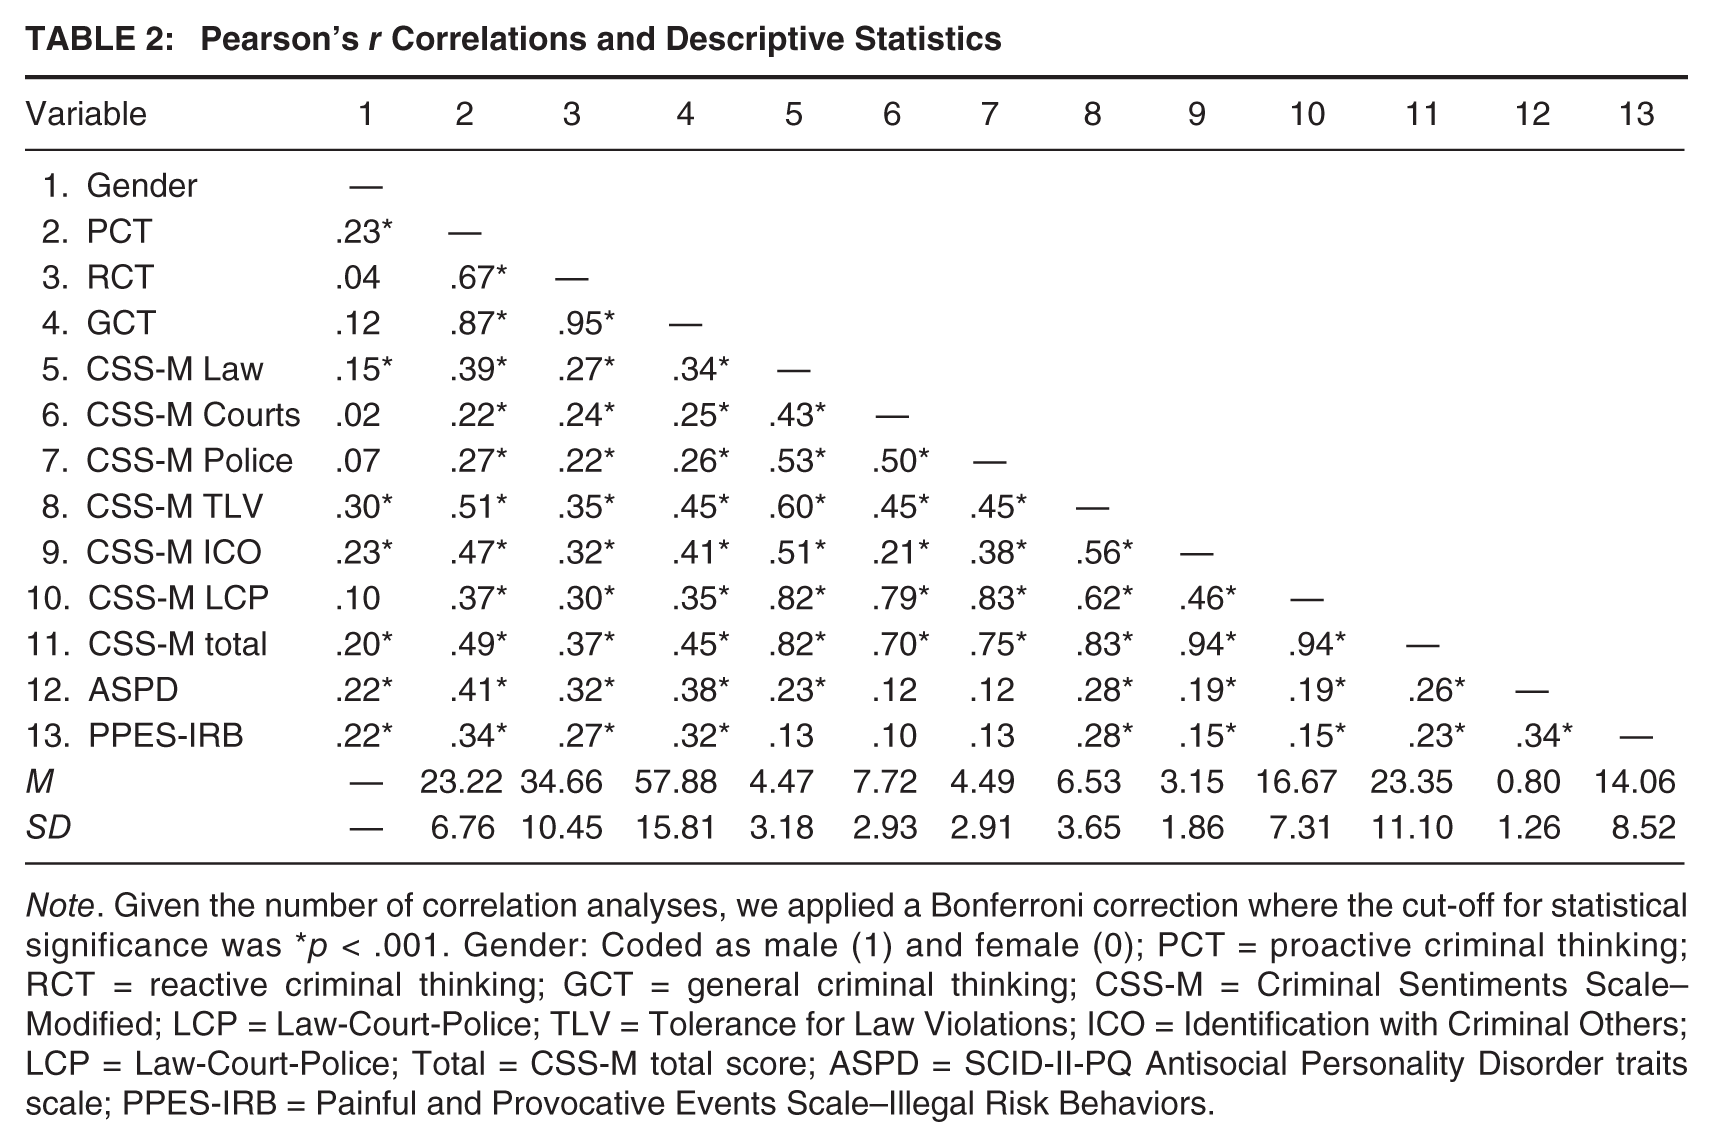
Note. Given the number of correlation analyses, we applied a Bonferroni correction where the cut-off for statistical significance was *p < .001. Gender: Coded as male (1) and female (0); PCT = proactive criminal thinking; RCT = reactive criminal thinking; GCT = general criminal thinking; CSS-M = Criminal Sentiments Scale–Modified; LCP = Law-Court-Police; TLV = Tolerance for Law Violations; ICO = Identification with Criminal Others; LCP = Law-Court-Police; Total = CSS-M total score; ASPD = SCID-II-PQ Antisocial Personality Disorder traits scale; PPES-IRB = Painful and Provocative Events Scale–Illegal Risk Behaviors.
Predictive validity of the PICTS-L-SF was assessed utilizing a bootstrapped regression analyses with 1,000 bootstrapped samples (see Table 3). The regression analyses were utilized to assess the relation between criminal thinking (i.e., GCT, PCT, RCT) and the frequency of engagement in illegal risk behaviors (i.e., PPES-IRBs score). We also adjusted for gender in the following analyses because it was significantly associated with the PPES-IRB score (r = .23, p < .001). Our hypothesis was also supported by these analyses. First, results indicated there was a significant positive relation between GCT and PPES-IRB scores after adjusting for gender (β = .30). Second, PCT and RCT were entered as simultaneous predictors of PPES-IRB scores after adjusting for gender. The analysis indicated that PCT (β = .22) and RCT (β = .16) were significantly and positively associated with PPES-IRB scores after adjusting for gender. These analyses suggest that individuals who are not CJ involved who are higher in criminal thinking (i.e., GCT, PCT, RCT) evidence more frequent engagement in illegal risky behaviors even after adjusting for variance accounted for by gender.
Bootstrapped Regression Results: The Relation Between Criminal Thinking and Illegal Risky Behaviors After Adjusting for Gender
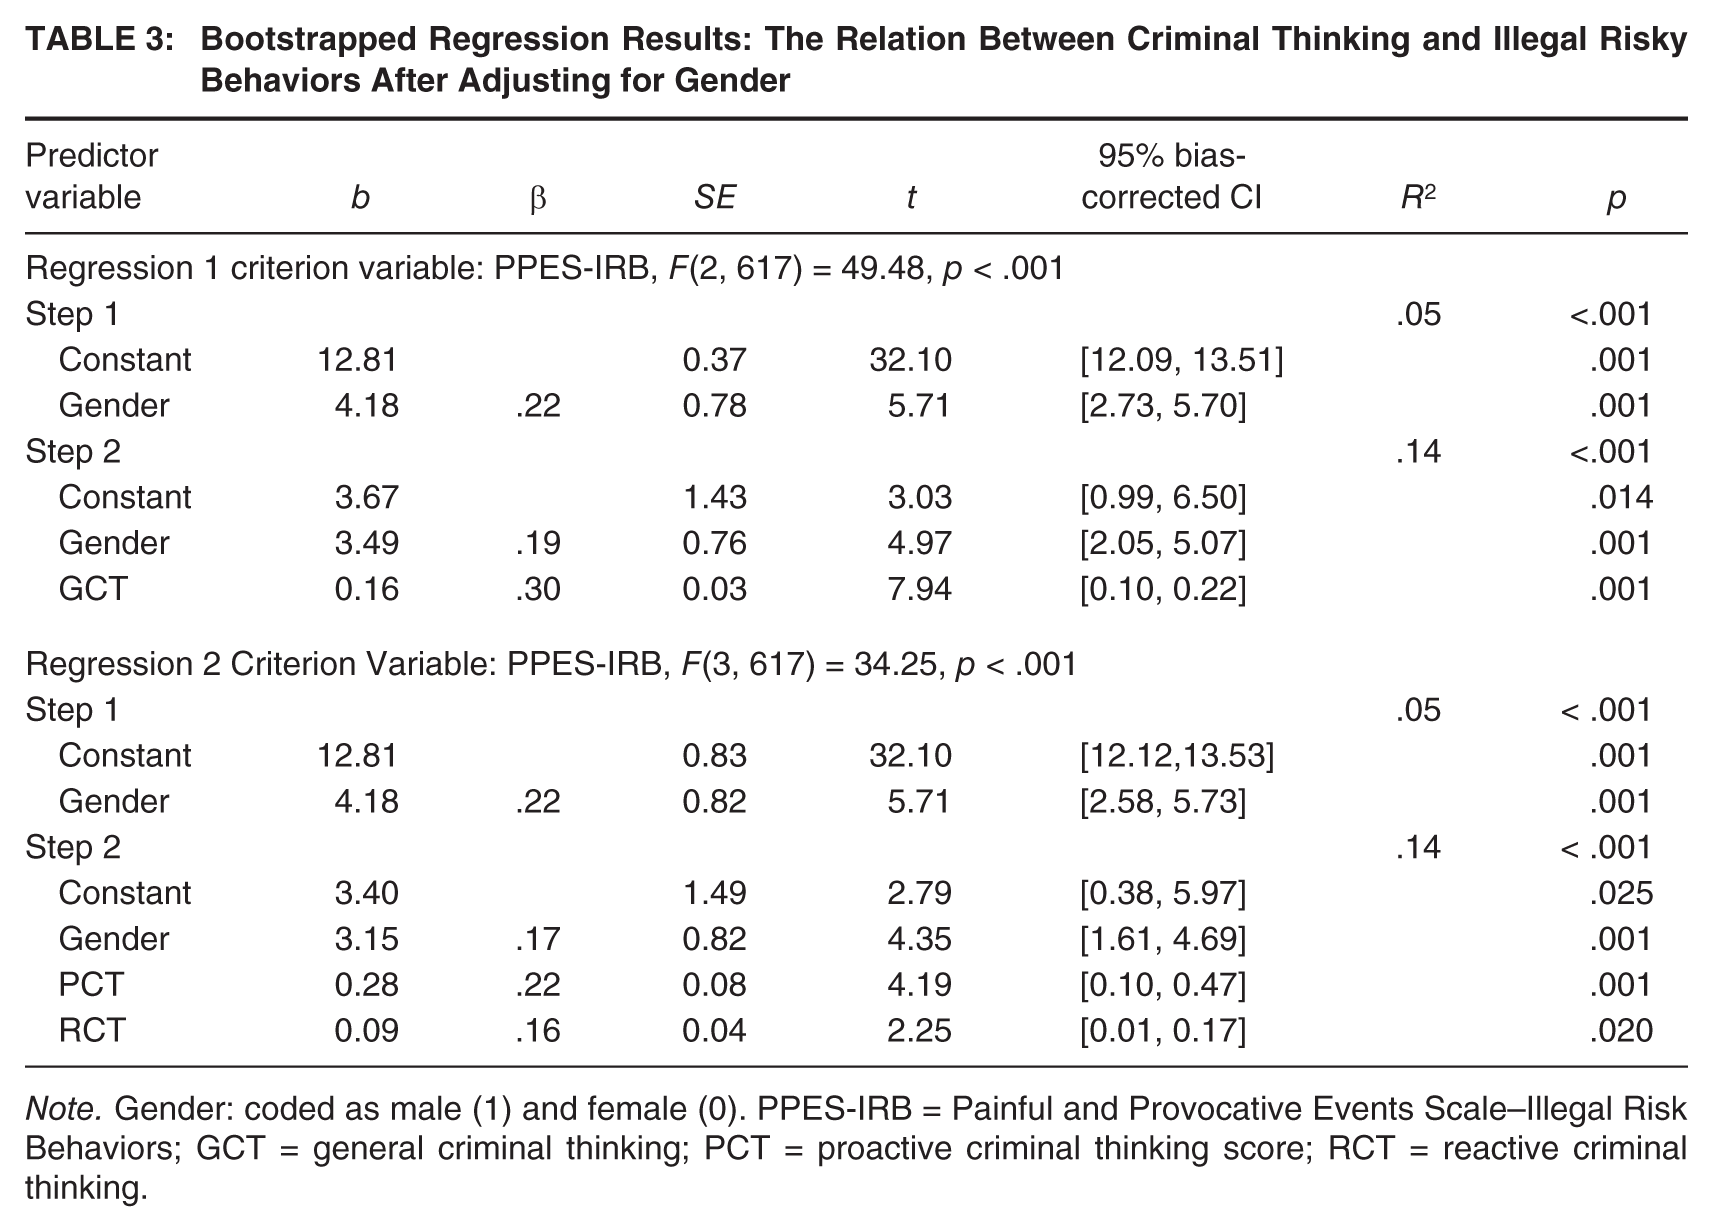
Note. Gender: coded as male (1) and female (0). PPES-IRB = Painful and Provocative Events Scale–Illegal Risk Behaviors; GCT = general criminal thinking; PCT = proactive criminal thinking score; RCT = reactive criminal thinking.
Discussion
The goal of this study was to assess the psychometric properties of the PICTS-L-SF in a sample of individuals without a history of CJ involvement. The results of the categorical CFAs indicated that the PICTS-L-SF evidenced good fit for a bifactor model, which fit the data significantly better than the one-factor (i.e., GCT) and two-factor (i.e., PCT and RCT) models. These results are consistent with previous PICTS results among college students (see Walters et al., 2009). However, previous research among male inmates did not support a bifactor model, but rather supported a second-order model (see Walters et al., 2011). As previously mentioned, PCT refers to premeditated, intentional, and goal-directed cognitive processes, and RCT refers to non-premeditated, and impulsive cognitive processes that are reactive to one’s situation (Walters, 2006). Taken together, these two scales produce an overall GCT score. The results from the bifactor model Omega Hierarchical Subscale suggest that GCT accounted for most reliable variance in total scores, whereas RCT accounted for a moderate amount of variance after adjusting for GCT, and PCT accounted for a small amount of variance. In addition, only 11% of the reliable variance in total scores may be a product of multidimensionality caused by the group factors (i.e., PCT and RCT). Rodriguez et al. (2016) suggest that this may indicate that the raw scores on the PICTS-L-SF likely reflect GCT and are moderately to minimally affected by multidimensionality caused by PCT and RCT. These results suggest that when using the PICTS-L-SF, it may be more appropriate to interpret the GCT scale rather than the PCT and RCT scales.
The concurrent validity of the PICTS-L-SF was assessed by examining the relation between PCT, RCT, and GCT, and assessments of criminal attitudes and ASPD traits. The results indicated that there was high concurrent validity between the PICTS-L-SF scales and criminal attitudes and ASPD traits. Predictive validity was also assessed by examining the relation between the PICTS-L-SF PCT, RCT, and GCT scores and frequency of engagement in illegal or risky behaviors after adjusting for gender. PCT, RCT, and GCT were significantly positively related to the frequency of engagement in illegal and risky behaviors among individuals without a history of CJ involvement. Taken together, these findings indicate promising psychometric properties for the PICTS-L-SF.
Although this study provided the first psychometric evaluations of the short form of the layperson version of the PICTS, it is important to note that this study consisted exclusively of college students enrolled at a university located in the southwestern United States; therefore, it is not appropriate to assume that these results will generalize to other populations (e.g., different geographic locations, different ages, noncollege students). Future research should consider using different populations to address this limitation. Furthermore, given that our sample was primarily female, future studies with a more equivalent number of male and female participants should examine gender invariance of the PICTS-L-SF factor structure. Although using a college student sample allowed us to conduct an initial evaluation of the PICTS-L-SF, it may be beneficial to assess the properties of the PICTS-L-SF in other populations that are at risk of becoming involved in the CJ system who may or may not be CJ involved (e.g., persons with mental illness, people who are unemployed, people who are homeless; Draine, Salzer, Culhane, & Hadley, 2002; Teplin, 1984; White, Chafetz, Collins-Bride, & Nickens, 2006). In addition, further exploration of the applicability of the PICTS-SF versus the PICTS-L-SF items should be directly compared, in efforts to provide clearer data on the effectiveness of these measures in samples of individuals who do not have a history of criminal behavior or CJ involvement. Finally, although PCT and RCT demonstrated predictive validity, we did not demonstrate differential predictive validity (i.e., that PCT and RCT relate differently to other variables). Therefore, future research should examine the association between PCT and RCT, and variables that may be differentially related to each (e.g., impulsivity, problem-solving skills, types of illegal or risky behaviors that may be unique to PCT or RCT).
Despite the limitations, the current findings provide valuable information for researchers and clinicians alike, given that the implications for these areas overlap. When examining criminal thinking, it is important to identify the nuances between those who truly are criminals and those who simply engage in occasional antisocial behavior. Current measures do not allow for this comparison; thus, we are left with higher versus lower scores on measures (such as the PICTS) for individuals who are CJ involved with no real understanding of how these scores should be interpreted for non-CJ–involved populations. Developing a layperson version of the PICTS allows researchers to better conceptualize cognitive processes that are associated with risk of criminal offending, and separates those with criminal thinking from the laypersons who are at lower risk of antisocial behavior. In addition, the wording of the PICTS-L-SF may be more appropriate for research utilizing non-CJ–involved samples. For example, the PICTS-L-SF does not assume that participants have a criminal history, whereas the PICTS does; therefore, participants may be able to answer items on the PICTS-L-SF with less confusion. Moreover, the PICTS-L-SF provides a unique opportunity to replicate previous research that utilized the PICTS among non-CJ–involved individuals (e.g., Gross & Morgan, 2013). This will allow researchers examine whether criminal thinking scores were a product of the assessment used or the underlying constructs. Furthermore, the PICTS-L-SF is 45 items shorter than the full PICTS, which decreases participant burden and may increase participant retention.
Given the significance of criminal thinking as a criminal risk factor (see Andrews & Bonta, 2010), the development of a layperson version of the PICTS is also an important development for clinicians. Specifically, a common misconception of CJ-involved individuals is that most people think like they do. In other words, they often do not understand that how they think is different from non-CJ–involved individuals and that their way of thinking places them at increased risk of CJ involvement. In fact, showing offenders their PICTS profile in treatment settings often elicits comments along the lines of “give that questionnaire to people on the streets, and they’ll have similar elevations,” and this perceived defense mechanism cannot be scientifically refuted, as we have no such comparison base. The development of the PICTS-L-SF allows for such a comparison to be made and arms clinicians with valuable information for refuting CJ-involved individuals’ defenses (i.e., by providing greater clarity about how they are unique in their cognitive processes). Notably, development of the PICTS-L-SF is also important for non-CJ–involved populations, as it is plausible that subclinical elevations on PICTS profiles may be informative for other, noncriminal, yet maladaptive, behaviors.
In conclusion, the results of this study provide promising results for the development of a shortened layperson version of the PICTS that will likely be of value to CJ researchers and clinicians alike, and that may also transcend beyond traditional CJ lines and inform clinicians with non-CJ–involved clients’ areas of cognitive processes that impede therapeutic progress or lead to eventual CJ involvement or other risky behaviors.
Footnotes
Acknowledgements
We would like to thank Andrew J. Marshall, MA, for providing consultation regarding the statistical analyses. Opinions expressed in this article are those of the authors and do not necessarily represent the opinions of the Federal Bureau of Prisons or the Department of Justice.