
Abstract
In Colorado, evaluators conducting sex offender risk assessments are required to assess 17 risk factors specified by the state’s Sex Offender Management Board (SOMB), in addition to scoring actuarial risk assessment instruments. This study examined the association between instrument scores, the 17 SOMB risk factors, and evaluator opinions concerning risk and need for containment in 302 Colorado cases. Evaluators’ ratings of risk indicated by noninstrument factors were often higher than their ratings of risk indicated by instrument results, but only their ratings of noninstrument factors were independently predictive of containment recommendations. Several of the most influential noninstrument factors (e.g., denial, treatment motivation) have been described by researchers as potentially misleading because they are not predictive of future offending. Findings highlight the need for more studies examining the validity of what risk assessment evaluators actually do, as opposed to what researchers think they should do.
Introduction
Evaluators conducting risk assessments collect and review a substantial amount of information. It is common practice for evaluators to interview the offender for several hours and review all available criminal, correctional, law enforcement, and treatment records (see Jackson & Hess, 2007; Viljoen, McLachlan, & Vincent, 2010). Offender records may be hundreds or even thousands of pages long, and interviews cover a broad range of topics during risk assessment interviews. Many evaluators also administer one or more risk assessment instruments. But how do evaluators use this vast array of information to come to a conclusion about the offender’s level of risk? Do they consistently favor some types of information over others?
In many risk assessment contexts, results from standardized risk assessment instruments are the strongest known predictors of future violence, outperforming unstructured decision-making approaches (Guy, 2008; Hanson & Morton-Bourgon, 2009). Although this has been a generally consistent finding across studies, clinicians rarely base their opinions on instrument results alone (Vrieze & Grove, 2009). In a survey of 109 evaluators who had used the Static-99R (Helmus, Thronton, Hanson, & Babchishin, 2012) in sex offender risk assessment cases, only one evaluator reported basing his/her risk opinion entirely on the basis of the Static-99R results (Chevalier, Boccaccini, Murrie, & Varela, 2015). Instead, most reported that the Static-99R results had either some (49%) or a lot (42%) of influence on their risk decisions.
When evaluators are required to use specific measures, some report scoring them diligently and using the results for decision making, but just as many report scoring them as a formality and basing their decisions on other factors (Miller & Maloney, 2013). In one recent field study, researchers found that probation officers overrode risk-level ratings in 74% of cases involving sexual offenders, concluding that the offender’s level of risk differed from that indicated by the instrument score (Schmidt, Sinclair, & Thomasdόttir, 2016). In each of these cases, they used the override to increase the offender’s risk-level classification. Another recent field study found that evaluators used risk instrument overrides in 33% of sex offender cases, with 57% of these overrides being used to increase risk and 43% used to decrease risk (Storey, Watt, Jackson, & Hart, 2012). On the Level of Service/Case Management Inventory (LS/CMI; Andrews, Bonta, & Wormith, 2010), an instrument with a built-in override option, evaluators overrode risk scores to increase risk more often than to decrease risk (14.9% increase vs. 1.6% decrease), especially for sexual offenders (33.5% increase vs. 1.6% decrease). These overrides lead to a decrease in predictive validity (Storey et al., 2012; Wormith, Hogg, & Guzzo, 2012).
Although the override rates varied across these studies, it appears to be common practice for evaluators to override risk instrument results in some cases, and that evaluators tend to use overrides to increase as opposed to decrease the offenders’ level of risk. These studies did not address evaluators’ reasons for using overrides, but in the context of risk assessment, overrides to increase risk may be a product of evaluators protecting themselves from liability (Guy, Nelson, Fusco-Morin, & Vincent, 2014). The pattern of overrides in these studies suggest that evaluators are more concerned about failing to identify truly dangerous offenders (false negatives) than identifying nondangerous offenders as dangerous (false positives).
It also appears to be common practice for evaluators to use more than one risk assessment instrument in each case. Evaluators administer as many as 15 different risk assessment instruments to the same offender in risk assessment cases, with an average of about four instruments per case (Neal & Grisso, 2014). The overall picture of contemporary risk assessment practice seems to be one in which evaluators administer multiple instruments, collect a significant amount of additional information through interviews and records reviews, and attempt to integrate all or parts of this information to come to a single conclusion about risk. This integrated approach raises questions about the type or types of information that have the strongest influence on evaluator opinions, and whether those factors are those with the most empirical support.
Predictors of Evaluator Opinions in Risk Assessment Cases
Few studies have examined the association between risk assessment instrument scores and evaluators’ opinions, especially when considered alongside other offender and case characteristics. In an early study, insanity acquittees’ scores on the Violence Risk Appraisal Guide (VRAG; Quinsey, Harris, Rice, & Cormier, 1998) were not significantly associated (r = −.06) with clinicians’ security level placement recommendations (Hilton & Simmons, 2001). Instead, evaluators’ recommendations were associated with the acquittees’ institutional behavior, medication use, preindex criminal history, and physical attractiveness. In a recent follow-up, VRAG and Psychopathy Checklist–Revised (PCL-R; Hare, 2003) scores were both significantly correlated (r = .33 to .47) with clinician and multidisciplinary clinical team recommendations to detain (as opposed to transfer) forensic patients, suggesting a possible increase in the association between instrument scores and evaluator opinions over time (Hilton, Simpson, & Ham, 2016).
Other more recent studies have also reported a stronger association between risk instrument scores and evaluator opinions. In the most comprehensive study, researchers coded 27 different offender, offense, and mental health variables from sexually violent predator (SVP) evaluation reports to identify factors that were predictive of evaluators’ civil commitment recommendations (Levenson & Morin, 2006). The evaluators scored offenders on the Static-99 (Hanson & Thornton, 2000), Minnesota Sexual Offender Screening Tool–Revised (MnSOST-R; Epperson et al., 1998), and PCL-R. Scores on each of the three instruments were predictive of commitment recommendations, even after controlling for the other offense, offender, and mental health variables. But several noninstrument variables also predicted commitment recommendations, including paraphilia diagnoses, victim age, and offender race.
The belief that someone scoring in the high-risk range on multiple risk assessment instruments is at a higher risk for reoffending than someone scoring in the high-risk range on fewer measures does not appear to be limited to SVP evaluations. In a large study of parole suitability decisions, offenders’ scores on the Historical, Clinical, Risk Management-20 (HCR-20; Webster, Douglas, Eaves, & Hart, 1997), LS/CMI, and PCL-R were each independently predictive of evaluators’ opinions of overall risk (Guy, Kusaj, Packer, & Douglas, 2015). The finding that multiple instrument scores predicted evaluator opinions and recommendations is interesting when considered alongside research suggesting that combining results from different measures does not lead to more accurate predictions than those based on the results of the best performing measure alone (Seto, 2005).
Together, findings from these three evaluator opinion studies provide only a limited view of the role of risk instrument scores in evaluator decision making. Only one study examined evaluators’ opinions of risk (Guy et al., 2015), the criterion that risk measures are designed to address. But that study focused on only instrument scores, as opposed to other factors that might predict risk opinions. The other studies examined evaluators’ placement or SVP commitment recommendations, which may have rightfully been influenced by factors other than risk instrument results (Hilton & Simmons, 2001; Levenson & Morin, 2006). For example, SVP commitment statutes require evaluators to consider whether the offender has a mental or behavioral abnormality, often conceptualized as a diagnosis (e.g., paraphilia; DeMatteo, Murphy, Galloway, & Krauss, 2015). Although it is important to study placement and commitment recommendations—because these are the types of referral questions evaluators are required to address—it is also important to study evaluator opinions of future risk. It seems likely that evaluators come to a conclusion about risk before coming to a conclusion about the referral question (e.g., commitment, placement). The field would benefit from studies that provide an examination of both risk opinions and referral question recommendations, which would allow for a more comprehensive picture of the role of risk instrument scores in evaluator decision making.
Risk and Placement Recommendations in Colorado Psychosexual Evaluations
In Colorado, each offender convicted of a sexual offense must undergo a psychosexual evaluation (sometimes referred to as a sex offense–specific evaluation) to provide the court with information that will be used for sentencing decisions. These evaluations provide a useful context for studying the role of risk assessment instrument scores in evaluator decision making. The Colorado Sex Offender Management Board (SOMB) was created pursuant to legislation passed by the Colorado General Assembly in 1992 (Section 16-11.7-101 through Section 16-11.7-107 C.R.S) to establish standards and guidelines for assessment, treatment, and behavioral monitoring of sexual offenders. Section 2.000 of the Colorado SOMB Standards and Guidelines outlines the standards for mental health sex offense–specific evaluations (SOMB, 2011, p. 17). These standards require evaluators to use risk assessment instruments for these evaluations, “to ensure the most accurate prediction of risk for sexual offenders” (SOMB, 2011, p. 23). The SOMB does not require specific measures, but does provide a list of possible measures, including the Static-99R, VRAG, and Sex Offender Risk Appraisal Guide (SORAG; Quinsey et al., 1998, 2006). The SOMB also cautions evaluators against overreliance on risk measure scores: “Evaluators shall incorporate all available information when making a determination regarding risk and not rely solely on risk assessment instruments. Risk assessment instruments will not identify all risk factors” (SOMB, 2011, p. 32).
The SOMB standards state an evaluator “shall consider” a list of additional factors for estimating an offender’s level of risk (see Table 1; SOMB, 2011, p. 25). These factors include some of the most well-known predictors of future sexual offending, but also some factors with questionable validity. For example, the SOMB asks evaluators to consider sexual deviance, prior offending, and antisocial traits, which are among the strongest predictors of future sexual offending (Hanson & Morton-Bourgon, 2005). But other factors on this list, such as denial and motivation for treatment, have been described by researchers as “potentially misleading” risk factors because they are not predictive of future offending (Hanson & Morton-Bourgon, 2005, p. 1158). For example, the association between denial and sexual recidivism was only d = .02 in the most recent meta-analytic review (Hanson & Morton-Bourgon, 2005). Although some more recent studies have found at least partial support for denial as a predictor of recidivism (e.g., Nuñes et al., 2007), others have found that offenders who were more likely to deny their level of risk were actually less likely to reoffend than other offenders (e.g., Harkins, Beech, & Goodwill, 2010).
The 17 SOMB Risk Factors and Proposed Sources of Data
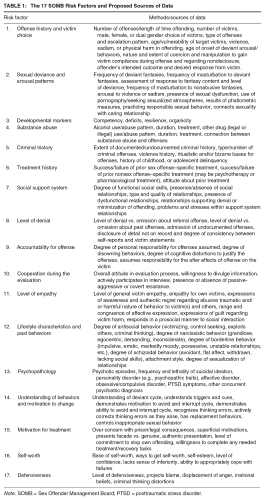
Note. SOMB = Sex Offender Management Board; PTSD = posttraumatic stress disorder.
Despite these findings, denial continues to be included as a risk factor on structured risk assessment measures, including the Sexual Violence Risk-20 (SVR-20; Boer, Hart, Kropp, & Webster, 1997) and the Risk for Sexual Violence Protocol (Hart et al., 2003). Although global scores on these measures are associated with sexual recidivism, few studies have examined the predictive validity of individual items. For the SVR-20, the most thorough item validity study found that all but two of the items were predictive of reoffending, with one of the nonpredictive items being extreme minimization or denial (area under the curve [AUC] = .49; Rettenberger, Boer, & Eher, 2011).
In several instances, it is difficult to determine whether or not there is empirical support for a factor listed and defined by the SOMB. For example, the Offense History and Victim Choice factor asks evaluators to consider the number of prior offenses and victims, which are predictive of future offending, but also victim sex and harm, which are not (Hanson & Morton-Bourgon, 2005). For the psychopathology factor, the SOMB asks evaluators to consider a broad array of symptoms, ranging from psychosis to suicidality to personality disorders. There are some documented associations between personality traits and future offending, such as the moderate association between scores on the PCL-R and sexual offending (Hawes, Boccaccini, & Murrie, 2013), but research does not suggest a clear association between other types of psychopathology and sexual recidivism. For example, offenders with paraphilia diagnoses have been found to be more likely to recidivate than other offenders in some studies (Kingston, Olver, Harris, Wong, & Bradford, 2015), but not others (Harris, Boccaccini, & Rice, in press; Moulden, Firestone, Kingston, & Bradford, 2009). Another study suggests a more nuanced pattern of association between diagnostic disorders and recidivism. Specifically, offenders who had been diagnosed with paraphilic disorders were no more likely to recidivate than other sex offenders, but those with both a personality disorder and paraphilia diagnosis were more likely to recidivate than any other group of offenders (Abracen & Looman, 2006).
Current Study
In the current study, we examine the association between risk assessment results, evaluator risk opinions, and evaluator containment/placement recommendations (i.e., prison, probation, or release) among 302 sexual offenders undergoing psychosexual evaluations in Colorado.
Colorado evaluators are required to consider the risk factors outlined by the SOMB (Table 1), but they are not required to provide the type of factor-by-factor risk ratings used by the evaluators in this study. Although focusing on evaluators from one agency may limit the generalizability of our study findings, the agency-wide practice of separately rating each risk factor provides a unique opportunity to examine evaluator decision making in sex offender risk assessment cases. Because the evaluators rated each offender on each risk factor, we do not have to make subjective decisions about evaluator-implied risk from lengthy written statements or omit cases when the evaluator did not write about a specific risk factor. To our knowledge, this is the first comprehensive field study of evaluator decision making in which evaluators’ perceptions of risk factors are not based on a researcher-derived subjective coding process.
Method
Evaluation Sample
We coded 302 de-identified sex offender psychosexual evaluation reports conducted by clinicians (N = 7) working for the same forensic assessment practice. The evaluations described in these reports were completed between 2008 and 2013 and represent all of the evaluations completed by the agency evaluators during this timeframe. To provide some context for these numbers, the agency conducted 52 psychosexual evaluations in 2008. Every individual convicted of a sexual offense is required to undergo a psychosexual evaluation in Colorado. There were 932 sexual offense convictions in the state of Colorado in 2008 (Office of Research & Statistics, 2011). Thus, the evaluations in this study likely represent approximately 6% of the psychosexual evaluations conducted in Colorado. There are several other agencies in Colorado that provide evaluation services, and evaluations may also be conducted by private practice evaluators who have been certified in accordance to the standards and guidelines of the SOMB.
Offenders
The offenders ranged in age from 17 to 68 years (M = 35.55, SD = 12.92). Most of the offenders were male (n = 296, 98.0%). 1 Only 21.8% (n = 66) of the reports provided information about the offender’s race and/or ethnicity. Data from these reports indicated that the most common race/ethnic groups represented in the sample were Caucasian (n = 31, 46.9%), African American (n = 24, 36.3%), and Hispanic (n = 8, 12.1%) defendants.
Among the offenders in the sample, the most common sexual offense was Failure to Register as a Sex Offender (n = 54, 17.8%), followed by Attempted Sexual Assault of a Child (n = 43, 14.2%), Sexual Assault of a Child (n = 34, 11.3%), and Sexual Contact—No Consent (n = 19, 6.3%). In total, there were 18 types of offenses represented in the sample. Many of the offenders in the sample had recent nonsexual charges, but a record of past sexual offenses (n = 77, 25.5%). Of these offenders and offenders charged with Failure to Register (n = 171, 56.6%), the most common past sexual offenses were Sexual Assault of a Child (n = 43, 25.1%), followed by Rape (n = 22, 12.9%) and Attempted Sexual Assault of a Child (n = 16, 9.4%).
Evaluators
The seven evaluators (five female, two male) were master’s level clinicians certified as Full Operating Evaluators by the Colorado SOMB. Certification requires licensure (i.e., psychology, social work), 80 hr of sex offender specific training, completion of 40 sex offense–specific evaluations over the past 5 years, and registration as a sex offender treatment provider (which requires 1,000 hr of clinical experience). Six of the evaluators were MA-level psychologists and one was an MA-level social worker. The agency employing these seven clinicians focused exclusively on sex offender risk assessments. Most evaluations occurred at local jails, although offenders who were not in custody were evaluated at the agency office. Nearly all of the evaluations were court ordered.
Measures
SOMB Risk Factors
Evaluators rated offenders on each of the 17 SOMB risk factors outlined in Table 1. The evaluators provided a separate risk-level rating for each of the 17 factors using a five-category scale: 1 = Low, 2 = Low-Moderate, 3 = Moderate, 4 = Moderate-High, and 5 = High. There are no scoring rules for assigning risk-level ratings for these 17 factors. The ratings are based on clinical judgment.
Static-99
The Static-99 is a 10-item measure designed to measure likelihood of sexual recidivism (Hanson & Thornton, 2000). Static-99 items are based on static, historical factors about the offender and his/her offenses, such as the number of prior offenses, offender’s age, and victim characteristics. The developers of the Static-99 selected items on the basis of empirical relationships with recidivism. Evaluators report Static-99 scores as falling into one of four categories of risk: Low (scores 0 to 1), Low-Moderate (scores 2 and 3), Moderate-High (scores 4 and 5), and High (scores 6 and above). In reports available for this study, evaluators reported the offender’s risk category, but did not report a score. Table 2 provides descriptive statistics for Static-99 and other risk assessment instruments.
Descriptive Statistics for Clinicians Ratings of SOMB Risk Factors and Actuarial Measure Results
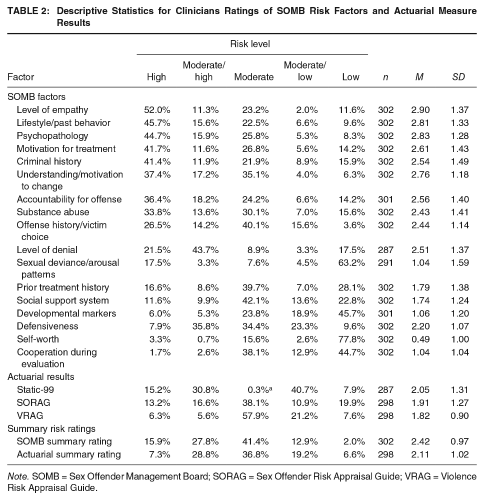
Note. SOMB = Sex Offender Management Board; SORAG = Sex Offender Risk Appraisal Guide; VRAG = Violence Risk Appraisal Guide.
VRAG
The VRAG is a 12-item measure designed to predict the likelihood of violent recidivism (Quinsey et al., 1998). VRAG items are based on static and historical factors such as alcohol-related problems, marital status, and victim injury, as well as the results of testing for psychopathy (e.g., PCL-R). Evaluators reported VRAG scores as falling into one of nine risk categories: Category 1 (scores below −22), Category 2 (scores −21 to −15), Category 3 (scores −14 to −8), Category 4 (scores −7 to −1), Category 5 (scores 0 to 6), Category 6 (scores 7 to 13), Category 7 (scores 14 to 20), Category 8 (scores 21 to 27), and Category 9 (scores above 28). They did not report raw VRAG scores.
According to the VRAG manual, Categories 1 to 3 are classified as Low, Categories 4 to 6 are classified as Medium, and Categories 7 to 9 as High. The evaluators in this study classified VRAG scores using the same five-category rating system that they used for all SOMB factors: 1 = Low, 2 = Low-Moderate, 3 = Moderate, 4 = Moderate-High, 5 = High. Evaluators described scores of 3 and 4 as Low-Moderate, and scores of 6 and 7 as Moderate-High.
SORAG
The SORAG, a modification from the VRAG, is a 14-item measure designed to predict the likelihood of sexual recidivism (Quinsey et al., 1998). The SORAG shares 10 items with the VRAG including static and historical factors, as well as a PCL-R score, similar to the VRAG, but also includes sex offense–specific items such as whether the victim(s) are all female and under the age of 14 years, and phallometric test results regarding sexual deviancy. Evaluators reported SORAG scores as falling into one of nine risk categories: Category 1 (scores below −10), Category 2 (scores −9 to −4), Category 3 (scores −3 to 2), Category 4 (scores 3 to 8), Category 5 (scores 9 to 14), Category 6 (scores 15 to 19), Category 7 (scores 20 to 24), Category 8 (scores 25 to 30), and Category 9 (scores above 31). They did not report raw SORAG scores. As with the VRAG, the evaluators classified SORAG scores using the same five-category rating system (1 = Low, 5 = High) that they used for all SOMB factors.
PCL-R
The PCL-R is a 20-item, clinician-scored measure of psychopathic traits (Hare, 2003). PCL-R scores are moderate predictors of sexual and violent recidivism among sexual offenders (Hawes et al., 2013). The SOMB recommends using the PCL-R as a measure of psychopathology (see Table 1), as opposed to actuarial risk, but evaluators use PCL-R results when scoring the VRAG and SORAG. We used PCL-R results in supplemental analyses aimed at exploring the association between evaluators’ psychopathology ratings and risk. Evaluators reported PCL-R results as percentiles, which we converted to raw scores. The mean PCL-R score among the 300 offenders with a score was 16.63 (SD = 7.28), which falls in the 28th percentile for adult male offenders.
Summary Risk Ratings
Evaluators’ reports included two summary risk ratings: One based on the evaluator’s opinion of the level of risk indicated by actuarial assessment results (Static-99, VRAG, SORAG) and one based on the evaluator’s opinion of the level of risk indicated by the 17 SOMB factors. The evaluators reported summary risk ratings using the five-category risk scale: Low, Low-Moderate, Moderate, Moderate-High, and High (see Table 2).
Containment Recommendation
Evaluators concluded their reports with a recommendation for placement/containment. These recommendations can fall into three categories ranging from least to most restrictive: no containment, community corrections, and department of corrections. Nearly all evaluations (n = 301; 99.7%) recommended some form of containment, and recommendations were for either community corrections (n = 161; 53.3%) or department of corrections (n = 140; 46.4%). We expected evaluators’ containment recommendations to be more strongly influenced by the SOMB ratings, which allow room for clinical judgment and may provide justification for overrides, than the actuarial risk ratings.
Procedure
Ethical approval was granted by the Institutional Review Board of Sam Houston State University. The agency provided electronic copies of de-identified SOMB evaluation reports to the first author. Each report was written by 1 of 7 evaluators working for the same private agency. In each report, the evaluator reported the results of three risk assessment instruments (SORAG, VRAG, Static-99) and classified the result of each instrument on the following five-category risk scale: Low, Low-Moderate, Moderate, Moderate-High, High. The evaluator also rated the defendant on each of the 17 SOMB risk factors (Table 1), using the same five-category risk scale. The evaluator then used the five-category risk scale to provide two summary risk ratings: a summary rating for the level of risk indicated by the actuarial results and a separate summary rating of the level of risk indicated by the 17 SOMB factors. After making the two summary risk ratings, the evaluator made a containment recommendation. The containment recommendations fall into one of three categories, ranging from least restrictive to most restrictive: no containment, community corrections, and department of corrections.
We coded the evaluators’ reports to examine which of the 17 SOMB risk factors best predicted their final summary ratings of SOMB risk and which actuarial instrument results best predicted their final summary ratings of actuarial risk. We then used the two sets of summary risk ratings to examine which type of summary risk rating (SOMB or actuarial) best predicted their containment recommendations.
Two clinical psychology doctoral students with MA degrees in clinical/forensic psychology read and coded de-identified copies of the electronic reports. The coders recorded the risk-level rating for each of the 17 SOMB factors, the three risk instruments, and the two summary risk ratings. They also listed the offender’s current conviction, prior offenses, diagnoses, PCL-R percentile score, and the evaluator’s placement recommendation. Both raters coded the first 151 reports (rater agreement = 100% for all variables). The remaining reports (n = 151) were coded by only one evaluator.
Results
The five-category ordinal rating scale that evaluators used to make SOMB factor, actuarial score, and summary risk ratings (1 = low risk, 5 = high risk) presents a challenge for data analysis in this study, especially because each evaluator made 22 different ordinal ratings (17 SOMB factors, three instrument results, two risk ratings). Although these ratings represent ordered categories, analyzing them as categorical variables in correlation and regression analyses quickly becomes unwieldy (e.g., 68 predictors in a model examining the association between the 17 SOMB ratings and risk). The categorical approach requires four separate variables (e.g., dummy coded) to represent a single rating item. Without follow-up analyses, results for these sets of coded variables provide only limited information about the pattern effects across all of the ordinal categories. Thus, we opted to treat the rating items as continuous variables in correlation and regression analyses, while providing separate descriptive statistics for these ratings as both categorical and continuous variables (see Table 2). To ensure that this approach did not lead to spurious findings, we examined the pattern of correlations between study variables using both Pearson and Kendall’s tau-b correlations (available from the first author) and found that they led to the same substantive conclusions.
SOMB Risk Factor and Actuarial Risk Instrument Ratings
Table 2 provides descriptive statistics for evaluators’ ratings of the 17 SOMB risk factors and actuarial instrument results. Recall that the evaluator provided a separate risk-level rating (Low, Low/Moderate, Moderate, Moderate/High, High) for each individual SOMB risk factor and for each actuarial instrument result. The ratings in Table 2 provide information about the perceived level of risk indicated by the offender’s level of the trait, as opposed to simply the offender’s level of the trait. For example, the first cell in Table 2 indicates that evaluators believed that 52% of offenders had a level of empathy suggesting high risk, not that 52% of offenders had a high level of empathy.
For eight of the 17 SOMB factors, evaluators were more likely to assign a high-risk rating than any other rating (see Table 2). These eight factors were also the most likely to be rated as high risk overall and included Empathy (52.0%), Lifestyle Characteristics and Motivation to Change (45.7%), Psychopathology (44.7%), Motivation for Treatment (41.7%), and Criminal History (41.4%). Conversely, evaluators most frequently gave low-risk ratings on four factors, including Self-Worth (77.8%), Sexual Deviance and Arousal Patterns (63%), Developmental Markers (45.7%), and Cooperation During the Evaluation (44.7%).
Actuarial instrument results rarely fell into either the high-risk or low-risk categories, with most falling in one of the moderate-risk categories. For example, evaluators reported high-risk results for only 6.3% of the sample on the VRAG, 13.2% on the SORAG, and 15.2% of the Static-99. The most common risk categories for actuarial instruments were moderate for the VRAG (57.9%) and SORAG (38.1%), and moderate/low for the Static-99 (40.7%).
Summary Risk Ratings
The most common summary risk rating was moderate risk, for both the SOMB factors (41.4%) and actuarial instrument results (36.8%; see Table 2). Agreement between the SOMB and actuarial risk summary ratings was fair to poor (Kappa = .21, 95% confidence interval [CI] [.13, .28]; see Table 3). The two sets of ratings were identical for only 126 cases (42.3%). The SOMB rating was higher than the actuarial rating in 124 cases (41.6%), but the actuarial rating was higher than the SOMB rating in only 48 cases (16.1%; Table 3). In other words, evaluators were significantly more likely to conclude the SOMB factors indicated higher risk than the actuarial instrument results, χ2(16, N = 298) = 146.86, p < .001, Cramer’s v = .35, 95% CI [.31, .43]. If we treat these two risk ratings as continuous variables, evaluators assigned significantly higher SOMB risk ratings (M = 2.43) than actuarial ratings, M = 2.11; t(297) = 6.20, p < .001, d = .31, 95% CI [.24, .48], a small but statistically significant effect.
Agreement Between SOMB and Actuarial Risk Ratings
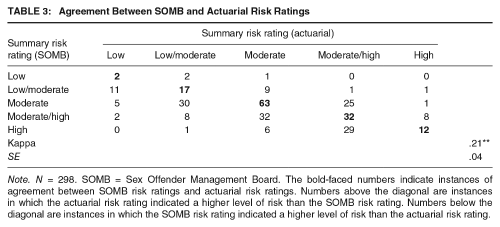
Note. N = 298. SOMB = Sex Offender Management Board. The bold-faced numbers indicate instances of agreement between SOMB risk ratings and actuarial risk ratings. Numbers above the diagonal are instances in which the actuarial risk rating indicated a higher level of risk than the SOMB risk rating. Numbers below the diagonal are instances in which the SOMB risk rating indicated a higher level of risk than the actuarial risk rating.
There were only 12 cases in which both the SOMB and actuarial results were described as indicating high risk. There were 36 cases in which evaluators concluded that the SOMB factors indicated high risk even though the actuarial results did not, but there were only 10 cases in which evaluators concluded that the actuarial results indicated high risk even though the SOMB factors did not. This is a large, and statistically significant difference for high-risk ratings, χ2(1, N = 302) = 26.52, p < .001, odds ratio = 8.00, 95% CI [3.22, 19.86]. In most of these cases, the disagreement was due to the actuarial results indicating moderate/high risk and the SOMB factors indicating high risk (see Table 3).
Association between SOMB Risk Factors and Perceived Risk
Table 4 lists Pearson correlations among the evaluator-rated SOMB risk factors and perceived risk. Many of the SOMB factors were significantly correlated with one another, with most correlations falling in the .20 to .40 range (Table 4). There were several moderate to large correlations (e.g., r > .60), such as those between Level of Denial and Accountability for Offense (r = .84), Lifestyle/Past Behavior and Criminal Behavior (r = .71), and Empathy and Accountability for the Offense (r = .65), but many correlations fell in the .00 to .15 range (see Table 4). Each of the 17 SOMB factors was positively correlated with evaluators’ SOMB summary risk ratings (r = .05 to .57), with 16 of the 17 correlations being large enough to reach statistical significance. Most of these correlations were small to moderate in size, suggesting no single factor had an overwhelming impact on evaluators’ risk opinions. The largest correlations with the SOMB summary risk rating were for Criminal History (r = .57), Psychopathology (r = .57), Understanding of Behavior and Motivation to Change (r = .56), and Empathy (r = .55).
Correlations Between SOMB Risk Factors and Summary Risk Ratings
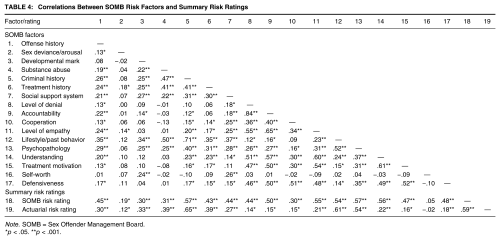
Note. SOMB = Sex Offender Management Board.
p < .05. **p < .001.
We used a multilevel regression to provide a more comprehensive picture of the association between SOMB risk factors and perceived risk. We used multilevel regression because the data for this study are nested, with offenders (N = 302) nested under evaluators (N = 7). Multilevel regression accounts for the variance in risk ratings attributable to the specific evaluator, such as the fact that some evaluators tend to assign higher risk ratings than others (see Boccaccini, Murrie, Rufino, & Gardner, 2014). In the current study, evaluator differences accounted for 8% of the variance in SOMB summarized risk ratings and 21% of the variance in summarized actuarial risk ratings.
To control for nested outcomes due to evaluator differences, we created a new variable that ranked each case for each evaluator and controlled for this variable’s effect as a random effect in the model (see Heck, Thomas, & Tabata, 2010). We then entered the 17 SOMB risk factor ratings into a single model (as fixed factors) to examine the factors that were the most predictive of evaluators’ summary risk ratings. Evaluator differences accounted for 8% of the variance of the SOMB summary risk ratings. After accounting for this evaluator variance, nine of the 17 SOMB factors were statistically significant predictors of SOMB summary risk ratings (see Table 4). The strongest predictors of SOMB summary ratings were Criminal History (b = .18; p < .001, 95% CI [.12, .25]), Offense History and Victim Choice (b = .14, p < .001, 95% CI [.07, .20]), and Psychopathology (b = .11; p < .001; 95% CI [.05, .18]).
Because evaluators used the PCL-R to assist them in making psychopathology ratings, we were curious about the extent to which PCL-R ratings might explain the association between the SOMB psychopathology rating and risk. PCL-R ratings were significantly correlated with psychopathology (r = .54, p < .001) and SOMB risk (r = .63, p < .001). 2 We used PCL-R scores and psychopathology ratings in a multilevel regression model predicting SOMB risk ratings. Although PCL-R scores were predictive of risk ratings in this model (b = .06, 95% CI [.05, .07], SE = .01, p < .001), psychopathology ratings continued to predict risk ratings (b = .24, 95% CI [.17, .32], SE = .04, p < .001), indicating that the effect for psychopathology ratings was not solely attributable to PCL-R scores.
Association between Actuarial Instrument Results and Perceived Risk
Evaluators’ ratings of the level of risk indicated by the actuarial instrument results were correlated with one another, with the strongest correlations between the VRAG and SORAG (r = .66, p < .001) and SORAG and Static-99 (r = .56, p < .001). The correlation between the VRAG and Static-99 was somewhat smaller (r = .32, p < .001). Each actuarial instrument rating was significantly correlated with evaluators’ actuarial summary risk rating: r = .72 for the Static-99, r = .63 for the VRAG, and r = .81 for the SORAG (ps < .001).
We used multilevel regression to examine whether each instrument result made a unique contribution to evaluators’ summary risk ratings or whether one instrument seemed to be more influential than the others. The regression model revealed that each instrument result was a significant predictor of summary risk ratings, with the largest effects for the two scales specifically designed to predict reoffending among sexual offenders: SORAG (b = .35, p < .001, 95% CI [.28,.42]), Static-99 (b = .31, p < .001, 95% CI [.26,.36]).
These regression findings suggest that evaluators consider the pattern of findings across all risk instruments when coming to a conclusion about actuarial risk. Because each instrument result was independently predictive of summary risk ratings, it seemed possible that evaluators were using something akin to a counting approach for risk measure integration, concluding that offenders with high scores on more instruments had a higher risk of reoffending than offenders with high scores on fewer instruments. To examine whether this might be the case, we used a one-way ANOVA to compare the mean actuarial risk rating for offenders who scored in the moderate-high or high-risk range on all three instruments (n = 23), two instruments (n = 54), one instrument (n = 82), or no instrument (n = 139). There was a large and statistically significant effect, F(3, 294) = 110.75, p < .001, η2partial = .53, with moderate to large differences for each increase in the number of moderate-high or high-risk scores. For example, summary risk ratings were higher for those with three moderate-high or high scores than two (Cohen’s d = .51, 95% CI [.01, 1.00]), two moderate-high or high scores than one (d = 1.45, 95% CI [1.07, 1.84]), and one moderate-high or high score than none (d = 1.19, 95% CI [.89, 1.48]).
Which Type of Risk Rating Best Predicts Evaluators’ Containment Recommendations?
Evaluators’ SOMB and actuarial summary risk ratings were strongly correlated with one another (r = .59, p < .001). We used a series of generalized multilevel models to examine which type of summary risk rating best predicted evaluators’ containment recommendations. We used only SOMB summary risk ratings as a predictor in the first model, only actuarial summary risk ratings in the second, and both SOMB and actuarial summary risk ratings in the third. We coded the containment recommendation so that a value of one indicated a more secure placement (department of corrections) and a value of zero indicated a less secure placement (community corrections).
When examined in separate models, each type of summary risk rating was predictive of containment recommendations, with higher risk ratings indicating a higher likelihood of a more secure containment recommendation (Table 5). But when we entered both types of summary risk ratings into the model, only the SOMB risk ratings were predictive of containment recommendations.
Multilevel Regression Results for Models Examining Factors That Predict Summary Risk Ratings and Containment Recommendations
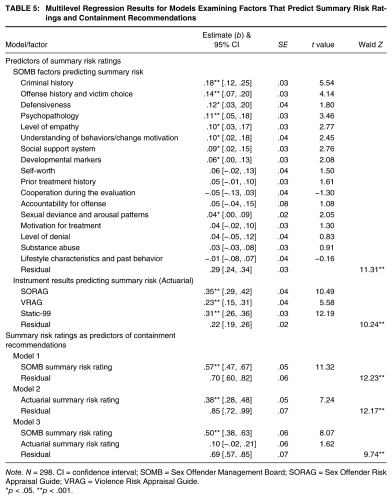
Note. N = 298. CI = confidence interval; SOMB = Sex Offender Management Board; SORAG = Sex Offender Risk Appraisal Guide; VRAG = Violence Risk Appraisal Guide.
p < .05. **p < .001.
Discussion
Overall, our findings suggest that risk instrument results mattered to the Colorado SOMB evaluators when coming to conclusions about offenders but that other factors mattered more. Evaluators’ ratings of the level of risk indicated by actuarial instrument results were predictive of their containment recommendations when examined alone but were no longer predictive once we included their ratings of the level of risk indicated by noninstrument factors (i.e., SOMB risk). Only their SOMB risk ratings were independently predictive of containment recommendations.
The extent to which these findings indicate appropriate evaluator decision making is complicated. On one hand, these findings suggest that evaluators are failing to take full advantage of the benefits in predictive validity that come with using a well-studied actuarial risk assessment instrument as it is intended to be used. Several studies have shown that adjusting or overriding risk instrument results leads to a decrease in predictive validity, especially when many of the overrides are used to increase the level of risk (see Hanson & Morton-Bourgon, 2009; Schmidt et al., 2016; Storey et al., 2012). There was indirect evidence of evaluators using overrides in this study. Evaluators’ SOMB risk ratings indicated a higher level of risk than their actuarial risk ratings in 41.6% of cases, and it was only their SOMB risk ratings that were predictive of containment recommendations in our final regression model. This pattern seems to suggest that evaluators often used SOMB ratings to override instrument results when making containment recommendations. Because we did not have access to recidivism data in this study, we were not able to assess the impact of overrides on accuracy. Although prior override research suggests that overrides are associated with attenuated predictive effects, the effect on predictive validity in the Colorado SOMB context is unknown.
On the other hand, the evaluators’ practices were consistent with the Colorado SOMB risk assessment guidelines, which require evaluators to consider each of the 17 SOMB factors (Table 1) as part of their evaluations. The SOMB specifically instructs evaluators to “incorporate all available information when making a determination regarding risk and not rely solely on risk assessment instruments” (SOMB, 2011, p. 32). Thus, the extent to which evaluators’ ultimate opinions reflected their beliefs about the factors most strongly associated with risk, those dictated by Colorado policy, or some combination of both is unclear. It could be that the SOMB evaluators in this study felt compelled to rely on SOMB factors, even those with questionable validity. Policy mandated risk assessment practices almost certainly lead to more consistency across evaluators and evaluations, but policy makers sometimes adopt promising procedures or measures without adequate research support for use in their system (see Boccaccini, Murrie, Caperton, & Hawes, 2009, for an example). Policies intended to improve decision making may ultimately force evaluators to rely on outdated science and procedures. Ideally, states would not mandate procedures in the absence of local field validity studies. Unfortunately, truly prospective field validity studies take years to complete and are just now becoming available to evaluators in some jurisdictions (see Boccaccini et al., 2009; Boccaccini, Rice, Helmus, Murrie, & Harris, in press). Because policies are slow to change, evaluators must look to the emerging research literature to guide their practices and work within their local systems to facilitate change when research findings clearly contradict current policy.
Evaluators’ SOMB and actuarial risk ratings were moderately to strongly correlated (r = .59), likely due to overlap between the list of SOMB factors and risk instrument items (e.g., criminal history, victim type, sexual deviance). If the SOMB and actuarial risk ratings are influenced by similar factors, it could be that both are predictive of future offending. But closer inspection of the associations between SOMB factors and risk ratings (Table 5) suggest that it is unlikely that SOMB risk ratings would outperform actuarial risk ratings. Researchers have described several of the factors that were most predictive of SOMB risk ratings, such as lack of empathy and poor motivation for treatment as “potentially misleading” because of their poor association with future offending (Hanson & Morton-Bourgon, 2005, p. 1158). Although evaluators’ SOMB risk ratings were also associated with known predictors of sexual recidivism (offense history, sexual deviance), it seems likely that opinions based on both predictive and nonpredictive factors will be less accurate than those based on predictive factors alone. Using a nonpredictive factor to make a prediction will always lead to an increase in error, even if it is used alongside other predictive factors. If a factor is truly unrelated to the outcome, it should have no influence on the prediction. If a nonpredictive factor is used alongside a truly predictive factor, it will just “muddy the water” and lead to a weaker overall predictive effect. Unfortunately, we did not have permission to obtain recidivism data for this study and have no way to compare the validity of the SOMB and actuarial risk ratings.
Gaps between Research and Practice
Several of our findings highlight persistent gaps between risk assessment research and risk assessment practice. Despite the consistent finding that decisions based on unadjusted actuarial risk instrument measure scores outperform those based on overrides or adjustments, most clinicians are unlikely to base their conclusions on instrument scores alone (Chevalier et al., 2015; Vrieze & Grove, 2009) and many use overrides (Schmidt et al., 2016). Researchers consistently find that overrides and adjustments do not work, but overrides remain common. At this point, it does not seem that more research documenting stronger effects for unadjusted scores is going reduce the tendency of clinicians to make adjustments.
It seems that the field would benefit from more sophisticated studies of the adjustment and override process, such as those that identify the most common reasons and methods for making adjustments. Indeed, proponents of actuarial decision making acknowledge that there are special circumstances that necessitate deviating from model results. Perhaps most well known is Meehl’s (1957) classic broken leg scenario, in which a broken leg might render meaningless the results of an equation predicting movie-going. But Meehl also warned that we should “beware of overdoing the broken leg analogy” (p. 270) and to use them only when “the psychological situation is as clear as a broken leg” (p. 273). It seems likely that adjustments are useful in some circumstances but harmful in others. Findings from studies comparing the validity of specific types of adjustments (i.e., adjustments based on specific factors) could better help clinicians understand why they should or should not use them. Existing studies simply compare the validity of adjusted and unadjusted results, lumping all adjustments into a single category. Studies that identify and test specific types of adjustments may help clinicians better understand why their adjustment practices are or are not helpful.
Clinicians’ tendency to override actuarial instrument scores in risk assessment may be one reason why many have adopted structured professional judgment (SPJ) measures, which allow for clinician judgment when coming to conclusions about risk. One possible solution to the problem with overrides is to replace actuarial measures with SPJ measures. Although broad reviews of the risk assessment literature have reported similar effects for SPJ measures and the types of actuarial measures used in this study (see, e.g., Yang, Wong, & Coid, 2010), meta-analyses of sex offender specific studies suggest stronger effects for actuarial measures (d = .67) than SPJ measures (d = .46; Hanson & Morton-Bourgon, 2009). Moreover, actuarial measures, especially the Static-99R, continue to be the most widely used measures in sex offender risk assessment (Chevalier et al., 2015; Neal & Grisso, 2014), suggesting that the field cannot overlook the adjustment issue because of the availability of SPJ measures.
Another noticeable gap between research and practice concerns the practice of using multiple risk assessment measures for decision making. Although it is common practice for researchers to use multiple measures in sex offender risk assessment cases (Chevalier et al., 2015; Neal & Grisso, 2014), there are no empirically based guidelines for integrating scores across measures to come to a single or summary conclusion about risk (Seto, 2005; Vrieze & Grove, 2010). In the current study, evaluators appeared to use a counting approach for risk measure integration. They concluded that offenders with moderate-high or high scores across more measures were at a higher risk for reoffending than those with scores in this range on fewer measures. Although it seems to make sense that more high-risk scores indicates a higher level of risk than fewer high-risk scores, researchers have had a difficult time finding measure combinations that are associated with an increase in predictive validity. Although some studies have found improved prediction with multiple measures (Lehmann et al., 2013), most others have not (Boccaccini et al., 2009; Looman, Morphett, & Abracen, 2013; Seto, 2005).
One factor that makes it difficult to integrate scores across risk measures is that their scores tend to be positively correlated (r = .32 to .66 in this study). Many of these measures include identical (i.e., VRAG and SORAG) or similar (Static-99 and SORAG) items. Using a counting approach to risk measure integration treats each score as an independent source of information about risk, which is not the case. The counting approach leads evaluators to give more weight to factors that are on both measures. Clinicians nevertheless continue to use multiple measures despite research suggesting that there is no benefit to using more than one measure. The field would clearly benefit from more studies aimed at identifying the best methods for integrating scores across risk measures.
Limitations
The Colorado SOMB reports we used for this study provided a unique opportunity to study the associations between risk factors, instrument scores, risk opinions, and containment recommendations. The Colorado evaluators in this study used a systematic, ordinal rating process to quantify risk across more than 20 variables. Although this process prevented us from having to make inferences about the evaluators’ opinions, we know of no other state or jurisdiction that uses a similar process, which limits the generalizability of our findings. In addition, the practice of providing separate ordinal-level risk ratings for each SOMB risk factors may be unique to this specific agency. Although all Colorado evaluators are required to consider these factors, they are not required to provide a separate rating for each factor. There may be something about the process of formally rating each risk factor that makes it more salient in the decision-making process. This type of rating process may encourage evaluators to consider factors (e.g., empathy) that they know are not empirically supported predictors of reoffending. One limitation of the ordinal rating system is that there are no rules of guidance for assigning ratings. Instead, the evaluators consider the risk factor (or combination of risk factors) and then make a clinical judgment as to the level of risk indicated by the factor. This process may leave too much room for subjectivity in scoring, which opens the door for idiosyncratic evaluator differences in interpretation practices (Boccaccini et al., 2014).
A related limitation is that we had access to reports from only seven evaluators, from one agency. Our best estimate is that these evaluations represent between 5% and 10% of the evaluations conducted in the state. We used mixed-model regression to statistically account for evaluator-specific variance in our analyses, but the small number of evaluators necessarily limits the generalizability of study findings.
Other limitations include the absence of raw risk measure scores and risk measure item scores. Our analyses of the VRAG, SORAG, and Static-99 results were based on evaluators’ interpretation of the results as falling into one of five ordinal risk categories, as opposed to the actual risk measure scores. This categorization process prevented us from examining the full range of possible scores on the measures. Because any type of score categorization leads to range restriction and is often accompanied by attenuated validity coefficients (Howard, 2017), our findings for risk measure results may have been stronger if we had access to raw scores as opposed risk categories. Nevertheless, clinicians often provide categorical interpretations of risk measure results, even when noncategorical options are available (Chevalier et al., 2015). Thus, our findings for risk measure categories may better map on to actual practice than analyses for raw scores because the evaluators reported categories, not scores. For the PCL-R, evaluators reported percentile values, which we were able to convert to raw scores, but were not able to examine effects for the PCL-R factors and facets, which vary in their associations with recidivism among sexual offenders (Hawes et al., 2013).
Finally, we did not have access to offender outcomes for this study. Our interpretations of the evaluators’ decision-making processes are based on predictive validity findings from other studies. Although many of those predictive validity findings are consistent across studies (e.g., attenuated effects for overrides), the extent to which they apply to Colorado SOMB evaluations is unknown.
Conclusion
Our results show that the inclusion of actuarial instruments in risk assessment does not always mean the instruments are influential in evaluator decision making. Evaluators’ final containment recommendations were more strongly influenced by noninstrument factors, including some that are known predictors of recidivism (prior offending) and some that are not (empathy, treatment motivation). In many instances, the evaluators concluded that these noninstrument factors indicated a higher level of risk than instrument results. Overall, these findings seem to reflect a continuing divide between risk assessment research and risk assessment practice and highlight the need for more research that examines the validity of what risk assessment evaluators actually do, as opposed to what researchers think they should do.