



Abstract
Although considerable research has found overall moderate predictive validity of Static-99R, a sex offender risk prediction tool, relatively little research has addressed its potential for cultural bias. This prospective study evaluated the predictive validity of Static-99R across the three major ethnic groups (White, n = 789; Black, n = 466; Hispanic, n = 719) in the state of California. Static-99R was able to discriminate recidivists from nonrecidivists among White, Black, and Hispanic sex offenders (all area under the curve [AUC] values >.70; odds ratios >1.39). Base rates (at a Static-99R score of 2) with a fixed 5-year follow-up across ethnic groups were very similar (2.4%-3.0%) but were significantly lower than the norms (5.6%). The current findings support the use of Static-99R in risk assessment procedures for sex offenders of White, Black, and Hispanic heritage, but it should be used with caution in estimating absolute sexual recidivism rates, particularly for Hispanic sex offenders.
Introduction
Structured risk assessments are widely used (Neal & Grisso, 2014) and have been supported by a long tradition of research in the criminal justice and forensic mental health systems (Ægisdóttir et al., 2006; Hanson & Morton-Bourgon, 2009; Yang, Wong, & Coid, 2010). Although the overall utility of these tools is generally accepted, there are outstanding questions concerning their generalizability to different ethnic groups (e.g., Black, Hispanic, Asian, Indigenous).
The issue of cultural bias in psychological testing (e.g., intelligence tests for Blacks) has a long history in the multicultural Western societies. Risk assessment instruments also cannot avoid the debate concerning potential bias for different ethnic groups. There are several possible causes of cultural bias in the performance of the current risk assessment tools. First, ethnic minorities are usually present in relatively small numbers in development samples, which might lead to biased item (i.e., risk factors) selection associated with recidivism risk. Second, risk assessment tools might not fully measure the core propensities (i.e., antisociality and sexual deviancy) when used with minority offenders. Consequently, it is possible that there are distinct risk and protective factors for different ethnic groups that have not been fully addressed by risk scales developed and validated on multiethnic samples.
Understanding the predictive accuracy of a risk scale (i.e., criterion-referenced prediction tool) should consider calibration (correspondence between expected and observed recidivism rates) as well as discrimination (how different are recidivists from nonrecidivists). To check for potential cultural/racial bias for both calibration and discrimination, we can test the equivalence of (logistic) regression equations across ethnic groups (i.e., B0 for calibration; B1 for discrimination; Reynolds, 2000). Prediction scales are unbiased when there are no systematic differences across ethnic subgroups in the expected recidivism rates for offenders with the same score or category (Reynolds & Suzuki, 2013).
The purpose of this study was to examine whether cultural/racial bias exists in one of the popular actuarial tools, Static-99R, with different ethnic groups of sexual offenders (White, Hispanics, and Blacks) in the United States. Static-99 and Static-99R (Hanson & Thornton, 2000; Helmus, Thornton, Hanson, & Babchishin, 2012) are the most widely used actuarial risk assessment tool for adult sexual offenders by forensic experts in the Western countries (e.g., the United States, Canada; Neal & Grisso, 2014). Considerable research has found overall moderate predictive validity (area under the curve [AUC] = .70, n = 8,106, k = 23; Helmus, Hanson, Thornton, Babchishin, & Harris, 2012). Relatively little research, however, has addressed the potential cultural bias for the performance of Static-99R with different ethnic minority groups.
The United States is a multicultural and multiethnic society. Approximately 35% of the U.S. total population (approximately 320 million) is from ethnic minority groups, with the largest number being Hispanics (18%) followed by Blacks (12%). About 96 million people of Hispanic and Black ancestry reside in the United States (U.S. Census Bureau, 2015). Furthermore, Hispanics and Blacks are overrepresented in the U.S. criminal justice system. Although Blacks and Hispanics make up about 30% of the general U.S. population, they constitute more than 60% of state and federal inmates (Harrison & Beck, 2005).
Given the characteristics of actuarial risk assessment tools, such as explicit risk factors and clear combination rules by statistical methods, actuarial tools should be less vulnerable to the cultural/racial bias than unstructured clinical judgment (Garb, 1997). Nevertheless, potential for cultural bias of the actuarial risk assessment tools has remained largely unexplored, possibly due to the relatively small numbers of ethnic minorities in development and normative samples. Consequently, research is needed to examine whether Static-99R, which was developed with predominately White offenders, would perform similarly across different ethnic groups.
There are possible theoretical explanations that risk assessment tools that work for White offenders would perform differently among ethnic minority offenders. First, it has been theorized that the unfair social structure under White-dominated and the postcolonial societies toward ethnic minority populations might lead to substantially different patterns on the risk-relevant characteristics from those of White offenders (i.e., more socially disorganized, poverty, less opportunities to achieve their goals; Cernkovich, Giordano, & Rudolph, 2000; Sampson, Morenoff, & Raudenbush, 2005).
Ethnic minority/immigrant groups might have their own culture-specific risk factors (e.g., acculturation, collectivism, patriarchy, and loss of face; Goldsmith, Hall, Garcia, Wheeler, & George, 2005). These culture-specific risk factors might be directly associated with sexual recidivism or indirectly by prompting the development of other empirical risk factors, such as hostility toward women and general social rejection. Ignoring these potential cultural risk factors in risk assessment tools may restrain the predictive ability of the scales.
Regardless of social structure and possible culture-specific risk factors, their cultural values or immigrant status could influence the predictive accuracy of the Static-99R by restricting the amount of necessary information for proper administration. For example, the tendencies of underreporting sexual crimes due to the fear of losing face in the community (Hall, 2002) and disgracing their groups (e.g., families; Hall, Windover, & Maramba, 1998; Moro, 1998) as well as undetected crimes occurring in their country of origin might undermine the predictive accuracy of scales.
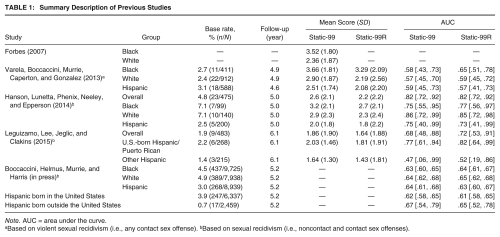
Four studies, to date, have been conducted in the United States to evaluate the applicability of Static-99R to different ethnic sex offender groups: Whites, Blacks, and Hispanics. Those studies consistently found that Hispanic sex offenders had relative low mean scores of Static-99R and low sexual recidivism rates, whereas Black sex offenders had relatively high mean scores and high sexual recidivism rates. Findings, however, about the predictive accuracy of Static-99R across different ethnic groups have been inconsistent although there is a pattern of relatively weak discrimination and calibration of Static-99R for Hispanic sex offenders (Table 1).
Summary Description of Previous Studies
Note. AUC = area under the curve.
Based on violent sexual recidivism (i.e., any contact sex offense). bBased on sexual recidivism (i.e., noncontact and contact sex offenses).
Varela and colleagues examined the predictive validity of Static-99 and Static-99R among 1,911 sex offenders released from prison in Texas (White, n = 912; Black, n = 411; and Hispanic, n = 588; Varela, Boccaccini, Murrie, Caperton, & Gonzalez, 2013). They found poor to moderate discrimination of both versions for violent sexual recidivism (i.e., any contact sexual offense) across different ethnic groups (AUCs of .57 for Hispanics, .59 for Whites, and .65 for Blacks) and no significant differences among the ethnic groups. The base rates of any contact reoffense were very similar across ethnic groups (2.4%-3.1% in the follow-up of 4.8 years). No calibration analyses were performed.
In the state of California, Hanson, Lunetta, Phenix, Neeley, and Epperson (2014) reported good predictive validity with 475 sex offenders under the parole system (AUC of .82 [.72, .92]) and overall good and similar discrimination across all ethnic groups (e.g., White, Black, and Hispanic; AUCs >.74; odds ratios >1.47). The overall sexual recidivism base rates were relatively low (4.8% after 5 years), particularly low in Hispanic sex offenders (2.5% after 5 years). The overall fit between the expected and observed recidivism rate was generally good (4.8% vs. 6.31%; E/O = 1.30 [0.87, 1.96]), with overprediction only in the Low-Moderate risk category (scores of 2 and 3; E/O = 4.58 [1.15, 18.31]). Calibration analyses were not conducted for each ethnic group due to the small number of total sample size and recidivists (e.g., seven recidivists in a total of 99 Black sex offenders).
In the study with 483 Hispanic sex offenders (nine sexual recidivists) released from prisons in New Jersey (Leguizamo, Lee, Jeglic, & Clakins, 2015), Static-99R was able to discriminate recidivists from nonrecidivists (AUC of .72 [.59, 91]). Furthermore, they divided the sample into two separate subgroups: U.S.-born Hispanic (n = 268, six recidivists) and those born in Latin America (n = 215, three recidivists). Static-99R worked only for U.S.-born Hispanic (AUC of .82 [.64, .99]). They also found relatively low sexual recidivism rates in this study (1.9%, 9/483 with an average follow-up of 6 years), and the observed 5-year overall recidivism rate in the current sample was lower than the expected recidivism rates from Static-99R norms (3.0% vs. 6.3%; E/O = 2.11 [1.10, 4.06]).
In the most recent study, Boccaccini, Helmus, Murrie, and Harris (in press) examined the predictive validity of Static-99 and Static-99R for three different ethnic groups (White, n = 7,938; Black, n = 9,725; Hispanic, n = 8,939). They found very similar and moderate discrimination for Static-99R for sexual recidivism across the different ethnic groups (AUCs of .65 for White, .64 for Black, and .63 for Hispanic). They also divided the sample into U.S.-born Hispanic (n = 6,337) and Hispanic born outside the United States (n = 2,459). Contrary to Leguizamo et al. (2015), Static-99R worked better for Hispanic born outside the United States than for those born inside (AUC of .65 [.52, .78] and AUC of .61 [.58, .65], respectively), but the difference was not statistically significant. Calibration analyses for each ethnic subgroup were not reported.
In summary, previous research has found differences in average Static-99R scores across ethnic groups, whereas no clear conclusions can be reached concerning differences in predictive accuracy. Although group differences in mean scores on risk scales do not necessarily indicate test bias, this information would be a starting point to investigate potential differences in predictive accuracy (Reynolds & Suzuki, 2013).
There are two major propensities associated with the risk for sexual recidivism: general criminality and sexual criminality. Both types of risk factors are included in the commonly used sexual offender prediction tools, including Static-99R (Brouillette-Alarie, Babchishin, Hanson, & Helmus, 2016). For example, Static-99R contains general crime factors (e.g., prior nonsexual violence and any prior sentencing dates) as well as sexual crime–specific risk factors (e.g., prior sex offenses and any male victims). It is possible that there are ethnic differences on either or both of two major dimensions. In particular, relatively higher scores on the Static-99R for Black sex offenders might be attributed to their considerable overrepresentation in arrest and victimization rates, particularly in violent crimes (e.g., murder, robbery; Federal Bureau of Investigation, 2013; Harrell, 2007). There have been few studies, however, that have examined ethnic differences in sex crime–specific risk factors.
Current Study
This prospective study evaluated the predictive validity of Static-99R across three major ethnic groups (e.g., White, Black, Hispanic) with a total of 2,101 sexual offenders in California. Offenders’ sexual recidivism information was examined for 5 years following release from custody and obtained from official criminal records of the California Department of Justice.
The main research questions were the following:
Method
Sample
We combined a new cohort sample (n = 1,626) and a previous study sample from California (n = 475; Hanson et al., 2014) to increase statistical power for ethnic subgroup analyses (e.g., White, Black, and Hispanic). The ethnic information was recorded on their criminal history record, and it was typically self-reported. Of the overall 2,101 offenders, 37.6% (n = 789) were White, 22.2% (n = 466) were Black, 34.2% (n = 719) were Hispanic and 6% (n = 127) were Other/Unknown.
On average, the offenders were 42.9 years at release (SD = 11.6; range of 19.6-86.6). Hispanic sex offenders (M = 40.5, SD = 12.0) were significantly younger than White (M = 45.2, SD = 13.3) and Black sex offenders (M = 43.1, SD = 10.49); the age difference between Black and White sex offenders was also statistically significant.
Measures
Static-99R
Static-99R is a 10-item empirical actuarial risk tool designed to predict sexual recidivism among adult male offenders (Hanson & Thornton, 2000; Helmus, Thornton, et al., 2012). Static-99R is identical to Static-99 with the exception of revised age weights. The total score (ranging from −3 to 12) is calculated by summing all item points and can be used to place offenders in one of five risk categories: I (very low, −3 and −2), II (below average, −1 and 0), III (average, 1 to 3), IVa (above average, 4 and 5), and IVb (well above average, 6+; Hanson, Babchishin, Helmus, Thornton, & Phenix, 2017). Static-99R scores in this study were later computed from Static-99 scores by using the offender’s date of birth to calculate the updated age item.
Rater Reliability
Although rater reliability of the Static-99R was not directly assessed in this study, a previous study (Hanson et al., 2014) found overall good interrater reliability (intraclass correlation coefficient [ICC] = .78 [.64, .90]) in a sample of 55 California parole and probation officers (ICC = .81, n = 30; ICC = .77, n = 25, respectively).
Recidivism
We examined three different recidivism outcomes, defined as arrests after release as either parolees or probationers: sexual, violent, and any recidivism. Sexual recidivism included any offense that was considered sexually motivated (contact and noncontact sex offenses). Violent recidivism included all crimes that involved direct confrontation with the victim. This category included contact sexual offenses but excluded noncontact sex offenses. Finally, any recidivism included all crimes (sexual, violent, nonviolent), as well as all technical offenses (e.g., breach of conditional release), regardless of whether they were sexually motivated.
Procedure
Offenders were scored on Static-99/R by California Department of Corrections and Rehabilitation (CDCR) or probation staff as part of routine practice. Beginning in 2006, CDCR policy required that all released parolee sexual offenders were scored on Static-99, and in 2008, scoring on the Static-99 became mandatory for sex offenders released on probation. Static-99R was used starting in 2009. Recidivism information was provided by the California Department of Justice as of October 2015. Recidivism was defined as an arrest for a sexual, violent, and any offense.
Plan Of Analysis
For discrimination, we used two statistical methods: (a) the AUC from receiver operating characteristic (ROC) analysis (Swets, Dawes, & Monahan, 2000) and (b) odds ratios from logistic regression (Hosmer & Lemeshow, 2002).
For calibration, we used the E/O index (the ratio of expected number of recidivists divided by observed number of recidivists; Hanson, 2017) as well as fixed-effect meta-analysis of logistic regression parameters (Borenstein, Hedges, Higgins, & Rothstein, 2009; Hanson & Broom, 2005).
AUC
AUC values indicate the probability that a randomly selected recidivist would have a more deviant score than a randomly selected nonrecidivist. AUC can vary between 0 and 1, with .50 indicating the level of prediction that would be expected by chance. According to Rice and Harris (2005), AUCs of .56 would be considered small, .64 would be moderate, and .71 would be large. AUC values are expected to be smaller in prognostic studies than in diagnostic studies because the outcome of interest in prognostic studies does not exist at the time of assessment, and may never happen (Helmus & Babchishin, 2017; Royston, Moons, Altman, & Vergouwe, 2009). It has an advantage of insensitivity to base rates and robustness to outliers (Ruscio, 2008).
Odds Ratios
Odds ratios indicate the change in relative risk associated with one unit change in raw scores. For example, Static-99R scores are associated with a consistent relative risk increase of approximately 1.45 (Hanson, Thornton, Helmus, & Babchishin, 2016), which means the rate of recidivism increases 1.45 times as each Static-99R score increases. The primary advantage is that it is less affected by a restriction of range compared with AUCs (Hanson, 2008).
E/O Index
The E/O index is the expected number of recidivists divided by observed number of recidivists (Hanson, 2017). Perfect calibration is indicated by an E/O index of 1.0. Following Rockhill, Byrne, Rosner, Louie, and Colditz (2003), the 95% confidence intervals (CIs) for the E/O indices were computed as follows:

The expected number of recidivists was based on the 5-year sexual recidivism rates for routine/complete samples reported by Hanson et al. (2016).
Comparing Logistic Regression Parameters
A second method of testing calibration was to examine the extent to which logistic regression parameters, such as intercept values (centered on Static-99R scores of 2), differed from the logistic regression parameters for the norms (Table 4: B02 = −2.827, SE = 0.079; B1 = .368, SE = 0.025; Hanson et al., 2016). Specifically, the B02 represents the expected recidivism rate for a Static-99R score of 2 (p2) in logit units (ln[p2 / {1 − p2}]). Differences between the parameters in the current sample and those of the norms were tested using fixed-effect meta-analysis (Borenstein et al., 2009; Hanson & Broom, 2005)
Results
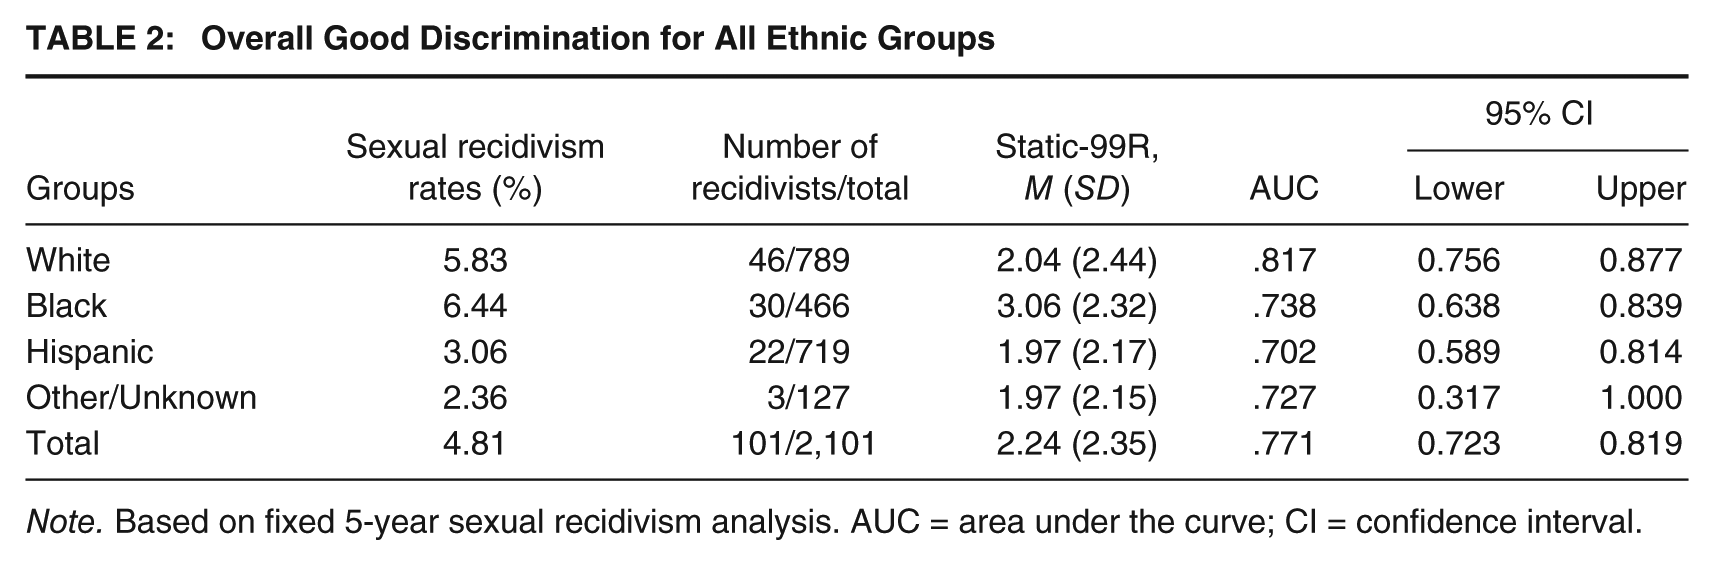
Of the total sample, 45.4% (951/2,101) of offenders were arrested with any offense; 4.0% (85/2,101) were arrested with a violent offense; 4.8% (101/2,101) were arrested with a sexual offense during the fixed 5-year follow-up period. Black sex offenders had the highest sexual recidivism rates (6.4%), and Hispanic and Other/Unknown groups had relatively lower sexual recidivism rates than other groups (3.1% and 2.4%, respectively; Table 2).
Overall Good Discrimination for All Ethnic Groups
Note. Based on fixed 5-year sexual recidivism analysis. AUC = area under the curve; CI = confidence interval.
Of the new cohort sample (n = 1,626; excluding the 2014 study sample), about 19.2% (5/26) of sexual reoffenses by probationers and 32.7% (17/52) of sexual reoffenses by parolees were committed by offenders who were registered as transients at the time of rearrest. In comparison, only about 6% (6,316/103,737) of the total registered sex offenders in the community are transient (California Department of Justice, 2016). Collectively, transient status seems to be associated with higher sexual recidivism rates (overall odds ratio = 6.06 [3.70, 9.93]).
Discrimination
Across ethnic groups, there were significant differences in the average Static-99R scores, F(3, 2,097) = 25.56, p < .001. As can be seen in Table 2, Black sex offenders M = 3.06) scored significantly higher than White, Hispanic, and Other/Unknown groups, all of which had very similar average scores (mean range of 1.97-2.04).
Using fixed 5-year follow-up, Static-99R was able to discriminate recidivists from nonrecidivists for all ethnic groups although AUC value of Other/Unknown group was not significant due to low sample size. The White group had the highest AUC value of .817 [.756, .877], and Hispanics had the lowest AUC value of .702 [.638, .839] (Table 2).
The relationship between Static-99R scores (centered on a score of 2) and sexual recidivism also acceptably fit a logistic distribution (i.e., Hosmer–Lemeshow test was not significant: χ2 = 3.65, df = 5, p = .600; B02 = −3.619, SE = 0.152; B1 = .456, SE = 0.044; Figure 1).

Logistic Curve for Overall Sample With the Norms
The 5-year sexual recidivism rates at a score of 2 across all ethnic groups were very similar (2.4%-3.0%; Qbetween = 0.47, df = 2, p = .792). The discrimination (change in relative risk) was highest for White offenders (odds ratios = 1.39-1.65), but the differences between racial groups were not statistically significant (Qbetween = 2.29, df = 2, p = .318; Table 3).
Similar Base Rates and Relative Risk Rates Across Different Ethnic Groups

Note. OR = odds ratio; CI = confidence interval.
Calibration
The overall resulting logistic equation indicated a relative risk increase of 1.58 for each increase in Static-99R score (e.456 = 1.58), and an adjusted 5-year sexual recidivism rate of 2.6% for a Static-99R score of 2 (1 / [1 + e−{−3.619}]) = 0.0261. When compared with the norms (from Hanson et al., 2016), the adjusted (score of 2) base rate was significantly lower (B02 = −3.62 vs. −2.83; Qbetween = 21.33, df = 1, p < .001), and the discrimination (B1) was larger but not significant (B1 = .456 vs. .368; Qbetween = 2.94, df = 1, p = .086).
Overall, adjusted base rates (B02) of each ethnic group were significantly lower than the norms (2.4%-3.0% vs. 5.6%; all p values <.05). Relative risk rates did not significantly differ from one another or from the norms (Table 4).
Lower Base Rates and Larger Relative Risk Rates of Current Sample Than the Norms

p < .05. **p < .01. ***p < .001.
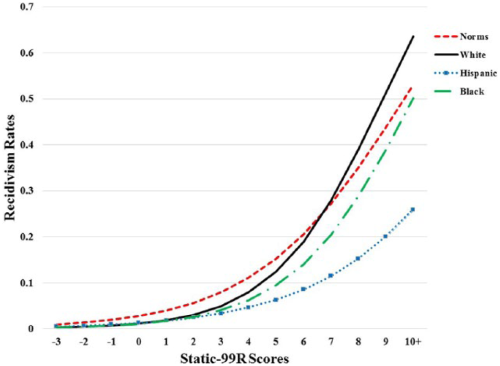
In comparison with norms for routine samples, the observed 5-year overall recidivism rate in this current sample was lower (4.8% vs. 8.1%; E/O index = 1.68 [1.39, 2.04]; Table 5). Figure 1 provides a plot of the observed recidivism rates per Static-99R risk score, the rates based on the smoothed logistic curve fitted to this data, and the recidivism rate norms for routine samples (Hanson et al., 2016). As can be seen in Figure 1, the general pattern is that the recidivism rates in the current sample were lower than expected, except for the IVb (well above average risk) category.
Overall Recidivism Rates Were Lower Than Expected

Note. E/O = the ratio of expected number of recidivists divided by observed number of recidivists; CI = confidence interval; I = very low risk; II = below average risk; III = average risk; IVa = above average risk; IVb = well above average risk (Hanson, Babchishin, Helmus, Thornton, & Phenix, 2017).
For White sexual offenders, the observed 5-year overall recidivism rate was slightly lower than expected rate (5.8% vs. 7.8%; E/O index = 1.34 [1.00, 1.79]; Table 5 and Figure 2). For Black sex offenders, the observed 5-year overall recidivism rate was also lower than the expected rate (6.4% vs. 10.4%; E/O index = 1.61 [1.12, 2.30]), but significantly only in Category IVa (scores of 4 and 5; E/O index = 3.15 [1.31, 7.56]; Hanson et al., 2016). For the Hispanic sample, the observed 5-year overall recidivism rate was lower than the expected rate (3.1% vs. 7.1%; E/O index = 2.33 [1.54, 3.55]), specifically in Categories III and IVa (scores of 1 to 5; E/O index = 2.42 [1.26, 4.66] and 2.17 [1.03, 4.55]).
Logistic Curves for Each Ethnic Group With the Norms
Discussion
The main purpose of this study was to examine how Static-99R predicts sexual recidivism risk (e.g., discrimination and calibration) for two major ethnic minorities (Black and Hispanic) as well as White sex offenders in the United States. This prospective study found overall good predictive accuracy of Static-99R across the ethnic sex offender groups (White, Black, and Hispanic). Consistent with the findings from the previous studies, Black sex offenders had the highest Static-99R score and highest sexual recidivism rates, whereas Hispanic had relatively lower Staic-99R score and lower sexual recidivism rates.
The discrimination of Static-99R across ethnic groups (White, Black, and Hispanic) were generally all good (all AUCs >.70; odds ratios >1.39) given the average values of relative accuracy (AUC = .70 and odds ratio = 1.45; Hanson et al., 2016; Helmus, Hanson, et al., 2012). There were, however, a consistent pattern across ethnic groups of the largest discrimination for White and the lowest for Hispanic sex offenders. Although there is weak evidence for significant differences of discrimination between ethnic groups, the consistently lower discrimination for Hispanic sex offenders than other ethnic groups (i.e., White and Black) should be carefully examined by further studies.
In terms of match between the expected and the observed recidivism rates (calibration), base rates (at a Static-99R score of 2) across ethnic groups were very similar (2.4%-3.0%). All groups, however, were significantly lower than norms (5.6%; Hanson et al., 2016). In particular, the overall sexual recidivism rate of Hispanic sex offenders was substantially lower than the norms (i.e., poorer calibration) as compared with other groups (3.1% vs. 7.1%; E/O = 2.33).
There are several possible explanations for the consistent findings of relatively weak discrimination and calibration among minority ethnic groups, particularly for Hispanic sex offenders as a minority/immigrant group. There might be a different association between the major constructs (general and sexual criminality; Brouillette-Alarie et al., 2016) of Static-99R and sexual recidivism under a White-dominated social structure or different cultural backgrounds. Furthermore, Hispanics might have their own culture-specific risk factors, not considered in the current risk assessment risk scales. More research is needed to identify unique risk factors or propensities associated with sexual recidivism under a Hispanic cultural background.
One study found that there was a similar level of sexual criminality across different ethnic groups (e.g., Indigenous, Black, Hispanic, Asian), whereas there were ethnic differences in general criminality (Brankley, Lee, Hanson, & Zabarauckas, 2017). Specifically, Hispanic sex offenders scored significantly lower on risk factors relevant to general criminality than White sex offenders, but Blacks scored much higher than Whites. Further research, consequently, is needed on how well the risk factors measuring general criminality in Static-99R are associated with sexual recidivism among the ethnic minority groups.
It is also possible that a lack of necessary information (e.g., criminal records in their countries of origin) for proper administration of Static-99R might restrain the predictive ability of the scales. For example, one third of Mexicans (the largest group in Hispanic group) in the United States are foreign born, compared with 13% of the U.S. population overall (Lòpez, 2015). Consequently, lack of criminal history information due to their immigrant status might affect the predictive accuracy of Static-99R scale (Leguizamo et al., 2015). In addition, given their group-oriented cultural values (e.g., patriarchy, collectivism), the underreporting tendency of sexual crimes/victimizations that occurred in their ethnic community (e.g., families) might also undermine the predictive accuracy of Static-99R.
The overall sexual recidivism base rate of this California sample was significantly lower than the norms (4.8% after 5 years). The reasons for the lower than expected rates are not fully known, but may be related to the research method used (e.g., accuracy of records), the effectiveness of practices for managing sexual offenders in California, or other factors not fully understood. Furthermore, these low recidivism rates might be attributed to unexpectedly low sexual recidivism rates of the parolee samples (4.5%) over the probationer sample (6.1%; Lee, Restrepo, Satariano, & Hanson, 2016). Further studies are necessary to examine specific factors that may contribute to this low recidivism rate of the parolee sample (e.g., sexual offender treatment, GPS; Gies et al., 2012).
This is the largest prospective study, to date, evaluating whether cultural bias exists in predictive accuracy of Static-99R with White, Black, and Hispanic sex offender groups. Although the average scores of Static-99R scale were significantly different across the ethnic groups, there was no strong evidence that the risk factors/propensities had any differential associations with sexual recidivism for sexual offenders with different cultural backgrounds. Consequently, the current findings support the use of Static-99R for White, Black, and Hispanic sex offenders.
Limitations
Although the overall sample was large (101 recidivists), the subanalyses were not (e.g., 22 Hispanic recidivists). Additional research with a large number of each ethnic group is recommended for more confident conclusions about minority/ethnic sex offenders.
Recidivism information for this study was provided solely by the California Department of Justice in the first study group (Hanson et al., 2014). This limited recidivism information (nationwide criminal records [Federal Bureau of Investigation, FBI] were examined only for the 2016 study group) would affect predictive accuracy, including the validity of the absolute recidivism estimates. This concern is particularly relevant to Hispanic sex offenders whose reoffending may be less likely to be detected (e.g., if they frequently leave the United States).
We did not have item-level data and could not examine whether the predictive accuracy of each item or propensities (i.e., sexual deviance, or general criminality) varied across ethnic groups. Although Hispanic and Black populations constitute a large proportion of the California population, there are still other minority ethnicities (e.g., Asians, Native Americans) for which we have very limited information.
Implications for Research
Given the relatively low statistical power, additional studies and meta-analyses are needed with larger samples of these (Black, Hispanic) and other ethnic minorities (e.g., Asians, Native Americans).
Researchers should also empirically explore potentially unique risk factors for each ethnic group. As well, research should examine the extent to which the two major propensities (general and sexual criminality) are associated with sexual recidivism for non-White sex offenders with different cultural backgrounds. Furthermore, scoring additional risk measures (e.g., Static-2002R) could also provide insight into potential ethnic differences in the constructs related to sexual recidivism risk (i.e., cultural bias in construct validity; see Brouillette-Alarie et al., 2016).
More research is also necessary to identify the extraneous factors (e.g., immigrant status, underreporting) for ethnic minorities which might moderate the predictive accuracy of risk assessment scales. In other words, do the low sexual recidivism rates in a particular ethnic group (e.g., Hispanics) remain after controlling for those potential extraneous factors? In addition, management practices for sexual offenders implemented in each jurisdiction (e.g., sexual offender treatment, supervision, tracking devices) should be considered to evaluate the correspondence of observed recidivism rates with absolute recidivism rates (calibration; risk band norm designs, see Woodrow & Bright, 2011).
Implications for Practice
The current findings support the use of Static-99R in risk assessment procedures for sex offenders of White, Black, and Hispanic heritage. It is noteworthy that the present study was the one of the first studies to examine the performance of Static-99R with Black sex offenders, and the current finding add to the evidence of good performance of Static-99R for this U.S. ethnic minority.
The current results, however, suggest that evaluators should be cautious when using Static-99R to estimate absolute sexual recidivism rates for Hispanic sex offenders. Although Hispanic sex offenders with low scores had low recidivism rates (as expected), the observed recidivism rates for Hispanic offenders with higher Static-99R scores were lower than expected. Consequently, it is difficult to affirm that high scores justify the same interpretations for Hispanic individuals as they do for offenders of other ethnic groups (e.g., Black, White).
To determine whether a high score for Hispanic sexual offenders identifies truly high risk individuals, evaluators will need to consider factors outside of the Static-99R risk tool. These factors could include their criminogenic needs, protective factors, and any atypical reasons for scoring the items (i.e., artificially high scores).
Evaluators should also be alert to the possibility of immigrant Hispanic sex offenders reoffending in their country of origin. Although intercountry records are often incomplete and difficult to obtain, they may, nonetheless, be worth considering for individuals who spend substantial time out the country or who perceived the opportunities to offend to be greater in their country of origin than in the United States.
Conclusion
Within psychometrics, bias is an empirical term (i.e., statistically estimated quantity) rather than a principle established through debate and opinion (Reynolds & Suzuki, 2013). If there are any statistically significant differences in the outcomes due to cultural variables, such as ethnicity/race, cultural bias is empirically present.
Potential cultural bias in risk assessment tools has been an issue in the criminal justice and forensic mental health system because of the overrepresentation of ethnic minorities. Although high scores do not indicate bias, they are a sign that bias might be present. Given the fact that ethnic minorities will always be underrepresented in validity studies of the total sample, specific studies of ethnic subgroups are needed to examine the potential for bias.
In this particular study, cultural bias in predictive validity of Static-99R was evaluated among White, Black, and Hispanic sex offenders, and the findings indicated that the Static-99R works well to predict the likelihood of sexual recidivism across the ethnic sex offender groups. Further research is needed to explore potential ethnic differences in the major psychological dimensions associated with sexual crime (antisocial orientation, sexual deviancy).
Footnotes
Acknowledgements
The authors would like to thank Alejandro (Alex) Restrepo and Annie Satariano, California Department of Justice, for assistance with data collection, and Janet Neeley, Deputy Attorney General, chair of the California SARATSO Committee, for technical assistance in reviewing this note. The views expressed in this article are those of the authors and not necessarily those of Public Safety Canada or Attorney General of California.
R. Karl Hanson is a coauthor and certified Static-99R trainer. The copyright for Static-99R is held by the Government of Canada, and none of the authors receive royalties from this measure. The author, Seung C. Lee, received financial support from the California State Authorized Risk Assessment Tool for Sex Offenders (SARATSO) Committee for this study.