



Abstract
Prior work that examines different stages of gang membership (joining, time in gang, and leaving) indicates that the gang experience is unique to each individual member. However, we know little about what accounts for variations in the gang experience; particularly, with regard to the role of individual-level characteristics. This article helps to fill this gap by examining how trajectories of gang membership vary based on one multifaceted individual-level characteristic: psychopathy. Some prior work suggests that gang members high in psychopathic traits are attracted to gang life and more likely to hold leadership roles in the gang. Other work indicates that those high in psychopathy are not well suited for gang membership. We make use of the Pathways to Desistance data and group-based trajectory modeling to examine these relationships. Results indicate that the relationship between psychopathy and gang membership is dependent upon the distinct factors of psychopathy.
Introduction
Research that seeks to understand gang membership from a life course or developmental perspective has become more established over the past decade. Within this framework, gang researchers seek to understand pathways in and out of gang life as well as their timing (i.e., early/late) within the life course (Melde & Esbensen, 2011; Pyrooz, 2014; Pyrooz, Decker, & Webb, 2014; Thornberry, Krohn, Lizotte, Smith, & Tobin, 2003). Trajectory modeling is a particularly viable method for identifying patterns of gang membership given that they mirror those of the criminal career (i.e., onset/gang joining, persistence/time in gang, desistance/leaving a gang). Although these models tend to find that gang membership is predominantly a youth phenomenon and not likely to continue into adulthood (Dong & Krohn, 2016; Lacourse, Nagin, Tremblay, Vitaro, & Claes, 2003; Lacourse et al., 2006; Pyrooz, 2014), it is unclear what factors are able to distinguish between distinct patterns of gang membership (although see Pyrooz, 2014). Perhaps, most importantly, researchers need to understand what factors are related to shortened and/or extended trajectories of gang membership, as well as those related to continuing membership into adulthood. By understanding what factors alter trajectories, researchers and practitioners can develop more effective interventions and reduce the long-term consequences of gang membership. Although there are a number of such factors, research has found that self-control reduces the likelihood of leaving a gang (Pyrooz, Sweeten, & Piquero, 2013). A related, but more complex, individual-level factor that has been less explored in terms of gang involvement is psychopathy.
There is a consistent relationship between psychopathy and both serious as well as persistent offending (DeLisi, 2009). This has resulted in general agreement that psychopathic traits have a relative stability over the life course (Lynam, Caspi, Moffitt, Loeber, & Stouthamer-Loeber, 2007; Lynam, Loeber, & Stouthamer-Loeber, 2008) and that childhood and adult psychopathy look very similar (Lynam & Gudonis, 2005). Scholars have identified anywhere from two to four distinct components of psychopathy (for a review, see Hare & Neumann, 2008). For example, Hare, Hart, and Harpur (1991) isolated two distinct factors of psychopathy based on the Psychopathy Checklist–Revised (PCL-R; Hare, 1991): (a) the Affective/Interpersonal factor is characterized by glibness, superficiality, arrogance, a lack of empathy, and a manipulative nature (Factor 1) and (b) the Antisocial/Lifestyle factor includes behavioral problems, irresponsibility, and lacking goals (Factor 2; Hare et al., 1991). Although distinct from low self-control, psychopathy may be a personality marker for long-term involvement in a street gang.
Although psychopathy is associated with serious and persistent offending (DeLisi, 2009), we also know that those high in psychopathy are more likely to recidivate and, therefore, are less likely to desist from crime (Dyck, Campbell, Schmidt, & Wershler, 2013; Gretton, Hare, & Catchpole, 2004; Salekin, 2008; Vaughn, Howard, & DeLisi, 2008; Vincent, Odgers, McCormick, & Corrado, 2008). In addition, recent research indicates that psychopathy distinguishes between unique offending trajectories. McCuish, Corrado, Lussier, and Hart (2014), for example, examined four offending trajectories and found that offenders in the high-rate, slow-desisting, and the chronic offending trajectories had significantly higher scores on psychopathy as measured by the Psychopathy Checklist–Youth Version (PCL:YV; Forth, Kosson, & Hare, 2003). The current study will contribute to the broader body of research that seeks to understand trajectories of gang membership by exploring the extent to which psychopathic traits are able to distinguish between gang and nongang trajectories as well as among different trajectories of gang membership.
The Varying Links Between Psychopathy and Gang Membership
Early gang researchers, such as Yablonsky (1962), characterized gang members as psychopathic, but the role that psychopathy plays in gang membership is subject to some debate in the gang literature with others arguing that the link between psychopathy and gang membership is tenuous and that most gang members are remarkably normal (Klein, 1995; Short, 1997). The debate is unsurprising given the variety of overlapping traits across gang members and individuals with psychopathy. Factor 1 (i.e., the Affective/Interpersonal facets), for example, includes several traits that have been associated with gang membership in the broader literature such as having a grandiose sense of self-worth (i.e., similar to self-centeredness), a lack of guilt (Carson, Wiley, & Esbensen, 2017; Esbensen, Peterson, Taylor, & Freng, 2010; Hagedorn, 1988; Matsuda, Melde, Taylor, Freng, & Esbensen, 2013; Melde & Esbensen, 2011, 2014), callous/unemotional traits (Thornton et al., 2015), and low levels of empathy (Lenzi et al., 2015). Risk factors for gang membership also overlap with many Factor 2 traits such as stimulation seeking and impulsivity (Esbensen et al., 2010; Hennigan, Kolnick, Vindel, & Maxson, 2015), impersonal sexual behavior (Voisin et al., 2004), early antisocial behaviors (Klein & Maxson, 2006), and poor anger control (Mallion & Wood, 2018; Matsuda et al., 2013). Further complicating this debate is research that finds that the link between gang membership and psychopathy may vary based on the unique factors (i.e., Affective/Interpersonal and Antisocial/Lifestyle; Dmitrieva, Gibson, Steinberg, Piquero, & Fagan, 2014; Valdez, Kaplan, & Codina, 2000). This indicates that the role that psychopathy plays in gang membership is shaped not by the overall construct, but may depend upon the distinct aspects of psychopathy.
Even prior to joining a gang, individuals with psychopathy might be among those who self-select into gang life. This might be especially true for those who score high on Factor 2 (i.e., the Antisocial/Lifestyle facets), which encompasses traits such as stimulation seeking, impulsivity, and impersonal sexual behavior. Potential gang members with these traits might be attracted to the opportunities that gangs provide for fun or excitement as well as for romantic pursuits (Decker & Curry, 2000; Decker & Van Winkle, 1996). For those high in Factor 2, gang life not only provides ample opportunities for offending, but participation can diffuse responsibility for criminal acts. This decreases the likelihood of getting caught (Gottfredson & Hirschi, 1990; Kissner & Pyrooz, 2009) as well as aids in moral disengagement (Alleyne, Fernandes, & Pritchard, 2014; Alleyne & Wood, 2010).
If those who exhibit psychopathic traits, especially Factor 2, are likely to select into gangs, then the facilitation effect that gang membership has on offending behaviors (Gatti, Tremblay, Vitaro, & McDuff, 2005; Thornberry, Krohn, Lizotte, & Chard-Wierschem, 1993) may be exacerbated among these youth. More specifically, time spent in the gang will further reinforce Factor 2 traits that are already high such as impulsivity, preference for antisocial behaviors, and anger. For example, anger identity, which is higher during periods of active gang membership (Melde & Esbensen, 2014), may further escalate for those high in psychopathy. In addition, the group processes present within the gang build cohesion and further reinforce participation in violence and offending (Decker & Van Winkle, 1996). Those who demonstrate a willingness to fight and are reliable in the face of intergang conflict earn status and respect from other gang members (Goldman, Giles, & Hogg, 2014). It is possible that these reinforcing mechanisms may be exacerbated by those who already have an antisocial orientation, which may increase gang embeddedness and lengthen time spent in the gang. Relatedly, others argue that time in the gang may be extended for these individuals because those with psychopathic traits are more likely to hold a leadership role (Dmitrieva et al., 2014; Hagedorn, 1988; Yablonsky, 1962).
Despite these arguments, it is also possible that those who are high in psychopathy, especially in Factor 1 (i.e., the Affective/Interpersonal facets), are less likely to become involved in gang life. These individuals may simply not be as enticed by gang life and common motivations for joining a gang such as feeling like they are part of something or searching for status or respect (Decker & Curry, 2000; Decker & Van Winkle, 1996) might not be held in high importance to someone scoring high on Factor 1. Moreover, individuals high in Factor 1 traits such as pathological lying, shallow affect, failure to accept responsibility, and being manipulative may actually be less attractive to the gang. Research finds that gangs are active in the selection process and may limit their association with individuals they view as being too impetuous (Klein, 1995; Pyrooz & Densley, 2016; Short, 1997). For instance, gang members high in psychopathic traits might be viewed as a liability by their gang peers because they are unreliable and may cause unnecessary intergang/intragang conflict as well as attract unwanted police attention (Klein, 1995; Short, 1997). As Pyrooz and Densley (2016) argue, gang members who are unable to demonstrate their importance to the gang may remain on the periphery and thus less exposed to the reinforcements of gang life. Therefore, those high in psychopathy, especially Factor 1, may be rejected by the gang prior to or shortly after joining, thus shortening their gang trajectories.
The Current Study
Prior research that examines the connection between psychopathy and gang membership paints a rather vague portrait of this relationship (Chu, Daffern, Thomas, Ang, & Long, 2014; Dmitrieva et al., 2014; Dupéré, Lacourse, Willms, Vitaro, & Tremblay, 2007; Valdez et al., 2000). Dupéré and colleagues (2007), for example, found an association between “psychopathic tendencies” and gang involvement. Other work, using the PCL-R (Hare, 1991), differentiated between two factors of psychopathy. Valdez and colleagues (2000) used the Psychopathy Checklist–Screening Version (PCL-SV) to compare gang and nongang members on a variety of psychopathic traits. By examining both Factor 1 (i.e., the Affective/Interpersonal facets) and Factor 2 (i.e., the Antisocial/Lifestyle facets), the authors found that gang members scored higher on both factors than their nongang counterparts (Valdez et al., 2000). Most recently, work using the Youth Psychopathic Traits Inventory (YPI) has resulted in mixed findings when differentiating gang and nongang members using grandiose-manipulative, callous-unemotional, and impulsive-irresponsible traits (Chu et al., 2014; Dmitrieva et al., 2014).
While these works provide some insight into the relationship between psychopathy and gang membership, we plan to build on them by examining differences in gang trajectories as opposed to member/nonmember dichotomies. In doing so, we will not only contribute to the debate surrounding the relationship between psychopathy and gang membership, but also examine the extent to which psychopathic traits are able to differentiate between shorter and/or longer gang trajectories. In addition, we use a version of the psychopathy checklist that is specifically targeted at youth (PCL:YV) to explore gang trajectories based on two distinct factors of psychopathy (e.g., Affective/Interpersonal and Antisocial/Lifestyle). The PCL:YV is a more thorough assessment of psychopathy than the PCL-SV and one that is clinically assessed and not self-reported by the youth, such as the YPI. By relying on the clinical assessment, rather than self-report, we avoid a certain amount of shared method variance which can inflate correlations.
To help isolate the effects of psychopathy on gang trajectories, this study controls for a number of variables that have been associated with gang membership including neighborhood disorder (Hennigan et al., 2015; Maxson & Whitlock, 2002), association with delinquent peers (Hennigan et al., 2015; Thornberry et al., 2003), school attachment (Esbensen et al., 2010; Thornberry et al., 2003), unsupervised routine activities (Esbensen et al., 2010; Le Blanc & Lanctot, 1998), and parental monitoring (Esbensen et al., 2010; Le Blanc & Lanctot, 1998; Thornberry et al., 2003). Moreover, we control for a measure of gang embeddedness as it has been shown to lengthen time spent in the gang (Pyrooz et al., 2013).
Method
Sample and Procedures
The current study uses data from the Pathways to Desistance study, which is a longitudinal study of 1,354 adolescent offenders located in Phoenix, Arizona (n = 654, 48.3%) and Philadelphia, Pennsylvania (n = 700, 51.7%). 1 Participants were first interviewed between November 2000 and March 2003. Each participant was followed for 84 months and was interviewed every 6 months for the first six follow-up periods (36 months) and then yearly for the last four follow-ups. The final interview took place in March 2010. Eligibility criteria for participants of the Pathways study included juveniles who were between the ages of 14 and 18 years at the time of their index offense, who were adjudicated for at least one serious offense, and provided assent/consent. An offense was considered “serious” if it was a felony offense; however, some youth were included who had more serious misdemeanor offenses (e.g., sexual assault and weapons offenses). To ensure that the sample was not predominantly made up of drug offenders, the proportion of males who were included in the sample who were found guilty of a drug offense was restricted to 15%. At baseline, the mean age of the sample was 16.04 (SD = 1.143) with the majority being male (86.4%, n = 1,170). The sample was 41.4% Black, 33.5% Hispanic, 20.2% White, and 4.8% reported their ethnicity as other.
The data consist of semi-structured clinical assessments and self-reported information provided by the adolescent who was validated using official records (e.g., arrest and court records). Consent from the adolescent and their caretaker was obtained prior to the baseline interview. Interviewers met with adolescents at their homes or in an agreed upon location to conduct the computer-assisted interviews. Interview questions were read aloud by the interviewer to bypass any literacy limitations, and the juveniles gave verbal responses in return. A portable keyboard was provided to the adolescent to encourage honesty when responding to questions regarding sensitive material. The interviews were conducted in private and participants were guaranteed confidentiality of their responses. Baseline interviews took place during two, 2-hr sessions and follow-up interviews lasted roughly 2 hr each. Each respondent was paid US$50 for their participation.
Key Variables
Gang Involvement
Gang involvement was measured based on the participant’s response (0 = no, 1 = yes) to a single item asking them whether they were a member of a gang during the recall period (i.e., since previous interview). Self-nomination has been consistently found to be a valid measure of gang status (Decker, Pyrooz, Sweeten, & Moule, 2014; Esbensen, Winfree, He, & Taylor, 2001; Thornberry et al., 2003).
Psychopathy
To measure psychopathy, the PCL:YV (Forth et al., 2003) was used to assess youth at baseline. The PCL:YV is a 60- to 90-min semi-structured interview that assesses psychopathy. Because of the study design, it was not possible to accommodate an interview of this length. Thus, questions from the PCL:YV interview guide were incorporated into the Pathways baseline interview battery as open-ended questions. Utilizing this information, along with collateral information (i.e., court records and parent interviews), the PCL:YV was scored by interviewers after the baseline interview was completed without the youth present and a score was derived. Specifically, the interviewer rated each youth on 20 separate items on a 3-point ordinal scale: 0 = item does not apply to the youth, 1 = item applies to a certain extent, and 2 = item applies to the youth. The PCL:YV captures both the Affective/Interpersonal aspects of psychopathy (i.e., Factor 1; α = .76) and the Antisocial/Lifestyle aspects of psychopathy (i.e., Factor 2; α = .78) in addition to the total PCL:YV score (α = .87). As it was measured during the baseline interview, psychopathy was treated as a time-stable variable and viewed as having relative stability across the life course, which is consistent with prior research (Lynam et al., 2007; Lynam et al., 2008).
Control Measures
Gang Embeddedness
This study makes use of the same five items that were combined to construct a measure of gang embeddedness by Pyrooz et al. (2013): frequency of contact with the gang, position in the gang, importance of the gang, nongang member friends, and involvement in gang fights. These variables were measured in the baseline survey and only asked of active gang members. We imputed responses using multiple imputations (see below) for those individuals who were not in a gang at baseline, but reported gang membership in a later follow-up. Individuals who never reported gang membership (i.e., nonmembers) were classified as having zero gang embeddedness. Similar to Pyrooz et al. (2013), gang embeddedness theta scores were created using item response theory analysis and these scores were then standardized.
Neighborhood Disorder
The Neighborhood Conditions Measure (Sampson & Raudenbush, 1999) was used to assess neighborhood disorder. Participants responded to 21 items measuring physical (e.g., “graffiti or tags”) and social (e.g., “adults fighting or arguing loudly”) disorder in their neighborhoods using a 4-point Likert-type scale that ranged from 1 (never) to 4 (often). Total neighborhood disorder at baseline was calculated by summing all items and averaging them (α = .94). Higher values suggested greater levels of perceived neighborhood disorder.
Delinquent Peer Association
Peer delinquency was measured using a subset of items from the Rochester Youth Study (Thornberry, Lizotte, Krohn, Farnworth, & Jang, 1994). Participants were asked to report the number of friends who engaged in a variety of antisocial acts (e.g., “During the last 6 months how many of your friends have sold drugs?”) using a 5-point Likert-type scale that ranged from 1 (none of them) to 4 (all of them). The responses to each item were summed and averaged to create a total score for peer delinquency in which higher scores indicated more peer delinquency (α = .92).
School Attachment
Two dimensions of school attachment were assessed based on 13 items taken from Cernkovich and Giordano’s (1992) measure: Bonding to Teachers (e.g., “Most of my teachers treat me fairly”) and School Orientation (e.g., “Schoolwork is very important to me”). Participants responded to statements using a 5-point Likert-type scale that ranged from 1 (strongly disagree) to 5 (strongly agree). The items were summed for each dimension and the mean was then computed—higher scores indicate greater levels of school attachment for both dimensions. 2
Routine Activities
The unsupervised routine activities measure was adapted from the “Monitoring the Future Questionnaire” (Osgood, Wilson, O’Malley, Bachman, & Johnston, 1996). Four items were included to capture unsupervised socializing (e.g., “How often did you get together with friends informally?”). Responses were measured on a 5-point Likert-type scale that ranged from 1 (never) to 5 (almost every day). The mean of these four items were taken to compute a total score. The routine activities measure demonstrated moderate internal consistency (α = .62).
Parental Monitoring
Parental monitoring was measured using four items taken from the Parental Monitoring Inventory (Steinberg, Lamborn, Dornbusch, & Darling, 1992). After establishing the primary caregiver of the participant, the youth was asked to report on that person’s attempts to monitor their behavior (e.g., “How often do you have a set time to be home on weekend nights?”). Participants indicated the degree of monitoring for each item using a 4-point Likert-type scale that ranged from 1 (never) to 4 (always). To derive a total parental monitoring score, these four items were summed and averaged (higher values indicated greater levels of monitoring).
Proportion of Time on the Street
To account for opportunity for street gang involvement, we controlled for the proportion of time in the community. This variable was taken from the life event calendars in which youth were asked to report the number of days they were in a secure facility (e.g., detention, drug/alcohol treatment, contracted residential) during the recall period. A variable was then created that represents the number of days not in a secure facility (numerator) out of the number of days in the recall period (denominator). Values reflect the proportion of time that the youth was not in a secure facility.
Demographic Characteristics
Three variables were included in the models to control for demographic characteristics including gender (1 = male, 2 = female), race/ethnicity (1 = White, 2 = Black, 3 = Hispanic, 4 = other), and site (1 = Philadelphia, 2 = Phoenix). Four dummy variables were created from the race/ethnicity variable for each category and the Black category was used as the reference group in multivariate models.
Analytic Plan
All analyses were conducted using Stata 15 (StataCorp, 2017). To identify unique developmental patterns of gang involvement, semiparametric group-based trajectory modeling (Nagin, 2005) was conducted using the traj plugin designed for Stata (Jones & Nagin, 2013). We first modeled gang trajectories by examining self-reported gang membership by age (i.e., age was the time variable). Specifically, at each age, we included the binary measure of gang involvement to identify patterns of gang involvement across the observed developmental period. Because involvement in a street gang may be contingent on whether or not the youth was in secure placement, we also included proportion of time on the street as a time-varying covariate when estimating the trajectory models. It should be noted that age categories at the extreme lower and upper ends (i.e., ages 14, 15, 24, 25, and 26) were not well represented in the data; therefore, we only examined trajectories between ages 16 and 23. In addition, we did not include Wave 1 gang data, as all risk factors predicting gang membership were measured at baseline. We excluded those individuals who had less than three valid (i.e., nonmissing) measures of gang membership across all waves (n = 27). We also excluded those individuals who reported their race/ethnicity as “other” given that this was such a small portion of the sample (n = 65). 3 This led to the exclusion of 90 individuals and a final sample of 1,264. 4
Given that gang membership at each wave was a binary measure, the current study modeled trajectories using the logit link. Model selection was done in accordance with Nagin’s (2005) guidelines (i.e., for each number of groups, each trajectory was initially fully parameterized as a quadratic specification). The highest order term associated with each trajectory that was not statistically significant was dropped and the model was then reestimated until the highest order parameter estimate was statistically significant for each group. At this point, cross-model comparisons were made based on the Bayesian information criteria (BIC), the sample size–adjusted BIC, Akaike information criteria (AIC), and the mean posterior probabilities of group classification. The BIC, sample size–adjusted BIC, and AIC indicate a better fitting model as their values increase (i.e., become less negative). The mean posterior probabilities describe the average probability of assignment for each group—values closer to 1, therefore, represent less ambiguity in group assignment. Values of .70 or higher represent an accurate classification (Nagin & Odgers, 2010).
Once the best-fitting model was identified, the individuals were then classified into the group for which they had the highest probability of belonging. Analysis of variance (ANOVA) analyses were used to examine bivariate relationships across each of the identified trajectories. We then used the “group classification” variable as an outcome in a multinomial logistic regression model where it was regressed onto predictors and control variables. Multinomial logistic regression was employed to account for the unordered, categorical nature of the outcome variable representing group membership. Because participants were missing data on several risk factors included in the model, the multinomial logistic regression model was conducted using multiple imputed data sets that were created using the multiple imputation technique in Stata (20 imputations).
Results
Identifying Trajectories of Gang Membership
A series of five models were specified to identify the number of trajectory groups that best fit the data as well as the shape of those trajectories. The model fit indices suggest that the four-class model is the best-fitting model as the BIC (–1,825.81), adjusted BIC (–1,946.85), and AIC (–1,776.96) surpass recommendations made by Nagin (2005). In addition, the average posterior probabilities were all fairly high (0.87, 0.98, 0.93, 0.97) suggesting accurate classification of individuals into their respective trajectories. The two- and three-class models had better mean posterior probabilities, but worse values (i.e., closer to 0) on BIC, adjusted BIC, and AIC. In addition, these values were closer to 0 in the less parsimonious five-class model, which also had worse mean posterior probabilities. All trajectories in the four-class model were significant with the highest order being a quadratic term for each identified group. The trajectory patterns are presented in Figure 1. The largest group followed a pattern of having a very low probability of being a member of a gang across all age points (Nonmember; n = 1,045). The second largest group was characterized as having a moderate probability of gang involvement at age 16.5, but showed an immediate decline in gang involvement (Adolescent Desister; n = 114). Another group followed a similar pattern, but desisted a bit later (age 19) and had a higher probability of gang involvement to start with (Young Adult Desister; n = 58). Finally, the smallest trajectory group was one that started with average probability of gang membership at age 16, but immediately increased to having a high, stable level of gang membership from age 19 to 23 (Adult Joiner, Persister; n = 47).

Graphical depiction of gang membership trajectories
Distinguishing Between Gang Trajectories
Table 1 presents the bivariate correlations among the variables that will be included in the model to predict trajectory group membership. All of the variables are correlated in the expected direction. It is important to point out that, of course, the PCL:YV total is strongly correlated with both factor scores. Alternatively, the factor scores are moderately positively correlated, suggesting that while they share some explained variance, they are distinct factors. Table 2 presents the descriptive statistics for the full sample as well as the results from ANOVAs comparing mean differences in explanatory variables across the identified trajectory groups based on the F statistic. With regard to differences on the PCL:YV, the Young Adult Desister group showed the highest mean levels on the total score, the Adolescent Desister group showed the highest mean scores on Factor 1, and the Adult Joiner, Persister group had the highest mean scores on Factor 2. It appears, then, that there are differences across the different Affective/Interpersonal and Antisocial/Lifestyle facets of psychopathy.
Bivariate Correlations, Means, and Standard Deviations Among Study Variables

Note. PCL:YV = Psychopathy Checklist–Youth Version.
p < .05. **p < .01. ***p < .001.
Mean Comparisons for Explanatory Variables Across Trajectory Group

Note. All significant differences are based on Bonferroni post hoc comparison (p < .05). PCL:YV = Psychopathy Checklist–Youth Version.
Significant difference between Nonmember and Adolescent Desister groups. bSignificant difference between Nonmember and Young Adult Desister groups. cSignificant difference between Nonmember and Adult Joiner, Persister groups. dSignificant difference between Adolescent Desister and Young Adult Desister groups. eSignificant difference between Young Adult Desister and Adult Joiner, Persister groups.
Table 3 presents the findings from three multinomial logistic regression models predicting trajectory group membership using each of the groups as the comparison categories (redundant comparisons were removed from the table). Columns 1 to 3 present the model for which the Nonmember group was the comparison. The analyses show that the PCL:YV Factor 2 scores were slightly higher for the Adolescent Desister group compared with the Nonmember group—a difference that failed to reach significance at p = .06. Moreover, the Adolescent Desister group did not differ on Factor 1 scores when compared with those in the Nonmember group. Those in the Young Adult Desister group did not differ on PCL:YV scores from the Nonmember group. Finally, the Adult Joiner, Persister group had lower scores on the PCL:YV Factor 1, but had higher Factor 2 scores compared with the Nonmember group. Columns 4 and 5 present the results when using Adolescent Desister as the comparison group. Those in the Adult Joiner, Persister group scored lower on PCL:YV Factor 1, but did not differ on Factor 2 scores. Finally, column 6 presents the results where the Young Adult Desister was the comparison group. Based on this model, the Young Adult Desister group did not differ significantly from the Adult Joiner, Persister group on either PCL:YV Factor.
Multinomial Logistic Regression Model Comparing All Groups on PCL:YV Scores and Covariates
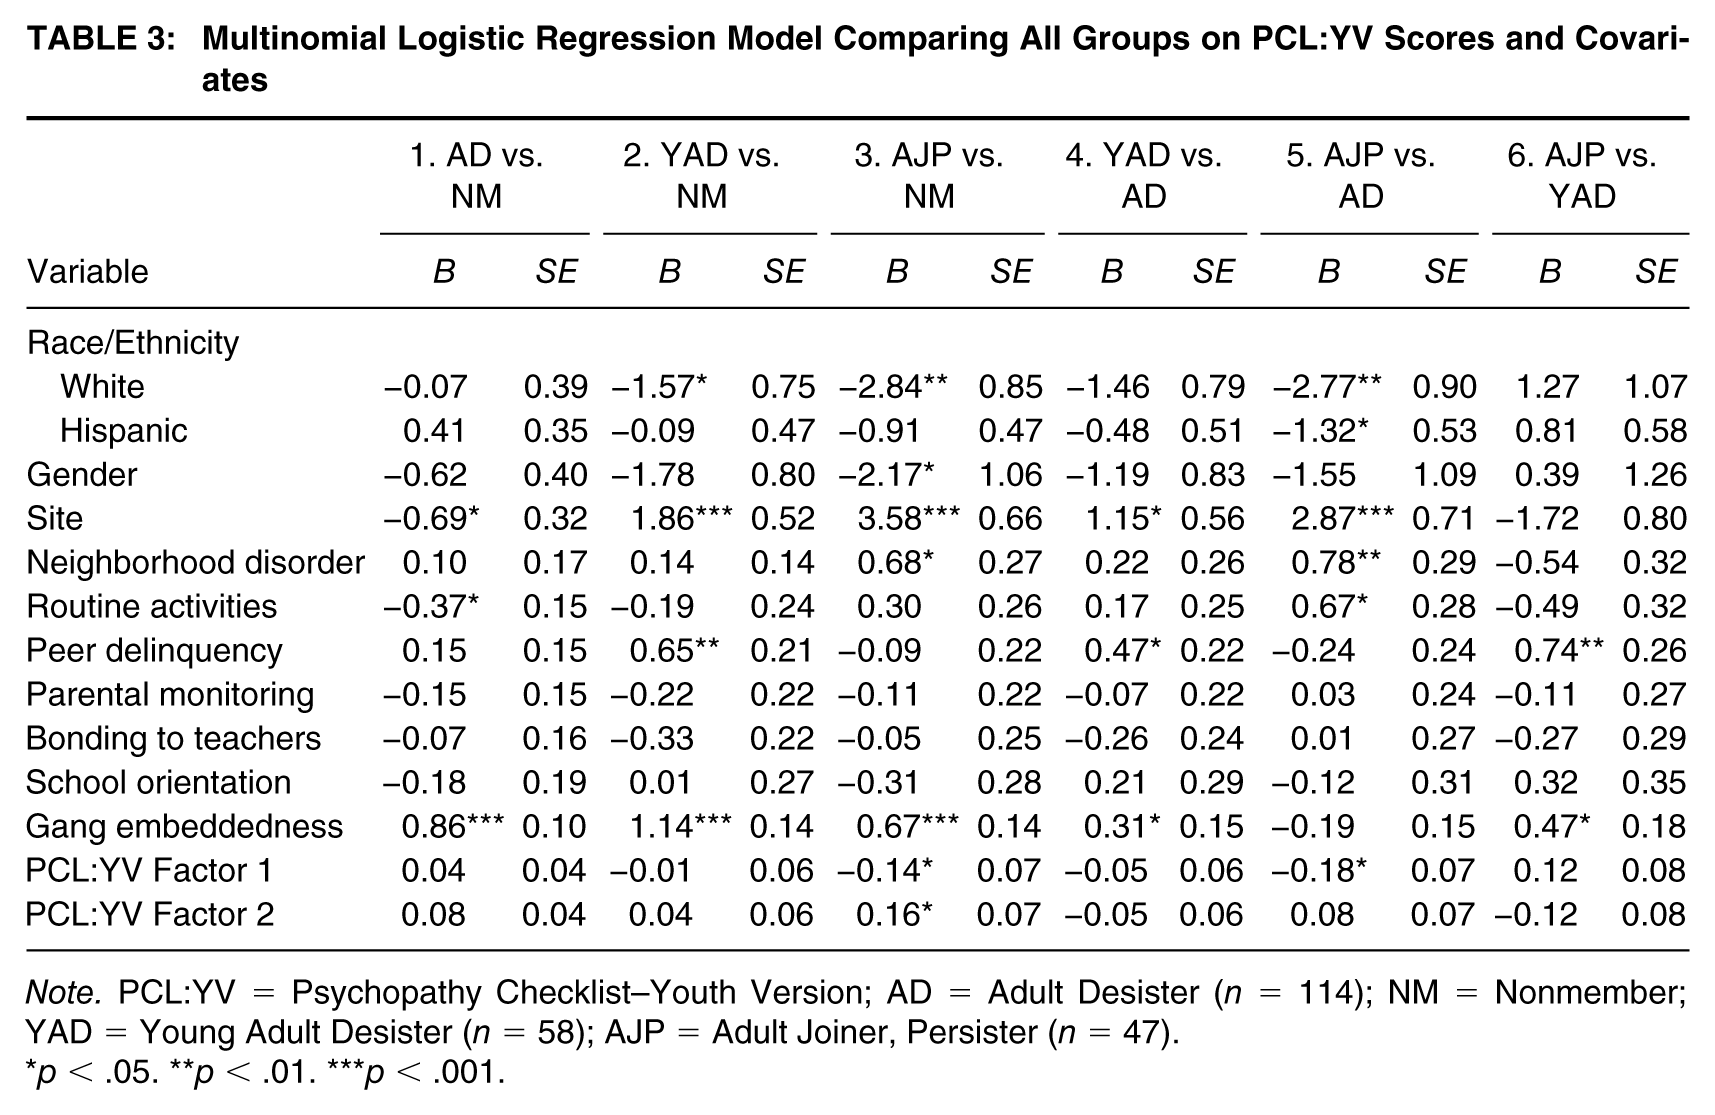
Note. PCL:YV = Psychopathy Checklist–Youth Version; AD = Adult Desister (n = 114); NM = Nonmember; YAD = Young Adult Desister (n = 58); AJP = Adult Joiner, Persister (n = 47).
p < .05. **p < .01. ***p < .001.
Figures 2 and 3 present the predicted probabilities for the gang member groups for Factors 1 and 2, respectively. These figures show that as Factor 1 scores increase, the probability of being in the Adolescent Desister group decreases, holding all other variables at their means. However, the probability of being in either the Young Adult Desister or Adult Joiner, Persister group decreases as Factor 1 scores increase (Figure 2). Alternatively, for Factor 2 scores, the probability of being in any of the gang trajectory groups increased as scores on the PCL:YV increased; however, this was much more pronounced for the Adolescent Desister group.

Predicted Probabilities for Psychopathy Checklist–Youth Version (PCL:YV) Factor 1 for the Three Gang Trajectories Holding All Covariates at Their Means

Predicted Probabilities for Psychopathy Checklist–Youth Version (PCL:YV) Factor 2 for the Three Gang Trajectories Holding All Covariates at Their Means
Discussion
Researchers hold differing viewpoints as to the link between psychopathy and gang membership. Some argue that individuals with high levels of psychopathy will be attracted to the gang lifestyle and others state that these same individuals will not be well suited for the gang. Moreover, prior work that compares psychopathic traits across gang and nongang members finds variation across the two different factors: Affective/Interpersonal and Antisocial/Lifestyle. Within this article we attempted to examine the extent to which psychopathic traits are able to distinguish between gang and nongang trajectories as well as among different trajectories of gang membership. To examine these connections, we first identified unique trajectories of gang membership within the data. Much of the prior literature on gang trajectories is limited to an entirely youth sample (e.g., 18 years of age and younger—although see Pyrooz, 2014); therefore, our ability to extend the trajectories to the age of 23 helps to improve understanding of both the youth and young adult gang involvement in the United States. The analyses identified three unique gang membership trajectories as well as a nongang group. The bulk of prior research identifies a youth gang problem where gang membership peaks around mid-adolescence (Craig, Vitaro, Gagnon, & Tremblay, 2002; Esbensen & Huizinga, 1993; Pyrooz, 2014) and lasts only about 2 years (Esbensen & Huizinga, 1993; Gordon et al., 2004; Melde, Diem, & Drake, 2012; Pyrooz et al., 2013; Thornberry et al., 2003). Two of our trajectories, Adolescent Desister and Young Adult Desister groups, are consistent with this literature and make up the bulk (79%) of our gang member sample. The third gang group in the sample, the Adult Joiner, Persister group, is believed to represent older gang members who might have a more stable involvement. Moreover, Black (compared with White and Hispanic) individuals were significantly more likely to belong to the Adult Joiner, Persister group as were males, which is more consistent with official records (see also Pyrooz, 2014).
Our first goal was to examine differences in psychopathy between gang and nongang trajectories—or determine whether or not psychopathy was associated with gang joining. Similar to other research, our findings indicate that the relationship between psychopathy and gang involvement was unclear. While psychopathy was unable to differentiate the Nonmember group from the Young Adult Desister group, individuals who scored high on Antisocial/Lifestyle facets (Factor 2) were more likely to belong to Adult Joiner, Persister groups. This indicates that those who score high on this specific factor of psychopathy may seek out the rewards of gang life and the opportunities that the lifestyle can provide (i.e., fun, excitement, etc.). The Adult Joiner, Persister group had lower scores on the Affective/Interpersonal facets (Factor 1) than those in the nongang group. This was not entirely unanticipated as it was possible that individuals who were high in this particular factor of psychopathy were those who were not as attracted to or suitable for gang life as other individuals. For example, the “loner” nature of those high in psychopathy may indicate that they are not interested in being involved with peers or to seek out the social capital associated with gang involvement (Buss, 1966; Goldweber, Dmitrieva, Cauffman, Piquero, & Steinberg, 2011). In addition, certain traits associated with Factor 1 (e.g., pathological lying, manipulation, failure to accept responsibility) may make individuals high on this factor of psychopathy less attractive to the gang (see Pyrooz & Densley, 2016). In other words, these individuals may be isolated from gang peers just as they are from prosocial peers.
Our second goal was to determine whether or not psychopathy was able to distinguish between different trajectories of gang membership. When comparing the Adolescent Desister group with other gang trajectories, our results provided only limited insight into the ability of psychopathy to shorten or lengthen gang trajectories. Psychopathy was not able to distinguish between the shortest trajectory (e.g., Adolescent Desister) and those that persisted in their gang membership (e.g., Adult Joiner, Persister). It is important to note that individuals high in Factor 1 psychopathy had the shortest gang trajectory, which could be considered consistent with arguments that those high in psychopathy, especially in Factor 1, are not a good fit for the gang. Overall, our results implied that the two distinct factors of psychopathy are more capable of distinguishing between gang versus nongang status than different trajectories of gang membership. Factor 1, the Affective/Interpersonal facets, seemed to be less associated with gang membership overall and was higher among the shortest trajectory group. The Antisocial/Lifestyle facets (Factor 2) were able to differentiate the Adult Joiner, Persister group from the other trajectories of gang membership. It is important that researchers who are trying to understand the link between psychopathy and gang membership continue to explore these relationships at the facet level. Our results in combination with those of prior research (Chu et al., 2014; Dmitrieva et al., 2014; Valdez et al., 2000) also indicated that the psychopathy measures should be disaggregated further and examined at the trait level.
Although not the central goal of this article, the results did provide valuable information into other factors that may distinguish between gang trajectories. Levels of gang embeddedness, for example, were somewhat correlated with gang member trajectories. As we would expect based on prior work with these data (Pyrooz et al., 2013), those who stayed in the gang longer (e.g., Young Adult Desister group) had higher levels of gang embeddedness compared with the Adolescent Desister group. However, there were no significant differences found between the Adolescent Desister group and the Adult Joiner, Persister group on gang embeddedness. That said, this finding could be due to limitations in the gang embeddedness variable. First, we only included a baseline measure of gang embeddedness, which, given that it is a fluid concept, may have made the measure less reliable among older gang youth like those belonging to the Adult Joiner, Persister group. Second, because gang embeddedness questions were not asked of nongang members, we had to assume that these youth had zero gang embeddedness. This assumption is likely inaccurate as we know that even nongang members may have some attachments to gangs (Pyrooz et al., 2013). Due to these limitations, our findings with regard to gang embeddedness should be interpreted with caution.
Neighborhood disorder also appears to distinguish between gang trajectories. Those who belonged to the Adult Joiner, Persister group resided in significantly more disadvantaged neighborhoods when compared with both the nongang group and the Adolescent Desister group. It is possible that this environment provided increased opportunities to socialize with and access individuals enmeshed in gang life, which might extend one’s gang trajectory. Related to this, it is possible that context (i.e., neighborhood) may have played a role in the mixed findings with regard to psychopathy. Some psychopathy researchers argue for the idea of a “secondary psychopathy” in which individuals meet the definition of psychopathy, but only because of the consequences of environmental factors and growing up in a delinquent subculture (Hare, 1970; Valdez et al., 2000; Vaughn, Edens, Howard, & Smith, 2009). These ideas complicate the classification of any offender as having psychopathic traits, but is particularly problematic when classifying gang members. Youth who become gang-involved face several risk factors (Esbensen et al., 2010; Vigil, 1988) and the relationship between neighborhood disorder (i.e., residential instability) and gang membership has been found to be stronger in the presence of psychopathic tendencies (Dupéré et al., 2007). Therefore, it is important for future research to account for the interactive effect of neighborhood context on the relationship between psychopathy and gang status.
Limitations and Future Research
While this research contributed in some measure to literature on gang trajectories as well as psychopathy, it is not without its limitations, which we hope can inform future research in this arena. First, this work, as well as research using trajectory modeling, in general, suffers from the limitation of only providing a partial look at a one’s life course (Elder, 1985; Sampson & Laub, 1993). This study, in particular, is limited to the developmental period between the ages of 16 and 23, which is only a small portion of life trajectory. Future research should explore trajectories of both gang members and individuals with psychopathic traits both early and late in their life course. Second, the high-risk nature of this sample may be capturing more serious gang members. Therefore, our findings may not be consistent with research that relies upon gang samples drawn from school-based populations. Third, our measure of delinquent peer associations relies upon youth’s perceptions of his or her peers. These assessments are not believed to be as accurate as those taken from social network analysis as youth may be projecting their own behavior onto their peers (Haynie, 2001; Matsueda & Anderson, 1998). Understanding how psychopathy alters experiences within the gang remains an important avenue for future research as this work indicates that levels of psychopathy can distinguish between gang trajectories. It is particularly important to understand the impact of psychopathy on the gang disengagement process. Similar to self-control (Pyrooz et al., 2013), those with psychopathy may have a harder time accessing turning points for desistance from crime as well as gangs.
Policy Implications
Although this work has many implications for research, it can help to inform policy as well. This work improved our understanding of the variables capable of distinguishing between gang trajectories, which can be beneficial in determining effective interventions into and out of gang life (Krohn & Thornberry, 2008). The findings presented in this article demonstrate mixed support for psychopathy’s ability to differentiate trajectories of gang membership. Therefore, we are hesitant to make recommendations for the treatment of gang youth based on psychopathic tendencies. That said, the presence of psychopathic traits correlated with the gang trajectory representing those youth who joined late and remained in the gang. This indicates that assessing levels of psychopathy among gang members could help to identify appropriate interventions for this population in particular. For example, others have argued that if gang members demonstrate low levels of psychopathy, then it may be reasonable to advocate for interventions associated with increasing the education and employment opportunities for those trying/wanting to exit gang life (Klein, 1995). Conversely, when high levels of psychopathy are present, these resources should be combined with some form of therapeutic treatment tailored to the specific deficits associated with psychopathy (Valdez et al., 2000; Yablonsky, 1962). Overall, our results indicate that understanding the levels of psychopathy among gang youth can paint a clearer picture of the needs of the gang member.
Footnotes
Acknowledgements
We would like to thank Shayne E. Jones for his comments on early drafts of this manuscript.
