
Abstract
Compared with young men, justice-involved young women are often characterized by a greater array of risk factors, yet show a more limited pattern of offending. This paradox may be related to risk factors functioning differently not only for male versus female adolescents but also among female adolescents involved in offending. Data were used on 284 girls from the Incarcerated Serious and Violent Young Offender Study to address whether risk factors varied across different offending trajectories modeled between ages 12 and 23. Risk factors measured from self-report interviews were compared across the three trajectories identified. Individual, family, and school risk factors varied across trajectory groups, but not always in ways anticipated. Female offending does not appear to fit neatly within existing developmental criminology theory. Theoretical models should be adapted, or new models developed, to account for the complexities of female offending patterns.
Introduction
By the late 1990s, the “invisible girl” could be ignored no longer; officially recorded violent crime among female youth was increasing 1 and the gap in offending rates between male and female youth was diminishing (Savoie, 1999). Two important questions to address from a developmental criminology perspective include whether there are (a) distinct female offending patterns across developmental periods and (b) key childhood and adolescent life experiences that help explain these differences (Loeber & Le Blanc, 1990). These questions were addressed in the current study by using a subsample of girls (n = 284) from the Incarcerated Serious and Violent Young Offender Study (ISVYOS; Corrado & McCuish, 2018) to study risk factors associated with offending trajectories between ages 12 and 23.
Daly’s (1992) feminist pathway perspective pushed back against conceptualizations of young women involved in crime as a homogeneous group. Daly (1992) identified five distinct pathways to female involvement in crime (e.g., harmed and harming, battered women, street women, drug connected, and other). Since Daly’s (1992) initial study, pathway investigation research identified pathways that are both unique to women involved in crime (Gehring, 2018) and heterogeneous across female subgroups (Brennan et al., 2012; Broidy et al., 2018; Salisbury & Van Voorhis, 2009). Feminist pathways research also demonstrated the potential for variability in criminal history characteristics across identified pathways, such as age of onset, chronicity, and offense type (e.g., Brennan et al., 2012; Broidy et al., 2018). Developmental frameworks have been slow to adopt these heterogeneous conceptions.
Moffitt’s (1993) dual taxonomy outlined two unique offending trajectories: adolescence limited (AL) and life course persistent (LCP). AL offending emerges in mid adolescence and then ends prior to adulthood. LCP offending emerges as young as childhood and continues at a high rate through adulthood. Risk factors for AL offending included observing peers’ rewards for engaging in delinquency and attempting to bridge the maturity gap, whereas risk factors for LCP offending included the interaction between neuropsychological deficits and exposure to a negative environment (Moffitt, 1993). Moffitt and Caspi (2001) argued that the dual taxonomy was generalizable to women, but that women were 10 times less likely than men to follow the LCP pathway. This assertion essentially reduced female delinquency to a single dimension. More recent empirical studies have questioned whether a single AL offending pattern sufficiently accounted for the heterogeneity of female offending (El Sayed et al., 2017).
Patterns of Offending
Developmental theorists and proponents of the criminal career framework posited that the age–crime curve represented an aggregation of several distinct offending trajectories. Offending trajectories describe within-individual change or stability in patterns of offending over the life course. Although there are numerous examples of studies examining offending trajectories, rarely do such studies include women (Jennings & Reingle, 2012), and most studies that do rely on mixed samples rather than examining offending trajectories specific to a female sample (cf. Ahonen et al., 2016). Studies using mixed samples showed that women were disproportionately associated with low-rate or nonoffending trajectories compared with men (Block et al., 2010; Blokland et al., 2005; Bongers et al., 2004; Broidy et al., 2015; Wiesner & Windle, 2004; Yessine & Bonta, 2008). These findings reiterated assertions about the lack of heterogeneity in patterns of female offending (Moffitt & Caspi, 2001).
Heterogeneity in female offending may be masked in samples that include both boys and girls due to the disproportionately higher prevalence of male chronic offending. However, investigations of community samples of women also identified limited heterogeneity. Three trajectories were typically identified that were defined by nonoffending, low-rate offending, and high-rate offending (Ahonen et al., 2016; Cohen et al., 2010; D’Unger et al., 2002; Jennings et al., 2018; Loeber et al., 2017). In these studies, the nonoffending trajectory was most prevalent, ranging from 72.5% (Loeber et al., 2017) to 89.9% (Cohen et al., 2010). Cohen et al. (2010) suggested that female offending patterns amounted to either offending or nonoffending, which aligned with Moffitt and Caspi’s (2001) perspective. The lack of heterogeneity identified within community-based studies may relate to a tendency to only follow participants until mid to late adolescence (e.g., Ahonen et al., 2016; Jennings et al., 2018; Lahey et al., 2006; Loeber et al., 2017). A longer follow-up period may be needed given that Moffitt (1993) asserted that AL and LCP offending patterns would resemble each other during adolescence. Moreover, shorter follow-up periods can underestimate heterogeneity in offending patterns (Eggleston et al., 2004). In addition, community-based studies sampling from schools may underestimate the prevalence of high-rate offending because those with the most frequent pattern of offending have often dropped out of school (McCuish, 2017). Samples of justice-involved persons may be useful for overcoming this limitation.
Research utilizing high-risk or justice-involved female samples identified between two and five trajectories (Andersson et al., 2012; Blokland & van Os, 2010; Cauffman et al., 2015, 2017; Jennings, 2011; Widom et al., 2018). Trajectories defined by the absence of offending were still most prevalent (58.7% in Jennings, 2011; 73.2% in Widom et al., 2018). However, distinct developmental patterns emerged, especially when studies used a longer follow-up period. Variations in the onset of offending were evident (Andersson et al., 2012; Blokland & van Os, 2010). The developmental period in which desistance occurred also varied (Blokland & van Os, 2010; Cauffman et al., 2015). Importantly, these studies identified a group of women associated with high-rate and persistent offending. In sum, when examining women separate from men, there appears to be some heterogeneity in female offending trajectories. This research can be built upon by examining whether risk factors vary between women associated with different patterns of offending across multiple age stages.
Risk Factors for Female Offending
Examinations of female offending are needed especially because of the possibility that risk factors function differently for justice-involved men and women. For example, McCuish (2017) found that compared with male youth, a higher threshold of risk factor accumulation was needed before female youth become involved in crime (McCuish, 2017). To address concerns about the atheoretical nature of the risk factor paradigm, Catalano and Hawkins’ (1996) social developmental model relied on social bond theory and social learning theory principles to specify key risk and protective factors within individual, family, and school domains. Outcomes at one developmental period were posited to affect outcomes for the subsequent developmental period (Catalano and Hawkins, 1996). The social development model was used to guide the measurement of risk factors from individual, family, and school domains, and risk factors from these domains have been used in prior research to better understand the development of female high-rate/chronic offending.
From the individual-level domain, different studies have identified substance use (Cauffman et al., 2015; Wolff et al., 2017), lower self-esteem (Fergusson & Horwood, 2002), and exposure to violence/victimization as risk factors that distinguish higher from lower rate patterns of offending among women (Odgers et al., 2007; Weaver, 2010). At the family-level domain, involvement in crime and substance use (Cauffman et al., 2015; Fergusson & Horwood, 2002; Odgers et al., 2007), family conflict, and ineffective parenting practices (Fergusson & Horwood, 2002; Jennings et al., 2010; Odgers et al., 2008) help to distinguish between young women with higher versus lower levels of offending. At the school-level domain, weaker bonds to schools (Catalano et al., 2004) including school suspensions (Wolff et al., 2017) and dropping out of school (Weaver, 2010) helped distinguish between higher versus lower levels of offending among young women.
Current Study
We built upon the above-mentioned earlier research by examining whether risk factors from individual-, family-, and school-level domains helped to better understand heterogeneity in patterns of female offending using a justice-involved sample of girls whose offending involvement was measured through emerging adulthood. Primarily because female adolescents have been characterized either as involved or not involved in offending, there is limited understanding of what their offending might look like across multiple developmental periods and whether there are risk factors informative of these different patterns. This study evaluated (a) developmental trajectories of official-record offending between adolescence and emerging adulthood in a high-risk female sample and, subsequently, (b) whether early childhood and adolescent life experiences were associated with the different offending patterns identified.
Method
Sample and Procedures
The ISVYOS (Corrado & McCuish, 2018) is an ongoing prospective longitudinal study following 1,721 incarcerated adolescents, 1,548 of whom were initially interviewed in adolescence while incarcerated in the province of British Columbia, Canada, between 1998 and 2011. All male and female youth admitted to custody during this period were eligible to participate in the study. A data collection hiatus between 2003 and 2005 produced two cohorts of study participants, those interviewed before 2003 (Cohort I) and those interviewed after 2005 (Cohort II). Youth were interviewed upon their admission to custody and, as such, the age at which the interview took place varied across participants. The average age at intake interview was 15.84 years (SD = 1.27 years). The sample (n = 284) included all girls with an intake interview who had criminal history data coded through at least age 18 at the most recent wave of data collection in the summer of 2016.
The Ministry of Children and Family Development is responsible for all incarcerated youth in the province and permitted the ISVYOS research team to recruit participants. Ethical approval was provided by Simon Fraser University’s research ethics board. Youth were approached by research assistants (RAs) while residing in their custody unit and asked whether they wanted to participate in the study. Youth interested in participating were brought to a private room away from other residents and staff. To obtain assent, participants were read and given a copy of an information sheet explaining the purpose of the study, how information would be collected (e.g., interview and file information), that they could withdraw at any time, and that all information would be kept confidential unless the participant made a direct threat against themselves or someone else. It was explained that their involvement in the study would not affect their stay at the custody center. Approximately 5% of youth declined to participate. Youth were compensated with juice and potato chips. Trained RAs conducted the intake interview, which was typically spread over 2 days and required about 90 min to complete.
Measures
Official Record Offending for Trajectory Analysis
Offending was measured using official criminal history data from BC Corrections’ computerized system, Corrections Network (CORNET). CORNET contains specific details of each youth’s criminal offenses, including date of offense, date of conviction, sentence received, and each youth’s movements in and out of custody. These details allowed us to identify, for each participant, the number of convictions that incurred at each year of age, starting at age 12 (i.e., the age of criminal responsibility in Canada) through until participants’ age at the most recent wave of data collection. Convictions at each year of age between ages 12 and 23 were used as the outcome of interest to model conviction trajectories. This represented a 12-year follow-up period capturing multiple developmental stages. Most of the sample (71.8%, n = 204) were followed for all 12 years and all participants were followed until at least age 18 (i.e., 7 years of follow-up data). For participants younger than 23 years at the time of the data collection in the summer of 2016, criminal history data were coded as missing (e.g., for the participant at age 20, criminal history data between ages 21 and 23 were coded as missing). Time spent in custody for each year of age was used as an exposure variable when modeling conviction trajectories. CORNET only tracks offenses committed within the province of BC. In line with previous research (e.g., Eggleston et al., 2004), if a youth in the sample died (1.8% of the sample, n = 5) or moved out of province (1.8%, n = 5), convictions measured after the date of death or movement were coded as missing.
Risk Factors Associated With Trajectory Group Membership
Participants received a one-to-one structured intake interview in which RAs read a questionnaire to participants and recorded their answers. Regarding demographic characteristics, participants self-reported the ethnic group they felt most represented themselves: Indigenous (37.3%, n = 103), White (54%, n = 149), or a non-Indigenous minority (8.7%, n = 24; see Table 1). In line with the social development model (Catalano & Hawkins, 1996), from the interview, we selected risk factors from individual (e.g., substance use, identity, aggressiveness, abuse, and sexuality), family (e.g., family dysfunction including running away from home and family problems), and school (e.g., attendance, changing schools) domains as covariates used to predict trajectory group assignment.
Description of the Sample
Note. All values reported were imputed, except ethnicity.
Substance Use
Respondents were asked to indicate the age at which they first experimented with alcohol and illicit substances. To establish temporal order between substance use and offending trajectories, responses were transformed into two binary indicators: alcohol use before 12 (35.2%, n = 100) and drug use before 12 (34.9%, n = 99). Substance use versatility was comprised of eight dichotomous items indicating whether the participant had ever used alcohol, marijuana, hallucinogens, ecstasy, heroin, cocaine, crack cocaine, and crystal methamphetamine (M = 5.14, SD = 1.98, range = 0–8). Tetrachoric ordinal alpha was calculated as follows:

where k is the number of items in the scale and ravg represents the average correlation between items in the scale (see Gadermann et al., 2012).
The tetrachoric ordinal alpha value of .88 indicated that internal consistency was high.
Identity
Identity was measured using Schneider’s (1990) Good Citizens Scale. Respondents were asked to rate themselves from 1 to 7 on 15 identity traits (e.g., good/bad, dumb/smart, rude/polite). Higher scores indicated a more positive self-identity (M = 70.07, SD = 9.06, range = 31–95, Cronbach’s α = .72). Using the same items, youth were asked to rate how they think other people perceive them. These responses were summed to create a measure of how the youth felt others perceived them (M = 63.71, SD = 8.98, range = 30–95, Cronbach’s α = .63). The Cronbach’s alpha value is lower than observed for male ISVYOS participants (.82). Girls may have a more difficult time perceiving how others see them due to their tendency to come from more chaotic backgrounds compared with their male counterparts (McCuish, 2017).
Physical Aggression
Respondents were asked to report how often they got into physical altercations (e.g., daily, few times a week, once a week, few times a month, once a month, less than once a month, never). Responses were recoded into a binary indicator of whether the participant self-reported getting into a physical fight at least once a week (18.7%, n = 53).
Abuse and Sexuality
Participants self-reported whether they had experienced physical abuse (68.7%, n = 195) and sexual abuse (49.3%, n = 140) as well as the age at which they first experienced consensual sexual activity, which was defined as any sexual contact other than kissing. Onset of sexual activity was a dichotomous indicator of early consensual activity to avoid excluding individuals who did not report any consensual sexual activity. Few respondents reported engaging in consensual sexual activity before 12 (5.3%, n = 15).
Family Dysfunction
Respondents were asked whether they had left home or been kicked out of the family home for more than 24 hr and, if so, the age at which this first occurred. These variables were recoded into dichotomized indicators of leaving home before 12 (18.7%, n = 53) and being kicked out of home before 12 (7.0%, n = 20), which again helped to establish temporal order with the outcome variable. A family dysfunction scale was created by asking participants whether any of their family members had a drinking problem, substance use problem, experienced physical abuse, experienced sexual abuse, a criminal record, or a mental illness. Responses to the six items were summed to create the Family Dysfunction Scale (M = 3.52, SD = 1.49, range = 0–6, tetrachoric ordinal α = .81).
School Problems
This domain included measures of whether the participant was attending school prior to incarceration (44.0%, n = 125), whether the participant skipped school before age 12 (20.8%, n = 59), and the number of times the participant changed schools for reasons other than grade changes (e.g., expulsions; M = 5.84, SD = 4.99, range = 0–40).
Analytic Strategy
Little’s missing completely at random (MCAR) test revealed that the data were MCAR (p = .153), indicating that the missing values were randomly distributed across observations (Garson, 2015). The percentage of missing data for the covariates ranged from 1.8% (alcohol use before 12) to 38.4% (other identity). Missing data were addressed using Stata’s mi chained command. All predictor and outcome variables were included in the imputation procedure, but the outcome variable was not imputed as complete data were available. Ethnicity was not imputed as Derose et al. (2012) argued that ethnicity data are often not missing at random (Garson, 2015). The average value of each variable from 20 imputed data sets was used in all descriptive, bivariate, and multivariate analyses.
To account for potential differences in female offending patterns between ages 12 and 23, semi-parametric group-based modeling (SPGM) was conducted in Stata IC 15 using the traj add-on developed by Jones and Nagin (2013). The trajectories were developed based on the total number of convictions incurred at each year of age from 12 to 23 for each youth in the sample. SPGM is a statistical technique used to identify developmental trajectories (e.g., the course of a behavior across age or time; Nagin, 2005). Unlike cluster analysis and other grouping methods that identify groups ex ante, the SPGM method allows developmental trajectories to emerge from the data (Nagin, 2005). SPGM allows for differences in functional form over time, which aligns with known developmental patterns of crime across the life course. Controlling for exposure time is important to avoid artificially inflating the prevalence of desistance (Eggleston et al., 2004). Exposure time was calculated as follows:

where j is the respondent and i is the year of observation. Days incarcerated was divided by 367 because (a) exposure must be a nonzero value and (b) participants, on occasion, spent 366 days incarcerated due to leap years.
Posterior probabilities and odds of correct classification (OCC) values were used to interpret the accuracy with which individuals were assigned to the trajectory group that best resembled their own pattern of offending. Posterior probability is the probability of accurately assigning individuals to a particular trajectory (Nagin, 2005). An average posterior probability above .7 is considered acceptable classification accuracy (Nagin, 2005). OCC is a more conservative method of evaluating classification accuracy as it also accounts for the sample size of each trajectory group. An OCC value above five indicates good accuracy (Nagin, 2005). After identifying the number of trajectories that best fit the data, bivariate comparisons were made between risk factors and the trajectory groups that emerged from the analysis. Multinomial logistic regression analyses were conducted to assess the relationship between risk factors and trajectory assignment.
Results
Trajectory Analysis
The first step in the trajectory analysis identified the shape and number of trajectories that best fit the data. The zero-inflated Poisson (ZIP) model with quadratic functional form was used to estimate the distribution of the offending trajectories. The ZIP model was chosen to account for the excess zeroes in the data not typically accounted for with the traditional Poisson model (Jones & Nagin, 2013). Like prior research (e.g., Baskin-Sommers & Baskin, 2016), the trajectory solution that best fit the data was identified according to three criteria: lowest Bayesian information criteria (BIC) value, parsimony, and no trajectories with less than 5% of the sample. A three-group solution was retained (BIC = −5,868.71) because (a) although the five-group model had the BIC values closest to zero (−5,553.38), it also included one trajectory that comprised less than 5% of the sample; and (b) the four-group model (BIC = −5,669.20) resulted in trajectory splitting, suggesting that the trade-off between fit and parsimony favored the latter. The parameters of the three-group model are outlined in Table 2. Results of all trajectory models are available from the first author.
Fit Statistics for Zero-Inflated Poisson Trajectory Model

Note. RORD = rapid onset, rapid desistance; SRC = slow rising chronic; OCC = odds of correct classification.
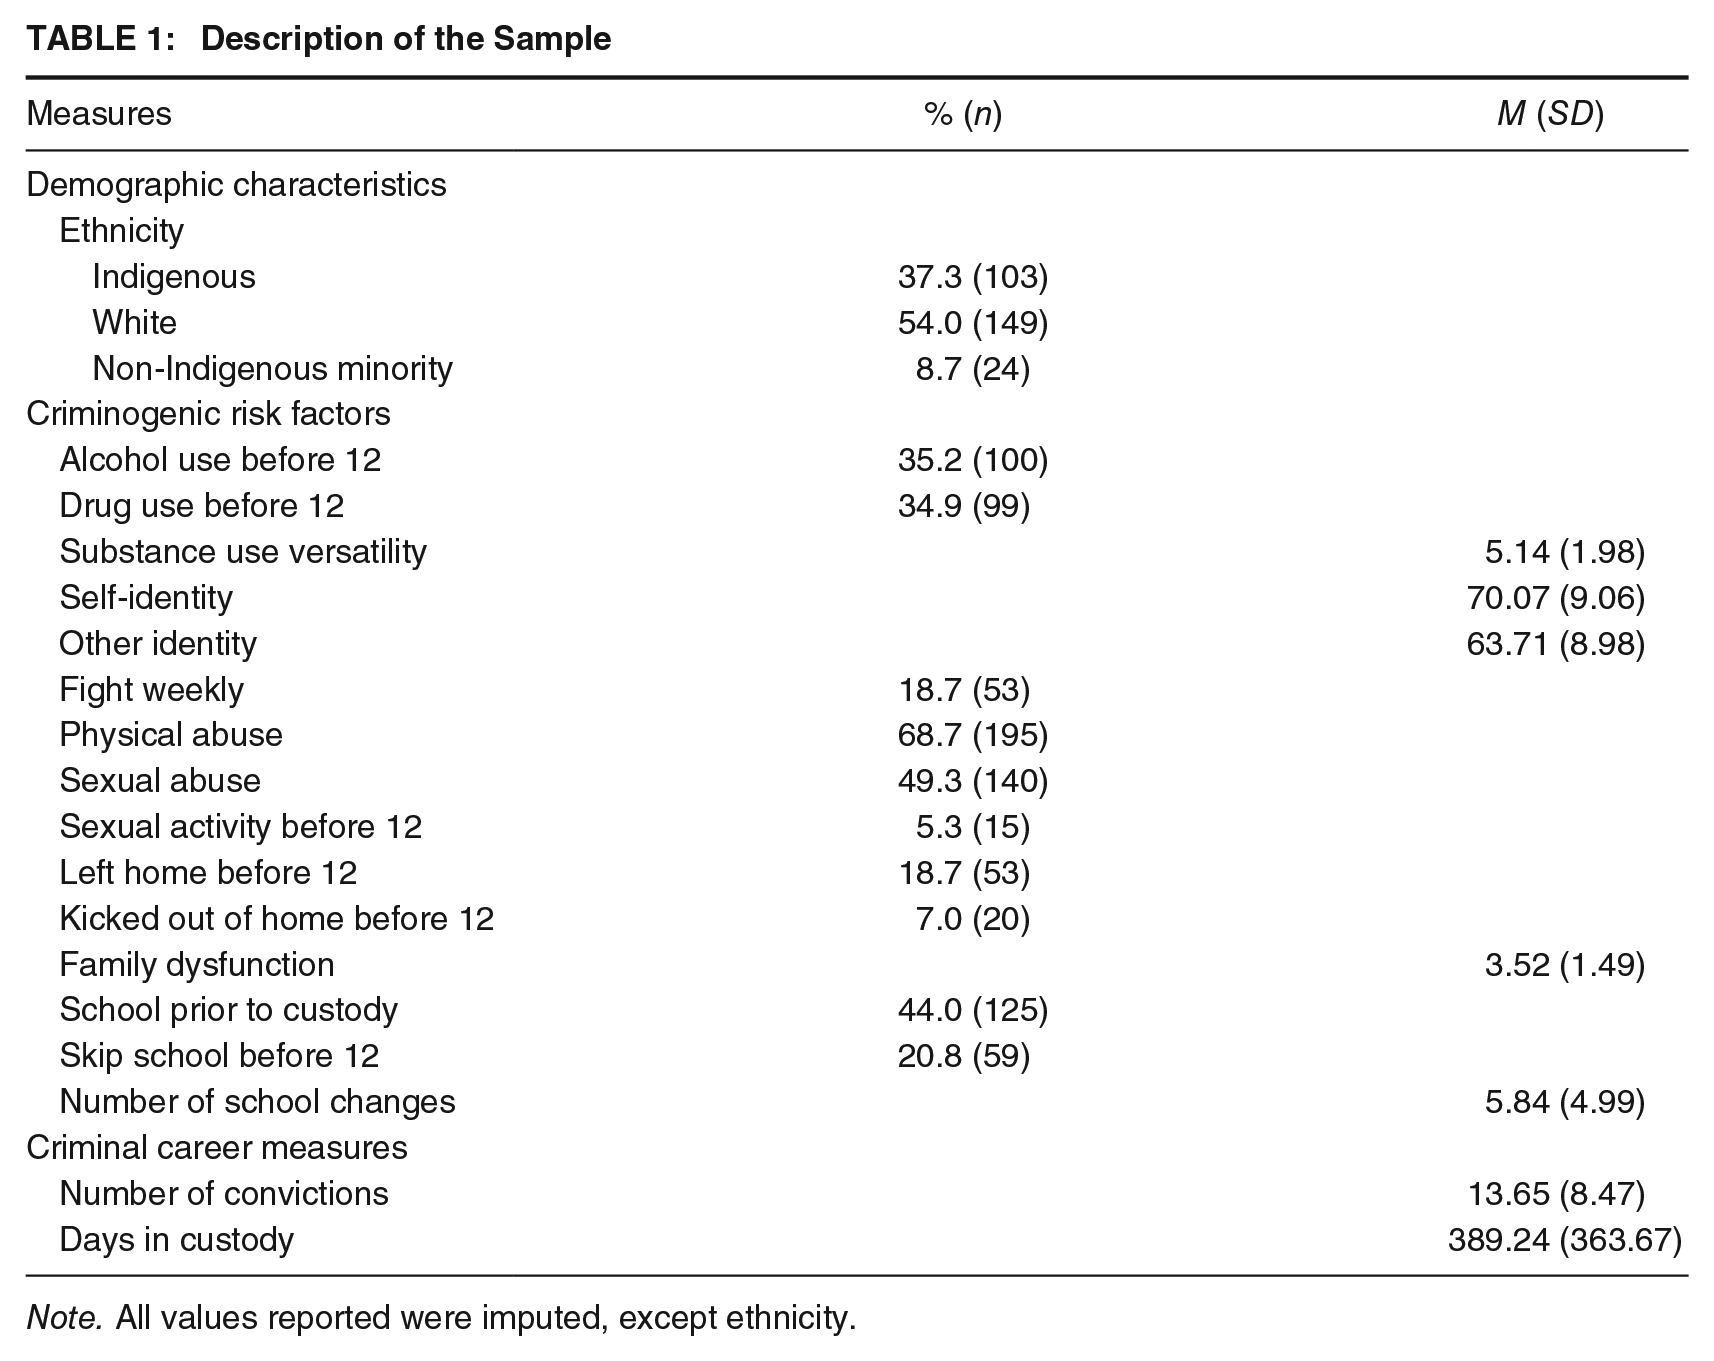
The three-group solution is shown in Figure 1. The first pattern was labeled the bell-shaped trajectory (43.7%, n = 124) and most closely reflected the typical age–crime curve pattern of offending. For this group, offending peaked at age 17 at an average of 2.5 convictions. By age 23, offending was virtually nonexistent. The second trajectory (33.1%, n = 94) was labeled the rapid onset, rapid desistance (RORD) trajectory because it was characterized by an early onset of frequent offending. For this group, offending peaked at age 14 with an average of four convictions. A sharp decline in offending followed thereafter. Like the bell-shaped trajectory, offending was virtually nonexistent by age 23. The third trajectory was called the slow rising chronic (SRC) trajectory (23.2%, n = 66) because it demonstrated a slow increase in offending from the ages of 12 to 15, with offending peaking at ages 16 to 17 with an average of three convictions. Unlike the other trajectories, the SRC trajectory showed a pattern of offending that persisted in adulthood.
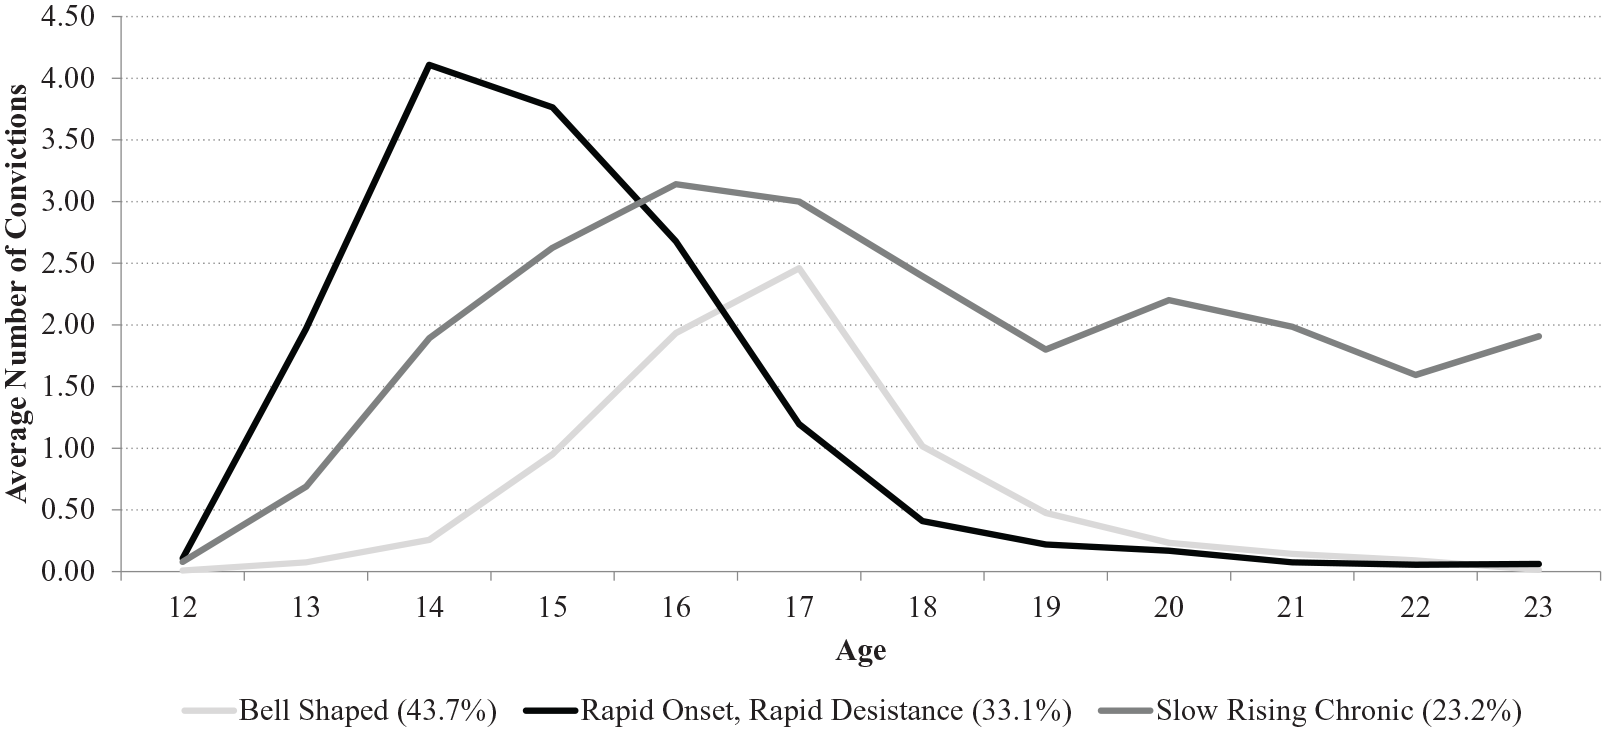
Offending Trajectories From Ages 12 to 23
Bivariate analyses examined potential differences in the prevalence or strength of different risk factors across the three trajectories (see Table 3). Youth associated with the SRC trajectory averaged a significantly greater number of different substances used than youth associated with the RORD trajectory. Although there were no significant differences between the three trajectories in terms of self-identity, youth associated with the SRC trajectory had significantly lower scores than youth associated with the bell-shaped trajectory with respect to how participants felt that others viewed them. Early sexual activity was most prominent among members of the SRC trajectory, although even for this trajectory, base rates were relatively low (10.6%, n = 7). Leaving home before age 12 was most characteristic of youth associated with the RORD trajectory (30.3%, n = 27). In terms of school problems, youth associated with the RORD trajectory reported a significantly greater number of school changes (M = 6.44, SD = 6.02) than youth associated with the SRC trajectory (M = 4.77, SD = 3.12).
Comparison of Demographic, Risk, and Criminal Career Factors Across Offending Trajectories

Note. RORD = rapid onset, rapid desistance; SRC = slow rising chronic; ANOVA = analysis of variance.
Levene’s test of equal variance violated. Welch’s ANOVA reported.
Multinomial Logistic Regression Analyses
To determine the final multinomial logistic regression model (see Table 4), a general-to-specific testing methodology was followed (e.g., Campos et al., 2005). By facilitating the removal of nonsignificant measures in sequential models, the general-to-specific testing methodology results in the most parsimonious model. To counteract potential omitted variable bias, the following statistics were assessed between every variation of the model: coefficient (both magnitude and direction), standard error, and significance level. Likelihood ratio tests were conducted at every second variation of the model (i.e., after every removal of two variables) and results indicated that no two variables were insignificant individually, yet jointly statistically significant. Multicollinearity was not an issue as all variance inflation factor values were below 2.5 (Allison, 2012). The reference category used for the multinomial logistic regression is the bell-shaped trajectory as it most closely reflects the age–crime curve.
Multinomial Logistic Regression Models With Offending Trajectories as the Outcome of Interest
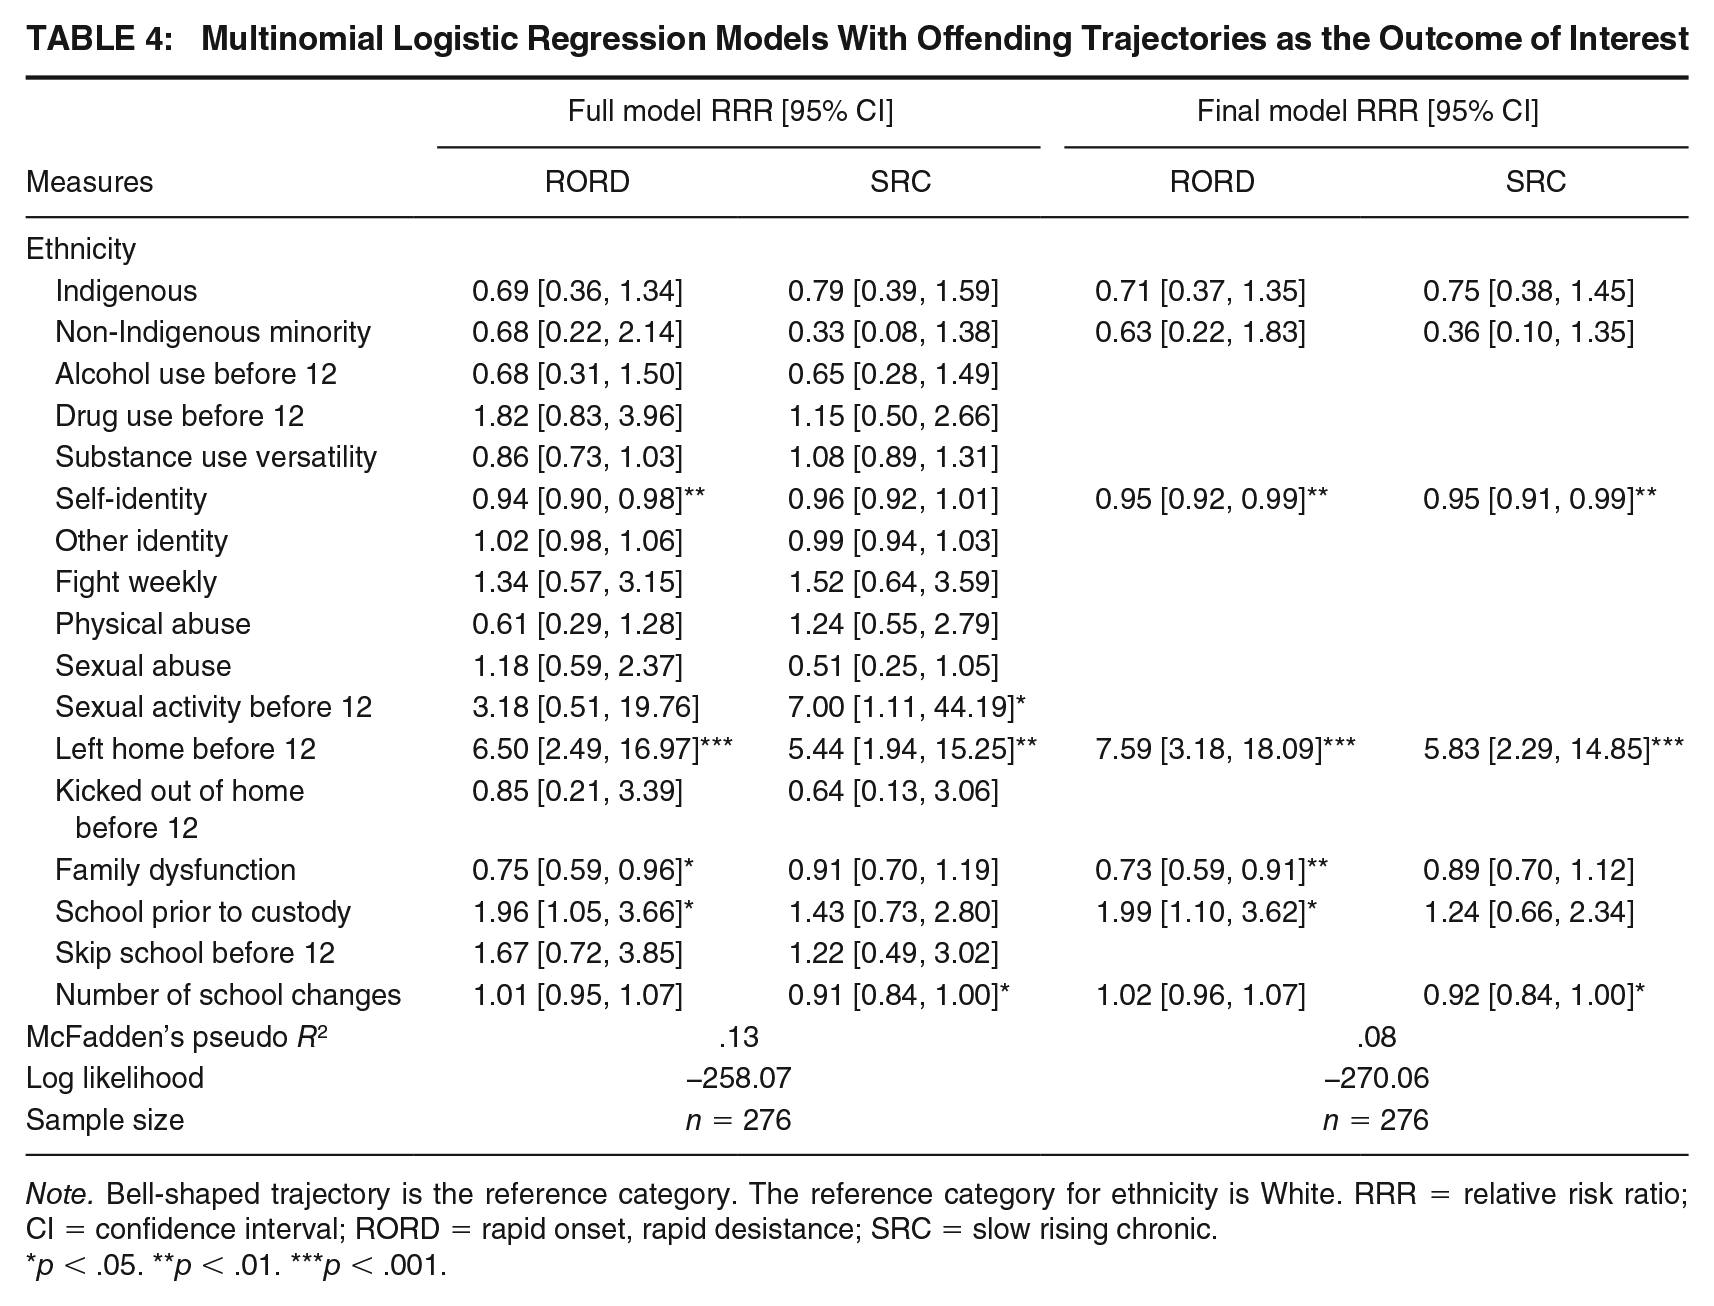
Note. Bell-shaped trajectory is the reference category. The reference category for ethnicity is White. RRR = relative risk ratio; CI = confidence interval; RORD = rapid onset, rapid desistance; SRC = slow rising chronic.
p < .05. **p < .01. ***p < .001.
The final model was significant, χ2(14)55 = 49.74, p < .001, and had a McFadden’s pseudo R2 of .08, indicating weak to moderate model fit. Although the pseudo R2 decreased slightly from the full model, the result is a more parsimonious model. Several significant differences emerged between the RORD and the bell-shaped trajectory and the SRC and the bell-shaped trajectory. When comparing the RORD and the bell-shaped trajectories, higher self-identity scores were associated with a significantly lower risk of being in the RORD as opposed to the bell-shaped trajectory (relative risk ratio [RRR] = 0.95, p = .007). Youth who willingly left home before age 12 were significantly more likely to be associated with the RORD, compared with the bell-shaped, trajectory (RRR = 7.59 p < .001). Furthermore, higher levels of family dysfunction significantly decreased the likelihood of being in the RORD, as opposed to the bell-shaped, trajectory (RRR = 0.73, p = .004). Youth who were attending school prior to incarceration were significantly more likely to be associated with the RORD trajectory compared with the bell-shaped trajectory (RRR = 1.99, p = .023).
Several significant differences emerged between the SRC and bell-shaped trajectories. In the final model, a one-unit increase in positive self-identity score significantly decreased the risk of being in the SRC trajectory compared with the bell-shaped trajectory (RRR = 0.95, p = .007). Youth who willingly left home before age 12 were significantly more likely to be associated with the SRC trajectory compared with the bell-shaped trajectory (RRR = 5.83, p < .001). Finally, a one-unit increase in a youth’s number of school changes significantly decreased the likelihood of being associated with the SRC trajectory compared with the bell-shaped trajectory (RRR = 0.92, p = .040).
Discussion
Assumptions about the homogeneity of female offending may no longer comport with the available evidence (Cauffman et al., 2015) but there also has been a lack of studies of justice-involved samples with higher base rates of trajectories characterized by more frequent offending. Such base rates are necessary to address, especially at the multivariate level, whether different risk factors are informative of different trajectory patterns (van Domburgh et al., 2009). We contributed to this research by using a sample of incarcerated female youth who were followed into emerging adulthood. Two questions were addressed, both of which were rooted in developmental criminology themes (Loeber & Le Blanc, 1990). First, what do female offending patterns look like across multiple developmental periods? Second, are there key childhood and adolescent life experiences informative of the differences in these patterns?
Female Offending Patterns
Analyses revealed greater variability in female offending patterns compared with theoretical perspectives (e.g., Moffitt, 1993; Silverthorn & Frick, 1999). Trajectory analyses identified three distinct offending patterns: bell shaped, RORD, and SRC. Most youth followed an AL trajectory (43.7%, n = 124), similar to that identified by Moffitt (1993). These youth had the least problematic offending pattern in adolescence, and offending at age 23 was virtually nonexistent. This aligned with studies that reported an AL-type trajectory (e.g., Jennings, 2011). Several trajectory studies using justice-involved samples identified a “low” trajectory (e.g., Blokland & van Os, 2010; Cauffman et al., 2015), which was not identified in the present study. In addition, the prevalence of chronic offending was higher than that reported among other trajectory analyses of female populations (e.g., 3 times higher than the persistent female trajectory identified by Cauffman et al., 2015). These differences may be related to the different mechanisms through which justice-involved girls end up in custody in Canada compared with other countries. In Canada, few youth who encounter the justice system are incarcerated. For example, in 2017 to 2018, approximately 13% of convicted youth were sentenced to custody (Statistics Canada, 2020). It could be that girls identified in other studies as following a pattern of low-rate offending were those diverted from custody in Canada and thus excluded from the current sample.
The RORD trajectory was characterized by the earliest age of onset and the highest peak frequency of offending, yet showed a pattern of desistance that mirrored the bell-shaped trajectory. This contrasted criminal career and developmental criminology descriptions of a negative relationship between onset of offending and offending duration (e.g., Loeber & Le Blanc, 1990). However, similar findings have been reported in other studies of justice-involved women (e.g., Andersson et al., 2012). Accordingly, at least some principles of male-centric theories and frameworks may require adaptation before generalizing to women. The identification of the RORD trajectory indicates that targeted prevention and intervention of female offending should not be guided by an early age of onset.
In line with previous research conducting female-only analyses of a justice-involved sample (e.g., Blokland & van Os, 2010; Cauffman et al., 2015; 2 Jennings, 2011), the current study revealed a substantial (23.3%) subset of women whose offending continued at a high rate through emerging adulthood (the SRC trajectory). This contrasted with dominant theoretical explanations (e.g., Moffitt, 1993) and studies using mixed samples, which implied that chronic offending was primarily a male-only phenomenon (Corrado et al., 2015). The major difference between male and female chronic offending relates to the frequency of offending, rather than its likelihood of persisting across developmental stages (see also Cauffman et al., 2015). One important distinction of the chronic trajectory identified in this study was that it was not characterized by the earliest age of onset, yet was the only trajectory still actively offending into emerging adulthood. This finding, combined with the identification of the RORD trajectory, suggested that early onset may not be an important risk factor for persistent female offending.
Risk for Female Offending
Two risk factors emerged as significant indicators of particularly problematic offending patterns. Youth who endorsed a more negative self-perception were more likely to be associated with the RORD and SRC trajectories. When compared with justice-involved boys, justice-involved girls endorse a more negative self-perception. This is also true when comparing justice-involved persons with noninvolved individuals (Belknap & Holsinger, 2006; Mier & Ladny, 2018). As identity helped discern the different offending patterns, programming should focus on increasing girls’ positive self-perceptions, especially those who come from extremely dysfunctional families. Willingly leaving home before age 12 was a significant predictor of membership in both the RORD and SRC trajectories compared with the bell-shaped trajectory, which aligned with assertions that running away from home is a gendered pathway into crime (e.g., Chesney-Lind & Shelden, 2014; Daly, 1992).
In contrast to Moffitt’s (1993) assertion that LCP offending would be characterized by problems in school functioning, the number of times that sample participants changed schools significantly increased the likelihood of membership in the bell-shaped trajectory compared with the SRC trajectory. It is possible that school disruption is important in pushing girls into offending, but not for more serious and disruptive offending patterns, where such individuals simply may not attend school in the first place. Indeed, less than half of participants in the sample were enrolled in school at the time of their interview. Those with a higher rate of offending may have fewer opportunities to change schools because they were less likely to enroll in school in the first place. Similarly, increased levels of family dysfunction predicted association with the bell-shaped trajectory compared with the RORD trajectory, which did not align with Moffitt’s (1993) suggestion that early family adversity would be associated with LCP offending. It is possible that this result was observed because leaving home significantly increased the likelihood of being in the RORD group compared with the bell-shaped group. The RORD group may simply have been less aware of dysfunction within the home. Another plausible explanation is that family dysfunction is an important risk factor for the initial onset of offending during adolescence when familial ties are most important, but less so for continued offending in adulthood when the role of the family diminishes (e.g., Arnett, 2000).
Abuse was not a significant indicator of trajectory group membership, which contrasted with feminist pathway perspectives (e.g., Brennan et al., 2012; Broidy et al., 2018; Daly, 1992). An indirect link between childhood abuse and offending has been identified, in which the relationship is mediated by mental illness and substance use (Salisbury & Van Voorhis, 2009). Wolff et al. (2017) identified a nonsignificant relationship between adverse childhood experiences and serious, violent, and chronic female offending. In explaining the null findings, Wolff et al. (2017) asserted that the measurement of abuse did not include indicators of frequency, severity, or duration. The dichotomous measure of abuse used here possibly lacked the nuance necessary to capture the relationship between abuse and offending.
One potential explanation for the relatively few risk factor distinctions across trajectories when examined at the multivariate level relates to the “multi-problem” profile of the girls in this sample. Substantial risk factor exposure was common across offending patterns, which may have increased the difficulty of distinguishing between them (see Cauffman et al., 2015, for a similar argument). In explaining this similar risk factor exposure despite differences in offending patterns, Wolff et al. (2017) asserted that “there is something unique about female delinquents who enter the system, which in turn seems to lead to less heterogeneity within the group in comparison to males” (p. 191). This highlights the necessity of continuing to explore the life experiences of justice-involved women.
Limitations and Future Research
Utilizing a structured interview in which respondents self-reported their responses creates a potential for social desirability concerns to influence response patterns among study participants, particularly surrounding more sensitive information (Krumpal, 2018). At the same time, participants were informed that their responses would be kept confidential, except in instances where they made a direct threat to hurt themselves or someone else. RAs were not employees of the prison and did not work with participants outside the context of the interview. Participants were informed that their decision to participate would not affect, for example, their sentence length or opportunities for extra privileges while incarcerated. A large number of bivariate analyses were conducted, which increased the risk of Type I error. A Bonferroni correction was not used as the consequence is a loss of statistical power (Epskamp & Fried, 2018) and because the current study was exploratory.
This study used a sample of girls incarcerated during adolescence, which is a very specific population and raises potential issues with generalizability. Nevertheless, the sample was helpful for addressing questions about whether different risk factors were associated with distinct offending patterns given that community-based samples have low base rates of chronic offending, which typically does not allow for multivariate analysis (Moffitt & Caspi, 2001; Odgers et al., 2007). Larger sample sizes are conducive to finding more groups (Piquero, 2008) and, therefore, the number of trajectories identified may have been underestimated. Overall, studies of justice-involved women typically have smaller sample sizes, and this limitation may explain why research generally finds a greater number of offending trajectories for men compared with women (e.g., Ferrante, 2013). Similarly, the length of follow-up period can also affect the number and shape of trajectories identified (Eggleston et al., 2004). The research design may have underestimated the true number of distinct offending patterns. Of course, trajectories approximate an unknown continuous distribution, and it is important to not reify these trajectories (Nagin, 2005).
Official data were used to measure offending, which likely underestimated participants’ actual offending. These limitations could potentially affect the offending trajectories identified. Analyses revealed few risk factors that helped make sense of the trajectories identified. A plausible explanation for this finding relates to the lack of measures of neuropsychological impairments, which are important for distinguishing between patterns of persistence and desistance among women (Cauffman et al., 2015).
Conclusion
The current study provided insight regarding theoretical debate concerning female offending patterns. Not all of the sample followed the classic age–crime curve pattern. Rather, the age–crime curve for female participants reflected an aggregate of several distinct offending patterns, one of which showed stability of offending through emerging adulthood. This was an uncharacteristic finding when compared with studies that looked at mixed-gender samples. Youth associated with distinct offending trajectories were characterized by differential exposure to individual-, family-, and school-level risk factors. Some findings contradicted expectations of developmental frameworks, such as increased levels of family and school dysfunction predicting offending limited to adolescence. Existing theoretical models should be adapted, or new models developed, to account for the complexities of female offending.
Footnotes
Authors’ Note:
This work was supported by the Social Sciences and Humanities Research Council of Canada (410-2004-1875). In addition, the authors gratefully acknowledge the assistance of the British Columbia Ministry of Children and Family Development (MCFD). The views expressed herein are those of the authors and do not necessarily reflect the views or policies of the agencies that funded or supported the research. The agencies providing support for the project were not involved in any aspect of the data collection/analysis.