
Abstract
Researchers and stakeholders have developed many definitions to evaluate whether algorithmic pretrial risk assessment instruments are fair in terms of their error and accuracy. Error and accuracy are often operationalized using three sets of indicators: false-positive and false-negative percentages, false-positive and false-negative rates, and positive and negative predictive value. To calculate these indicators, a threshold must be set, and continuous risk scores must be dichotomized. We provide a data-driven examination of these three sets of indicators using data from three studies on the most widely used algorithmic pretrial risk assessment instruments: the Public Safety Assessment, the Virginia Pretrial Risk Assessment Instrument, and the Federal Pretrial Risk Assessment. Overall, our findings highlight how conclusions regarding fairness are affected by the limitations of these indicators. Future work should move toward examining whether there are biases in how the risk assessment scores are used to inform decision-making.
Keywords
Introduction
The fairness of algorithmic risk assessment instruments has received significant public and legal attention in recent years (Angwin et al., 2016; Hamilton, 2018; Hellman, 2020; Mayson, 2019; Minow et al., 2019; Pretrial Justice Institute, 2020; Slobogin, 2018; Southerland & Woods, 2018; U.S. Department of Justice, 2014). This attention has included discussion regarding whether algorithms developed from criminal justice data can only exacerbate racial disparities by carrying forward the racism present in existing criminal justice practices (e.g., disparate arrest rates experienced by black people; Kochel et al., 2011) and whether algorithms will convey a false, and therefore harmful, sense of objectivity (Eckhouse et al., 2019; Robinson & Koepke, 2019). As part of these discussions, concerns have been raised regarding whether the instruments produce risk estimates that demonstrate evidence of bias in general and as a function of race, specifically. While these concerns are relevant to algorithmic risk assessment instruments in general, discussion has centered on instruments used to inform pretrial decision-making (Vincent & Viljoen, 2020). Briefly, algorithmic pretrial risk assessment instruments are designed to evaluate the likelihood that a person will fail to appear in court or be arrested for a new crime on pretrial release. The likelihood of these outcomes (collectively referred to as pretrial misconduct) is calculated via an algorithm that weights and sums ratings on items such as criminal history, current charges, or personal characteristics to produce a scaled risk score representing the likelihood of pretrial misconduct.
Currently, there is a great deal of debate around whether algorithmic risk assessments should be part of pretrial reform efforts sweeping the United States. Those who support the use of algorithmic risk assessment instruments assert that there is one strategy that may help promote transparency, accuracy, and consistency in pretrial decisions (Desmarais & Lowder, 2019). They also point out that there is relatively limited empirical evidence demonstrating differential predictive validity across groups (Desmarais et al., 2020; Vincent & Viljoen, 2020), but that when identified, differential prediction may highlight biases in the criminal justice system that are otherwise difficult to quantify (Mayson, 2019; Viljoen & Vincent, 2020). Critics of these instruments, in contrast, assert that algorithmic pretrial risk assessment instruments are racially biased and exacerbate racial disparities in pretrial decisions (Angwin et al., 2016; Pretrial Justice Institute, 2020). These differing viewpoints on whether there is racial bias in algorithmic pretrial risk assessments may reflect, at least in part, the various definitions—and consequently, indicators—used for determining whether an algorithmic pretrial risk assessment instrument produces “fair” or “biased” results (see for example, Berk et al., 2021; Chouldechova, 2017; Kleinberg et al., 2018; Mayson, 2019). Indeed, stakeholders with differing views on the issue tend to rely on evidence derived using different indicators of predictive accuracy (Hamilton, 2018). Our goal is to examine three sets of indicators that are being emphasized by advocates, legal scholars, and other stakeholders as measures of fairness: (a) true-positive, false-positive, false-negative, and true-negative percentages; (b) false-positive (FPRs) and false-negative rates (FNRs); and (c) positive (PPVs) and negative predictive values (NPVs). In the sections that follow, we describe how these indicators are being used to evaluate fairness of algorithmic risk assessment instruments in the pretrial context.
Indicators Used to Evaluate Fairness
Much of the discussion about fairness in algorithmic risk assessment instruments is concerned with whether the error and accuracy of assessment results are the same across subgroups of people. There are dozens of indicators that can be employed to compare error and accuracy in instruments, both overall and across subgroups. A full discussion of all indicators is beyond the scope of this paper (for information on indicators not covered here, see: American Educational Research Association [AERA], American Psychological Association, & National Council on Measurement in Education, 2014; Berk et al., 2021; Chouldechova, 2017; Corbett-Davies et al., 2017; Helmus & Babchishin, 2017; Kallus et al., 2021; Kleinberg et al., 2016; Mitchell et al., 2021; Slobogin, 2018; Southerland & Woods, 2018). Instead, we focus on three sets of indicators that are most widely used in clinical research for evaluating medical tests (Šimundić, 2009). While the application of these specific indicators to risk assessment instruments is not new (Singh et al., 2013), their popularity as key measures of error and accuracy has grown recently (Hamilton, 2020; Hellman, 2020; Mayson, 2019).
Two sets of indicators have been used by some to operationalize error. The first set are the percentages of people in each subgroup that are classified as false positives (i.e., people who “test positive,” but who do not experience pretrial misconduct) and false negatives (i.e., people who “test negative” but who do experience pretrial misconduct; Hellman, 2020; Mayson, 2019; Skeem & Lowenkamp, 2020). The second set of indicators used to examine error are the FPRs (i.e., the number of false-positive test results divided by the total number of people who did not experience pretrial misconduct) and FNRs (i.e., the number of false-negative test results divided by the total number of people who did experience pretrial misconduct; Berk et al., 2021; Chouldechova, 2017; DeMichele & Baumgartner, 2020; Hamilton, 2018; Terranova & Ward, 2020). One set of indicators has been used by some to operationalize accuracy: PPV (i.e., the number of true-positive test results divided by the total number of positive tests) and NPV (i.e., the number of true-negative test results divided by the total number of negative tests; Berk et al., 2021; Chouldechova, 2017; Hamilton, 2018; Hellman, 2020). We collectively refer to these three sets of indicators as classification indicators herein.
Despite the recent focus on classification indicators in the context of pretrial decision-making, their application to the evaluation of fairness in other risk assessment contexts is limited (Singh et al., 2013). Helmus and Babchishin (2017) have outlined some limitations of classification indicators as applied to a risk assessment context (e.g., their dependence on base rates and lack of agreed upon benchmarks). Most relevant to this article, these indicators can only consider binary decisions (no, yes) about whether a condition is or is not already present; they cannot calculate accuracy based on a range of scores that are associated with a range of probabilities estimating the likelihood that something will happen in the future. Indeed, the Standards for Educational and Psychological Testing set forth by the AERA et al. (2014) require consideration of performance across the range of scores produced by an instrument across subgroups to evaluate whether there is test bias. Yet, some researchers continue to advance the application of classification indicators, that focus on binary classifications of positive and negative test results, to algorithmic pretrial risk assessment instruments (Hamilton, 2020; Harris et al., 2019; Hester, 2020; Mossman, 2013).
Creating Dichotomies to Evaluate Fairness
The results of most pretrial algorithmic risk assessments are presented as continuous estimates of risk (Desmarais et al., 2020) and many indicators for evaluating the performance of continuous risk scores do exist. However, to calculate the classification indicators discussed in the previous section, pretrial algorithmic risk assessment results must be dichotomized to categorize people based on whether they will or will not experience pretrial misconduct. To calculate the classification indicators, the researcher must choose a scaled score above which a person is designated as “testing positive” for (future) pretrial misconduct and below which a person “tests negative.” Doing so produces four analytic groups: (a) true positives (test positive and experience pretrial misconduct), (b) false positives (test positive and do not experience pretrial misconduct), (c) false negatives (test negative and do experience pretrial misconduct), and (d) true negatives (test negative and do not experience pretrial misconduct). Yet the results produced by most pretrial algorithmic risk assessment instruments are not presented as binary categories about current states, nor are they intended to be used this way in practice (Desmarais & Lowder, 2019; Helmus & Babchishin, 2017). Consequently, these classification indicators have limited external validity.
There is considerable variation in the strategies used by researchers to set thresholds for dichotomizing scaled risk scores. 1 One strategy is to set the threshold so that high-risk scores designate “positive tests,” and low-risk scores designate “negative tests” (Singh et al., 2013). For example, for a hypothetical risk assessment instrument with five risk scores (where a higher score indicates greater probability of pretrial misconduct), a researcher may specify risk scores of four or greater as “high risk” and two or lower as “low risk.” 2 People for whom the assessment results indicated a score of four or five, then, are categorized as a testing positive for pretrial misconduct and people with scores one through two are categorized as testing negative. People with a risk score of three would be left out of the analysis (Bhati, 2019; Harris et al., 2019). Other strategies for dichotomization retain people across all risk scores and use one threshold to split the sample into positive and negative test result groups. To demonstrate, some researchers use a higher risk score, such as a risk score of four, as the threshold; people assessed as having risk scores of four and five would be categorized as testing positive for pretrial misconduct and scores of one through three would be categorized as testing negative (DeMichele & Baumgartner, 2020; Skeem & Lowenkamp, 2020). Other researchers use a low-risk score, such as three, as the cutoff; people assessed as having scores of three through five would be categorized as a testing positive and scores one and two would be categorized as testing negative (Angwin et al., 2016). Others, still, set the threshold at the midpoint of the range of scores; anyone at or above the midpoint is classified as positive, while anyone below the midpoint of the possible scores are classified as negative (Terranova & Ward, 2020). As we will demonstrate, these different strategies have implications for conclusions regarding fairness.
Current Study
We conducted a data-driven examination of three sets of classification indicators used for evaluating fairness. Specifically, we used data from three different studies of commonly used algorithmic pretrial risk assessment instruments to examine across groups defined by race: (a) the percentages of true positives, false positives, true negatives, and false negatives, (b) FPRs and FNRs, and (c) PPVs and NPVs. We first calculated these values for low-risk scores versus Moderate-/high-risk scores and second for low-/moderate-risk scores versus high-risk scores to demonstrate how thresholds can affect findings and to elucidate the disconnect with the use of algorithmic risk assessment results in practice.
Method
Instruments
We focus our analyses on three widely used pretrial risk assessment instruments in the United States: the Public Safety Assessment (PSA; VanNostrand & Lowenkamp, 2013), the Virginia Pretrial Risk Assessment Instrument (VPRAI; VanNostrand, 2003), and the U.S. Federal Pretrial Services Risk Assessment Instrument (Lowenkamp & Whetzel, 2009).
PSA
The PSA was developed in Kentucky but has been adopted by jurisdictions across the United States. The PSA was designed to be completed without an interview so that it could be streamlined into existing court systems to aid in quick processing and release of people booked into jail (Advancing Pretrial Policy & Research, n.d.). The PSA includes nine items that measure primarily static (i.e., historical and unchanging) risk factors. These nine items are used to create three separate subscales, one for each of the outcomes for which risk is estimated by the instrument, namely failure to appear (FTA), any new criminal arrest (NCA), and new violent criminal arrest (NVCA) during the pretrial period. Responses to each item are scored and weighted according to the strength of their relationship with the pretrial outcome in the training studies and following the protocol described in the manual. For example, one item asks whether a person had a pending charge at the time of their current offense. If they did, they receive one point for that item; if they did not, they receive zero points for that item. Item ratings are summed to produce a raw score for each subscale, which is then converted into a scaled score following the protocol.
The FTA and NCA scaled scores range from one (lowest risk) to six (highest risk). Each scaled score corresponds to an estimated likelihood based on the rate of the pretrial outcome among people who received that scaled score in the validation sample (VanNostrand & Lowenkamp, 2013). The NVCA scaled scores are converted to the presence or absence of a “violence flag,” which reflects whether a person is at heightened risk of being arrested for a new violent crime during the pretrial period. Each jurisdiction that plans to implement the PSA is expected to conduct a local validation study to determine these rates for each outcome at each scaled score (Advancing Pretrial Policy & Research, n.d.). To provide an example from the study by DeMichele and colleagues (2018), a scaled score of three on the NCA subscale corresponds to a 10.9% rate of NCA during the pretrial period in the study sample. See the first column of Table 1 for the range of raw scores and scaled scores for each of the PSA subscales.
Frequencies for the Continuous and DICHOTOMIZED PSA, PTRA, and VPRAI Scores

Note. PSA = Public Safety Assessment (DeMichele et al., 2018); PTRA = Federal Pretrial Risk Assessment Instrument (Cohen & Lowenkamp, 2019); VPRAI = Virginia Pretrial Risk Assessment Instrument (Danner et al., 2015, 2016); POC = people of color; FTA = failure to appear; NCA = any new criminal arrest; NVCA = new violent criminal arrest.
The raw score for the NVCA subscale normally ranges from 0 to 7 and is converted into a binary scaled score (0–3 = no violent flag, while 4–7 = violent flag). The raw scores for the NVCA subscale are not intended to be transferred to a 1–6 scaled score. However, DeMichele and colleagues (2018) transferred the raw NVCA scores to a 1–6 scaled score so we followed their method.
VPRAI
The VPRAI was developed in Virginia but has been adopted by jurisdictions around the United States. The VPRAI, which requires an interview and record review to complete, includes eight items that are a combination of static and dynamic (i.e., potentially changeable) risk factors. Like the PSA, the VPRAI produces estimates of risk for FTA and any NCA; however, unlike the PSA, it also estimates for technical violations (i.e., violations of supervision), but does not estimate risk for NCA that is specifically violent in nature. Responses to each item are scored and weighted according to the strength of their relationship with the pretrial outcome in the training studies and following the protocol described in the manual. Instead of separate scaled scores for each outcome of interest, the VPRAI’s 8-item ratings are summed to create one raw total score, which is converted to a total scaled score (see first column of Table 1). Then, the scaled score is cross-referenced with a table that describes the estimated likelihood of each outcome: FTA, NCA, and technical violations (VanNostrand, 2003). The referenced estimated likelihood is based on the rate of each outcome seen among people who received that scaled score in the validation sample.
For example, in the revalidation study conducted by Danner et al. (2015), a scaled score of 4 corresponds with a 4.5% rate of FTA, a 6.4% rate of NCA, and a 10.9% rate of technical violations during the pretrial period in the study sample. Each jurisdiction that plans to implement the VPRAI should conduct a local validation study to determine these rates for each outcome at each scaled score.
U.S. Federal Pretrial Services Risk Assessment Instrument (PTRA)
The PTRA was developed to be used upon booking into jail for people accused of crimes under federal jurisdiction across the United States. This instrument should not be used on people arrested under local jurisdictions. The PTRA, which requires an interview and record review to complete, includes 11 items that are a combination of static and dynamic risk factors. The PTRA produces estimates of risk for FTA, any NCA, NVCA, and technical violations. Responses to each item are scored and weighted according to the strength of their relationship with the pretrial outcome in the training studies and following the protocol described in the manual. Like the VPRAI, the PTRA’s 11 item ratings are summed to create one raw total score, which is converted to a total scaled score (first column of Table 1). The scaled score is cross-referenced with a table that describes the estimated likelihood of each outcome: FTA, NCA, NVCA, and technical violations. The estimated likelihoods represent the rates observed in the revalidation study. The NVCA scaled score on the PTRA is an estimated likelihood, not a flag like the PSA. For example, a scaled score of 2 corresponds with a 1.5% rate of FTA, a 5.1% rate of NCA, a 0.7% rate of NVCA, and a 5.5% rate of technical violations during the pretrial period in the study sample (Cohen & Lowenkamp, 2019).
Data Sources
PSA Study Data
PSA data were drawn from the study conducted by DeMichele et al. (2018) examining PSA assessments completed in Kentucky between July 2013, and December 2014. This study examined a sample of 164,597 cases, most of which were for men (68.9%; 31.1% were for women). The majority of cases were for white people (81.1%), the rest were for black people (16.8%) or people whose race was not specified (2.1%). The original study examined the PSA’s overall predictive validity as well as predictive validity across race for FTA, NCA, and NVCA. For the full study sample, the rate of FTA was 14.8%, the rate of NCA was 10.6% and the rate of NVCA was 1.1%. For the race comparisons, study authors compared only the black and white subsamples and excluded all other races.
VPRAI Study Data
VPRAI data were drawn from a study conducted by Danner et al. (2016) examining VPRAI assessments completed in Virginia and California between July 2013, and July 2014. The VPRAI study examined a sample of 14,382 cases most of which were for men (74.4%; 25.6% were for women). About 51% of cases were for white people, 43.2% were for black people, 3.6% were for Hispanic people, 0.1% were for Native American people, and 1% were for Asian people. The original study examined overall predictive validity of the VPRAI, as well as predictive validity across race for FTA, NCA, and technical violations. The rate of FTA in the full sample was 4.0%, the rate of NCA was 5.2%, and the rate of technical violations was 8.8%. For the race comparisons, study authors combined all people of color into one category and compared them to white people.
PTRA Study Data
PTRA data were drawn from a study conducted by Cohen and Lowenkamp (2019) examining PTRA assessments completed across the entire United States between November 2009 and September 2015. This study examined a sample of 85,369 people. The sample was 71.1% men, 28.9% women, 42.8% white, 25.6% black, 24.2% Hispanic, and 7.4% race not specified. The original study examined overall predictive validity of the PTRA and predictive validity across race for FTA, NCA, NVCA, and technical violations. The rate of FTA in the full sample was 1.7%, the rate of NCA was 6.4%, the rate of NVCA was 1.0%, and the rate of technical violations was 8.1%. For the race comparisons, study authors compared the full black sample and a subset of non-Hispanic white people so that the size of comparison samples were equal. 3
Analytic Strategy
We completed two steps to prepare the data for analysis to address our research questions. First, we used information about the sample size, frequency of risk scores, and frequency of outcomes to recreate data sets that included the risk score assigned to each person, the race of each person, and whether the person did or did not experience each of the outcomes reported on in each study. When frequencies were not reported, we reached out to authors to obtain this information. Second, we collapsed the risk scores from each risk assessment algorithm into dichotomous scores. Instead of the scaled risk scores which correspond to an estimated likelihood of the outcome, we created dichotomies that indicated whether or not a person was estimated to experience pretrial misconduct. Following strategies used in prior research, we ran two versions of each analysis, once with the threshold set low and once with the threshold set high (Flores et al., 2016; Singh et al., 2011). Selecting one low and one high threshold offers the greatest comparability with other studies that use this technique (Desmarais et al., 2020; Fazel et al., 2012; Ramesh et al., 2018) and allows us to illustrate differences in results depending on which threshold is selected. For the low threshold, we used the scaled risk score 2 as the cutoff for all three of the algorithmic risk assessments (see Table 1). Everyone rated as a scaled risk score of 1 or 2 was considered to “test negative.” Everyone rated as a 3 or higher was considered to “test positive.” For the high threshold, we used the scaled score 3 as the cutoff for the VPRAI and PTRA and 4 as the cutoff for the PSA (see Table 1). Everyone rated 1 through 3 on the VPRAI and PTRA and 1 through 4 on the PSA was considered to “test negative,” everyone rated 4 and 5 on the VPRAI and PTRA and 5 and 6 on the PSA was considered to “test positive.” 4
To examine Research Aim 1, we categorized the percentages of each sample that fell into one of four classification groups: true positives, false positives, false negatives, and true negatives. To examine Research Aim 2, we calculated the FPR and FNR. 5 FPR and FNR are similar in meaning to false positives and false negatives, with one important distinction. The false-positive value in Research Aim 1 simply represents the percentage of people who were classified by the risk assessment algorithm to have an outcome who did not go on to have the outcome. The FPR (aka false alarm rate) is the proportion of people who were classified to experience pretrial misconduct but did not out of all those who did not experience pretrial misconduct. The formula is FPR = false positives/(false positives + true negatives; Mossman, 2013). Similarly, the false-negative values in Research Aim 1 represent the percentage of people who were not classified by the risk assessment algorithm to experience pretrial misconduct who did go on to experience pretrial misconduct. The FNR (aka the miss rate) is the proportion of people who were not classified to experience pretrial misconduct, but did out of all the people who did experience pretrial misconduct. The formula is FNR = false negatives/(false negatives + true positives; Mossman, 2013). We also provide the 95% confidence intervals (CIs) for each value, significant differences occur when the CIs do not overlap between groups.
To examine Research Aim 3, we calculated PPV and NPV for each algorithmic risk assessment instrument and each outcome across race. The PPV is the proportion of the sample who did experience pretrial misconduct out of all the people who the risk assessment classified would experience pretrial misconduct. In other words, the proportion of people that the risk assessment algorithm correctly classified to experience pretrial misconduct. The formula is as follows: PPV 6 = true positives/(true positives + false positives) (Helmus & Babchishin, 2017; Singh et al., 2013). The NPV is the proportion of the sample who did not experience pretrial misconduct out of all the people who the risk assessment algorithm classified would not experience pretrial misconduct. In other words, the proportion of people that the risk assessment algorithm correctly classified to not experience pretrial misconduct. The formula is as follows: NPV = true negatives/(true negatives + false negatives; Helmus & Babchishin, 2017; Singh et al., 2013). We also provide the 95% CIs for each value, significant differences occur when the CIs do not overlap between groups.
We calculated all indicators twice: once with the low threshold and once with the high threshold, for both race groups (i.e., people of color and white people). 7 Thus, for each study, we had two sets of true-positive, false-positive, false-negative, and true-negative percentages, two sets of FPRs and FNRs and two sets of PPVs and NPVs for both people of color and white people. The first set of values compared the classification error and accuracy of the instruments when a low-risk score is considered to be a classification that a person will not experience pretrial misconduct and medium or high scores are considered classifications that a person will experience pretrial misconduct. The second set of values compared the classification error and accuracy of instruments when low and medium scores are considered classifications that a person will not experience pretrial misconduct and a high score is a classification that they will experience pretrial misconduct. We were limited in the outcomes that we could examine for each risk assessment algorithm by what was reported in the original studies.
Results
Table 2 displays base rates for each outcome and the percentages of people classified as true positives, false positives, false negatives, and true negatives in each sample and group. Base rates are similar, though slightly higher, for people of color than white people across studies which may reflect the systemic factors that result in higher rates of pretrial misconduct for people of color (Kochel et al., 2011; Monaghan et al., 2020).
Frequencies and Percentages of True Positives, False Positive, False Negatives, and True Negatives at Low and High Thresholds
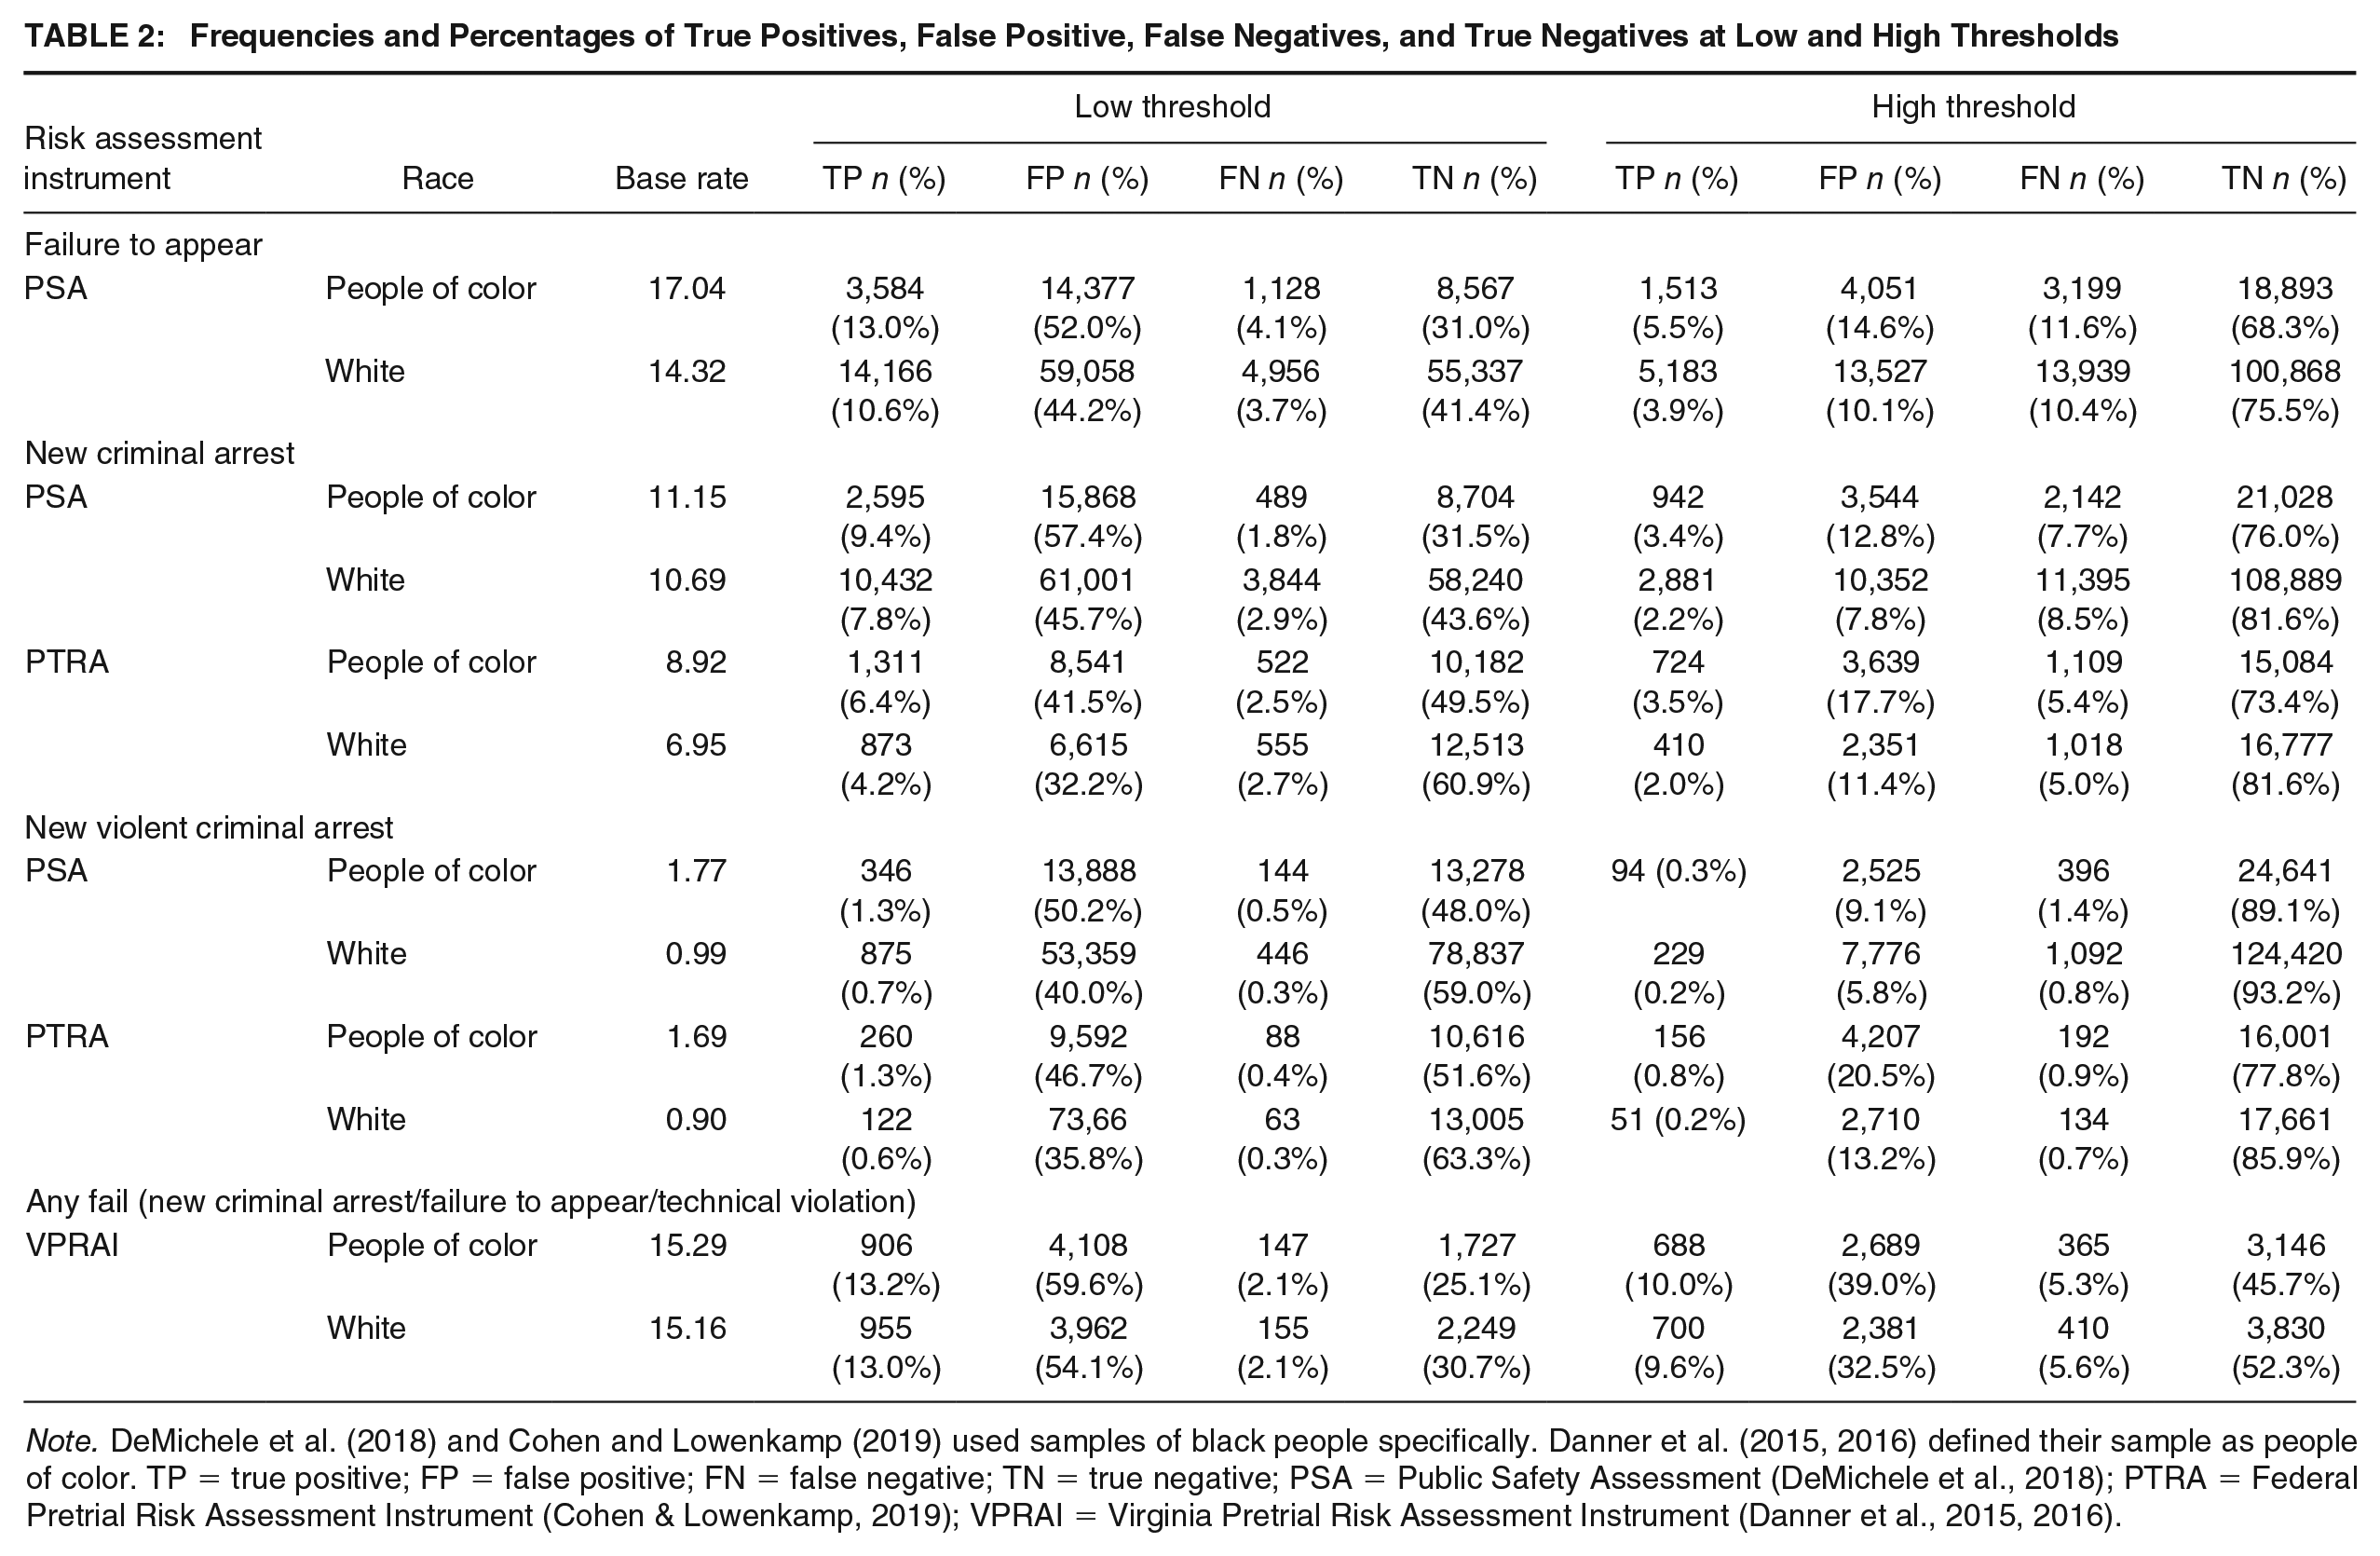
Note. DeMichele et al. (2018) and Cohen and Lowenkamp (2019) used samples of black people specifically. Danner et al. (2015, 2016) defined their sample as people of color. TP = true positive; FP = false positive; FN = false negative; TN = true negative; PSA = Public Safety Assessment (DeMichele et al., 2018); PTRA = Federal Pretrial Risk Assessment Instrument (Cohen & Lowenkamp, 2019); VPRAI = Virginia Pretrial Risk Assessment Instrument (Danner et al., 2015, 2016).
Research Aim 1: True Positives, False Positives, False Negatives, and True Negatives
First, we report on true positives, false positives, false negatives, and true negatives for the low threshold (see Table 2 columns 4–7). Overall, these results demonstrate that the different thresholds provide very different impressions. At the low threshold (i.e., a cutoff of 2 on all three instruments), most people in both subgroups are classified as either false positive or true negative for all instruments and all outcomes. Across studies, roughly one-third (35%) to a little under two-thirds (60%) of people in the samples were classified as false positive (fifth column in Table 2) and a quarter (25%) to well over half (61%) were classified as true negative (seventh column in Table 2). For all instruments and outcomes, the percentage classified as false positive is about 10 percentage points higher for people of color than white people. Relatively small percentages are classified as true positive (0.6% to 13.2%) or as false negative (0.3% to 4.1%). The percentage of people classified as false negative is within 1 percentage point between people of color and white people across all algorithms for all outcomes (sixth column in Table 2).
Second, we report on true positives, false positives, false negatives, and true negatives for the high threshold (i.e., a cutoff of three on the VPRAI and PTRA and four on the PSA; see the last four columns of Table 2). At the high threshold, the majority of people in both subgroups are again classified as either false positive or true negative. The number of people in the study samples classified as false positive ranged from very small (6%) to more than a third (39%) (ninth column in Table 2) and the number classified as true negative ranged from just under half (46%) to nearly the entire sample (93%; last column in Table 2). For all instruments and outcomes, the percentage of people classified as false positive is within 10 percentage points for people of color and white people. Again, relatively small percentages of the sample are classified as true positive (0.2%–10.0%) or false negative (0.7%–11.6%). Notably, the percentage of people classified as false negatives is higher with the high threshold than the low threshold across all instruments for all outcomes. The percentage of people classified as false negative is again within 1 percentage point between people of color and white people across all risk assessment algorithms for all outcomes (10th column in Table 2).
Research Aim 2: False-Positive Rates and False-Negative Rates
The general trends found for FPRs and FNRs are similar for all instruments across all outcomes (see Table 3). Again, results appear different depending on which threshold is considered. People of color consistently have higher FPRs (or false alarms) than white people across both thresholds. At the low threshold, there is a difference of roughly 6 to 13 percentage points depending on the instrument and outcome examined. However, at the high threshold, the difference only ranges from about 3 to 7 percentage points. White people have higher FNRs (or misses) than people of color across both thresholds. At the low threshold, the difference ranges from 0 to 11 percentage points depending on the instrument and outcome. The difference in FNRs is comparable at the high threshold (see Table 4). Overall, the FPRs produced for the low threshold are double and triple the FPRs found using the high threshold. The reverse is true of the FNRs, they are higher at the high compared to the low threshold.
False-Positive and False-Negative Rates for the PSA, PTRA, and VPRAI at Low and High Thresholds
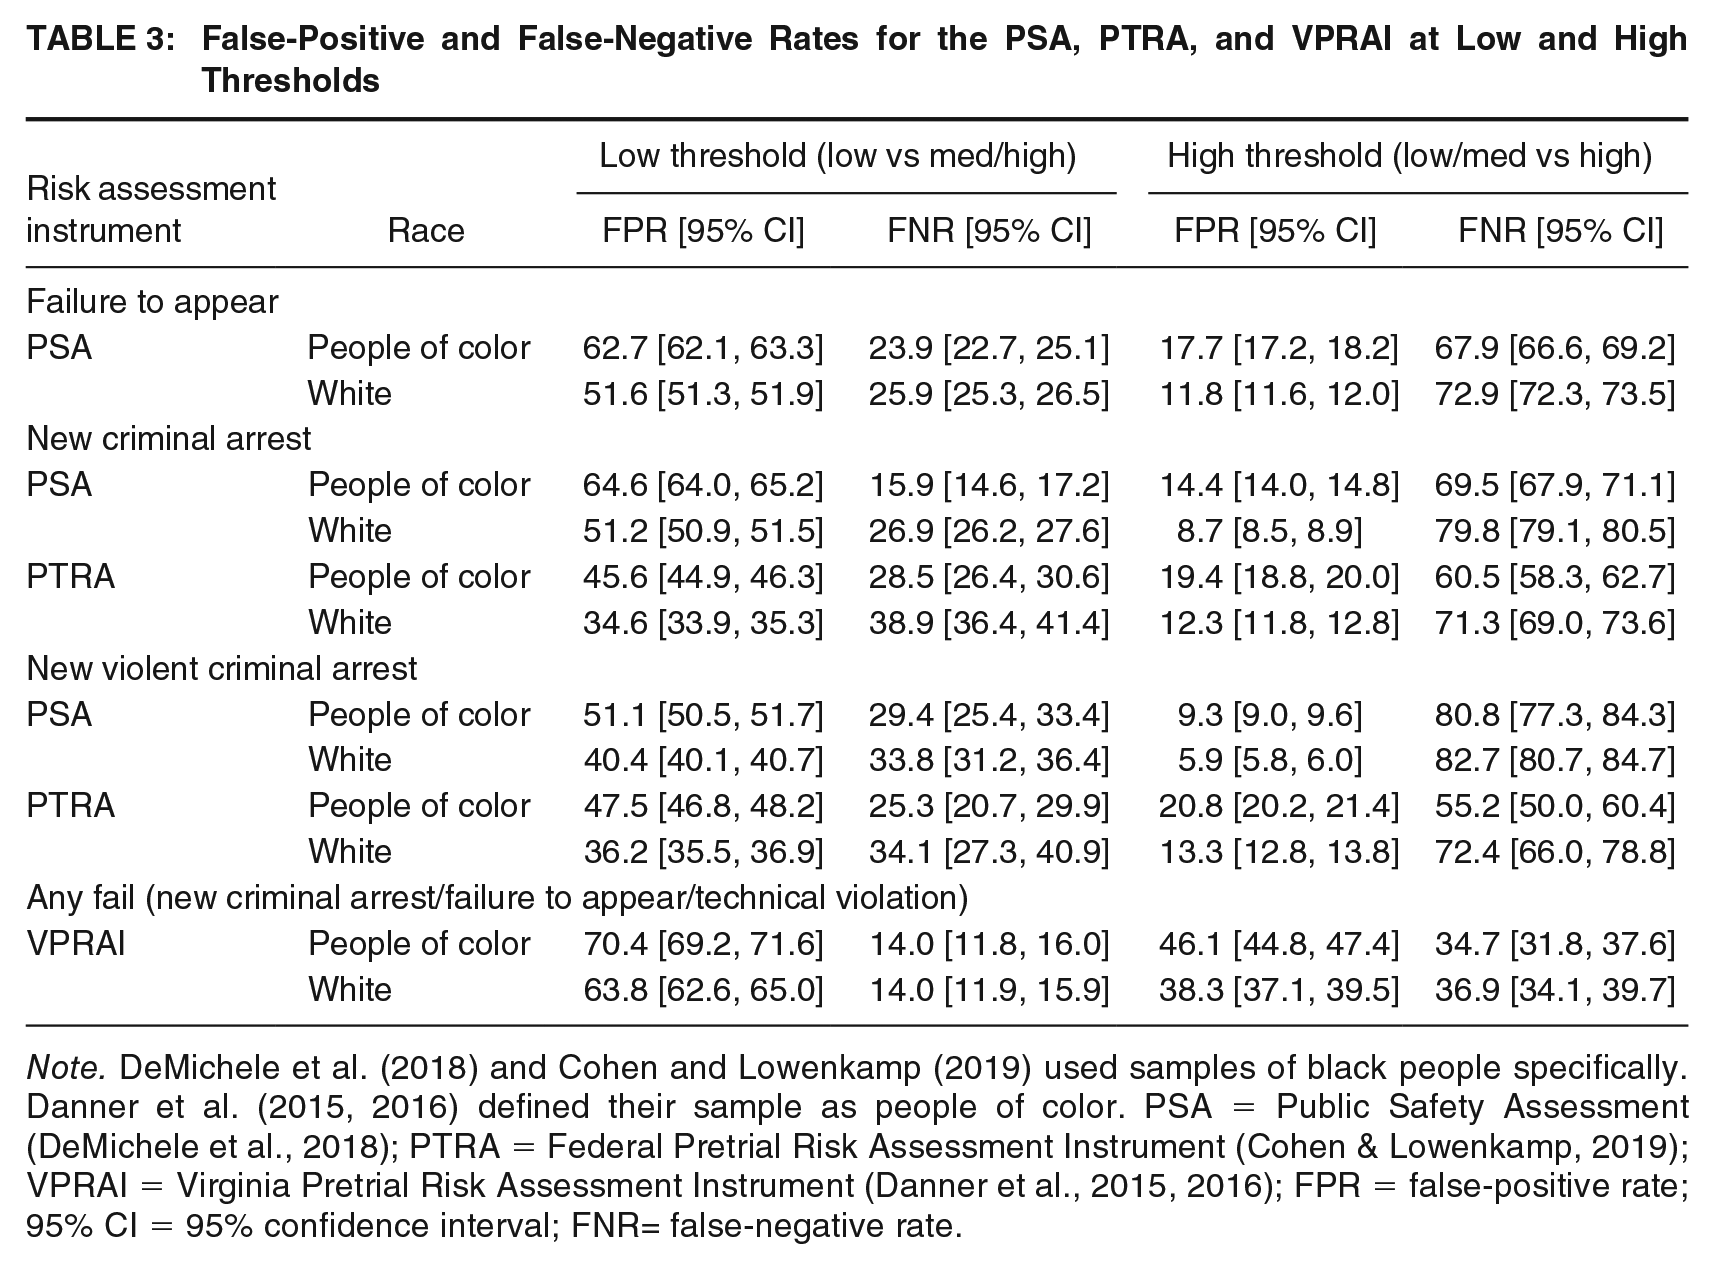
Note. DeMichele et al. (2018) and Cohen and Lowenkamp (2019) used samples of black people specifically. Danner et al. (2015, 2016) defined their sample as people of color. PSA = Public Safety Assessment (DeMichele et al., 2018); PTRA = Federal Pretrial Risk Assessment Instrument (Cohen & Lowenkamp, 2019); VPRAI = Virginia Pretrial Risk Assessment Instrument (Danner et al., 2015, 2016); FPR = false-positive rate; 95% CI = 95% confidence interval; FNR= false-negative rate.
Positive Predictive Value and Negative Predictive Value for the PSA, PTRA, and VPRAI at Low and High Thresholds
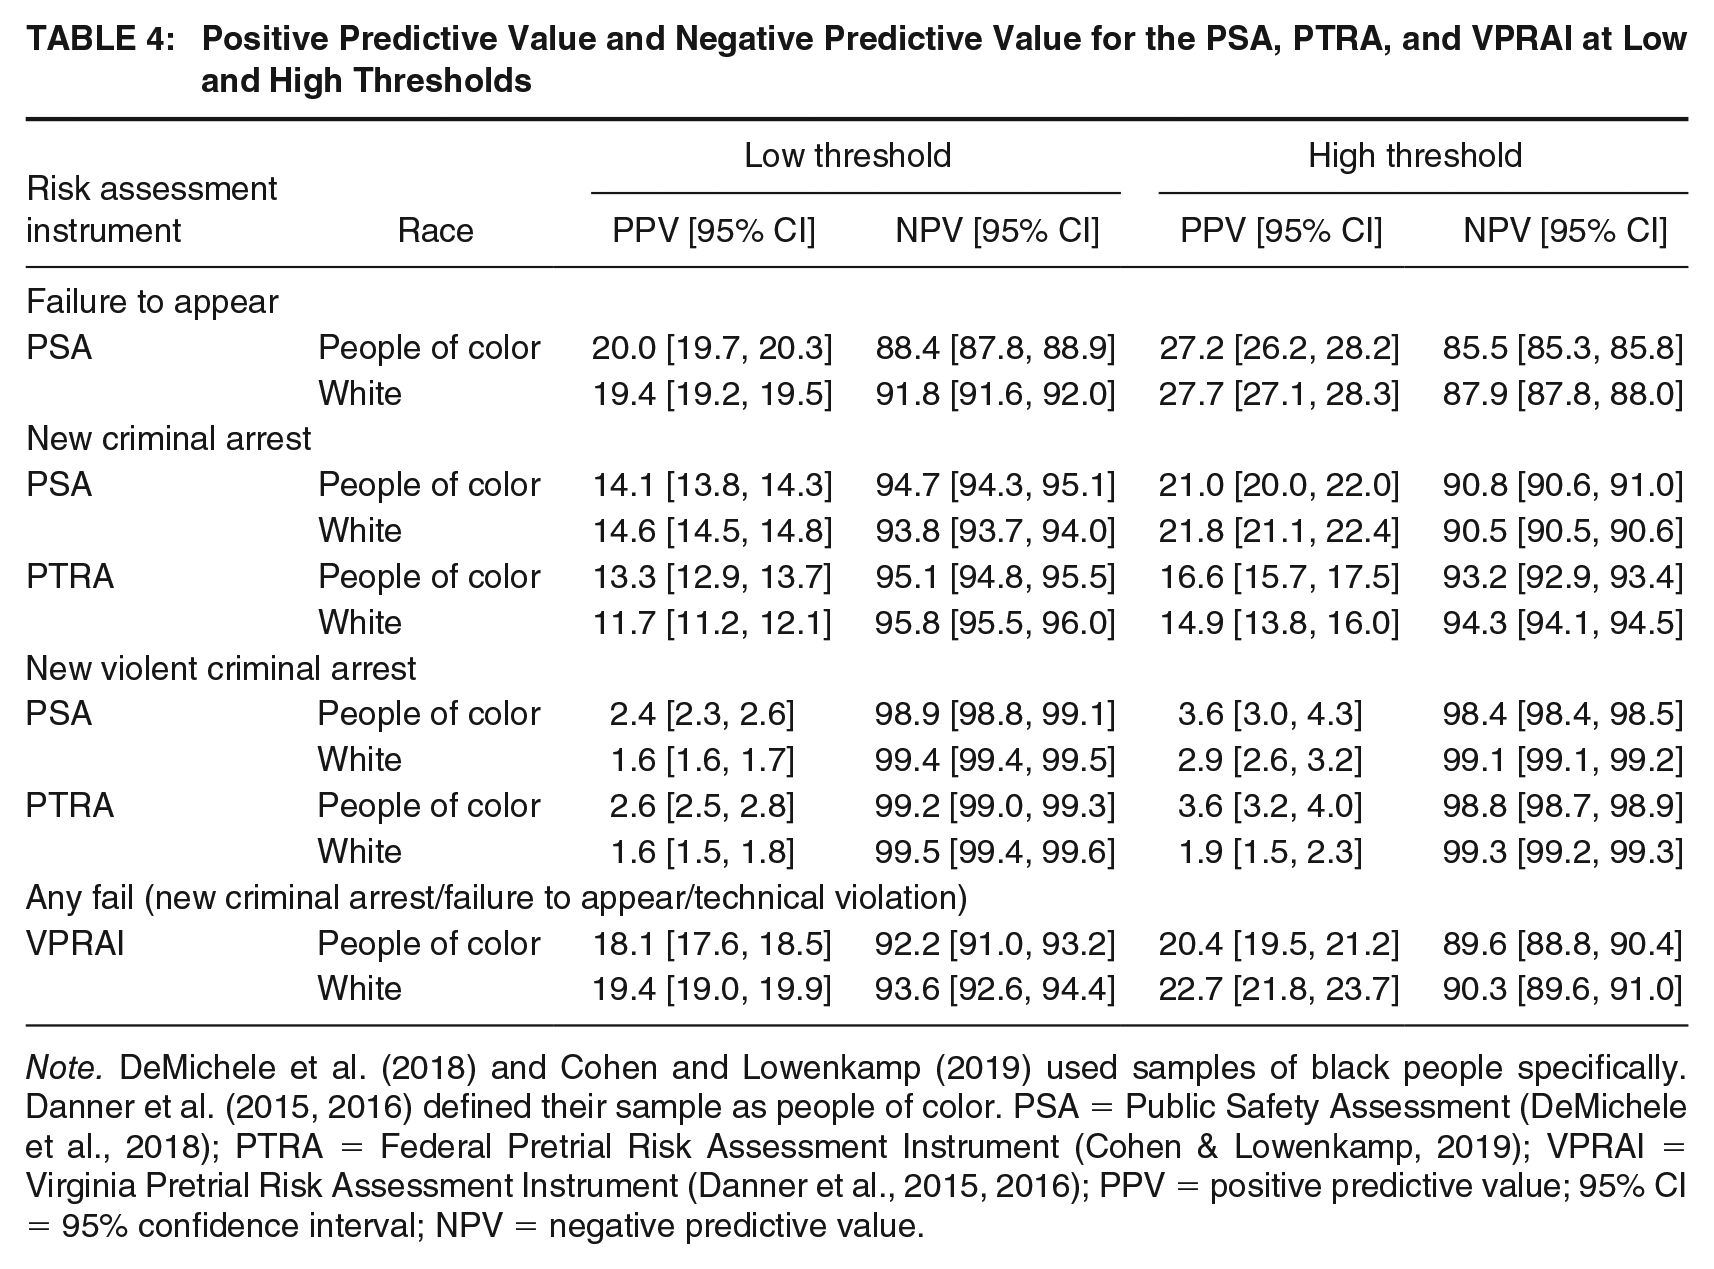
Note. DeMichele et al. (2018) and Cohen and Lowenkamp (2019) used samples of black people specifically. Danner et al. (2015, 2016) defined their sample as people of color. PSA = Public Safety Assessment (DeMichele et al., 2018); PTRA = Federal Pretrial Risk Assessment Instrument (Cohen & Lowenkamp, 2019); VPRAI = Virginia Pretrial Risk Assessment Instrument (Danner et al., 2015, 2016); PPV = positive predictive value; 95% CI = 95% confidence interval; NPV = negative predictive value.
Research Aim 3: PPVs and NPVs
Overall, both PPV and NPV scores are similar between people of color and white people, for all three algorithmic risk assessment instruments and all outcomes, regardless of which threshold is used (see Table 4). Across both thresholds, the PPVs alternate between people of color and white people in terms of which group has the higher value. For example, looking at the PTRA at the high threshold, the PPVs for NCA for people of color demonstrate that 16.6% of all people of color who tested positive were arrested (see Table 4, column 5) while 14.9% of white people who tested positive were arrested (see Table 4, column 5). Thus, a slightly greater proportion of people of color who tested positive were arrested compared to white people who tested positive. Similarly, for the PSA at the low threshold, a slightly higher proportion of people of color who tested positive had an NVCA (2.4%) compared to white people who tested positive (1.6%). However, PPVs for the VPRAI classifying any failure at the high threshold show the opposite trend. A smaller proportion (20.4%) of all people of color who tested positive experienced pretrial misconduct (see Table 4, column 5) compared to white people (22.7%; see Table 4, column 5). NPVs (see Table 4, columns 4 and 6) are much higher than PPVs, ranging from 88.4% to 99.5%. In addition, NPVs are slightly higher among white people than people of color by one or two percentage points at both thresholds, indicating that a slightly higher proportions of white people than people of color who test negative do not experience pretrial misconduct.
Discussion
The debate over the fairness of algorithmic pretrial risk assessment instruments continues steadily in both public and academic discourse. In search of an accessible way to evaluate and describe fairness, some researchers and other stakeholders have begun to evaluate error and accuracy using three sets of classification indicators in lieu of, or in addition to, other, more appropriate indicators. Specifically, assessment error has been evaluated using two sets of indicators: the percentages of people classified as false positives and true negatives (Hellman, 2020; Mayson, 2019; Skeem & Lowenkamp, 2020) and as the FPR and the FNR (Berk et al., 2021; Chouldechova, 2017; DeMichele & Baumgartner, 2020; Hamilton, 2018; Terranova & Ward, 2020). Assessment accuracy has been evaluated using one set of indicators: PPV and NPV (Berk et al., 2021; Chouldechova, 2017; Hamilton, 2018; Hellman, 2020). The goal of our study was to provide a data-driven comparison of these three sets of classification indicators.
Our findings show how conclusions regarding the fairness of pretrial risk assessment algorithms may be affected by the indicators used and the thresholds selected to calculate those indicators. For the sets of indicators focused on error rates, people of color were more often misclassified as false positive and had higher FPRs than white people, particularly at the low threshold, which would seem to support concerns regarding the fairness of algorithmic pretrial risk assessments instruments (Angwin et al., 2016; Hamilton, 2020; Robinson & Koepke, 2019; Southerland & Woods, 2018). However, when the high threshold was used, this pattern of findings—and, more specifically, the differences in the error rates for people of color and white people—were much less pronounced and, consequently, provide less compelling evidence regarding bias. Moreover, PPV and NPV values were similar for people of color and white people, suggesting that there is actually classification parity across groups. Taken together, our findings provide empirical evidence that the use of classification indicators to speak to the fairness of algorithmic pretrial risk assessment instruments is problematic. We discuss specific problems in further detail below.
Problems With Classification Indicators
The first problem with applying these classification indicators to evaluate algorithmic pretrial risk assessment instruments has to do with the threshold that must be set to classify people into true positives, false positives, false negatives, and true negatives. The difference in false-positive percentages and FPRs between the low and high threshold is striking. Percentages and FPRs produced with the low threshold are double and triple those produced with the high threshold. For example, when the high threshold is used to examine the PSA’s classification of people who were arrested for new violent crimes, our analyses show that 9.1% of people of color are classified as false positive. However, when the low threshold is used, 50.2% of people of color are classified as false positive. As another example, when the high threshold is used to examine the PTRAs classification of people who were arrested for new violent crimes, the FPR for people of color is 20.8% but when the low threshold is used, the FPR is 47.5%.
This striking difference happens because the low threshold assumes that everyone with a moderate or high-risk score will experience new violent crime. But, in reality, mid-range scores on the PSA correspond with a 1.2% to 2.1% estimated likelihood of new violent crime (DeMichele et al., 2018) and a mid-range score on the PTRA corresponds with a 1.3% estimated likelihood (Cohen & Lowenkamp, 2019). In other words, the vast majority of people with moderate scaled scores will not be arrested for new violent crime and therefore, they appear to be misclassified. The high threshold assumes that everyone with a high scaled score will experience new violent crime. Yet high scores on the PSA only correspond with 2.7% to 3.8% likelihood for new violent crime (DeMichele et al., 2018) and high scores on the PTRA correspond with a 2.1% to 2.9% likelihood (Cohen & Lowenkamp, 2019). Even among those with high scores, most people will not go on to be arrested for a violent crime during the pretrial period.
Using the low threshold over the high produces a very different impression of the classification error of the instruments. Far fewer people appear to be misclassified when the high threshold is used. However, researchers and other stakeholders who employ these classification indicators typically do not specify how or why a certain threshold was selected or discuss how findings would change if a different threshold were selected (Berk et al., 2021; Bhati, 2019; Chouldechova, 2017; DeMichele & Baumgartner, 2020; Hamilton, 2019; Harris et al., 2019; Hellman, 2020; Mayson, 2019). As a result, one study may use a low threshold and find that an algorithmic pretrial risk assessment instrument produces a very high percentage of false positives or a high FPR when a higher threshold may provide a different impression. If these classification indicators must be used, the decision of which threshold to select should be made by local stakeholders based on the estimated likelihood of the outcomes assessed by the instrument, consideration of the implications for public safety and civil liberties, and within the confines of statutory or other requirements (e.g., bond schedules).
The second problem with applying these classification indicators is the fact that they are affected by base rates (Helmus & Babchishin, 2017; Pepe, 2003; Ranganathan & Aggarwal, 2018). For PPVs and NPVs, base rates put boundaries on the possible range of values for each indicator; PPV’s increase with increases in the prevalence of pretrial misconduct, while NPVs decrease. For example, in the PTRA study (Cohen & Lowenkamp, 2019), the base rate for NCA was 8.92% for people of color and 6.95% for white people. The PPV for classification of NCA at the high threshold for people of color is 16.6% while the NPV is 93.2%. The PPV for classification of NCA at the high threshold for white people is 14.9% while the NPV is 94.3%. These indicators reflect differences in base rates of pretrial misconduct more than they reflect the performance of the risk assessment instruments (Helmus & Babchishin, 2017). Indeed, the problem of base rate dependency for these classification indicators has long been discussed in relation to mental health screening and researchers have urged practitioners to be mindful of base rates when evaluating screening results (Glaros & Kline, 1988; Lavigne et al., 2016; Meehl & Rosen, 1955). This same mindfulness must be applied to evaluate pretrial risk assessment results. The fact that relatively few people in all three samples experience pretrial misconduct is reflected by the much higher true-negative percentage and NPVs for all instruments across all outcomes for both race subgroups. Furthermore, PPV and NPV cannot be used to compare across jurisdictions or even within one jurisdiction over time as base rates may change.
A third problem is the fact that each of these classification indicators evaluates a portion of the sample independently from the full sample. FPR only evaluates classification for the portion of the sample who did experience pretrial misconduct. When base rates are low, this will be a small portion of the sample. For the PSA classifying NVCA for white people, this is only 0.99% (n = 1,321) of the sample, less than 1%. FNR evaluates an instrument’s classification of the portion who did not experience pretrial misconduct. Again, for the PSA classifying NVCA for white people, this will be the majority of the sample (99%, n = 132,196). Similarly, PPV only considers the portion of the sample who “tested positive” and NPV only considers the portion who “tested negative.” Some researchers have suggested that it is preferable to only focus on certain portions of the sample when evaluating algorithmic risk assessment instruments (Hester, 2020). However, this does not speak to an instrument’s fairness overall. Furthermore, these values change based on which cutoff threshold is used because different thresholds mean different portions of the sample are included. For example, PPVs range from about 1 to 8 percentage points higher at the high threshold compared to the low threshold (see Table 4). This happens because at the low threshold, anyone with a moderate- or high-scaled risk score is considered to “test positive,” so the ratio of true positives to total positives is smaller. However, at the high threshold, only people with a high-scaled risk score are considered to “test positive” so the ratio of true positives to total positives is bigger.
The fourth problem, which also belies an overall impression of instrument fairness, is the fact that classification indicators do not consider the full range of scores provided by algorithmic pretrial risk assessment instruments. Instruments generally produce raw scores associated with three to six scaled risk scores (Latessa et al., 2009; Lowenkamp & Whetzel, 2009; Pretrial Justice Institute, 2012; VanNostrand, 2003; VanNostrand & Lowenkamp, 2013), not a binary score associated with whether a person will or will not experience pretrial misconduct. Instruments included in this study result in scaled scores ranging from 1 to 5 or 1 to 6. Table 1 displays the process of collapsing scaled scores. For example, at the low threshold, scores of 1 and 2 were collapsed to create the no misconduct classification and scores of 3 through 5 or 6 were collapsed to create the yes misconduct classification. In reality, the strength of misclassification may change from one scaled score to the next, but this nuance is lost when dichotomies are imposed on risk scores. Moreover, in practice, the full range of risk assessment scores are used to inform decisions for the full sample of people to whom the instrument is administered.
A fifth problem with these classification indicators is the fact that there are no established cutoff values that can be used to determine whether a particular PPV or NPV is “fair,” “good,” or “excellent” (Helmus & Babchishin, 2017) or whether a particular FPR or FNR is acceptable or not. Other metrics, such as AUCs or odds ratios, have well-established benchmarks indicating statistically acceptable accuracy or tolerable error (Desmarais & Singh, 2013). Without clear benchmarks, it is difficult for researchers or other stakeholders to determine how accurate a pretrial risk assessment instrument is or how much error is present in the assessment results both overall and across subgroups. Indeed, some have suggested this decision should not be up to researchers for this reason (Berk et al., 2021). For example, it is difficult to draw meaning from the PPV found for the PSA classifying NCA at the high threshold (see Table 4, column 5). What does it mean that 21.0% of all people of color who tested positive went on to be arrested compared to 21.8% of white people? Does this mean the PSA has good, and similar, predictive accuracy when classifying NCA across race? It is difficult to say when underlying base rates also differ between these groups. It is equally difficult to determine whether the difference in FPRs for the VPRAI classifying any pretrial misconduct at the high threshold between white people (FPR = 38.3%) and people of color (FPR = 46.1%) is acceptable or unacceptable.
Generalizable, established cutoff values to determine the acceptability of classification indicators cannot be created because these classification indicators are so influenced by base rates. Furthermore, unlike with other metrics (e.g., AUCs), statistical comparisons of these classification indicators are limited. Even if that were not the case, it is not the place of researchers to make determinations about tolerable levels of differences between subgroups for the classification indicators described in this article (Goel et al., 2021). Decisions about acceptable levels of difference must be made by individual jurisdictions via discussions with all relevant stakeholder groups (Robinson & Koepke, 2019) as part of larger conversations about reform goals. Stakeholders must establish a shared understanding of what constitutes bias and fairness in terms of the performance of instruments. Furthermore, stakeholders will have to determine the extent to which they wish to prioritize reducing disparities in instrument accuracy over error as a lower rate of disparity for one necessarily results in a higher rate for the other when outcomes are different across groups (Chouldechova, 2017).
Pretrial Risk Assessment Instruments in Practice
The Supreme Court has ruled that the overwhelmingly majority of people should be eligible for pretrial release, provided there can be appropriate conditions of pretrial release to facilitate public safety (see United States v. Salerno, 481 U.S. 739, 1987). By design, information on the estimation of pretrial misconduct communicated by algorithmic pretrial risk assessment results is intended to inform, not make, a pretrial release decision (Helmus & Babchishin, 2017). Assessment results should be used to inform decisions about the small minority of people for whom community release without conditions may not be appropriate (Desmarais & Lowder, 2019). However, the sets of indicators described herein may inadvertently convey that there are clear threshold values (e.g., a high-risk classification) above which judges assume everyone will engage in pretrial misconduct and therefore should not be released. In practice, release decisions are multifaceted and are made in rapid process hearings (Stevenson & Mayson, 2017). Judges use information from pretrial risk assessment instruments together with other current and historic information about a person. In some jurisdictions, bail statutes allow judges to consider a person’s character, mental and emotional condition, history of mental illness, and a wide range of other characteristics (Widgery, 2020). In many jurisdictions, pretrial release agencies or other agencies serving a similar function (e.g., probation departments) make a recommendation to be considered by the judge (National Associaton of Pretrial Service Agencies, n.d.). Prosecutors also frequently weigh in with a recommendation (Phillips, 2004; Worden et al., 2018).
Despite the many sources of information judges are to consider when deciding whether to release someone, the sets of indicators examined herein falsely assume that a single threshold value will determine a person’s pretrial release. This assumption simply is not reflective of how the decision is made. Furthermore, these classification indicators provide limited information about whether algorithmic pretrial risk assessment instruments themselves predict outcomes with similar accuracy across risk scores and subgroups of people. Instead, as we demonstrate here, these indicators are influenced by base rates and the artificial dichotomization of risk scores. Differences across subgroups like those found in this study likely reflect system-level disparities (e.g., Kochel et al., 2011). To truly determine whether algorithmic pretrial risk assessments affect disparities in pretrial decisions and outcomes, researchers and other stakeholders must examine these outcomes when assessments are used compared to practice as usual (Lowder et al., 2021; Skeem & Lowenkamp, 2020; Vincent & Viljoen, 2020). Finally, our discussion has focused on the implications that dichotomizing risk scores has for estimating risk, but it is also true that these dichotomies impede risk management. There are a range of services or types of supervision that practitioners may recommend for a person during the pretrial period and practitioners seek to make recommendations commensurate with a person’s estimated risk (Cooprider, 2009). Dichotomizing risk scores into whether a person will or will not engage in misconduct does little to inform these nuanced recommendations.
Alternative Indicators for Evaluating Fairness
Our paper has focused on three sets of classification indicators that have grown in popularity as ways to evaluate error and accuracy in algorithmic pretrial risk assessment instruments despite their number of limitations. However, there are other indicators, as we alluded to in the introduction, that overcome some or all of these limitations and are therefore better suited to evaluate error and accuracy in the performance of pretrial risk assessment instruments. The most common alternative indicator used to evaluate algorithmic risk assessment instruments is the area under the receiver operating characteristic curve (AUC; Singh et al., 2013). AUCs measure positive predictive accuracy and how well assessment results distinguish people who do go on to have an outcome from those who do not (Helmus & Babchishin, 2017). Another common indicator is the odds ratio derived from logistic regressions (Singh et al., 2013). Researchers may estimate logistic regression models that allow them to examine whether the relationship between risk scores and outcomes vary as a function of race or other characteristics (Hanson et al., 2010; Rajlic & Gretton, 2010; Skeem & Lowenkamp, 2016, 2020). This is the method recommended by the testing standards mentioned in the introduction (AERA et al., 2014). Additional indicators that may be examined include balance of the negative and positive class (Kleinberg et al., 2016), predictive parity (Chouldechova, 2017), and conditional statistical parity (Corbett-Davies et al., 2017). One final indicator, that can be a source of confusion due to differing definitions across fields, is calibration. Where psychology researchers define calibration as how well predicted risk agrees with observed risk (Helmus & Babchishin, 2017; Singh et al., 2013), researchers in other fields define calibration as whether risk scores reflect the same likelihood of an outcome across different groups of people (Chouldechova, 2017; Corbett-Davies et al., 2017; Eckhouse et al., 2019; Kleinberg et al., 2016). Measurements of calibration under both definitions can be used to assess the performance of continuous algorithmic risk assessment scores. Detailed discussion of each of the indicators is beyond the scope of this article; we refer readers to the cited papers for more information on each indicator.
Limitations
Our findings must be considered within the context of this study’s limitations. First, the data examined represent just three algorithmic pretrial risk assessment instruments. There are dozens of other pretrial risk assessment instruments (Desmarais et al., 2020) and algorithmic risk assessment instruments in use at other stages of the legal system (Singh et al., 2013). Second, our race comparisons were constrained to the information reported in prior studies. Two studies compared black and white samples (Cohen & Lowenkamp, 2019; DeMichele et al., 2018) and one compared people of color and white people (Danner et al., 2016). We had to rely on race and not ethnicity for our comparisons because ethnicity was only included as a comparison group in one study (i.e., Cohen & Lowenkamp, 2019). Furthermore, none of these studies clearly defined their race classifications or specified how these classifications were decided (e.g., self-report, determined from administrative records, etc.). Studies simply stated the proportion of their sample that comprised each race classification. Going forward, studies focused on examining racial bias in risk assessment should provide explanations for how race is defined and how race classifications are determined because race lacks universally shared conceptual definitions (Helms et al., 2005). Examinations of algorithmic pretrial risk assessment instruments must consider how these instruments function for people of other races and ethnicities. Third, our analyses are limited to comparisons of race, though other subgroups (e.g., gender and socio-economic status) could also provide important insights into the limitations of the sets of classification indicators examined herein.
Conclusion
Much discussion of fairness in algorithmic pretrial risk assessment instruments has focused on whether there is racial bias in the scores produced by these instruments (Berk et al., 2021; Chouldechova, 2017; Corbett-Davies et al., 2017; Hamilton, 2018; Hellman, 2020; Kleinberg et al., 2018; Mayson, 2019; Slobogin, 2018; Southerland & Woods, 2018). These concerns merit thorough consideration by all stakeholders who use or are contemplating the use of these instruments toward pretrial reform efforts. Notably, current research examining racial bias generally focuses on total scores or risk categories and excludes examination of bias at the item level. Item-level analysis represents an important avenue for further investigation. However, in this article, we examine classification indicators that are gaining popularity among some stakeholders for evaluating bias in assessment error and accuracy (i.e., true positives, false positives, true negatives, false negatives, PPV, NPV, FPR, and FNR). Our findings demonstrate how these indicators are reliant on base rates, do not incorporate the entire range of risk scores or entire study samples, have no established cutoff values to indicate acceptability of values, and can be drastically altered depending on the cutoff threshold that is used to dichotomize the instrument’s risk scores. The problems with these classification indicators limit their usefulness as measures of algorithmic fairness.
These indicators are also unable to address other concerns related to algorithmic fairness, namely, whether risk assessment instruments will have a disparate impact on the pretrial decisions made across subgroups. Even if accuracy and error are similar across subgroups, it may be the case that there are still differences in pretrial decisions such as bail amounts or level of supervision required. There is limited evidence that the use of algorithmic risk assessment instruments results in greater system-level disparity than decision-making in the absence of these instruments (Vincent & Viljoen, 2020). However, existing racial disparities in the likelihood and length of pretrial detention do sometimes persist after instruments are implemented (Marlowe et al., 2020; Redcross & Henderson, 2019). This appears to be due to a lack of adherence to the release guidelines recommended by algorithmic pretrial risk assessment results or other poor implementation practices (Hopkins et al., 2018; Stevenson, 2018). Future research must examine whether there are biases in how the scores are used to inform decision-making.