



Abstract
Juvenile risk assessments are standardized rating tools used by court practitioners to measure criminogenic risk in justice-involved youth. To capture individual fluctuation in risk level over time, juvenile risk assessments are often readministered throughout court supervision. The purpose of this study is to clarify the average criminogenic risk score trajectory among justice-involved youth, both in aggregate and by race/ethnicity. Analyses draw upon a sample of 611 justice-involved youths who received two or more risk assessment scores and were under court supervision for at least 1 year. Using multilevel modeling, findings indicate that risk scores decrease over the first 19 months of court supervision before rebounding in increasingly larger increments. Furthermore, risk scores of White youth appear to be most amenable to reduction over time, while scores of Black youth remain stagnant. Results have implications toward understanding the gains and losses in risk score reduction observed in youth under prolonged court supervision.
Juvenile risk assessments have become an increasingly common method of risk evaluation in courts across the United States. Juvenile risk assessments are standardized rating tools, which measure criminogenic risk in minors based upon empirical risk factors. Juvenile risk assessments display evidence-based advantages over the unstructured judgment of justice officials: (a) They are more accurate in distinguishing youth who will reoffend from their peers (Bonta & Andrews, 2007; Oleson et al., 2011); (b) they ensure that justice-involved youth are evaluated consistently (St. John et al., 2020); and (c) they facilitate effective case planning by identifying individual areas of need (Vincent et al., 2012). Courts utilizing juvenile risk assessments witness lower rates of recidivism and higher rates of treatment compliance compared with those that rely upon unstructured decision-making (Schwalbe, 2007; Vincent et al., 2012).
Despite these successes, premising judicial decisions throughout the entire period of court supervision on a single estimate of criminogenic risk is ill-advised (Olver et al., 2007). Thus, experts recommend re-administering risk assessments to justice-involved youth regularly and adjusting sanctions in accordance with their dynamic risk profiles (Olver et al., 2007). Although changes in juvenile risk assessment scores are expected, few studies have assessed whether and how risk level changes over time. Furthermore, to our knowledge, no studies have examined whether criminogenic risk score trajectories vary over time by race/ethnicity. Juvenile risk assessments are a purportedly race-neutral means of estimating criminogenic risk (Brown, 2007). However, assessment items tied to education, family, and environmental risk may indirectly measure experiences of structural racism (Brown, 2007; Moore & Padavic, 2011). If juvenile risk assessments measure the effects of structural racism, it is unlikely that the risk scores of racially marginalized youth will decrease over time.
The purpose of this study was to clarify the criminogenic risk score trajectory of justice-involved youth, both in aggregate and across racial/ethnic subgroups. Using multilevel modeling of repeated measures, analyses drew upon a sample of 611 justice-involved youths who received a total of 3,744 juvenile risk assessments over a minimum of 1 year under the supervision of a juvenile court. The results have practical and theoretical implications for understanding the gains and losses in risk reduction observed in youth under prolonged juvenile court supervision.
Literature Review
Use of Risk Assessments in Juvenile Courts
Risk assessment use is increasingly common in juvenile courts: As of 2020, 42 states’ laws or probation agency policies support their use (Juvenile Justice Geography, Policy, Practice & Statistics [JJGPPS], 2020). Juvenile risk assessments provide evidence-based estimates of criminogenic risk (hereinafter “risk scores”), which are used by justice officials to inform discretionary decision points throughout court processing. Although uses vary by court, risk scores are often used to determine eligibility for diversion, develop individualized case plans, and make service referrals (Vincent et al., 2012).
Juvenile risk assessments provide a standardized method for juvenile courts to measure changes in criminogenic risk over time. Many components of criminogenic risk measured in risk assessments (i.e., substance use, educational achievement, peer associations) may fluctuate over time in response to intervention, environmental influence, or normative adolescent development. Accordingly, experts recommend readministering juvenile risk assessments to recalibrate case planning in response to changes in risk level. If a youth has completed the recommended services and their risk level has decreased, consideration for early dismissal from court supervision is advised (Vincent et al., 2012).
Little is known regarding how youth risk scores change over time. Using the Pathways to Desistance survey to approximate juvenile risk assessment criteria, Mulvey and colleagues (2016) found that, among a sample of youth who had been adjudicated for serious crimes, risk scores were highest at disposition and decreased over the following 3 years. However, these changes varied by domain, such that some risk factors decreased significantly over time, while others remained static. Baglivio and Jackowski (2015) examined whether youth who were part of a victim impact intervention experienced significant change in their juvenile risk assessment score compared with control youth. The intervention group witnessed a significant risk reduction in areas concerning coping with feelings and emotions compared with the control group. In sum, findings from these related studies indicate that effective, targeted court-sanctioned intervention may reduce juvenile risk assessment scores over time.
Although these studies offer preliminary insight into how risk scores may change over time, several critical areas of ambiguity remain. First, while risk reduction was apparent in the subgroups who participated in previous studies (e.g., youth who had been adjudicated for serious crimes and participants of a victim impact intervention), more research is warranted to clarify the criminogenic risk score trajectory of juveniles who have experienced prolonged court supervision. Furthermore, it is unclear whether and how pertinent demographic characteristics, especially race/ethnicity, inform observed changes in risk scores over time.
Racism in Juvenile Risk Assessment
Juvenile risk assessments were designed, in part, to promote fair and equitable justice administration by reducing discretionary biases in risk evaluation (Schwalbe et al., 2006). Researchers have found differential treatment by race/ethnicity when discretionary decisions are guided by the unstructured judgment of juvenile court officials (Bridges & Steen, 1998). When risk evaluations are premised on discretion, non-White youth are more likely to be placed in pretrial detention (Bishop & Frazier, 1996; Wordes et al., 1994), formally petitioned (Bortner et al., 1985; DeJong & Jackson, 1998), and receive more punitive sanctions (McGarrell, 1993; Thomas & Sieverdes, 1975), controlling for offense severity. Although juvenile risk assessments are not designed to prescribe court decision-making, they may reduce disparate treatment by race/ethnicity by giving juvenile court practitioners consistent information about criminogenic risk (D. A. Andrews et al., 1990).
Despite intentions of unbiasedness, some scholars suggest that juvenile risk assessments are only “superficially race neutral” (Brown, 2007). Juvenile risk assessments may perpetuate racially-biased justice-system treatment by incorporating the effects of structural racism into the calculation of criminogenic risk (Brown, 2007; Moore & Padavic, 2011; Starr, 2014). Structural racism is, broadly, the idea that racism is systemically rooted and codified into our policies, laws, practices, structures, and institutions. Structural forms of racism interact to produce differential access to power, wealth, high-quality education, safe housing, employment opportunities, and health care (Bailey et al., 2017; Bonilla-Silva, 1997; Jones, 2000; Powell, 2007).
The effects of structural racism might influence responses to a juvenile risk assessment interview. For example, federal subsidies, predatory mortgage lending policies, subsidized housing locations, and lending restrictions maintain racially segregated residential spaces marked by “disinvestment and concentrated poverty” (Powell, 2007; Williams & Mohammed, 2013). Residential segregation, in turn, is associated with inequities that affect residents, including restricted access to health care (Bailey et al., 2017), lack of employment opportunities (Powell, 2007), and under-resourced education systems (Powell, 2007). These experiences may influence responses to questions regarding education (e.g., school dropout), family (e.g., parental supervision), or leisure time management (e.g., involvement in afterschool activities). Unsurprisingly, race is often positively correlated with juvenile risk assessment items (Campbell et al., 2018). As Brown (2007) writes of the Washington State juvenile risk assessment: “Each category (of criminogenic risk) builds in a bias towards youth of color by neglecting how urban geographies affect these standardized measures.”
Given that many courts readminister juvenile risk assessments to continuously adapt case planning, it is critical to determine whether changes in risk score are associated with race. If risk scores for youth of color are rooted in structural racism, it may be unlikely that their risk scores will change substantially over time (Silver & Miller, 2002). For example, a juvenile risk assessment could indicate that an adjudicated youth would benefit from mental health services; however, many Black youth face barriers of availability, accessibility, and affordability when seeking mental health care (Planey et al., 2019). Alternatively, a juvenile risk assessment could indicate that a youth is having trouble at school with teachers or peers; however, Black youth are disproportionately suspended and expelled (Gregory et al., 2010), hindering educational progress. Thus, while juvenile risk assessments identify areas of criminogenic needs (e.g., mental health; education), structural racism creates barriers that prevent youth from accessing resources and reinforce disparities that cannot be changed through individual intervention.
If risk score reduction is inhibited for youth of color, juvenile risk assessments could perpetuate disproportionate minority contact in the juvenile justice system (Moore & Padavic, 2011). Risk scores are often used to determine eligibility for diversion and to develop case management plans (Vincent et al., 2012); consistently high-risk scores may legitimize longer and more restricted court supervision and sanctions. Youth of color, especially Black youth, are already represented disproportionately at numerous stages in juvenile court decision-making (e.g., waiver to adult court, sanctioning decisions; Piquero, 2008). Enforcing longer or more restrictive services and sanctions could further institutionalize this trend. In light of this evidence, it is critical to understand whether and how criminogenic risk score trajectories vary significantly between justice-involved youth across race/ethnicity.
Current Study
The purpose of this study was to examine how juvenile risk assessment scores changed over time, using a sample of youth who were involved with the juvenile justice system for at least 1 year. In addition, we sought to determine if the changes in juvenile risk assessment scores varied systematically for youth across race/ethnicity. The forthcoming analyses tested the following research questions and hypotheses:
Given the role of juvenile risk assessments in supporting effective rehabilitation, we hypothesized that:
Given that juvenile risk assessments may indirectly measure the effects of structural racism, we hypothesized that:
Method
Sample
The analytic sample of 2,384 juvenile risk assessments was distilled from a database representing all youth who were formally petitioned and adjudicated as delinquent in a mid-sized county in the Midwestern United States between June 2004 and January 2017. Youth were retained in the sample if they had more than one risk assessment score and the time between their first and last risk assessment score was at least 1 year. All risk assessment scores conducted within 4 years of the youth’s initial adjudication were represented in the analytic sample. The present study drew upon official court records representing 611 youths between the ages of 10 and 18 (M = 14.20 years, SD = 1.34 years). The sample included 142 (23.24%) girls and 469 (76.76%) boys who were formally petitioned under a variety of changes, most frequently involving property (n = 273; 44.68%) and person (n = 180; 29.45%) offenses.
Measures
Outcome: Criminogenic Risk Score
Criminogenic risk score refers to cumulative scores on the Youth Level of Services/Case Management Inventory (hereinafter “YLS/CMI”), a proprietary juvenile risk assessment instrument that is widely utilized across a variety of court settings (Schwalbe, 2007). The YLS/CMI is a 42-item instrument which measures criminogenic risk in eight domains: Prior Dispositions & Offenses, Education, Leisure & Recreation, Attitudes & Orientation, Personality & Behavior, Peer Relations, Substance Abuse, and Family & Parenting (Simourd et al., 1994). Risk is classified as one of four levels based upon the cumulative number of risk factors identified: low risk (under 8 risk factors), moderate risk (between 9 and 22 risk factors), high risk (between 23 and 34 risk factors), and very high risk (over 35 risk factors).
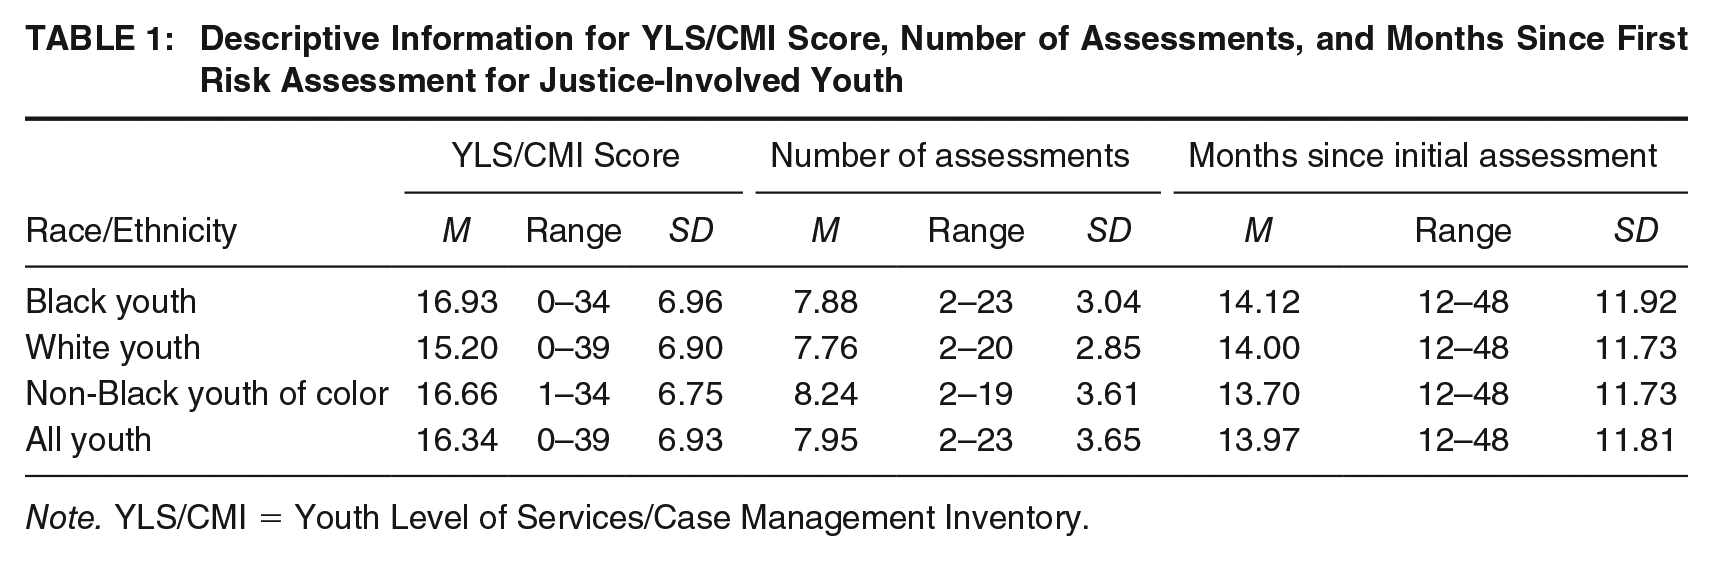
In the present research setting, the initial YLS/CMI is administered to youth between their adjudication and disposition hearings. YLS/CMI reassessments are completed every 3 months until the youth is dismissed from court supervision. Reassessments are postponed if youth are absent without legal permission or detained in out-of-home placement; in these cases, reassessments resume at the earliest possible opportunity. The present study drew upon 3,744 YLS/CMI scores. The number of assessments per youth ranges from 2 to 23 (M = 7.95, SD = 3.65; see Table 1).
Descriptive Information for YLS/CMI Score, Number of Assessments, and Months Since First Risk Assessment for Justice-Involved Youth
Note. YLS/CMI = Youth Level of Services/Case Management Inventory.
Predictor: Time
To investigate how criminogenic risk levels changed over time, our unit of time corresponded to the grand-mean centered months since initial risk assessment date. Within the sample of 611 youths, time since the initial assessment ranged from 0 to 48 months (M = 13.97, SD = 11.81; see Table 1). To account for nonlinear criminogenic trajectories, both linear and quadratic estimates for time were included in all models.
Predictor: Race/Ethnicity
To investigate whether criminogenic risk trajectories varied systematically by race/ethnicity, this was captured in three mutually exclusive categories: Black, White, and non-Black youth of color (see Table 1). Racial/ethnic classifications were drawn from the youth’s initial risk assessment records. Of the 611 total youths, 257 (42.06%) were identified as Black, 181 (29.62%) as White, and 171 (27.99%), and as non-Black youth of color. The non-Black youth of color classification aggregates those who identified as Hispanic/Latinx (n = 49; 8.02%), Multi-Racial (n = 112; 18.33%), or Other (n = 10; 1.64%) due to comparatively small numbers within each of these racial/ethnic subgroups. Race/ethnicity was effects coded in all analyses. All fixed effects pertaining to race/ethnicity indicate the extent to which each groups’ risk scores/trajectories varied from the unweighted grand mean (Davis, 2010).
Procedures
Risk assessment data were obtained through a collaborative research partnership with a juvenile circuit court. The YLS/CMI records were collected via structured interview between a highly trained case manager and a justice-involved youth. Case managers scored each assessment item dichotomously based upon the youth’s self-report, using a set of predetermined criteria. Case managers then calculated cumulative risk scores based on the unweighted sum of all risk factors identified. Identifying information linked to the sample data was removed prior to all analyses.
Analytic Plan
A multilevel analysis of repeated measures was used to predict changes in criminogenic risk scores among justice-involved youth. All analyses were conducted using restricted maximum likelihood estimation to eliminate bias in fixed effects (Hox et al., 2018). The variance–covariance matrix of the random effects in all models was unstructured, such that no constraints were imposed on model estimates. All analyses were performed in SPSS Version 27.
Results
Model I: Testing Nonindependence
First, a fully unconditional (null) model was estimated to determine the degree of nonindependence between risk scores attributed to the same youth. The model included a fixed and random intercept, and an estimate for residual variance. The overall interclass correlation was .50 (Wald Z = 14.38, p < .001), indicating a strong average correlation in risk scores attributed to the same youth (Cohen, 1988). This finding suggests that risk scores assigned to the same youth were more similar to each other, relative to risk scores assigned to different youth. The high level of nonindependence within the data justifies the present study’s multilevel analytic approach.
Model II: Criminogenic Trajectory of Justice-Involved Youth
A growth model was generated to answer RQ1, how do juvenile risk assessment scores change over time for justice-involved youth? The model included fixed and random effects for the intercept, linear change in risk score over time, and nonlinear change in risk score over time. Time increments corresponded to grand-mean-centered months since the youth’s initial risk assessment date. The lower-level R2 for Model II, corresponding to proportion of within-subjects variance explained by the predictors, was .40. The upper-level R2 for Model II, corresponding to proportion of between-subjects variance explained by the predictors was .44 (see Table 2).
Fixed and Random Effects Modeling the Change in Criminogenic Risk Scores Over Time

p < .05.
All parameters corresponded to criminogenic risk scores when time since initial assessment was at its average, 13.97 months. The fixed intercept indicated that, after 13.97 months since initial assessment, the average risk score was 15.70. This value falls squarely within the YLS/CMI’s moderate risk level classification (Simourd et al., 1994). The significant negative fixed effect for linear change over time, F(1,499) = 7.76, p = .001, suggests that, after 13.97 months since initial assessment, risk scores were predicted to decrease by .04 points as time increases by 1 month. In addition, the significant fixed effect of nonlinear change over time, F(1,201) = 20.47, p < .001, indicates that the incremental decrease in risk score plateaued as time increased by 1 month.
Model II additionally yielded significant random effects for the intercept and slopes. These estimates indicated that justice-involved youth varied significantly in their average risk score, the linear rate of change over time, and the nonlinear deceleration in change over time. Predicted risk scores decreased for the first 19 months after the initial assessment date (see Figure 1); however, the rate of change became incrementally smaller as time increased by 1 month. After 19 months, predicted risk scores increased at increasingly larger intervals.
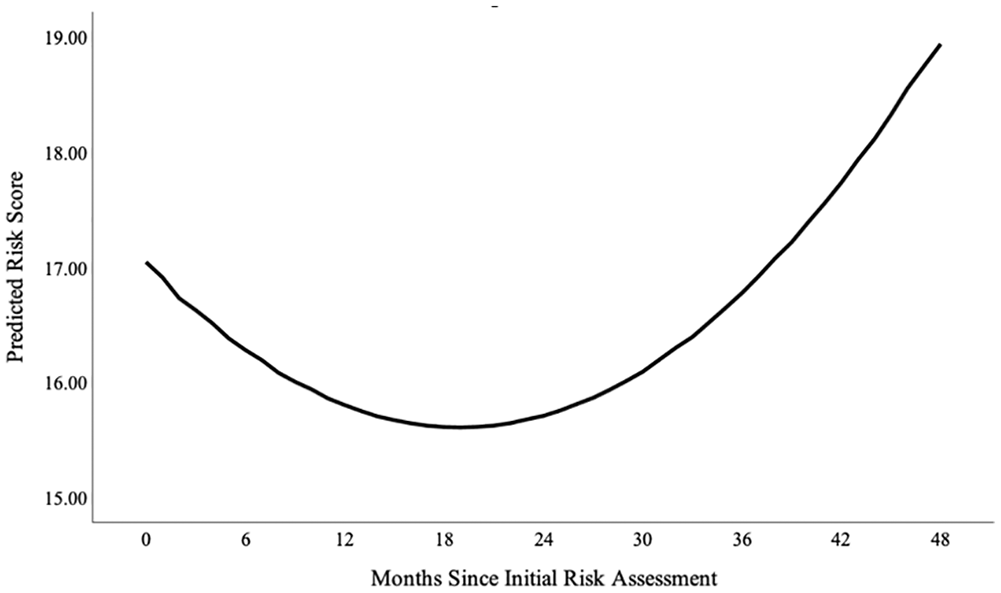
Predicted Criminogenic Risk Score Trajectory of Justice-Involved Youth (N = 611)
Model III: Comparison by Race/Ethnicity
A growth model was performed to test the RQ2, do changes in criminogenic risk level vary systematically for youth across race/ethnicity? In line with Model II, the model included fixed and random effects for the intercept, linear change in risk score over time, and nonlinear change in risk score over time. Model III also estimated three new fixed effects, corresponding to the racial/ethnic differences in average risk score, linear changes over time, and nonlinear changes over time. Given the addition of these three new fixed effects, the upper-level R2 for Model III is .40 (see Table 3). As with Model II, model estimates corresponded to risk scores when time since the initial assessment was at its average, 13.97 months. The fixed intercept and slopes for change over time affirmed the earlier findings: At 13.97 months after the youth’s initial risk assessment, average risk score was 15.60. This score was predicted to decrease by .05 points as time increased by 1 month, and the increments of change were predicted to plateau. The significant random effects indicated variance in the average risk score and risk trajectory among justice-involved youth.
Fixed and Random Effects Modeling the Linear and Nonlinear Relationship Trajectory of Criminogenic Risk Score Over Time for Justice-Involved Youth Across Race/Ethnicity

p < .05.
In addition, Model III yielded both a significant main effect and interaction effect between the linear rate of change and Black youth. The positive main effect indicated that, at 13.97 months since their first risk assessment, the predicted risk scores for Black youth significantly exceeded the predicted risk scores for the sample at large. Similarly, the interaction indicated that the linear rate of change for Black youth significantly differed from the linear rate of change for the sample at large (see Figure 2). Model III also yielded a significant main effect and interaction effects between the linear and nonlinear rate of change and White youth. The negative main effect indicated that, at 13.97 months since their first risk assessment, predicted risk scores for White youth were significantly lower than the predicted risk scores for the sample at large. The interactions indicated that the linear and nonlinear risk score trajectory for White youth significantly differed from the sample at large (see Figure 2).

Predicted Criminogenic Risk Score Trajectory of Justice-Involved Youth by Race/Ethnicity (N = 611)
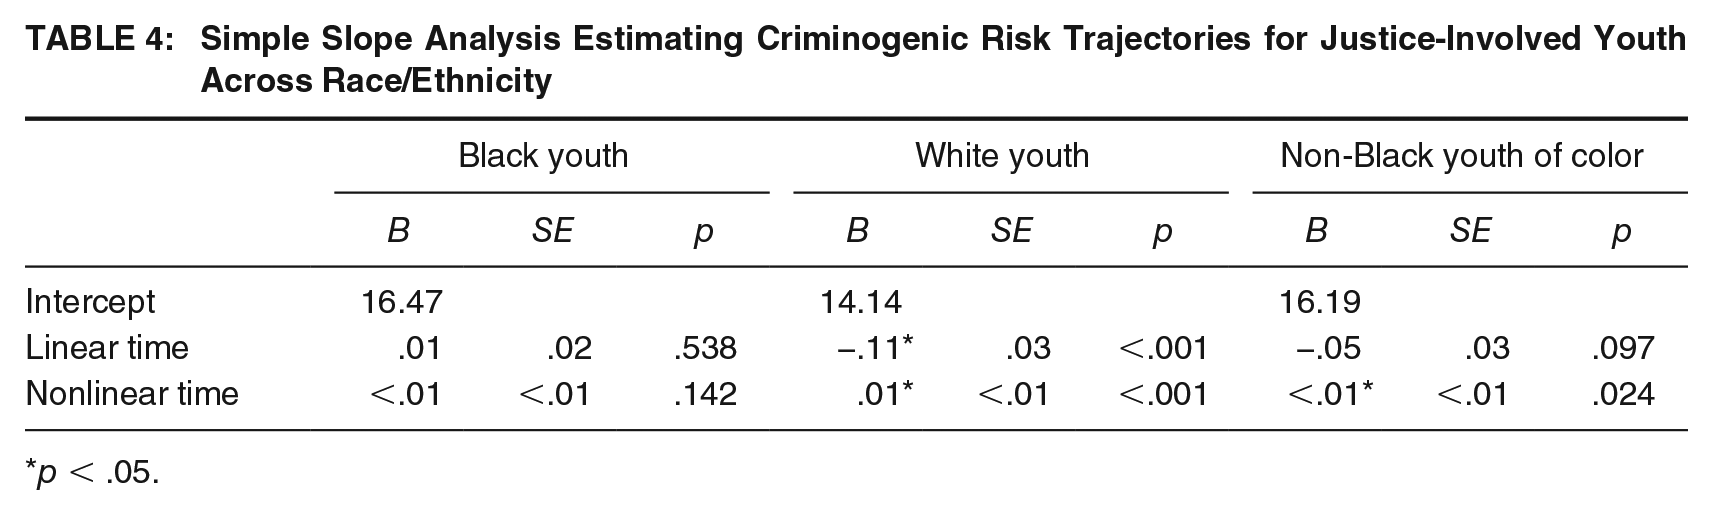
Simple Slope Analysis
A simple slope analysis was conducted to investigate the significant interactions detected in Model III (see Table 4). Results indicated that after 13.97 months since their initial risk assessment, the linear and nonlinear rates of change for Black youth were not significant. This deviates from the trajectory estimated the sample at large, whose risk scores significantly receded over the first 13.97 months. In contrast, 13.97 months after their first risk assessment, risk scores of White youth decreased by .11 points as time increased by 1 month. This estimate suggests that risk scores decreased more substantially over time for White youth. Similarly, the nonlinear estimate for change over time for White youth significantly exceeded the sample estimate, indicating that criminogenic risk score trajectories among White youth plateaued to a lesser degree.
Simple Slope Analysis Estimating Criminogenic Risk Trajectories for Justice-Involved Youth Across Race/Ethnicity
p < .05.
Racial/Ethnic Trajectories by Risk Domain
A series of follow-up analyses were conducted to determine whether the observed disparate racial/ethnic trajectories were concentrated in one area or spread across the domains of the YLS/CMI. Fixed and random effects for the follow-up analyses were consistent with those estimated by Model III. Model outcomes indicated changes in the eight criminogenic risk domains of the YLS/CMI: Prior Dispositions & Offenses, Education, Leisure & Recreation, Attitudes & Orientation, Personality & Behavior, Peer Relations, Substance Abuse, and Family & Parenting (see Figure 3). Estimates yielded by the follow-up analyses can be accessed via Supplemental Appendix (available in the online version of this article).
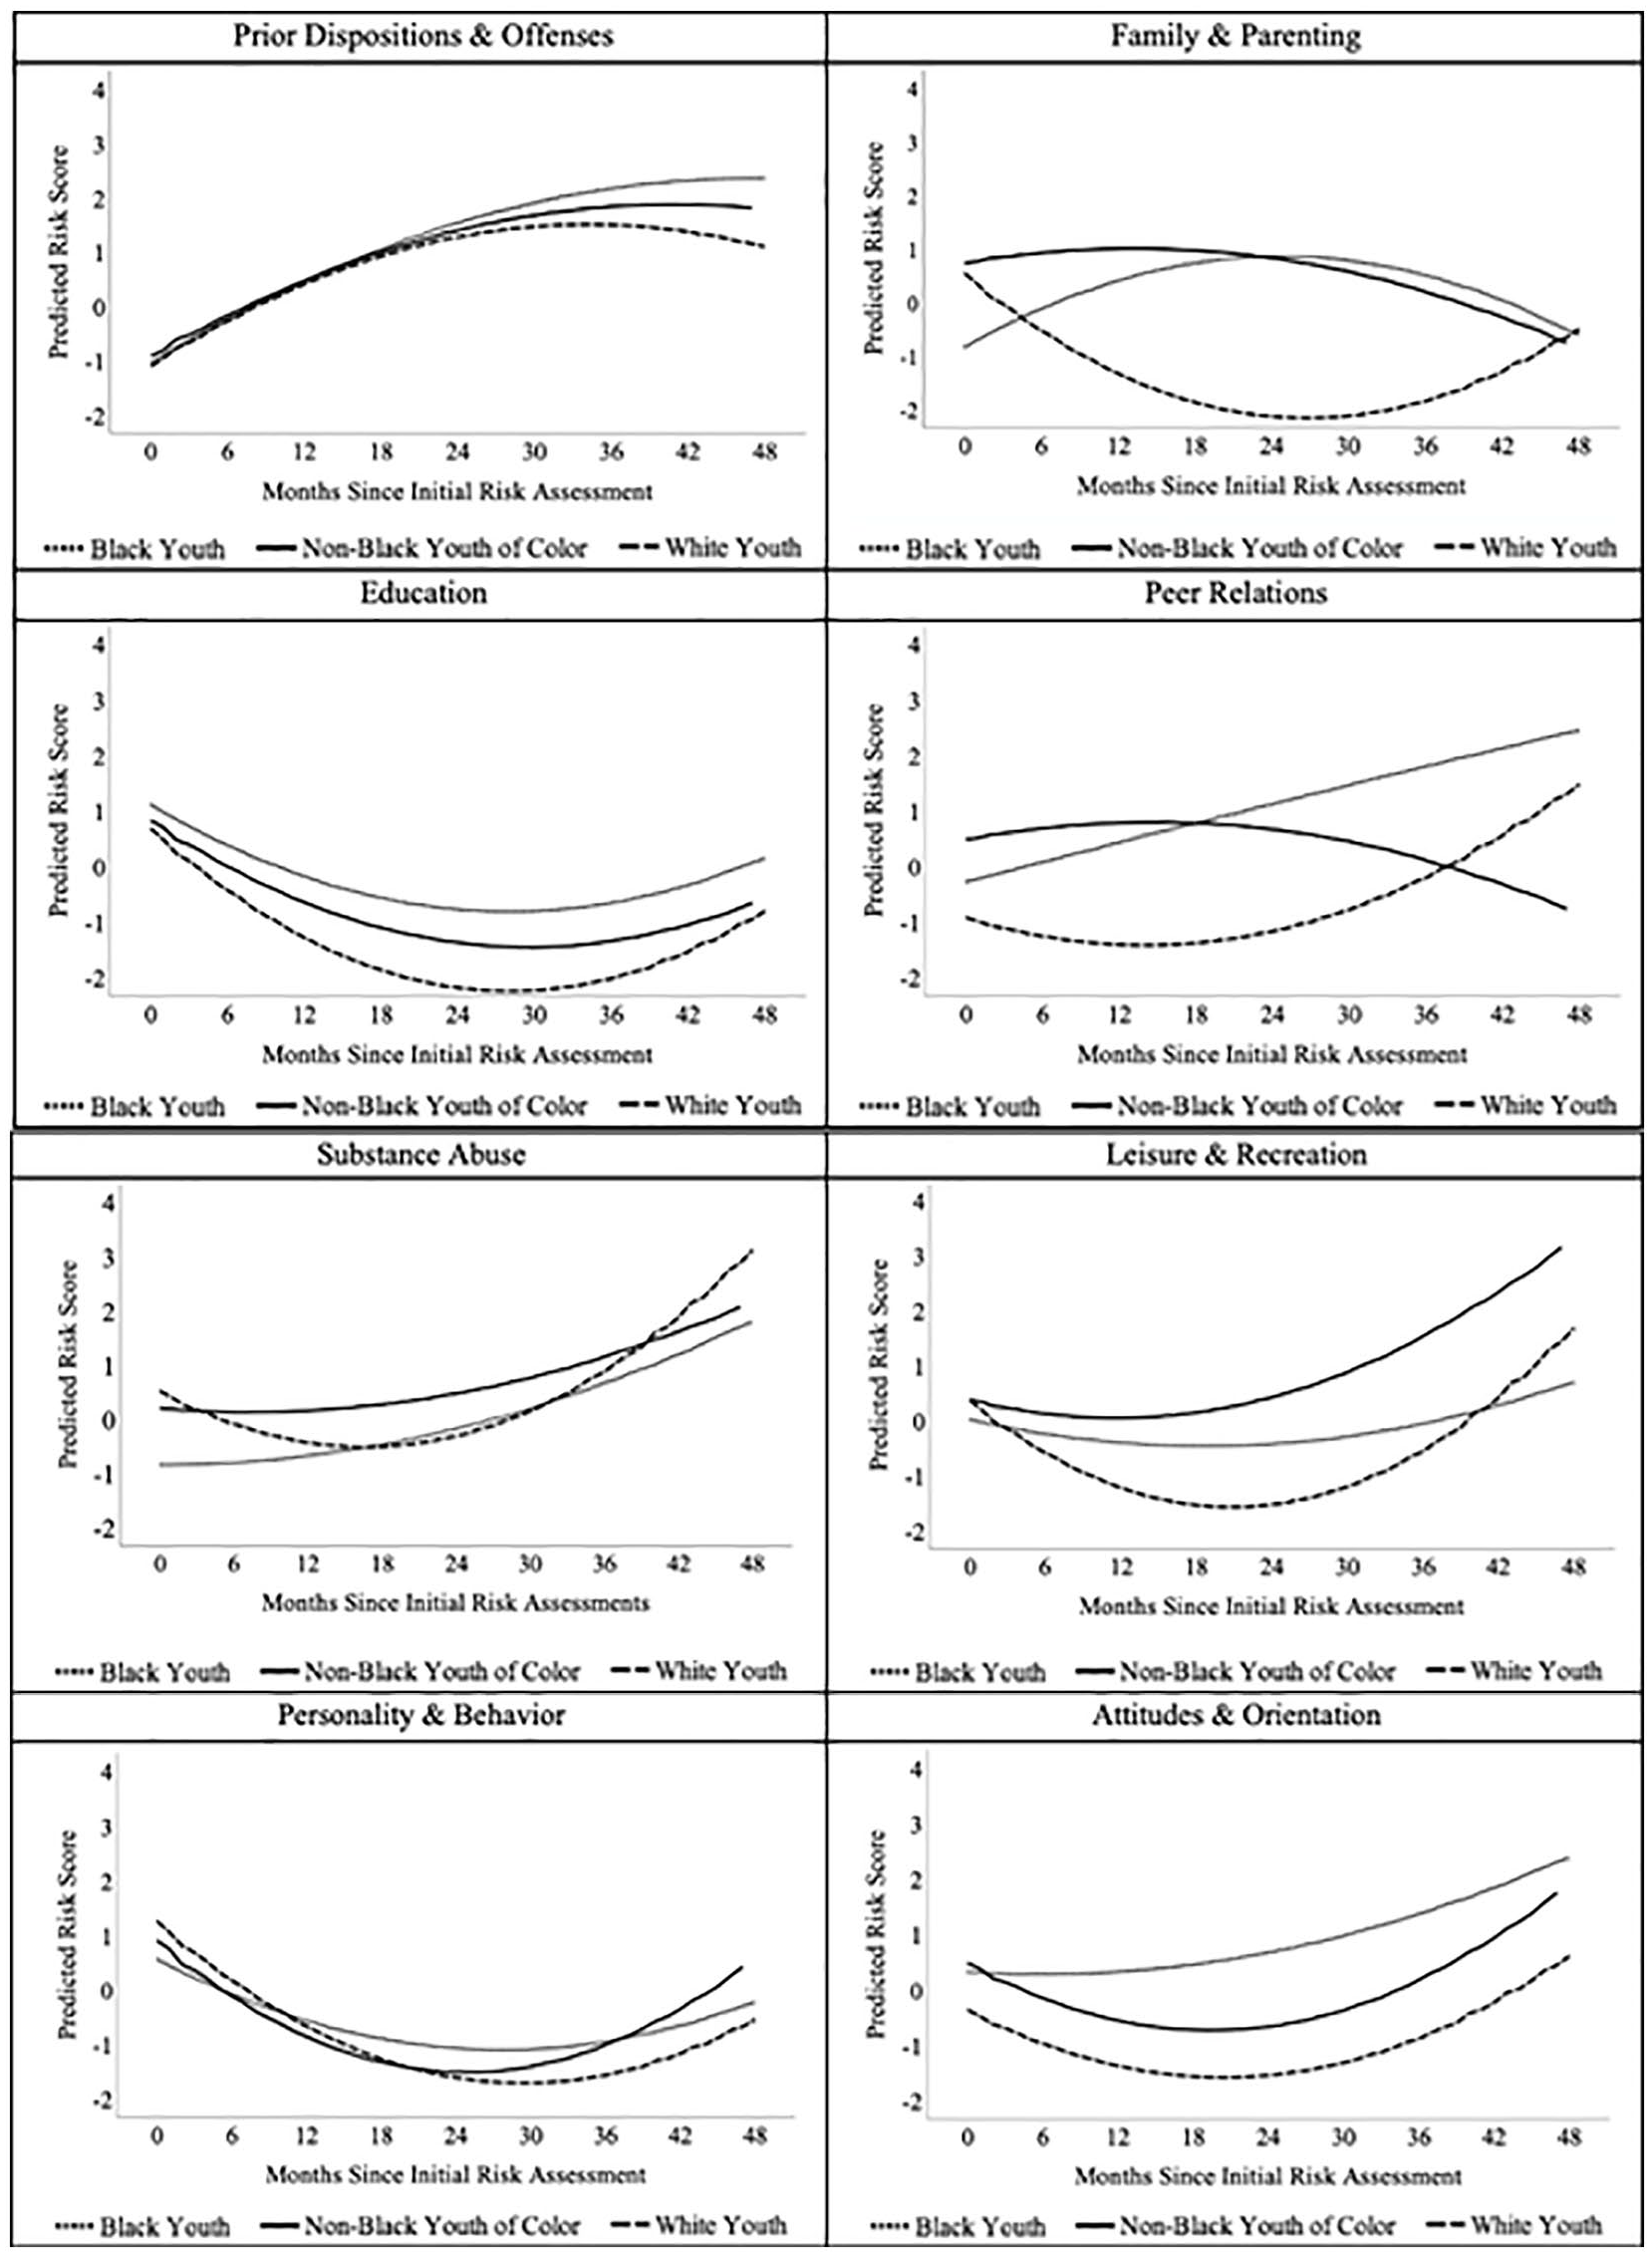
Predicted Criminogenic Risk Score Trajectory of Justice-Involved Youth by Race/Ethnicity Across YLS/CMI Domains (N = 611)
Only the Prior Dispositions & Offenses domain yielded no significant main effects or interactions relative to race/ethnicity. This suggests that the predicted change over time in the Prior Dispositions & Offenses domain is consistent for all justice-involved youth. Analyses from the other seven domains generally affirmed the patterns observed in Model III: In a plurality of areas, scores were significantly elevated for Black youth (Education, Peer Relations, Attitudes & Orientation) and lower for White youth (Family & Parenting, Education, Peer Relations, Leisure & Recreation, Attitudes & Orientation). Departing from the estimates generated by Model III, scores for non-Black youth of color were significantly elevated from the grand mean in the Peer Relations, Substance Abuse, and Leisure & Recreation domains.
Multiple significant interaction effects clarified the findings from Model III. In five domains (Family & Parenting, Education, Substance Abuse, Leisure & Recreation, Personality & Behavior), scores for White youth decreased more rapidly than the trajectory estimated for sample at large. In contrast, risk scores for Black youth increased over time (Family & Parenting, Peer Relations, Substance Abuse), stagnated (Attitudes & Orientation), or decreased less substantially (Personality & Behavior) relative to the sample at large. The trajectories for non-Black youth of color generally did not deviate from the sample estimates; however, in the Leisure & Recreation domain, their scores stagnated while the sample’s scores marginally decreased over time. In sum, a plurality of dynamic risk domains contributed to the racial/ethnic differences observed in the criminogenic trajectories estimated by Model III. Criminogenic risk in White youth appeared to be most amenable to reduction over time when compared with Black youth and non-Black youth of color. Conversely, criminogenic risk scores for Black youth appeared to be least amenable to reduction over time.
Discussion
Juvenile risk assessments are increasingly popular tools as juvenile courts move toward evidence-based practice (JJGPPS, 2020). However, given the dynamic nature of adolescence, it is critical to understand how risk changes after a juvenile are adjudicated. The results of the present study suggest that declines over the first 19 months after initial assessment, only to rebound in the subsequent years (months 19–48). Furthermore, risk trajectories differ from average for both Black youth and White youth, and these differences cannot be attributed to variation in Prior Dispositions & Offenses domain scores.
Changes in Criminogenic Risk Over Time
In the present study, criminogenic risk levels were dynamic over 48 months following initial assessment. This finding is consistent with the dynamic change hypothesis (Olver et al., 2007), which suggests that risk itself is dynamic and multiple assessments of risk are necessary to accurately predict reoffending. Our results expand on previous work examining change in youth risk scores over time (for example, by Viljoen and colleagues, 2017) by extending our assessment over course of several years, rather than a single year. Indeed, we found that risk scores decreased for the first 19 months, at a rate that plateaued with each progressive month. Between months 19 and 48, risk scores increased at an increasing rapid rate until risk scores were higher at 48 months than at initial assessment.
It is important to consider the probable impact of survival effects in the risk score trajectory depicted in Figure 1. All youth in the sample remained under court supervision for at least 12 months, during which predicted risk scores decreased by approximately one point. After 12 months, time under court supervision varied, with risk assessment re-administration ending at the point of court dismissal. In concurrence with a Risk–Needs–Responsivity framework, youth who exhibit low to moderate cumulative levels of risk should be dismissed after briefer periods of court supervision, relative to youth who exhibit high levels of risk (Brogan et al., 2015). Therefore, as the time since initial risk assessment increases beyond 12 months, the plateau and subsequent increase in predicted risk scores likely reflect the higher risk youth who remained under court supervision for longer periods of time. If all the youth in the sample were observed over the full 48-month window, we speculate that predicted criminogenic risk scores would continue to decrease beyond 19 months, given that most youth age out of delinquency as they enter adulthood (Farrington, 1986).
Given the likely impact of a survival effect, we focus our discussion on the risk score trajectory observed within the first 13.97 months since initial risk assessment, the point at which Model I’s fixed effects are estimated. Model I indicates that the predicted initial risk score is 17.05, which falls squarely within the YLS/CMI’s classification for moderate risk. Over the course of 13.97 months, predicted risk scores decrease to 15.70, with the greatest decrease occurring in the time most proximal to initial risk assessment. It is possible that this decrease represents actual reduction in youth criminogenic risk level caused by effective and prompt court-sanctioned intervention, immediate changes in youth environment, or normative developmental maturation processes. Alternatively, the decrease could represent changes in courts’ perception of youth over time (Shook & Sarri, 2007): initial risk scores represent courts’ first impressions of justice-involved youth and may be scored more conservatively. As case managers become more familiar with youth and their circumstances, they may rescore previously indicated risk factors as noncriminogenic.
Findings from Model I are consistent with previous research on other justice-involved populations: On average, dynamic risk decreases gradually over time (Wanamaker & Brown, 2021). However, the significant random effects in Model I indicate that the rate of change varies appreciably between justice-involved youth. Certain characteristics may be associated with rate of change. We investigated systematic variation in risk score trajectory by race/ethnicity; however, other characteristics (i.e., demographics, offense type, initial risk level classification) may also inform risk score trajectories. Future research may benefit from identifying other facilitators and inhibitors to risk score reduction.
We exercise caution in interpreting the results beyond 13.97 months, given the likelihood of a confounding survival effect. With this in mind, the observed rebound in risk score could also reflect diminishing returns on probationary interventions for youth beyond 19 months. Past research indicates that juvenile justice system contact itself may be criminogenic; adverse effects appear to be especially acute for youth who undergo restrictive forms of court supervision (Cécile & Born, 2009). Additional testing is necessary to clarify the risk score trajectories of youth who enter court supervision at high risk and remain under court supervision for beyond a year and a half.
Changes in Criminogenic Risk by Race
Results from Models II and III indicate that criminogenic risk follows different patterns of change over time for youth by race/ethnicity. Specifically, risk levels of White youth dropped steeply over the first year after initial risk assessment, only to rise again steeply between months 24 and 48 after initial risk assessment. Non-Black youth of color experienced a similar, but less substantial, decrease and rebound in risk scores over time. Finally, risk levels of Black youth remained stable over the first year and rose less steeply than others between months 24 and 48. Thus, viewing risk assessment tools as a panacea to racial/ethnic inequality in the juvenile justice system obscures the reality that the risk score trajectories differ across race/ethnicity.
These findings are compatible with our hypothesis that juvenile risk assessments indirectly measure the effects of structural racism. Criminogenic risk scores of White youth were most amenable to reduction in the months immediately following entry to court supervision. We speculate that criminogenic risk in White youth is less entrenched with population-level inequities tied to race/ethnicity, such as poverty, residential segregation, and access to high-quality education (Bailey et al., 2017; Bonilla-Silva, 1997; Jones, 2000; Powell, 2007). White youth may experience the greatest gains in risk reduction court-sanctioned intervention, which often aspires to reduce risk through individual behavioral change (e.g., via cognitive-behavioral therapy, involvement in prosocial activities; Schwalbe, 2012). Relatedly, it is possible that court-sanctioned interventions are better attuned to individual and environmental predictors of reoffending for White youth.
However, our results indicate that criminogenic risk scores of justice-involved non-Black youth of color and Black youth decreased less substantially and did not change, respectively. Given these results, we speculate risk scores for youth of color reflect population-level inequities created and sustained by structural racism (Bailey et al., 2017; Bonilla-Silva, 1997; Jones, 2000; Powell, 2007). Court-sanctioned interventions may lack culturally appropriate adaptations, further inhibiting expedient risk score reduction (Vergara et al., 2016). Importantly, the risk scores for non-Black youth of color decreased measurably over the first 13.97 months of court supervision. Based on these results, we posit that, while the detriments of structural racism and/or treatment misalignment are far-reaching for all youth of color, the harms incurred may be most acute for Black youth (Liberman & Fontaine, 2015).
Finally, it is important to note how evaluator bias may have affected our results. The use of actuarial juvenile risk assessment is designed to reduce interpersonal bias by premising risk scores on a consistent set of concretely defined risk factors (Love & Morris, 2019). However, some opportunity for discretion in scoring persists; for example, youth may provide curt or partial responses to risk assessment prompts, or their self-report may contradict other relevant sources of data (e.g., school attendance records). It is possible that court practitioners are more likely to give White youth the benefit of the doubt while evaluating youth of color more conservatively. Furthermore, it is possible that racial stereotyping predisposes court practitioners to be more attuned to risk reduction in White youth, and less sensitive to parallel progress in youth of color.
Racial/Ethnic Variation Across Risk Domains
To contextualize the results of Model II, we examined how risk scores changed over time across the eight domains of the YLS/CMI. Results indicate that risk factors in the Prior Offenses & Dispositions domain (e.g., prior probation, prior custody, three or more prior convictions) were accumulated at the same rate for all youth in the sample, regardless of race/ethnicity (see Figure 3). These results countered our expectations; given past evidence of racial discrimination in policing practices and juvenile court decision-making, we anticipated that youth of color would accrue risk factors related to Prior Offenses & Dispositions more rapidly than White youth.
All other domain score trajectories witnessed significant racial/ethnic variation; ergo, the racial/ethnic differences observed in Model II are not concentrated in a single area, but rather distributed across seven domains: Family & Parenting, Education, Peer Relations, Substance Abuse, Leisure & Recreation, Personality & Behavior, and Attitudes & Orientation (see Figure 3). Peer Relations yielded the greatest relative degree of variation by race/ethnicity, followed by Leisure & Recreation and Substance Abuse. Although these three domains are measured discreetly on the YLS/CMI, adolescent leisure time management and substance use are both tied to peer relationships (J. A. Andrews et al., 2002; Zeijl et al., 2000). These findings highlight the importance of addressing structural factors that contribute to peer-related criminogenic risk in communities of color (e.g., lack of funding for youth recreational activities). In addition, we speculate that courts may glean the greatest benefits from implementing culturally responsive programs which foster prosocial peer relationships.
Strengths and Limitations
The results of the present study are supported by several methodological strengths. First, the study is highly ecologically valid: We use actual risk assessment scores conducted by trained case managers in the field. To our knowledge, no other study has analyzed changes in real-world juvenile risk assessment score data spanning such a long period of time. The data also allowed us to disentangle race/ethnicity and risk domain to better understand potential facilitators and inhibitors to expedient risk score reduction.
Despite these strengths, the generalizability of the study is limited in that the data represent a single court jurisdiction. Although the YLS/CMI is a widely used risk assessment tool, and our sample was racially/ethnically diverse, it is important to replicate these findings in geographically diverse locations. In addition, we could not identify the race/ethnicity of the juvenile court officer (JCO) who conducted the risk assessment, which limited our ability to test for interactions between youth race/ethnicity and JCO race/ethnicity as related to changes in risk over time. Finally, we were not able to examine the risk trajectories of Asian American and Pacific Islander, indigenous, Hispanic/Latinx, or Multi-Racial youth, all of whom are understudied in juvenile justice research.
Implications and Conclusions
Many adjudicated youth in the United States are under court supervision for a prolonged period (Mendel, 2018). To ensure that they are rehabilitated, we must understand how juvenile criminogenic risk scores change over the course of court supervision. The results of the present study are clear: (a) predicted criminogenic risk scores are dynamic, such that scores decline for the first year and a half, then rebound in the subsequent years; and (b) risk score trajectories vary by race/ethnicity. Our study advances the extant literature on juvenile risk assessment, fairness, and racial justice. Past research suggests that some risk factors may serve as proxy indicators for racism, rendering youth of color more likely to be assessed as high risk (Love & Morris, 2019). We find that risk scores assigned to youth of color are also less amenable to reduction over time, which may be used to justify longer periods of court supervision. It is critical that both researchers and practitioners understand how structural racism interacts with juvenile risk assessment and implement interventions that target the sources of structural inequities (Campbell et al., 2018; Piquero, 2008).
We do not dispute the substantial evidence base that supports juvenile risk assessment utilization (National Research Council [NAS], 2013; Olver et al., 2009; Vincent et al., 2016). Rather, we encourage researchers, practitioners, and policymakers to examine and address how structural racism may affect juvenile risk assessment scores. Recommended steps include omitting risk factors that hold minimal predictive validity with recidivism, tailoring risk level classification cut off points to local patterns of reoffending, and continuous monitoring of risk assessment performance for racial/ethnic subgroups (St John et al., 2020). Rehabilitation for adjudicated youth is only possible to the extent that our tools for effecting and measuring rehabilitation are accurate for all youth.
Supplemental Material
sj-docx-1-cjb-10.1177_00938548221098985 – Supplemental material for Criminogenic Risk Score Trajectories of Justice-Involved Youth: An Investigation Across Race/Ethnicity
Supplemental material, sj-docx-1-cjb-10.1177_00938548221098985 for Criminogenic Risk Score Trajectories of Justice-Involved Youth: An Investigation Across Race/Ethnicity by Mary K. Kitzmiller, Jennifer K. Paruk and Caitlin Cavanagh in Criminal Justice and Behavior
Footnotes

References
Supplementary Material
Please find the following supplemental material available below.
For Open Access articles published under a Creative Commons License, all supplemental material carries the same license as the article it is associated with.
For non-Open Access articles published, all supplemental material carries a non-exclusive license, and permission requests for re-use of supplemental material or any part of supplemental material shall be sent directly to the copyright owner as specified in the copyright notice associated with the article.
