
Abstract
Programs aiming to ease the transition from military to civilian life have increasingly focused on specific occupation areas where veteran skills might overlap with civilian job requirements. This research uses the American Community Survey to examine the occupations and industries that veterans tend to work in as well as how veteran incomes compare to similar nonveterans in each area. Results show that veterans tend to seek civilian occupations where military experience is likely to apply, as areas of veteran overrepresentation echo technical military functions. Furthermore, veterans generally tend to earn higher incomes than similar nonveterans in these areas of potential military–civilian overlap, but most income differences are relatively moderate. The results imply that programs encouraging transitioning military members to find a civilian occupation that is similar to their military experience may better assist those in military occupations with clear civilian applications.
In the past several years in the United States, there has been a renewed societal focus on programs that help veterans transition to civilian life. Because the challenge of beginning a new career is among the most pressing obstacles facing new veterans, many private entities have committed to helping veterans in this area (Hall, Harrell, Bicksler, Stewart, & Fisher, 2014). Improving the existing body of veteran transition programs has also been a public policy priority, as evidenced by the Veteran Employment Initiative, established by executive order in 2009 (Executive Order No. 13518, 2009), and the VOW (Veterans Opportunitiy to Work) to Hire Heroes Act, signed into law in 2011 (U.S. Department of Veterans Affairs, 2014).
Veterans in the United States have a volume of programs available to help them succeed after they transition out of military service. The United States has a long tradition of offering education benefits to veterans, and newer initiatives designed to boost veteran labor market outcomes include tax incentives for employers to hire veterans, individualized career counseling, and efforts to improve employer recognition of military training and experience (Executive Office of the President, 2013; U.S. Department of Veterans Affairs, 2014). In pushing to reform these programs, policy makers recognize several realities. First, veteran reintegration policies in the United States are motivated by gratitude toward veterans for volunteering to serve (The White House, 2011). Second, veterans with poor mental health are at a high risk of social exclusion (Iversen et al., 2005) and successfully reintegrating them into society could mitigate some of the negative consequences of combat stress (MacLean & Elder, 2007). Third, the socioeconomic success of today’s veterans could very well influence future enlistment decisions, so it is in the interest of the military services to avoid a widespread perception that volunteering to serve in the military has long-term negative consequences for health and wealth.
Despite the programs available to them, transitioning veterans report that a chief concern is determining how to translate their military skills to civilian employment (Prudential, 2012). Improving skills recognition in the civilian sector has also been central to recent policy initiatives (Executive Office of the President, 2013). This study will contribute to the body of knowledge about veteran socioeconomic outcomes by examining veteran occupation and industry choices and veteran incomes for indicators of military skills that translate to civilian employment.
Prior Research
Any study of the life course of U.S. veterans following their military service has an extensive body of research upon which to draw. In fact, there has been significantly more work on U.S. veterans than veterans of partner nations who have served alongside their U.S. counterparts (Iversen et al., 2005). Much work to date, spanning multiple eras, examine the impact of military service on socioeconomic outcomes, health (both physical and psychological), marital outcomes, and subsequent crime incidence in the veteran population (MacLean & Elder, 2007).
Even with the large body of information available, the impact of military service on veterans’ lives is difficult to identify in the midst of the wide variation in veteran experiences. In the United States, all former military members who honorably complete a term of service are considered veterans, regardless of whether they served during wartime or faced combat (Dandeker, Wessely, Iversen, & Ross, 2006). This definition could be too broad, since veteran experiences and their potential need for transition assistance likely vary depending on service, whether they were active or reserve, whether they served in combat, and the time period in which they served. Furthermore, the skills demanded in the military as well as the skills demanded outside the military are constantly in flux, adding to the challenge of determining whether veterans face unique difficulties in transitioning to civilian employment.
In theory, there are a number of advantages that veterans have over similarly situated nonveterans in the labor market. Veterans have access to military training and work experience, some of which should theoretically be valuable in the civilian sector (Goldberg & Warner, 1987; Mangum & Ball, 1987). In the United States, most veterans have had access to education benefits, which have raised the overall level of human capital stock in the veteran population in every generation since World War II (Maclean & Elder, 2007). With the all-volunteer force in the UnitedStates, the military chooses higher ability applicants based on their education level and performance on a battery of tests, so the same preservice characteristics that helped them get into the military in the first place (or even motivated them to join) could lead to relatively good labor market outcomes independent of any impact military service had on them (Loughran, 2014). Public policies in place have also attempted to boost the demand for veteran labor through Federal hiring preferences and private employer tax credits (U.S. Department of Veterans Affairs, 2014). And finally, there are various transition programs that provide services to veterans, such as customized career counseling, that could potentially reduce the search costs of finding a job.
Still, there are several aspects of military service that are known to negatively affect a subset of the veteran population. The foremost of these aspects is exposure to combat, and there is a robust literature on the potential effects of combat trauma (i.e. post-traumatic stress disorder) on veterans’ ability to function in society (Iversen et al., 2005; Maclean & Elder, 2007). Additionally, other chronic conditions may limit veterans, as many veterans have service-connected disabilities that could relate to underemployment or earnings disadvantages (Fulton, Belote, Brooks, & Coppola, 2009; Prokos & Cabage, 2015). In sum, the U.S. policy debate concerning the well-being of recent veterans does not always appreciate the heterogeneity in the veteran population and the presence of unique and disadvantaged subpopulations.
Many studies provide a picture of how veterans have fared in the labor market recently. Regarding employment, aggregate statistics show that older veterans have a lower unemployment rate than nonveterans, but recent veterans (defined as veterans who served at any time after September 2001) have an elevated unemployment rate (Collins et al., 2014). Additionally, the unemployment rate for younger veterans appears particularly high (Loughran, 2014). As described above, however, veterans and nonveterans are very different populations, and so researchers must, at a minimum, account for basic demographic differences between the groups. Regression-adjusted differences in unemployment rates have generally favored nonveterans since 2000, with a particularly pronounced unemployment spike for recent veterans in 2011 (Faberman & Foster, 2013; Loughran, 2014). The recent veteran unemployment rate improved in 2012, with some research even finding higher full-time employment rates in the recent veteran population (Heaton & Krull, 2012), but significant employment gaps remained among younger veterans (Loughran, 2014).
This study focuses on two additional dimensions of the veteran situation in the labor force: (1) the occupation and industry in which they work and (2) the relative earnings within their area of employment. Veterans have been known to congregate in the public administration sector as well as in protective service occupations (Bureau of Labor Statistics, 2015; Walker, 2010). These patterns suggest a link between veteran military experiences and their post-military occupations. These present analyses will go a step deeper to examine whether particular occupation and industry codes align with functions that exist within the military. In addition to these areas, recent policy efforts have focused specifically on manufacturing, information technology, transportation and logistics, health care, and emergency medical services as potential areas where veteran skills should apply to civilian employment (Executive Office of the President, 2013).
With respect to veteran versus nonveteran earnings comparisons, research on Vietnam-era veterans initially indicated that veterans earned less than comparable nonveterans, but the plight of veterans later improved (Berger & Hirsch, 1983). Still, evidence from the draft lottery suggests that Vietnam-era veterans suffered an earnings penalty compared to nonveterans (Angrist, 1990). By contrast, most recent studies have found that veterans earn more compared to demographically similar nonveterans, though this relationship depends on the age-group and era of service that the study examines (Black, Hasan, Krishnamurty, & Lane, 2008; Fulton et al., 2009; Humensky, Jordan, Stroupe, & Hynes, 2013; Kleykamp, 2013).
Finally, the intersection of veteran occupations and veteran earnings is at the heart of the present study. Veterans working in areas of functional overlap with the military may be expected to earn more, because any training or work experience they received in the military is more likely to translate to their civilian job (Goldberg & Warner, 1987; Kleykamp, 2007; Mangum & Ball, 1987). Veteran employment programs also tend to assume that all veterans have valuable nontechnical skills (such as leadership and teamwork), and qualitative responses suggest that some employers recognize and value these skills as well (Hall et al., 2014). Still, research has yet to measure the relative value of these skills and determine how they relate to veteran socioeconomic outcomes.
In synthesizing this prior work, this study begins with two general hypotheses. First, veterans should tend to be clustered in occupations and industries that overlap with military functions. Second, veterans working in these occupational sectors will tend to earn higher incomes, relative to nonveterans, than veterans working in sectors that do not overlap with military functions.
Data
The data for this analysis come from the 2013 American Community Survey (ACS). The ACS is a nationally representative survey of households in the United States, consisting of detailed information about respondent demographics, including veteran status, and rich information about employment (Ruggles et al., 2010). The ACS contains many occupation and industry variables, so this study combines similar occupations and industries into categories based on the 2010 census classification scheme. Occupation and industry are distinct variables in the census scheme—occupation refers to a worker’s specific technical function, while industry denotes the work setting and economic sector. In practice, however, they cannot be analyzed simultaneously as different components, because some occupations and industries have near perfect overlap in the data (e.g., health-care practitioners rarely operate outside of the health-care and social assistance industry). Thus, this research performs separate analyses by occupation and industry, as both variables contain useful information on veterans’ positions in the labor force. To provide the most precise information possible, this analysis utilizes a total of 22 occupation groups and 19 industry groups, while at times using the actual census occupation or industry codes for more specific information.
The ACS also contains variables that categorize veterans based on when they served in the military. Because researchers often focus on recent veterans, this analysis will report results separately for “pre-2001” veterans (veterans who exited the military before 2001) and “post-2001” veterans (veterans who served in the year 2001 or later) where appropriate. The sample includes only full-time employed veterans and nonveterans, ages 18–65. The final data set for the subsequent analysis contains a total of 862,597 nonveterans, 45,621 pre-2001 veterans, and 15,289 post-2001 veterans. All of the following results apply sampling weights to permit population-level descriptive results.
Method
The quantitative methodology for this study is broken into two general parts. First, the analysis explores the occupations and industries that veterans tend to work in as a percentage of the veteran employed population and compares it to the distribution for nonveterans. In addition to the absolute difference in the percentage of each population in a given area, odds ratios are provided to measure the relative differences between the groups.
The second portion of the analysis seeks to generate occupation- and industry-specific income comparisons between veterans and nonveterans. As suggested in the literature, a potential problem for any comparison between the two groups is that they differ in many respects that relate to employment other than military service (for a discussion of selection bias in veteran socioeconomic research, see Maclean & Elder, 2007, pp. 184–185). This analysis takes an approach similar to regression adjustment with two key differences. Before running each regression, weights are applied to the nonveteran population that correct for bias from the confounding differences, based on their propensity scores (Imbens, 2004; McCaffrey, Ridgeway, & Morral, 2004; Rosenbaum & Rubin, 1983). 1 If the estimated propensity scores are correct, the weights alone are sufficient to correct the comparison in a simple weighted difference of means. The combination of the weighting technique with a regression is known as doubly robust (DR) estimation, because the estimates will be correct even if only one of the two models (the propensity score model or the regression model) is correctly specified (Bang & Robbins, 2005).
This approach involves the estimation of two models for each occupation or industry: (1) a propensity score model, predicting the probability that each observation is a veteran conditional on the other characteristics and (2) a weighted linear regression of log earnings on veteran status and the same characteristics included in the propensity score model. In the regression, nonveterans are weighted according to their propensity scores from the first model. Nonveterans with characteristics similar to the veterans will receive higher weights, so that the weighted nonveteran population is directly comparable to the veterans. In practice, small differences in the characteristics may remain after weighting, so the inclusion of the characteristics in the regression serves to adjust for the remaining differences.
This technique also differs from a standard regression adjustment approach in the interpretation of the results. Because the weights adjust the nonveterans to correct the bias, giving higher weights to nonveterans with similar characteristics to veterans, each result can be interpreted as a treatment effect on the treated. That is, each coefficient is the average difference in log income between the veteran population and a counterfactual group of nonveterans with the same characteristics as veterans. Despite the methodological language, these estimates cannot be interpreted as the causal effect of military service. Rather, the estimates are average income differences between veterans and demographically similar nonveterans.
This analysis performs separate income comparisons for each veteran group (pre- and post-2001 veterans) and each occupation or industry group, which leads to a grand total of 82 hypothesis tests. Simultaneously conducting this many statistical tests greatly increases the probability of a type I error, so the results take the additional step of restricting the false discovery rate to 5% (Benjamini & Hochberg, 1995). This procedure is similar to a Bonferroni correction in that it corrects for multiple comparisons by requiring a p value smaller than .05 for rejecting the null hypothesis. However, this procedure is less conservative than the Bonferroni correction, and thus, it does not sacrifice as much statistical power.
Finally, for ease of interpretability, results are presented in the form of percentage effects, rather than differences in log income. Transforming the coefficient of an indicator variable from a semi-log model to a percentage effect requires an additional calculation, as noted in Halvorsen and Palmquist (1980).
Results
Veteran Versus Nonveteran Occupations and Industries
Table 1 presents the top occupations or industries where veterans are overrepresented relative to nonveterans. Specifically, Table 1 includes all occupations and industries that were among the top 10 areas, either by absolute difference between the percentage of veterans and nonveterans in the area or by odds ratio. All differences in Table 1 are statistically significant, due in part to the large sample size in the ACS.
Top Occupation and Industry Groups With Veteran Overrepresentation Relative to Nonveterans.
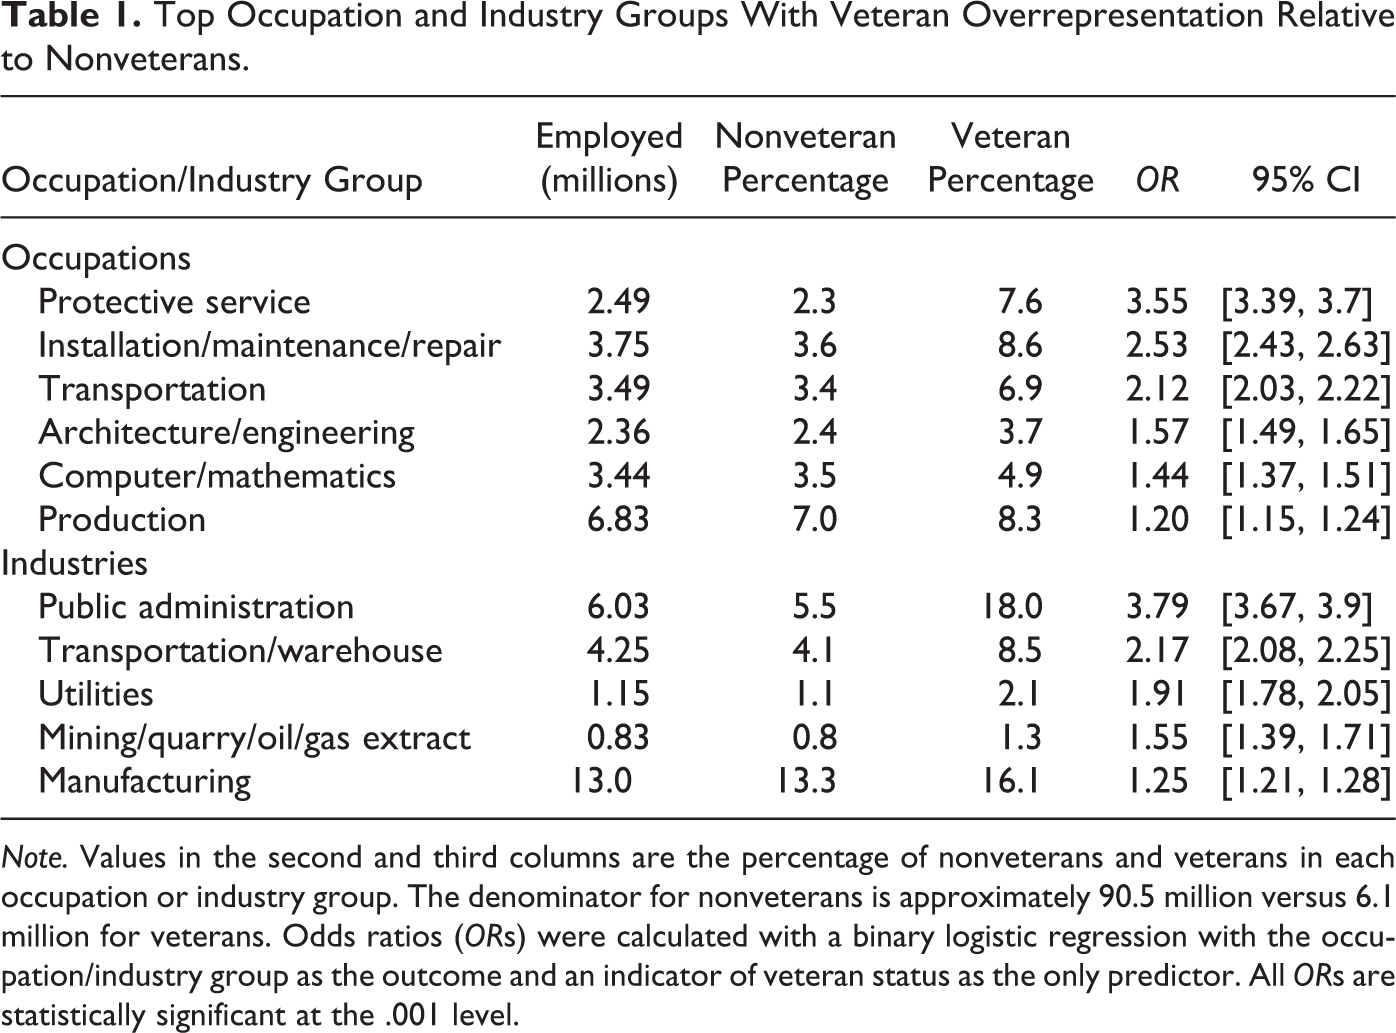
Note. Values in the second and third columns are the percentage of nonveterans and veterans in each occupation or industry group. The denominator for nonveterans is approximately 90.5 million versus 6.1 million for veterans. Odds ratios (ORs) were calculated with a binary logistic regression with the occupation/industry group as the outcome and an indicator of veteran status as the only predictor. All ORs are statistically significant at the .001 level.
The areas with the highest veteran overrepresentation echo previous findings. The protective service occupations and the public administration industry emerge as having greater than 3 times the likelihood of employing veterans. Other areas with an elevated likelihood of employing veterans correspond with areas on which policy makers have focused—namely, information technology, manufacturing, and transportation and logistics. Veterans are more likely than nonveterans to work in computer/mathematical occupations. Additionally, for both the manufacturing and transportation areas, veterans had a higher likelihood of being in both the occupation and industry that is most closely related (for manufacturing, the most closely related set of occupations is the production category).
Table 2 lists the top three subareas that have the highest concentration of veterans within each general occupation and industry category in Table 1. In many cases, these subareas align well with technical functions that the military trains its own specialists to perform. For example, highly veteran occupations tend to coincide with technical subsets of the aviation field, such as air traffic control. The subareas in Table 2 also show an elevated veteran presence in information security and power generation—fields that represent a logical path from military support functions to follow-on civilian applications. 2 The parallel between protective service occupations and military functions could be part of the same pattern, as some uniformed military members perform the specific functions of law enforcement and criminal investigation. This overlap could also reflect the applicability of more general military training and skills. Finally, Table 2 shows that the veteran overrepresentation in the public administration industry reflects a high tendency for veterans to continue to work in the national security sector.
Top Veteran Occupations and Industries in Groups With Veteran Overrepresentation Relative to Nonveterans.

To complete the picture, Table 3 shows information similar to Table 1, except that it depicts the areas with the greatest veteran underrepresentation by either the largest absolute difference in the percentages or having the smallest odds ratio (again, using the top 10 areas according to both measures as the cutoff for displaying results). Interestingly, Table 3 shows some of the areas where veterans are underrepresented also happen to be areas where military skills and training are thought to translate. For example, some military members receive technical training in legal and health-related fields, and yet, fewer veterans tend to work in these areas relative to nonveterans. The education field also emerges in both the occupation and industry dimension as having relatively fewer veterans compared to nonveterans. Education-related fields represent a fairly large subset of the nonveteran employed labor force, but veterans are less than half as likely as nonveterans to work in them.
Occupation and Industry Groups With Greatest Veteran Underrepresentation Relative to Nonveterans.

Note. Values in the second and third columns are the percentage of nonveterans and veterans in each occupation or industry group. The denominator for nonveterans is approximately 90.5 million versus 6.1 million for veterans. Odds ratios (ORs) were calculated with a binary logistic regression with the occupation/industry group as the outcome and an indicator of veteran status as the only predictor. All ORs are statistically significant at the .001 level.
Veteran Versus Nonveteran Income Comparisons by Occupation and Industry
While the previous patterns provide a useful indicator of areas where military experiences may translate to civilian employment, they are also dependent on the relative supply of veteran workers in each occupation. For example, the skills of military lawyers may translate to civilian employment, but the military may produce fewer lawyers than potential law enforcement officers or pilots. This section provides another layer of information on veterans’ position in the workforce by comparing the average incomes of veterans and demographically similar nonveterans in each occupation and industry.
Table 4 lists the DR percentage change in annual income associated with being a member of each veteran group relative to similar nonveterans for all areas where the difference is statistically significant. For each income comparison, the method adjusts the nonveterans so that they have similar distributions to veterans in terms of age, education, race/ethnicity, gender, marital status, citizenship, number of children, disability status, recent moves or recent marriages, and state of residence.
Doubly Robust Percentage Effects of Veteran Status on Annual Wage Income.
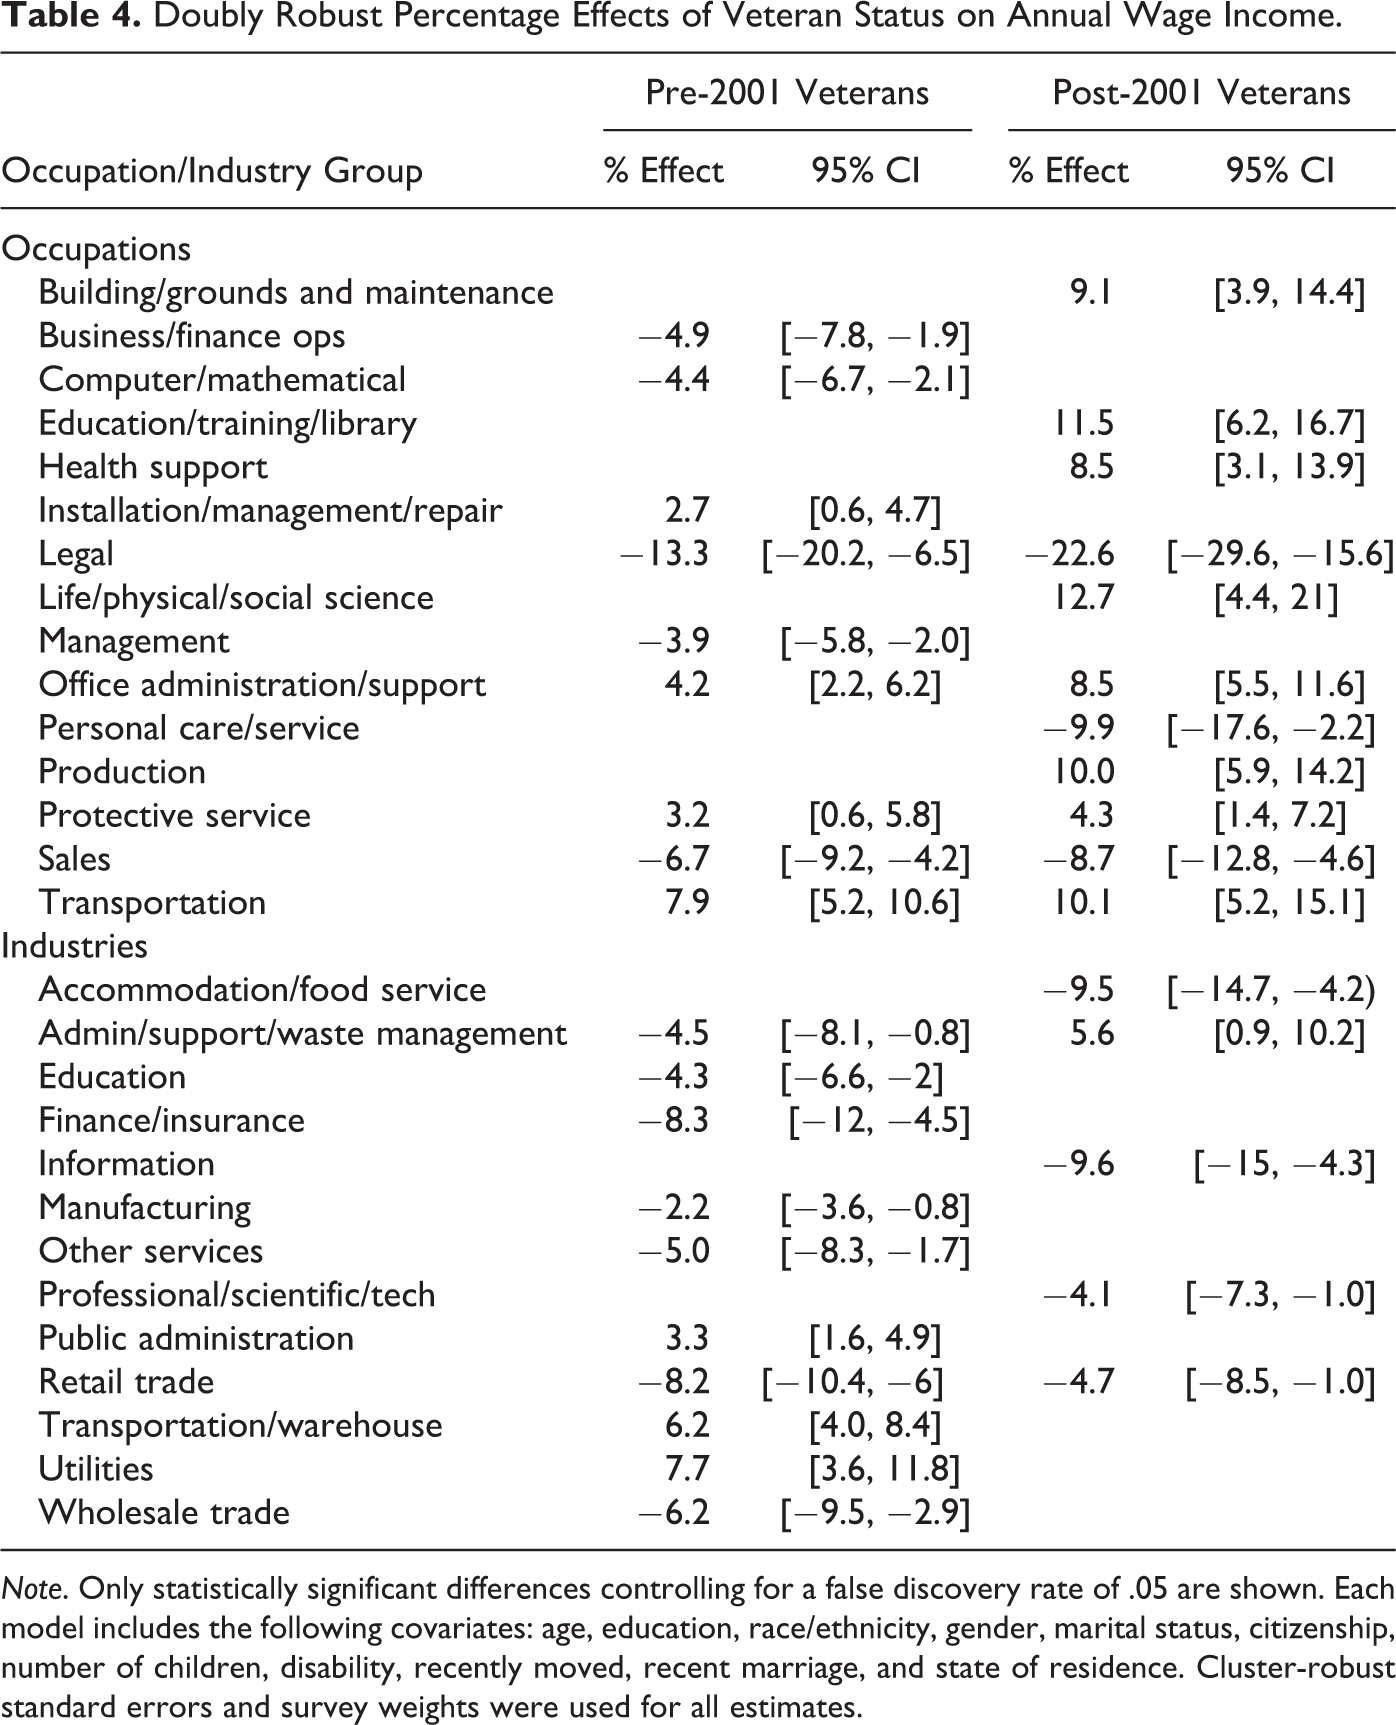
Note. Only statistically significant differences controlling for a false discovery rate of .05 are shown. Each model includes the following covariates: age, education, race/ethnicity, gender, marital status, citizenship, number of children, disability, recently moved, recent marriage, and state of residence. Cluster-robust standard errors and survey weights were used for all estimates.
Looking generally at the estimates in Table 4, there are few extreme income differences that remain after accounting for other characteristics. The one exception to this finding is in legal occupations, where veteran incomes were 13.3% and 22.6% lower relative to nonveterans for pre- and post-2001 veterans, respectively. Although the other income differences are moderate, they generally favor veterans in several areas. Veterans in fields where the military provides generalizable technical training and experience, such as protective service, maintenance, transportation, and health, enjoy a moderate income premium ranging from 2.7% to 10.1%. By contrast, veterans in fields with limited or no clear military precursor, such as sales occupations and the retail, wholesale trade, and finance/insurance industries, earned lower incomes than similar nonveterans, on average. Additionally, recent veterans show relatively high incomes in fields that may not be as intuitive, such as education/training/library occupations (11.5% higher) and life/physical/social science occupations (12.7% higher). Management occupations, an area potentially receptive to veteran general leadership abilities and “soft” skills, showed a slight income discount of 3.9% for pre-2001 veterans and no difference for recent veterans.
Despite the high concentration of veterans in the national security area within the public administration industry (where veterans often receive explicit hiring preferences and where military experience would likely be valuable), pre-2001 veterans earn only a small income premium and no income difference exists between recent veterans and similar nonveterans. Additionally, while the subareas in Table 2 indicated that veterans in architecture/engineering and computer/mathematical occupations tended to be in fields that might correlate with military functions, there is no difference in income for the former group, and pre-2001 veterans in computer/mathematical occupations earned slightly lower incomes than similar nonveterans.
Discussion
The present results show a relationship between the patterns of veteran employment and areas where military and civilian functions theoretically overlap. The implication for public policy of this finding is that programs encouraging veterans to translate their skills directly to civilian occupations are likely to be more effective for veterans with technical training in occupations that they can continue to perform in their post-military careers. The pattern also adds weight to the idea that veterans in these occupations could benefit if their training were aligned with established civilian credentialing programs wherever possible. To the degree that credentialing “red tape” causes periods of frictional unemployment, the credentialing programs could contribute to improving veteran employment, though the magnitude of such an effect cannot be determined in this cross-sectional study.
At the same time, it is clear from the results that these methods of assessing veteran positions in the labor force are potentially confounded by other forces at work. Using representation as an indicator is likely muddied by the relative supply of veterans in different occupations, whereas the occupation- and industry-specific income differences likely reflect group differences in unobservable behaviors and characteristics in addition to the potential returns of military training and experience.
These results also highlight the large role that public demand for veteran labor plays in the veteran employment picture. As private companies invest resources to identify veterans with the right skills and experiences for their requirements, an added complication lies in the fact that the veterans, themselves, may still find more employment benefits in the public sector due to the many veteran-specific benefits tied working in civil service. The large numbers of veterans remaining in public service also represent another difficulty in understanding veteran reintegration, as civilian opportunities to work in national security may draw more veterans out of the military rather than reducing existing veteran unemployment.
These limitations highlight the need for longitudinal rather than cross-sectional analysis of veteran outcomes. Longitudinal data on veterans would clarify a number of research gaps, such as whether veterans experience abnormally long spells of unemployment in their transition. Additionally, a longitudinal study that can correlate military work experience to follow-on employment would help to answer key policy questions about how to assist veterans in their transition (especially those with only general, nontechnical military skills and experiences). Such research could greatly increase the efficiency of veteran programs by identifying the characteristics of veterans who are at risk of social exclusion and targeting them before they separate from the military.
The employment picture for veterans is multidimensional and complex, as veterans are a very diverse group of people. The current “kitchen sink” approach at least ensures that veterans receive assistance in a wide variety of areas. Still, the greatest area for improvement in public policies lies in the difficult problem of helping veterans to break into industries that are further removed from their experiences, if those experiences are not easily translatable to a follow-on career.
Conclusion
In examining the employment patterns of American veterans, this study finds a tendency for veterans to work in civilian fields that align with technical military functions. In some of these areas of civilian–military overlap, veterans have relatively higher earnings than nonveterans, even after rigorously controlling for observable differences between the groups. These two realities suggest that some military skill sets may translate well to post-military civilian employment in certain areas, but further research is needed that follows military members through the course of their transition to make occupation-specific determinations about how well military skills translate to civilian careers.
Footnotes
Acknowledgment
I am grateful to Dr. Nelson Lim and Dr. Greg Ridgeway for guidance and feedback on the results of this research and Dr. Miriam Matthews for her comments and guidance in revising the manuscript. I also thank three anonymous referees for helpful comments.
Declaration of Conflicting Interests
The author declared no potential conflicts of interest with respect to the research, authorship, and/or publication of this article.
Funding
The author disclosed receipt of the following financial support for the research, authorship, and/or publication of this article: This research was supported in part by staff development funding from RAND Project Air Force and RAND National Security Research Division.