
Abstract
The primary question in this study is whether the inequality observed in rural and urban giving patterns is equitable. Practitioners and policy makers have expressed concern about equity in foundation giving, but these concerns are often conflated with equality measures. The focus of this article is to disentangle equity and equality and then propose—in the absence of equity standards in philanthropic literature—three equity standards that can be used by scholars, practitioners, and policy makers to assess the spatial distributional equity of philanthropic grant making. In an illustrative application of the equity standards to grants made in 2005 by foundations in the state of Georgia, it is determined that rural communities receive an equitable share of philanthropic grants and grant dollars in the state.
Introduction
Over the past decade, philanthropic foundations have faced an accountability environment characterized by widespread demands for equitable distribution of grants across rural and urban spatial boundaries. While such demands make for passionate discussion, the sector’s capacity to progress is hindered by an unwarranted conflation of equity, which implies a distribution that is proportionate to some objective measure such as merit or need, and equality, which refers to differential provision in an absolute sense.
There is, understandably, an unequal distribution between the number and amount of grants going to rural and urban areas. The classification of places as urban or rural reflects the complex ways that historical, social, and economic factors interact to construct enduring concentrations of population, employment, and cultural amenities in certain places over others. Because of these differences, it is not surprising that urban areas would attract a larger share of most resources.
Measures of the gap in the distribution of grants between rural and urban areas are both striking and sobering. In a 2004 study, Cohen and Barkhamer found that US$323 million of the US$30 billion in grants distributed by foundations in that year were designated for rural purposes. Other measures of the gap focus on stocks of philanthropic capacity rather than flows. The Big Sky Institute (2008) reported that the ten, primarily urban, states with the greatest level of foundation assets accounted for 67% of the US$550 billion in total national foundation assets in 2005. By comparison, the bottom 10, primarily rural, states accounted for 1.39% of total national foundation assets. Focus groups and interviews conducted by the National Committee for Responsive Philanthropy (Swierzewski, 2007) reveal that nonprofit leaders believe that urban bias is influenced by: urban problems being more visible, donors lacking knowledge of rural issues and capacities, donors living in urban areas and choosing to give where they live, and grants having matching requirements or network links that structurally favor urban-based nonprofit organizations. Nonetheless, the driving forces underlying the gaps in rural and urban giving and assets are likely complex and, as yet, not very well understood.
The problem, as it is generally argued, is not simply that some places receive more philanthropic resources or have more philanthropic assets than others but that grant distributions disproportionately and unfairly favor urban areas (Eisenberg, 2004). The canonical example of this is the critique by Senator Max Baucus (D-MT), then ranking member of the Senate Finance Committee, who in a 2006 conference speech noted that although rural areas experience higher levels of poverty than urban areas, they do not receive an equitable share of philanthropic resources. Baucus followed this critique with a challenge to foundations to double their giving over the 5 years following the conference—a challenge that has gone unfulfilled to date (Cohen, 2011). Like Baucus, others have expressed concerns about the equity of philanthropy and, likewise, call on foundations to increase their giving to rural areas (Cohen, 2011; DeMillo, 2009; Gose, 2011). As a result, the issue of rural philanthropy has gained prominence in the sector with a number of conferences and interest groups devoted to the topic (Perry, 2007).
However, the rhetoric around equity concerns is being advanced without standards or measures of the equity of rural philanthropy. As of yet, no standards or measures exist in philanthropy research to assess the equity of the geographic distribution of philanthropic resources. In the absence of standards and measures to assess geographic equity, foundations lack the ability to assess the degree of inequity, if it exists, and cannot measure progress toward addressing the equity concerns of policy makers.
To fill this gap, three measures of equity are proposed in this article to assess the equity of rural grant distribution. Each proposed standard and measure is applied to the case of Georgia philanthropy to show how it can be used in practice. The goal in doing so is to offer a simple empirical standard that can be used not only by the scholarly community but also by practitioners. The aim here is that the analytical tools developed in this article will (a) allow for a better alignment between normative ideals regarding distributional equity and empirical assessments of it, (b) contribute to the establishment of a set of standards for measuring distributional equity of grants, and (c) advance scholarly interest in the study of philanthropic ethics.
This article proceeds with a review of the relevant literature in the next section followed by a conceptual framework section where the three proposed equity standards are introduced. Afterwards, the standards are applied to the case of Georgia-based grants distributed in 2005. The article concludes with a discussion of the applicability and utility of the proposed standards for assessing the equity of grant distribution patterns.
Literature Review
This study falls at the intersection of two burgeoning research areas in philanthropic studies: philanthropic ethics and the geography of philanthropy. By introducing equity standards to assess the spatial distribution of grants, the attempt is to advance and integrate the insights of spatial modeling in the geography of philanthropy literature with the kind of inquiry that is emerging through the philanthropic ethics literature. Although the combination of spatial analysis with ethical inquiry is an innovation in the philanthropy literature, there is a rich tradition of spatial equity research in the broader geography literature that influenced the conceptual and methodological approaches in this study.
The first relevant body of literature is philanthropic ethics. The budding field of philanthropic ethics focuses on the ideals, virtues, and responsibilities of philanthropists (Illingworth, Pogge, & Wenar, 2011; Martin, 1994). Although ethics-related questions have been broached sporadically throughout the philanthropy literature, there is currently a developing attempt to organize inquiry around philanthropic ethics. Scholarship in this area provides a critical examination of the patterns and behaviors across the different expressions of philanthropy (Boris & Odendahl, 1990; Raymond, 2004). The focus is on questions regarding who should give, who should govern and control philanthropic assets, how and whether philanthropic dollars should be targeted, whether the public should promote philanthropy, and how philanthropy can contribute to a fair, just, and democratic society. In the field of fundraising, groups like the Better Business Bureau, American Association of Fundraising Counsel, and the Association of Fundraising Professionals have advanced and monitored ethical standards over time.
Rural philanthropy is only one area where foundations are being pressed to consider the equity of their grant distributions. Groups like the National Committee for Responsive Philanthropy (Jagpal, 2009) and D5 Coalition (2011) are among many asking foundations to examine the equity of their behavior in an effort to promote justice, impartiality, and fairness within foundations’ processes and in the distribution of their resources. Calls for equity span several areas of philanthropic practice, including support for disadvantaged communities, diversity, grant type and duration, reporting requirements and the proportion of assets that should be distributed and socially invested (Jagpal, 2009). However, equity standards and benchmarks being promoted by these groups provide challenging benchmarks (e.g., provide at least 50% of grant dollars to benefit lower income, communities of color, and other marginalized groups) that are thoughtfully conceived but are not empirically formulated in relation to equity theories or approaches. This study is designed to expand empirical scholarship in the philanthropic ethics literature by demonstrating how distributional equity perspectives (explained in the next section) can guide the development of benchmarks and empirical assessment of those benchmarks.
The second relevant body of literature is scholarship examining the geography of philanthropy. In the geography of philanthropy literature, Wolpert (1988, 1995, 2001a, 2001b) advanced the notion that philanthropic behavior and preferences are geographically diverse and are generated in response to the characteristics of place. Others have followed with studies of regional philanthropic capacity (Irvin, 2007) and with studies documenting the giving patterns in particular geographic regions (Hamilton & Ilchman, 1995; Havens et al., 2007). There is also a portion of this literature that focuses on spatial mapping to understand the spatial distribution of the nonprofit sector. Research studies have documented that there is greater density of nonprofit organizations in urban areas and that the location and density of nonprofit organizations can be explained by variations in physical, human, and technological resources (Bielefeld, 2000; Bielefeld, Murdoch, & Waddell, 1997; Gronbjerg & Paarlberg, 2001; Joassart-Marcelli & Wolch, 2003; Poon & Lai, 2008).
Very few studies address spatial factors that influence grant making. Those that have focused on grant making have done so in the context of corporate giving. Hurd, Mason, and Pinch (1998) mapped the spatial distribution of corporate donations through the United Kingdom. In a related article, Muller and Whiteman (2009) examined the spatial distribution of disaster response donations by corporations. Both studies find that the relationship of geography to corporate donations is closely linked to customers, markets, and marketing. Overall, the literature on the geography of philanthropy and spatial location of nonprofit organizations has not integrated value judgments regarding the equity of the distribution of philanthropic resources or nonprofit organizations.
Outside of philanthropy scholarship, in the broader geography literature, the equity of resource distribution across spatial boundaries has been both conceptually and methodologically advanced. Conceptually, the literature makes clear that spatial equity can be variously defined and measured (Hay, 1995). Truelove (1993) emphasizes that the determination of what is just or equitable is often based on underlying value systems. Spatial distributional equity has therefore been variably characterized by consideration of a range of values including measures of need, merit, access, and representation (Lucy, 1981; Talen & Anselin, 1998). Methodologically, these different characterizations of spatial distributional equity—need, merit, access, and representation—have been translated into quantitative indicators particularly in the study of the siting of facilities (Massam, 1993), transportation provision (Murray & Davis, 2001), and park locations (Talen, 1997) using social and economic data. In this literature, it is clear that measurement in relation to equity standards requires looking beyond simple spatial distribution to incorporate the choice sets, constraints, and contexts from which they arise. The present study draws on these studies of spatial distributional equity in geography to develop spatial equity standards and measures appropriate to the context of philanthropy. The advantage of building on the geography literature is that it affords the opportunity in the future to compare the equity assessments of the distributive patterns of grants with other social and public resources.
Conceptual Framework: Three Standards of Spatial Distributional Equity
To evaluate the equity of grant patterns to rural areas, a standard for understanding and measuring equity must first be determined. Equity is itself a multidimensional social objective about which many volumes have been written. Which standard(s) should be emphasized to judge the equitable spatial distribution of grants? What legitimate expectations should foundations be held to? In this section, the concept of distributional equity is reviewed along with three proposed standards of spatial distributional equity—representation, need, and merit—taken from the broader geography literature that are relevant to assessing the spatial distribution of philanthropic grants.
Distributional equity refers to the fair distribution of resources. Equity considerations focus on how society’s largesse should be divided among different groups (Nozick, 1973). It is important, for clarification purposes, to note the distinction between equity and equality. Although both concepts involve judgments about the relative shares of income, goods or services that go to various groups, an equality criterion seeks an egalitarian outcome, whereas equity is related to an outcome where different groups receive their due (Rescher, 2002). The difference reflects an appreciation for differences in capacities and needs that is considered in equity determinations but not in equality. Distributional equity, in particular, requires that shares be allocated proportionate to differences, a distinction based in the Aristotelian conception of proportionality (Rescher, 2002).
Some elaboration on the distinction between distributional equity and procedural equity may also be helpful to bring clarity to the term distributional equity. Procedural equity has to do with the processes by which social decisions are made, whereas distributional equity focuses on the outcome of that process. Procedural equity focuses on adherence to rules and the consistent application of those rules—be they formal, informal, implicit, or explicit (Cook & Hegtvedt, 1983). While procedural equity is relevant to grant-making practice, the distributional equity concept is the focal concern here because it is central to the rural philanthropic divide discourse.
Three standards of distributional equity taken from the geography literature (Truelove, 1993) are extended to the philanthropic context.1 The representation standard emphasizes a group’s share of the population as a basis for allocation decisions. The merit standard of spatial distributive equity is closest to the idea that allocations should be a reward for good performance. Unlike the representation standard where simple existence is a sufficient requirement to constitute a claim on resources, the merit standard focuses on requisite skill or capacities in determining a claim to resources. Need is a very different equity standard commonly used in the geography literature. Under which, claims to resources are determined by relative levels of poverty experienced in places.
Equity judgments on the spatial distribution of grants may be evaluated by the application of any one or all three of the equity standards. In this article, all three standards are applied to assess equity because each illuminates different values that may be relevant to philanthropic grant making. As a basis for judgment under each standard, the allocation of grants would be compared with the proportionate share of the population of nonprofit organizations in rural and urban areas as modeled using quantitative indicators in the geography literature (Lucy, 1981; Talen, 1997; Talen & Anselin, 1998; Truelove, 1993).
The proportionate share method of distributional equity, applied to philanthropy, is described below for the three standards—representation, merit, and need.
Representation standard
Guided by a representative standard, equity determinations would be based on the evaluation of the distribution of grants to rural areas relative to their proportionate representation in the sector. In philanthropy, measurement might include comparison of the share of nonprofit organizations and their expenditures in rural areas compared with the percent allocation of grant awards (in dollars and number) to rural areas.
Merit standard
The merit standard focuses on organizational characteristics. Equity determinations would be based on the evaluation of the distribution of grants to rural areas relative to their proportionate worthiness or competitiveness in the grants market. Measurement of equity from the merit perspective is complicated because there is not a standard measure of merit or effectiveness in the nonprofit sector. Measures of financial efficiency, although contested (Hager & Flack, 2004; Wing & Hager, 2004), are often used as proxies by watchdog organizations in the sector and can be cautiously used here as proxy measures for merit because financial efficiency is an organizational quality on which nonprofit organizations compete in the philanthropic market (Jacobs & Marudas, 2009; Khanna, Posnett, & Sandler, 1995; Okten & Weisbrod, 2000). Using financial efficiency as a proxy, judgment of equity might consider whether the share of grant awards (in dollars and numbers) to rural nonprofit organizations based on their financial efficiency is proportionate to the distribution of financial efficiency in the population of rural nonprofit organizations.
Need standard
The need standard is focused on the conditions of the population in the areas where the grant recipients are located. Guided by a need standard, philanthropic equity determinations may be based on the distribution of grants (in dollars and number) to rural areas by poverty levels compared with the spatial distribution of nonprofit organizations by poverty levels.
Equity Assessment of Rural/Urban Grant Distributions: The Case of Georgia
Here, the results of a systematic descriptive analysis are presented where the equity of the spatial patterns of grants distributed in Georgia were examined using the three proposed distributional equity standards—representation, merit, and need. For this equity assessment, data from a sample of Georgia foundations were used where inequality in the number and amount of grant awards between rural and urban areas were previously documented (Ashley, Bricker, Chikoto, Ferguson, & Johnson, 2008). The choice to focus on grants in one state is a deliberate attempt not to conflate regional variations in philanthropic preferences, which is a problem that could impact the observed grant patterns. It also allows for examination of spatial giving patterns in a context where grant decision makers may be more aware of rural-based nonprofit organizations and more sensitive to rural issues because of closer proximity and in some cases, rural location of the foundations themselves.
Georgia grant recipients and nonprofit market structure do not differ greatly from national estimates. In Figure 1, the distribution of public charities in Georgia and grant recipients (grantees) are compared with national estimates (Blackwood, Wing, & Pollak, 2008). The size distribution of public charities in Georgia is similar to the national distribution with only a slightly greater percent of larger public charities in the sample of grant recipients. Grant distribution by subsector by the sample of Georgia foundations in the study is similar to national patterns as reported by the Foundation Center (2007). Nationally, 14% of grants were awarded to arts organizations, 20% to education organizations, 13% to health organizations, 26% to human services organizations, and 27% to other organizations. In Georgia, 13% of grants were awarded to arts organizations, 24% to education organizations, 21% to health organizations, 15% to human services organizations, and 27% to other organizations.
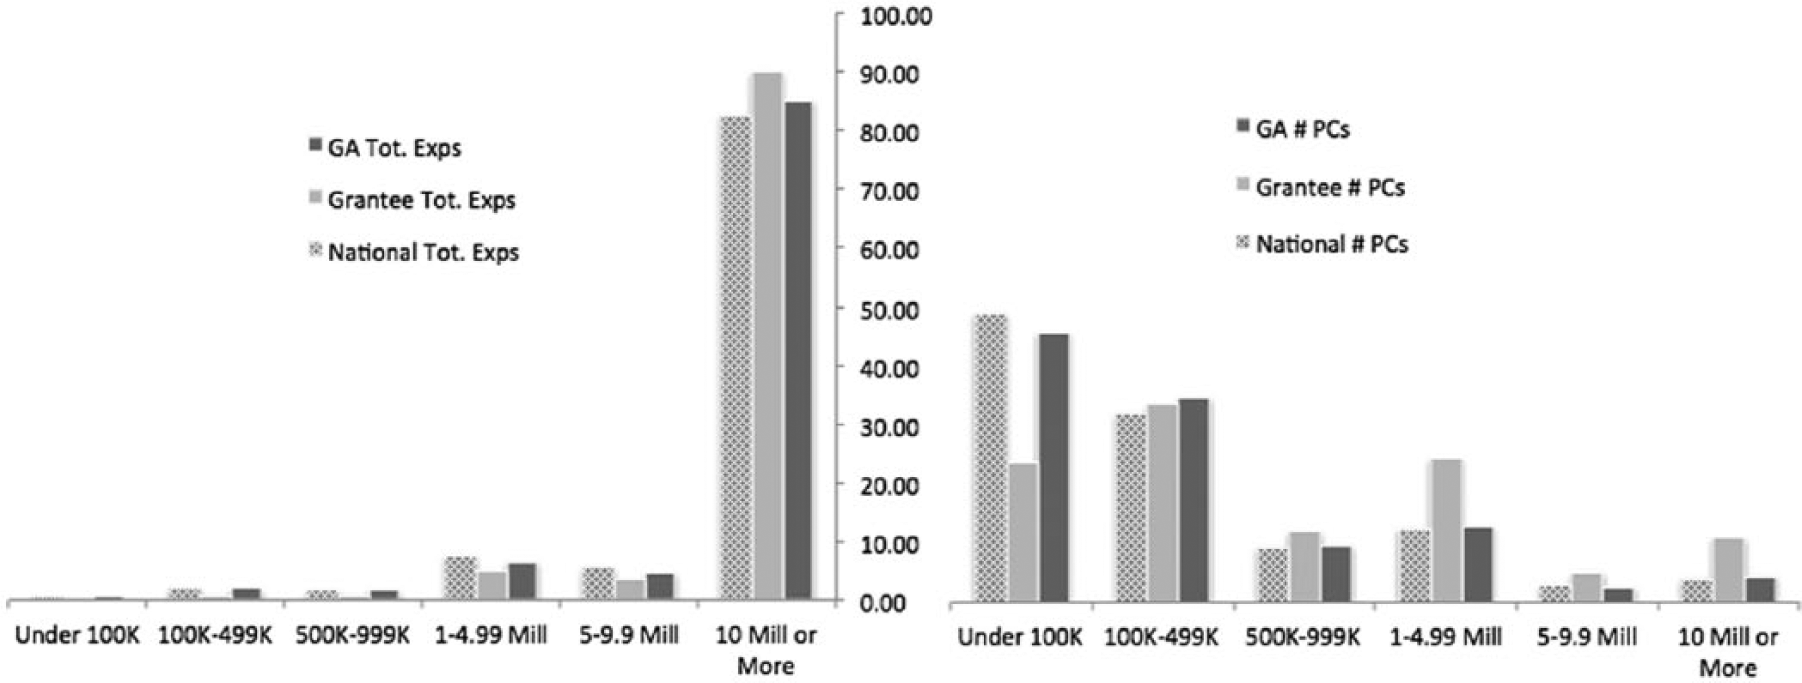
Comparative share of public charities and total expenses by size category.
Data
The data set for this study includes organizational and sociospatial data to accommodate the dynamic, multiscalar analysis required. The data were sourced from IRS form 990-PF data, form 990 data, and census data for the year 2005. In the data, every reporting nonprofit organization in the state of Georgia is linked to county-level locational data. Each nonprofit organization that received a grant from one of the sampled Georgia-based foundations is separately identified and linked to each grant-awarding foundation.
The spatial grant patterns examined in this study are based on the giving of 68 2 sampled foundations that are representative of the 1,264 grant-making foundations in the state of Georgia for the year 2005. The sampling technique combined a purposive sample of the largest 10 foundations in the state—which as a group accounted for 49% of total giving in the state—with a stratified random sample for the balance of the sample based on regional location and foundation type. The 68 sampled foundations had a median total giving of US$856,000 and distributed over US$200 million through 1,740 grants with a median grant amount of US$10,000 to 699 nonprofits in Georgia in 2005. Data for the sampled foundations’ IRS 990-PF data were combined with Form 990 data for the entire population of 7,119 reporting public charities in the state. County-level census variables on urban or rural designation, population, and poverty were included for each organization in the data. Of the 7,119 reporting public charities in the state, 1,014 were located in rural counties. Grants were awarded to 699 public charities (grant recipients) in the state by the sample of foundations, and 110 of these grant recipient organizations were located in rural counties.
Geography
The geographic scale of interest in this study is the county level, which is a significant scale for rural and urban designations in the state. Georgia’s 7,119 public charities are spread out across 139 counties of which 89 are classified as rural. Similar to other states, Georgia has one very large urban area and other urban and suburban areas of different sizes. To accommodate for these distinctions, subcategories of urban areas are specified in the study including (a) Atlanta Core, which includes the two most populous counties in the center of metropolitan Atlanta; (b) Atlanta Suburbs, which includes the 26 counties remaining in the Atlanta MSA; (c) Other Core, which includes the 13 counties in the state that contain the core city of a MSA other than Atlanta; and (d) Other Suburbs, which includes the 29 counties that are part of an MSA outside of Atlanta, excluding the counties containing the MSA core city. Figure 2 includes a map of the state of Georgia with identification of county type. The two most populous counties in the state, Fulton and DeKalb, referred to as the Atlanta core in this study, hosted more than one third of Georgia’s public charities in 2005, which comprised more than half of all Georgia’s public charity revenues.
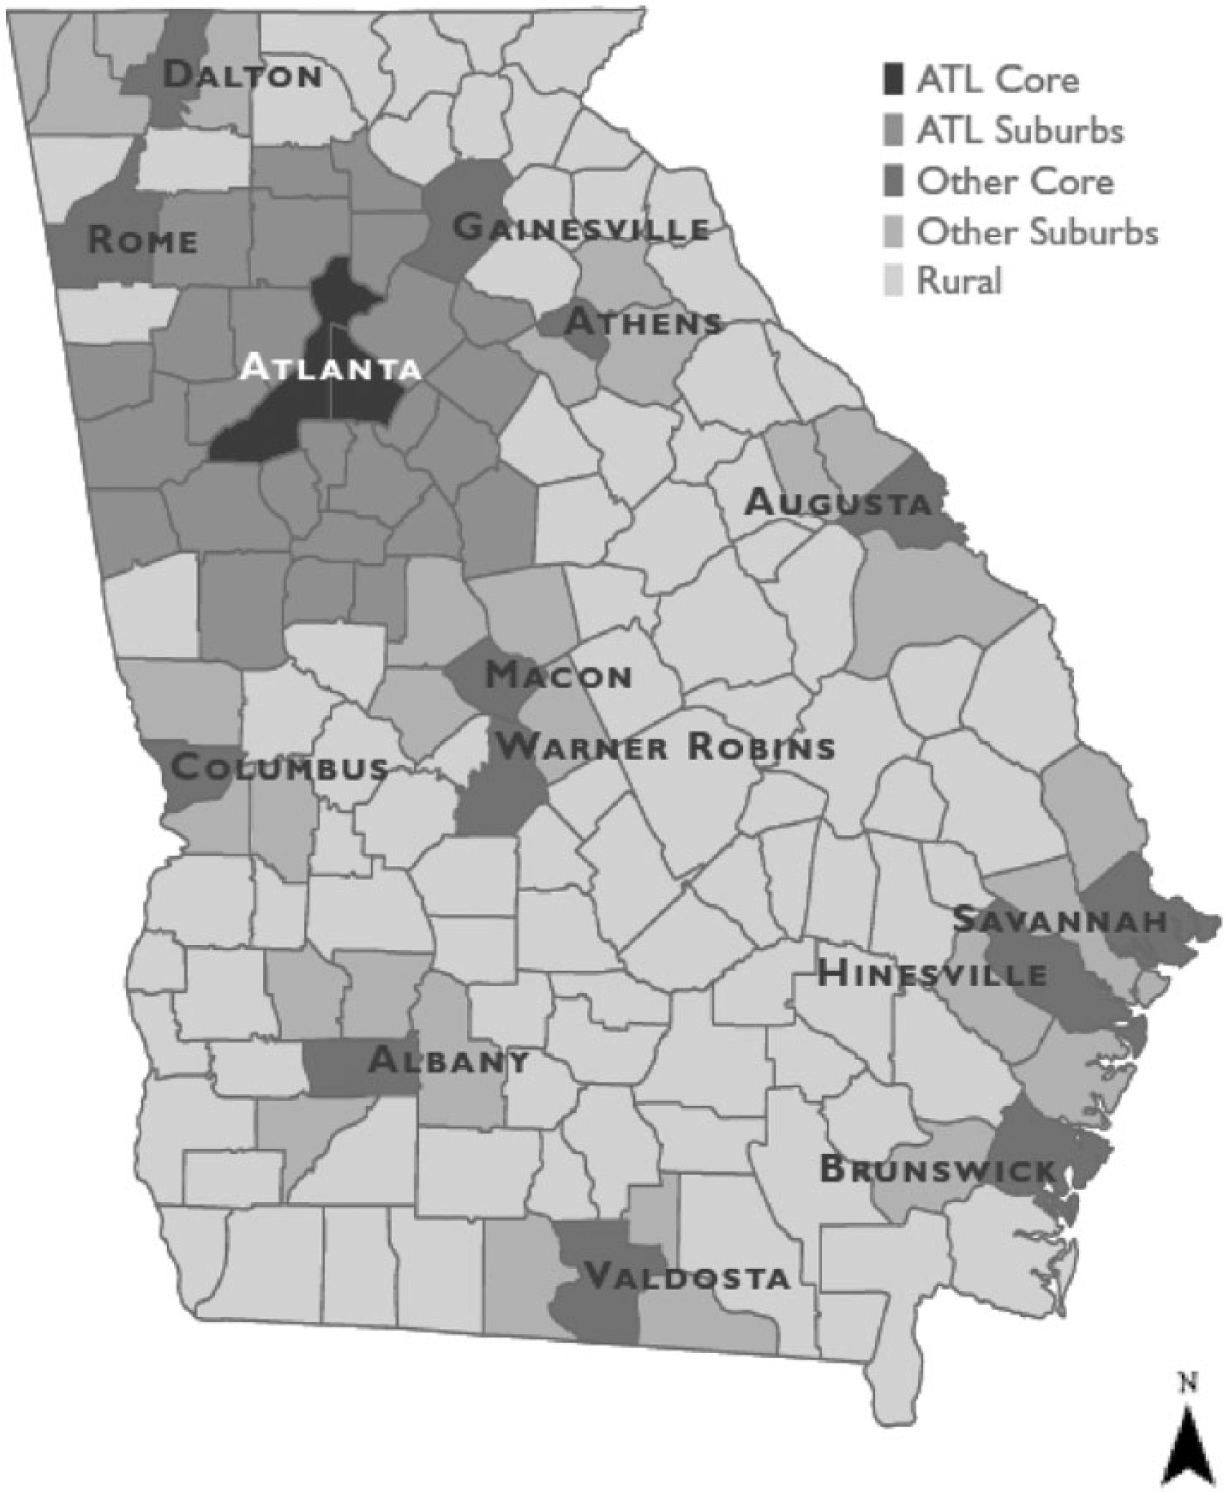
Georgia counties by type with core MSA cities identified.
On the other end of the urban–rural continuum, the 89 rural counties in Georgia contained 15% of the state’s public charities and only 7% of all public charity revenues. Fifty-five of Georgia’s counties had fewer than five reporting public charities; 41 of these counties were rural. Figure 3 includes a map of grant distribution by county with counties categorized by sociospatial characteristics. 3 This map provides an indication of the sociospatial differences across county types and offers a graphic illustration of the spatial inequality in grant distribution across Georgia.

Grant distribution by county.
Spatial Inequality in Grant Distribution
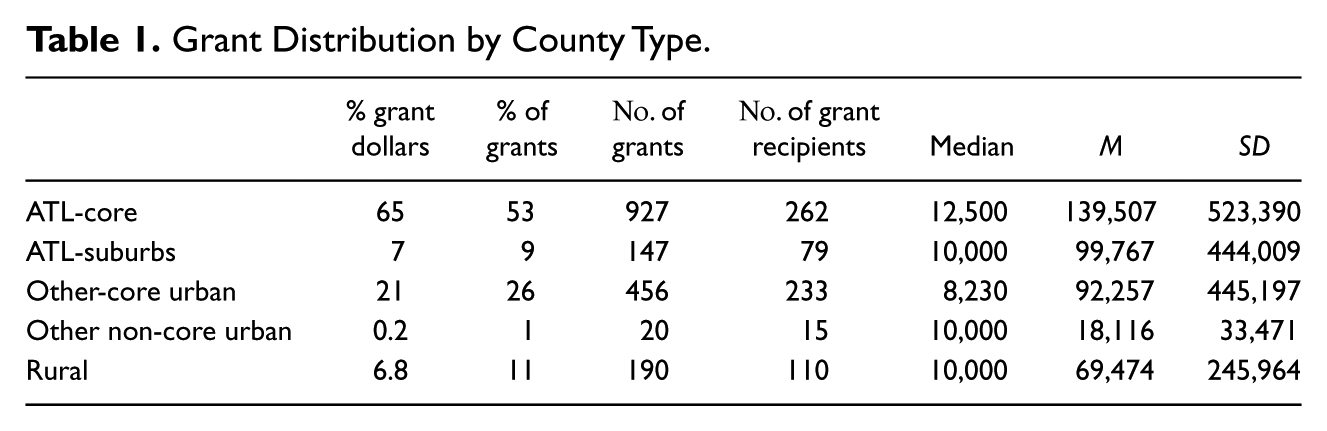
Table 1 details the distribution of grant awards by county type. The data highlight inequalities in the rural/urban levels and amounts of grant allocations from the sampled foundations. The 110 grant recipient rural-based public charities received 6.8% of grant dollars and 11% of grant awards with median grant amounts similar to urban-based public charities. Clearly, this is an unequal distribution. However, the question at the center of this study is whether the distribution of grants to rural areas is equitable.
Grant Distribution by County Type.
Methods: Equity Assessment
The three equity standards outlined in the conceptual framework—representation, need, and merit—are applied to assess the equity of the spatial distributive patterns of grants made by the sample of Georgia foundations. For each standard, a two-sample difference between proportions test was performed to determine whether there was a statistically significant difference between proportions of rural nonprofits in the sector and proportions of rural nonprofits receiving grant awards. The p values associated with these tests are presented in the tables of results. The null hypothesis associated with each test is that the proportions are equal.
Representation standard
The representation standard is assessed by comparing the percent of public charities in rural and urban areas to the percent allocation of grant awards to rural and urban areas. The analysis is provided in Table 2. Rural-based public charities in Georgia received 6.8% of grant dollars. Although this is a small proportion of grant dollars, it is consistent with the 8% expenditure level of rural-based public charities as a share of all public charities in the state. The results of the significance test indicate that these proportions are not statistically different, although the endogeneity of grants in nonprofit expenditures may bias the result. Therefore, based on this measure, the distribution of grant dollars to rural areas may cautiously be considered equitable because it matches the proportionate share of rural nonprofit expenditures in the Georgia nonprofit sector.
Representation by Geography.
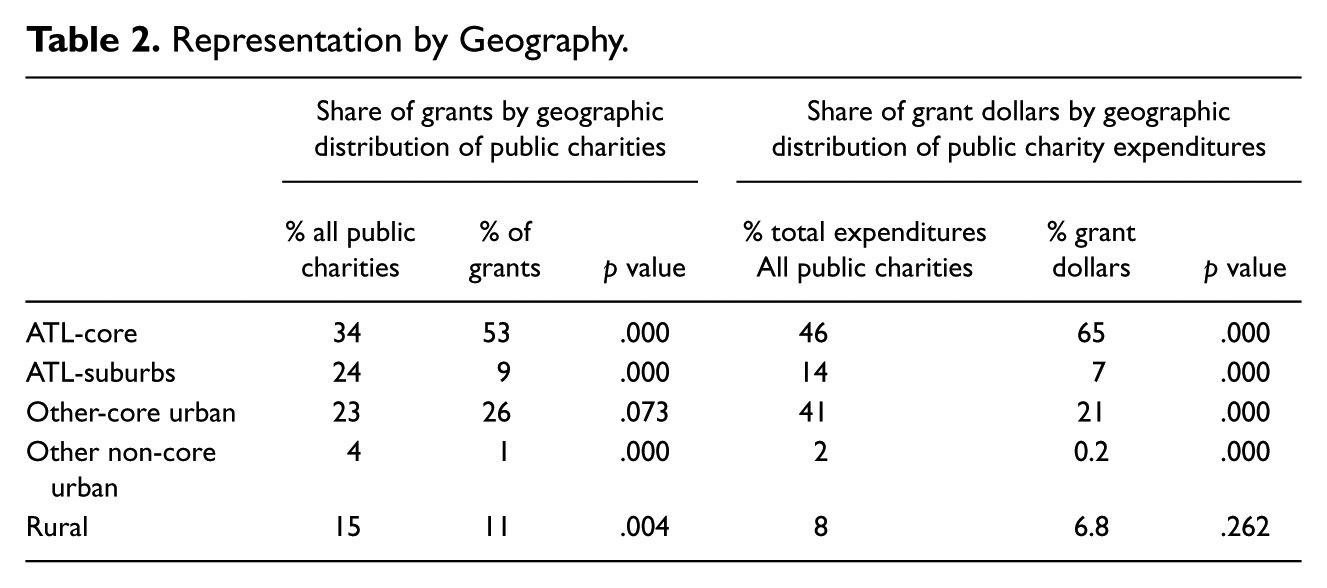
Alternatively, representation can be measured by the share of the number of public charities instead of expenditures to overcome endogeneity limitations. Using this measure, rural-based public charities accounted for 15% of all public charities in the state and received 11% of grant awards. The significance test indicates that these proportions are statistically different from each other, suggesting that the distribution of grants based on the rural share of the number of nonprofits in the state would not be considered equitable. By contrast, urban counties receive a notably disproportionate share of philanthropic resources. However, disaggregation of the urban counties affords a much more nuanced look into grant distribution across urban areas. The core Atlanta MSA counties receive the bulk of the grants and grant dollars, whereas suburban counties receive less than their share.
Merit standard
A different perspective is provided through the lens of the merit standard. The merit standard focuses on the performance of public charities. In the absence of generalizable quality measures in the nonprofit sector, measures of financial efficiency, which are publicly reported, can be cautiously used as proxies for merit comparisons. In Table 3, the allocation of grants along categories of financial efficiency is compared with the allocation of all public charities along the same categories of financial efficiency. Here, the focus is whether the distribution of grants by financial efficiency is proportionate to market distributions. Ratios for administrative expenses (percent spent on management/general) and fundraising efficiency (amount spent to raise US$1) are utilized as measures of financial efficiency following the calculations employed by Charity Navigator (2011). Although some scholars express concern about the validity of financial measures reported by nonprofits on unaudited IRS 990 forms, Froelich, Knoepfle, and Pollak (2000) provide evidence that measures related to contributions, program, and fundraising reported on IRS 990 forms are reliable or reasonably consistent with audited statements while others—including management expenses—are less consistently reported. In addition, Tinkelman and Mankaney (2007) demonstrate that the exclusion of nonprofit organizations with unrealistic financial ratios improves the reliability of analyses using IRS form 990 data, therefore, a small set of organizations (4%) that reported ratios below 0 and above 1 were excluded in the analysis.
Distribution by Financial Efficiency Ratios.
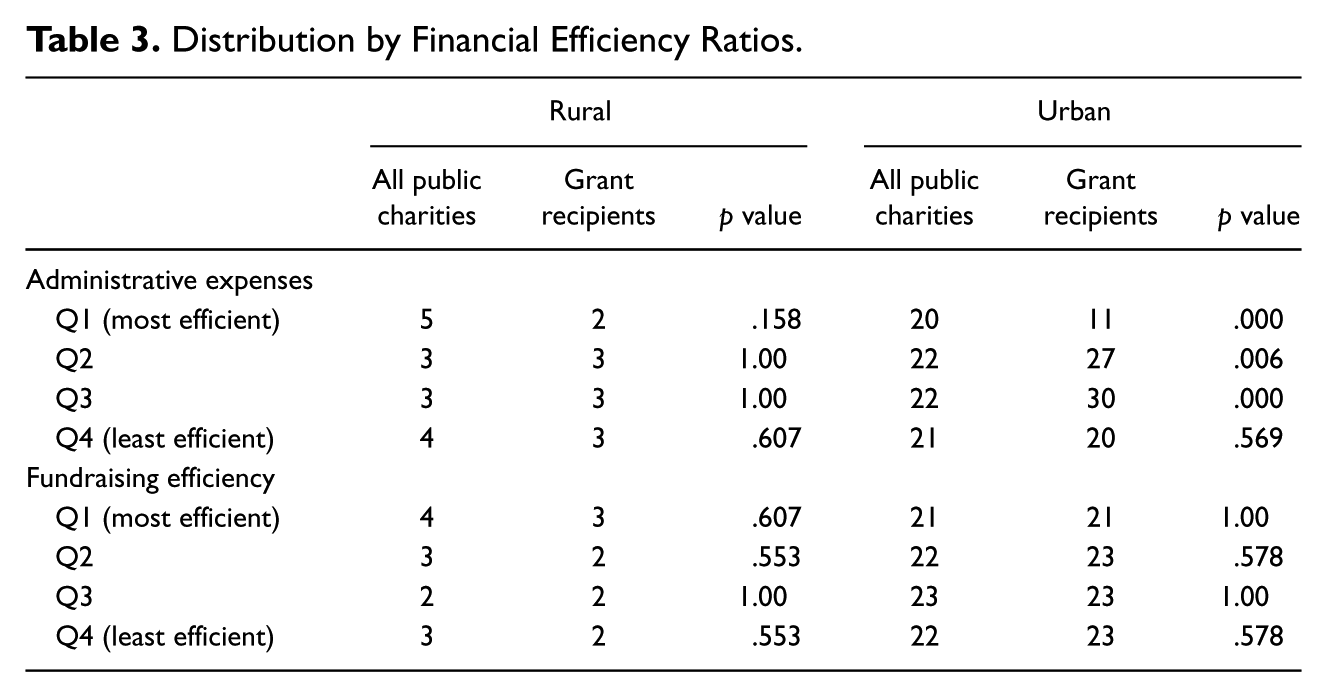
The ratios are categorized by quartile rather than using a threshold rule (e.g., at least 75% of dollars are used toward programs) to permit consistent and relevant comparison across subsectors. The results show a pattern of grant distribution that is not statistically different from the distribution of all rural public charities. Thus, the data for Georgia suggests an equitable distribution of grants to rural-based public charities because the proportions of grant recipients by financial efficiency performance are consistent with the proportionate performance of rural nonprofits in the state.
Need standard
Finally, the need standard draws attention to the condition of the population in the communities where the public charity is located. This standard is consistent with the rhetoric around rural philanthropy, where it is argued that rural areas deserve a greater share of grant resources because they have a high level of need (Eisenberg, 2004). To measure the equity of grants using this standard, the distribution of grants by poverty level is compared with the distribution of the population of public charities in the state by poverty level. The focus here is on the percent of the population at or below the poverty level rather than absolute calculations because urban areas have larger populations than rural areas.
In Table 4, the results show a pattern of grant distribution that is proportionate to rural public charities’ share of the sector by poverty level. The 11% to 15% poverty level category, for instance, shows that 5% of the total population of public charities in the state were rural-based and had a poverty level of 11% to 15%. This group accounted for 4% of grant recipients. The significance test indicates that these proportions are not statistically different; therefore, we can conclude that the distribution is equitable. The remaining categories show a similar pattern of equitable grant allocations because they are consistent with the distribution of organizations in Georgia’s nonprofit sector. The same pattern is observed if human services sector organizations (a sector where grant distribution may be most closely connected to poverty) are examined separately.
Distribution by County Poverty Level.

Conclusion
In the Georgia case, rural counties received a small share of grant awards (6.8% of grants dollars and 11% of grants), yet, all three equity standards used to assess the equity of the distribution of grants lead to a conclusion that the distribution could be seen as equitable (with the exception of representative share of the number of nonprofit organizations). Overall, rural-based public charities in Georgia received a share of grants that is proportionate to their expenditure representation in the sector and to their share of merit (financial efficiency) and need (poverty). The Georgia case demonstrates the application of distributive equity standards in making equity determinations. They confirm that simple comparisons of amounts to rural and urban areas, which are the norm in the rhetoric around rural philanthropy, may be useful for identifying inequality but can be misleading when used to judged equity.
Discussion
The question of who gets what where is now a salient issue in philanthropy following the attention, in recent years, to rural philanthropy. There is an obvious mismatch in the discourse around gaps in rural and urban giving patterns between calls for equity and measures that point to inequality in grant allocations and assets. The central argument in this article is that this disconnect is influenced by a deficit in the philanthropy literature where, unlike in the broader geography literature, questions of spatial equity have not been addressed in either the body of philanthropic ethics or geography of philanthropy scholarship.
The aim of this study is to address both the conceptual and measurement gaps related to standards of equity in philanthropy in an effort to move the field toward deliberate, conscious articulation of standards that can broaden the professional as well as political dialogue on matters of distributional equity in philanthropy. Rural philanthropy represents an area where spatial patterns of giving are judged on ethical grounds, but where scholarship has not been able to inform the professional and policy discourse. This study contributes a much-needed normative approach to equity considerations—distributive equity—and develops a methodology for judging equity consistent with the proportionate share assessment that is central to distributive equity. In doing so, this study sets an example for other areas of practice (diversity, giving to disadvantaged groups, social investments, operating grants, and asset payouts) where equity standards are being proposed but where benchmarks are currently subjectively determined (Jagpal, 2009). The aim is that arbitrary benchmarks that set goals for how much of the nation’s philanthropic resources should be directed to rural areas (e.g., Senator Baucus’s request for five times more) or toward any other issue area would be replaced by benchmarks that are grounded in equity theories like distributive equity which instead suggests that rural areas receive a proportionate share of resources according to any standard, be it need, merit, representation, or some other standard.
Future studies are warranted to continue to develop the basic framework developed in this study. This study focused on proportionate comparisons relevant to distributive equity but alternative approaches may be proposed that examine procedural equity considerations or other equity theories. Additional studies may also consider different methods of measuring rural grants. In this study, the location of the grant recipient organization was used to designate the grant as rural. The limitation of this method is that it does not capture funds that might be granted to an urban-based public charity to provide services in rural areas. An alternative approach is to use the rural development grant category reported by Foundation Center but this limits the scope of grants and does not fully capture the range of subsectors in rural areas that receive foundation support. Nonetheless, the data used in the Georgia case have important design attributes that are important to highlight for future research. First, the data include all statewide grants made by the sample of foundations. Grants data that are available for purchase are often limited to grants that are larger than a specific threshold, which can exclude a significant portion of rural grants. Second, the data include grant recipients and the entire population of reporting public charities, which makes the proportionate comparisons possible. Finally, the inclusion of census data permits examination of locational characteristics in addition to organizational characteristics.
While it can be argued that it is inappropriate to hold foundations accountable to any standards over and beyond their provision of public benefit (Douglas & Wildavsky, 1978), it is clear that policy makers with the power to regulate foundations are indeed holding them accountable for the ways in which their resources are geographically distributed (Bonham, 1978). To be clear, the conduct of this study is not an affirmation that foundations should be judged based on spatial distributive patterns. As Wolpert (2006) noted, the philanthropic sector does not have primary responsibility for the pursuit of equity but it is, in part, held accountable, along with government, for the reforms and interventions that address opportunities and disparities in local communities. Right or wrong, the rural philanthropy gap is an issue where equity concerns are being raised. In the absence of standards to assess spatial distributive equity, foundations are left to assuage equity concerns without a way to measure the extent of inequity or progress in diminishing inequity when it exists. With this study, a path is cut through the rhetoric surrounding rural philanthropy and standards are brought to the fore that can bring clarity to the discussion and promote a more even examination of philanthropic practice.
Footnotes
Declaration of Conflicting Interests
The author(s) declared no potential conflicts of interest with respect to the research, authorship, and/or publication of this article.
Funding
The author(s) disclosed receipt of the following financial support for the research, authorship, and/or publication of this article: Funding for data collection was received from the Wilbur and Hilda Glenn Family Foundation.