
Abstract
One recurrent narrative in the discussion about managerial public sector reforms is the growth in organizational professionals as a response to new accountability regimes. New Zealand has experienced modest growth rates in the general public sector workforce. Less studied, though, is whether the composition of the public sector workforce has changed, with an increase in organizational functions supportive to management. Based on descriptive workforce data, followed by follow-up interviews, this article presents a multifaceted and complex picture of a growing new public bureaucracy with the main task of managing chains of accountability.
Introduction
For several years now, new public management (NPM) reforms, based on neoliberal ideology and economic theory, have been described as fuelling a new type of administrative expansion within public sector organizations (Evetts, 2009; Hood & Peters, 2004; Power, 1997). The rise of this new regime of managerialism in the public sector represents a well-known account in many social science studies including the subtle undermining of existing professional norms and values in the public sector workforce through centralization of control and power, standardization of procedures, individualized accountability, increased focus on legitimacy, and not least managerial performance indicators (Brandsen & Honigh, 2013). While this assumed evolution has been high on both the public and academic agenda in, for example, the Scandinavian countries (cf. Greve, 2003; Hall, 2013; Ivarsson Westerberg & Forssell, 2014; Torsteinsen, 2012), these assumptions have elsewhere more revolved around increased running costs as a result of the reforms (cf. Hood & Dixon, 2015, 2016).
New Zealand represents in this context an interesting case. The country was heavily affected by the major changes in the public sector occurring at the time following the fourth Labor Government (1984). Structural changes, such as disaggregation of units, increased emphasis on measurable outputs, accountability measures, internal competition, and private sector managerial methods and practices, all radically transformed the New Zealand public sector through a number of legislative reforms (Boston, 2000; Boston et al., 1996). New Zealand was constructed a prototype (“the New Zealand model”) of the doctrines presented in Christopher Hood’s original article on NPM (Hood, 1991), and subsequent assessments reinforced this view (cf. Christensen & Lægreid, 2007). It appears that the legacy of managerialism still colors much current thinking, despite the whittling down of many reforms of the 1980s/1990s (Duncan & Chapman, 2010, 2012; Lodge & Gill, 2011).
Notwithstanding the current body of literature (see below) presenting a number of useful concepts and approaches, it is not exactly underpinned by an abundance of empirical studies. The premise of our study is that, given the literature on changes in the public sector workforce and a changing balance in favor of managerial accountability, we should be able to somehow empirically observe these changes.
We will in this article evaluate the assumption that there is a trend leading to observable increases in managerial and organizational professional functions in public sector organizations. The chief research question is to what extent can we observe (quantitatively) an occupational shift where a new public bureaucracy of organizational professionals, including managerial roles, have risen in the public sector in New Zealand? We will break this down to two different levels/areas:
- The general changes in the occupational structure of the public sector workforce in New Zealand since the 00s.
- Occupational changes in two selected case organizations—the New Zealand Police and the New Zealand Transport Agency (NZTA).
Our study will be based on descriptive historical occupational data (from the State Service Commission’s [SSC] Public Service Workforce Data [PSWD], census data from Statistics New Zealand), workforce data from the two selected organizations, and other sources (for details, see below in the methods). These descriptive data will be accompanied by qualitative follow-up interviews with representatives from the two case organizations, through which we seek to confirm the context.
Following this introduction, we will review the literature on organizational professionals, changes in occupational structures and public sector reforms. In chapter 3, we will present a short background to changes in the New Zealand public sector with a special focus on occupational changes. In the fourth section, we will present our analytical strategy including some of the methodological challenges. We also describe some of the methodological and analytical strategies for our qualitative interviews. Finally, in our concluding section, we draw some lessons from the study.
The Literature
Organizational and Occupational Professionalism
The claim that growth in the bureaucratic functions of any organizations represents an undesirable liability is an old, but still active, academic discussion which dates back to management research in the 1960s (posed in general terms, it actually dates back to ancient China) under the term “administrative intensity” (Kasarda, 1973; Tosi & Patt, 1967). Administrative intensity refers to the ratio of administrative positions compared to “front-line” staff (Andrews et al., 2017). According to Boyne and Meier (2013), two distinct theoretical approaches are discernible within this literature. First, what the authors coin structural contingency theory, where the level of administrative intensity is dependent on factors external to both the organization (often defined as “turbulence” meaning ruptures and/or insecurity) and the organizational size. Second, public choice theory, assuming that the level of administrative intensity is dependent on factors internal to the organization, and more specifically the self-serving behavior of bureaucrats seeking to maximize the budget and the size of their own departments. As Boyne and Meier point out, these two theoretical approaches are accompanied by different normative connotations. The structural contingency theory basically views an increase in administrative intensity as a necessary response to structural factors (thereby making a valuable contribution to the organization), while the rational choice theory tends to equate administrative intensity with bureaucratic waste (Boyne & Meier, 2013, p. 308).
Unrelated to this research tradition, there has since the 1980s existed a parallel sociological discussion on changing patterns of professionalism within public sector organizations. The “classical” ideal of professionalization within public sector organizations, has since the 1980s been confronted with a greater emphasis on efficiency, effectiveness, and not least, accountability, of public sector service delivery (cf. Evetts, 2009; Gleeson & Knight, 2006; Stronach et al., 2002; Ward, 2011). New managerial chains of accountability have redirected loyalty and commitment away from the profession to new forms of accountability. These new forms manifest themselves through hierarchical chains of command with an underpinning idea that the professional groups were just as self-serving as any other group in society and could not be trusted to exercise discretion (Barberis, 1998; Moynihan, 2008). Rather than maintaining the traditional internal values of professional communities (such as e.g., nurses, doctors, teachers, and police officers), the emphasis has shifted to the individual organization, its public appearance, the external visibility of the organization, and not least the performance of the organization. While earlier historical systems of accountability were based on interpersonal relationships, formal qualifications, and the profession’s internal norms and values, the new managerial regime is based on values related to “objective” and “neutral” criteria for organizational success and often implemented through self-appraising techniques (“ticking boxes”) (Moynihan, 2009). Likewise, the conversion of the client/citizen role to a customer role has generated a demand for customer service/satisfaction functions within public sector organizations (mimicking the private sector). This includes traditional customer relationship management and also reputation management, branding, and public relations (Carpenter, 2010; Christensen & Lodge, 2018). These new public relationship functions have often been established to respond to new accountability demands while in practice downsizing the organization and/or reducing operative roles (Ward, 2011).
Against the backdrop of these descriptions, first Larson (1977), then Evetts (2009), makes a distinction between organizational professionalism and occupational professionalism. The former manifests itself through a discourse of control, leans toward the managerial side of the organization, and incorporates rational-legal forms of authority. The latter emerges out of the discourse of professional occupational groups and collegial authority, with trust from both employers and constituents (such as e.g., clients and patients). As emphasized by Evetts, these are ideal types with the aim of discussing changes in public management, whereas “reality” entails a much more complex understanding of the concepts. Noordegraaf (2011) confirms this distinction with organizational professionals “responsible for organizing the rendering of services” such as managers, auditors, strategists, and consultants (Noordegraaf, 2011, p. 1352, emphasis added, Noordegraaf et al., 2014). Occupational professionals on the other hand refers to what is sometimes also described as traditional or classic occupational groups (e.g., nurses, social workers, and police officers). They could also be referred to as service professionals (Noordegraaf, 2011, p. 1352).
This proposition has been taken into account by many authorships, particularly in sector-specific studies (e.g., education and health). 1 While focussing on different professional tensions, they share a normative story about hegemonic “neoliberal” or “managerial” ideas resulting in the degrading, deskilling, and “proletarization” of extant professional identities (Calnan & Williams, 1995). Furthermore, most share an empirical focus on how managerialism affects the traditional professions from a victim or a resistance perspective. The notion of organizational professionals often comes across as either a discourse (Evetts, 2009), or as a culture (cf. Brunetto, 2001; Wynen et al., 2017), but lacks in most cases agency. However, and a bit paradoxically, what we do know is that the same mechanisms that have reduced the role and status of traditional occupational professionalism, in many cases have been the impetus for professionalizing the more organizational cohorts of public sector staff (such as e.g., project managers and event organizers). This has in many cases taken place through an imitation of the same mechanisms (formal qualifications, professional associations, and ethical standards) that traditionally have characterized the “old” professions (Alvesson, 2013; Noordegraaf, 2007). Importantly, Noordegraaf (2007) also notes that we are dealing here with ambitions toward professionalization. Noordegraaf argues that “professional status” is not a de facto, unchangeable state of facts, but rather an object of continuous ambitions and re-negotiations. This view of professionalism and professionals is the one followed in this article, which means that we do not view either occupational or organizational professionals as objective categories, but rather as tools for classifying the public sector workforce.
Defining the New Public Bureaucracy
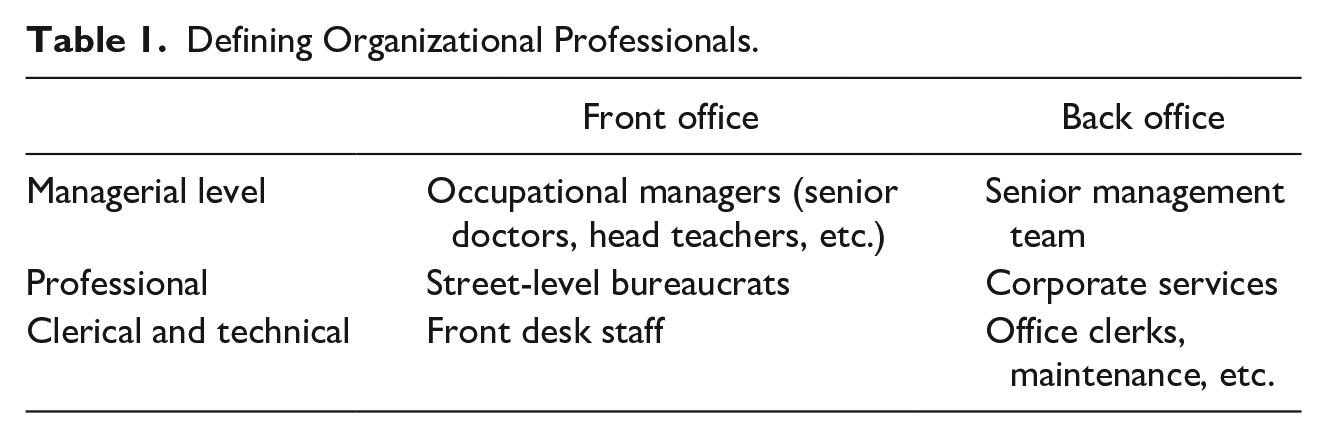
The aforementioned literature on administrative intensity typically rely on a separation between personnel whose main function is to provide services internally within the organization (managers, IT, HR, finance, marketing, etc.) and personnel who are directly involved in the production of goods or services outside the organization (professionals and street-level bureaucrats) (Andrews et al., 2017). As already indicated, many of the available definitions of the aforementioned organizational professionals are founded on some kind of analytical/moral polarity between them and the occupational professionals (Stronach et al., 2002). They are the antithesis of the “liberal/independent” professions and are often portrayed in an almost Machiavellian language, where shrewdness and political astuteness compensate for lack of skills (Reed, 1996, p. 585).
If we choose to go beyond such normative assumptions, while being a very visible group in the overall storylines of the public sector, we are dealing with a pretty heterogeneous group. In his seminal work on organizations, Mintzberg (1979) describes different organizational configurations, based on functional differentiation, where different environments and level of technology affects the balance between the different parts of the organization. In this context, he distinguishes the techno-structure and the strategic apex from the rest of the organization. However, while representing a good foundation for identifying the new public bureaucracy, these are two rather broad categories. Andrews et al. (2017) talks about the “central administrative function” of the organization which is defined as: Those personnel with no direct role in service production, such as the senior management team, corporate services (e.g., finance, human resources, IT, marketing) and other workers of providing services to the whole of an organisation. (Andrews et al., 2017, p. 116)
Noordegraaf et al. (2014) provide us with a different, and yet very similar, definition based on the job function where organizational professionals are workers who are responsible for “organising and organisational improvement” (Noordegraaf et al., 2014, p. 24). By contrast, definitions of the occupational professionals are more pertaining to identity, or to skills (Whitley, 1989). To be clear, our definition of the new corporate bureaucracy only takes account of functions pertaining to general management of the organizations (Allison, 1983) containing functions related to strategy, managing internal components (e.g., staffing and performance), and external constituencies (communication, public relations, etc.). We are not including the rather broad groups of unskilled and semiskilled clerical, administrative, and technical workers who populate many public sector organizations. Even though many of these are predominantly providing services to the organization (rather than to groups outside), they are not representing a new occupational group (in fact, it is a group slowly being pushed out by the new bureaucracy in combination with new technologies, see below). Table 1 summarizes the different “systems” and the group of corporate bureaucracy (highlighted) we are referring to.
Defining Organizational Professionals.
Although this distinction is helpful for discerning our unit of analysis, we acknowledge that it is not without imperfections. First, and in line with Abbott (1988) as well as Noordegraaf (see above), we need to steer clear from a pedantry road of identifying exact definitions of professions (and subsequent boundaries between the same), and instead conceive professions as parts of broader “ecosystems” rather than static entities. Even though we are going to identify different types of professions, we fully appreciate that this will not be an exact appraisal and that there are numerous borderline cases. Second, our definition approximates the old dichotomy between frontline and back-office “workers” in service delivery (which after all constitutes the prime function of public sector organizations). With modern office organizations (“call-centers”) and digitization, this distinction has gradually dissipated (Zomerdijk & de Vries, 2007). Third, the distinction does not take into account the “hybrid” functions where occupational professionals have been promoted, or seconded, to a different (managerial or organizational) function within the organization, but still maintain a foot in their “trade.” The extant literature comprises a pretty extensive discussion on work identities spanning across the boundary between “traditional” professions and “managerial” roles (Blomgren & Waks, 2015; Giacomelli, 2019; Noordegraaf, 2007).
Finally, we need to acknowledge the classical demarcation issue around working for the public or the private sector, and the meaningfulness of maintaining sharp distinctions (Bozeman, 1987). Many job functions emerging in the public sector are being delivered by contractors and/or consultants from the private sector. Indeed, this is a gray-zone causing problems for making estimations about the different segments of the public sector workforce, but it will most probably create new organizational functions within the remaining public sector.
However, with these caveats in mind, we still maintain that it is possible to broadly distinguish between distinct workforce groupings in public sector organizations, and to identify some overall trends, which is the task we now turn to. More important though the group we have identified as organizational, professionals are in one way or another involved in managing accountability, or chains of accountability, whether monitoring accountability, holding others to account, or deflecting the organization from external actors seeking to hold the organization to account.
The New Zealand Context
In the literature, New Zealand represents the archetype of managerialism in public sector organizations. We will not reiterate the full story here (Boston, 2000; Boston et al., 1996; Duncan & Chapman, 2010, 2012), but merely mention the specific effects on the workforce. The three different reforms of the State in the 1980s (the State-owned Enterprises Act 1986, the State Sector Act 1988, and Public Finance Act 1989), combined with the new Employments Contracts Act 1991, contributed to a transformation of both the structures and the culture of the sector resulting in the devolution of managerial discretion, the fragmentation of the sector, and separation of functions. Furthermore, the changes in the management of ministries and departments devolved all employment decision from the centralized body “the State Service Commission” to new roles of appointed chief executives (CEs) with individual discretion. While retaining the control of overall employment policies within the government, and contractual accountability between the CE and the SSC (and the minister), most employment discretion became delegated to the CEs. The discretion of the CE has been subject to many inquiries and reviews in the 1990s (Schick, 1996, 1998) and more recently the SSC (2014). “It Takes Three, Operating Expectations Framework.”
The occupational effects of the reforms can be seen in Figure 1.
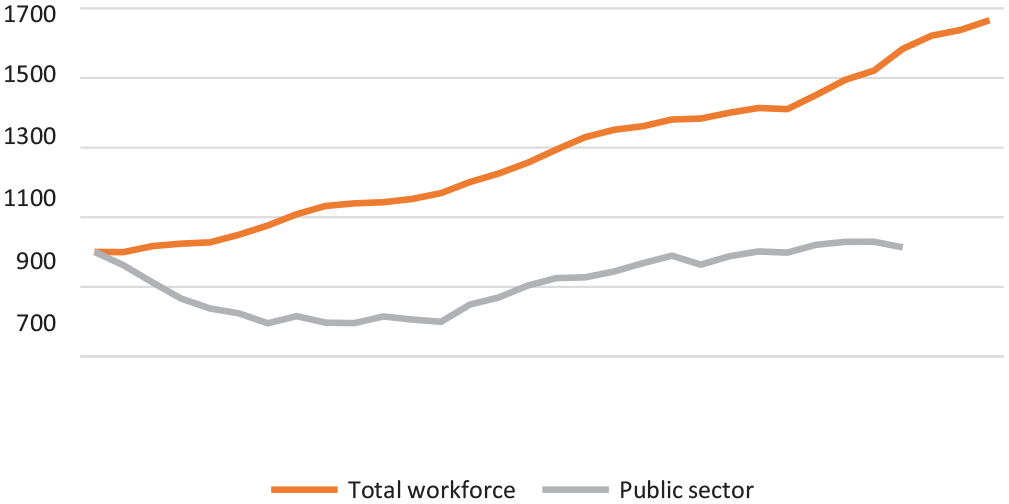
Indexed growth in the public sector and total NZ workforce, 1989–2020 (1989–base = 1,000).
Sectoral growth over the last three decades, indexed to a year-2000-base in Figure 1, reflects sustained growth in the public sector since 2000, faltering during the early years of an administrative cap in 2009 (see more below) and then climbing again; state-owned enterprises early trajectories were similar, but the cap shrank them effectively. Delving back further, the SSC’s (2017) data on aggregate changes in the public sector since 1990 (Figure 1) reveals three clear phases, corresponding roughly to each decade and also to swings between National and Labor governments. The 1990s saw a strong retraction of the public sector workforce, following key reform acts of the late 1980s.
There was a further focus on the number of employees in 2009 when the National Party Government (partly as a response to the global financial crisis) decided to put a cap and curb the growth in public service staffing. The SSC was given the role of monitoring the development with the CEs actively expected to keep the numbers down. The initial cap of 38,859 full-time equivalents (FTEs) set in 2009 was reset to 36,475 FTEs in 2012. The cap also emphasized a special focus on reducing the number of communications and public relations advisers (Cabinet, 2009). This cap was first removed by the Labor government in 2018 following a review (Office of the Minister of State Services, 2018). The review demonstrated some unintended negative consequences such as gaming employments (re-classifying and re-categorizing staff), shifting the management focus to numbers of staff rather than the value of the same, and creating “perverted incentives towards contracting [services] rather than maintaining in-house capability” (Office of the Minister of State Services, 2018, para 9.1).
Methods and Data Collection
Identifying Organizational Professionals
Following our discussion above, our identification of organizational professionals adopts the following three criteria:
Support/managerial staff versus core sector staff mission: not being immediately involved in core work of the organization (being engaged in strategic, organizational tasks instead).
“Back office” versus “frontline” (service delivery) functions: having the organization itself as their primary focus, rather than a form of service delivery.
Organizational professionals versus occupational professionals: being educated or professionally qualified (or highly experienced) in organizational skills.
In addition to these logics, an important caveat is that professionals of organization are separated from clerical and administrative workers, who also have support roles, but whose functions are not strategic. Manual and technical workers are loosely bracketed along with administrative/clerical workers as providers of support functions which we do not include in the category of organizational professionals. There are, of course, many doubts or ambiguities entailed in these binary distinctions (e.g., the difference between IT support and software developer). The rationale behind this distinction, which is quite uncommon in the literature, is that we want to focus upon professionals of organizational management, such as managers, HR, communicators, strategists, and financial professionals while excluding more traditional administrative routine tasks.
At a basic level, a binary distinction is simply made between organizational professionals and others. Allowing for greater complexity, particularly when confronted with very long lists of job titles, additional codes might be assigned for example, potential organizational professionals (who could then be kept in or out during analyses), occupational professionals, clerical/administrative staff, and technical/manual support functions, to look at broader patterns beyond the core target group.
Quantitative Data Sources
A number of limitations hinder the compilation of public sector workforce data in New Zealand. Beyond individual public service departments—which are monitored by the Public Service Commission’s PSWD—there is an effective lack of a single data source for workforce statistics, meaning that researchers need to use census data, which brings its own limitations, or to approach individual agencies directly to access occupational information.
The comparatively poor in-house record-keeping of a number of public sector organizations poses a further problem in New Zealand. Both the NZTA and the NZ Police shared comprehensive data from 2015 to 2020, but both stated they were unable to provide comparable older data, citing legacy issues. The PSWD similarly starts from 2000. Digitized select committee reports are published from 2002, and annual reports are harder to come by prior to the turn of the millennium.
A lack of centralized workforce statistics beyond the public service, the novelty of most HR systems, legacy issues, and the increasing sparsity of data going back to the last century, diminish occupational knowledge both within state sector organizations and among outsiders. In comparison with individual organizational workforce statistics, general population statistics are highly centralized in New Zealand, with Statistics NZ directly controlling and disseminating access to large data sets like the integrated data infrastructure (IDI) and longitudinal business database (LBD).
In addition to the overview of the public sector, two crown agents—the Police and the NZ Transport Agency (NZTA)—were picked as case studies. Both organizations are large, and their core operations are highly visible at the national level. Their reach, and the significance of their core service delivery, implies complexity behind-the-scenes; unlike smaller, more bureaucratic departments, the ongoing nature of this regulatory and infrastructural work limits their susceptibility to short-term overhauls or project-based changes, so workforce developments are arguably more likely to highlight long-run structural or cultural trends. Both agencies are internationally comparable. The conservative nature of the Police also contrasts sharply with the NZTA’s “modernized,” increasingly procurement-based model, showcasing both ends of the public sector spectrum.
Data from the major case studies’ annual reports (and other sporadic publications) was also compiled into tables and data sheets (Tables 2–4).
Publicly Available Data Sources.
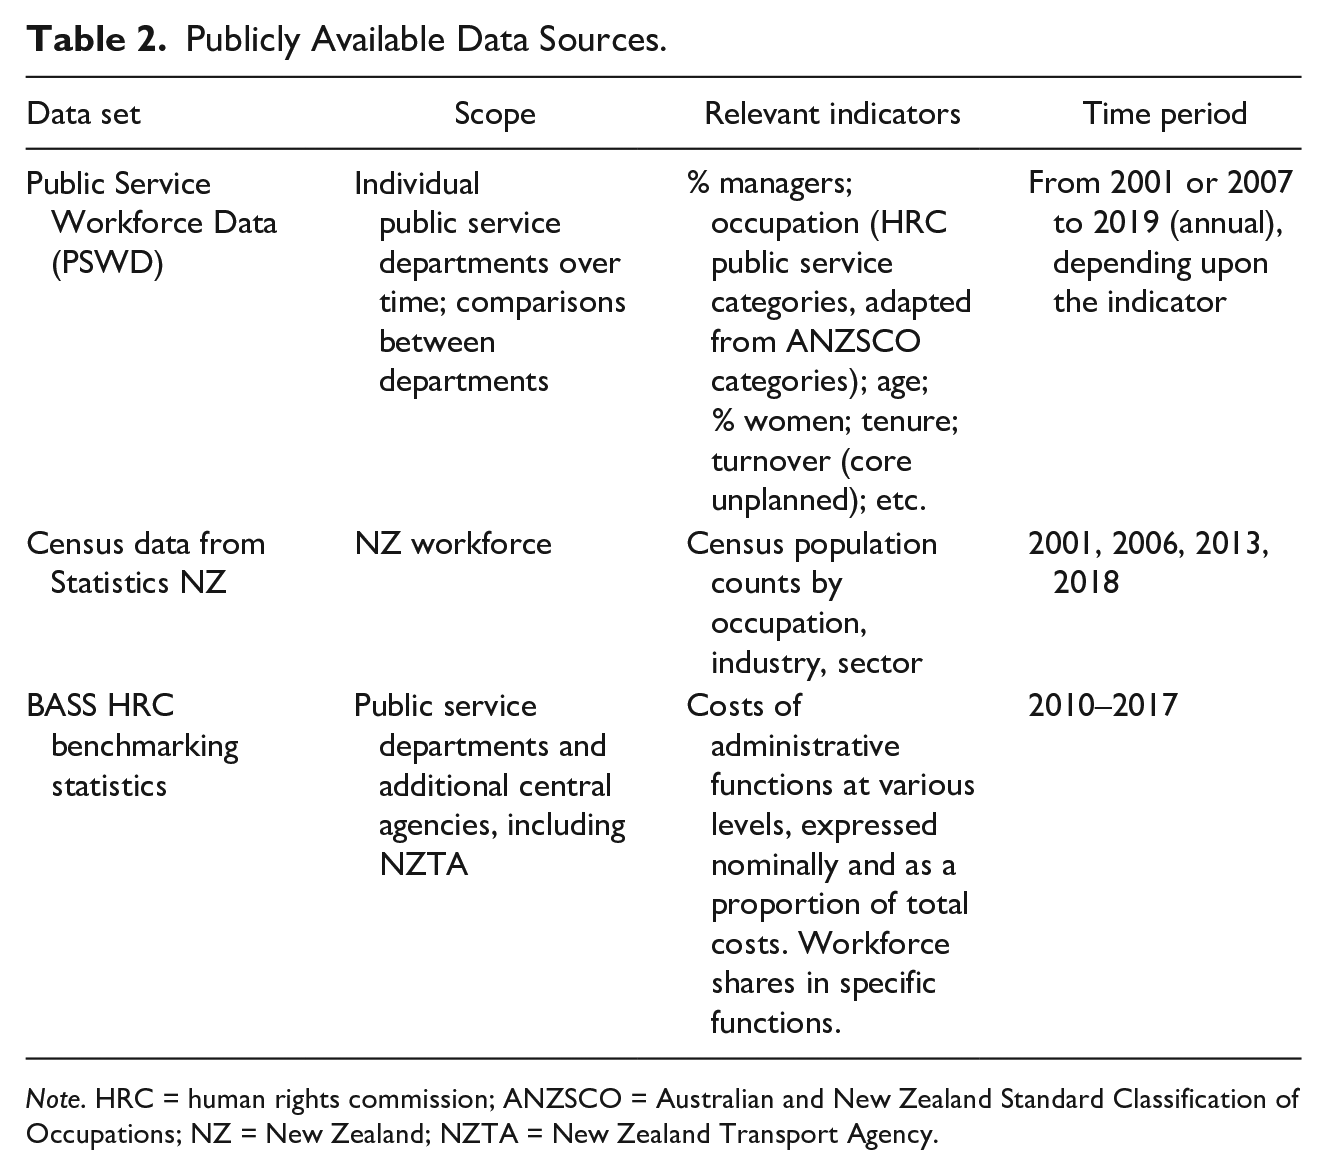
Note. HRC = human rights commission; ANZSCO = Australian and New Zealand Standard Classification of Occupations; NZ = New Zealand; NZTA = New Zealand Transport Agency.
Data Compiled From Annual Reports and Select Committee Reports.
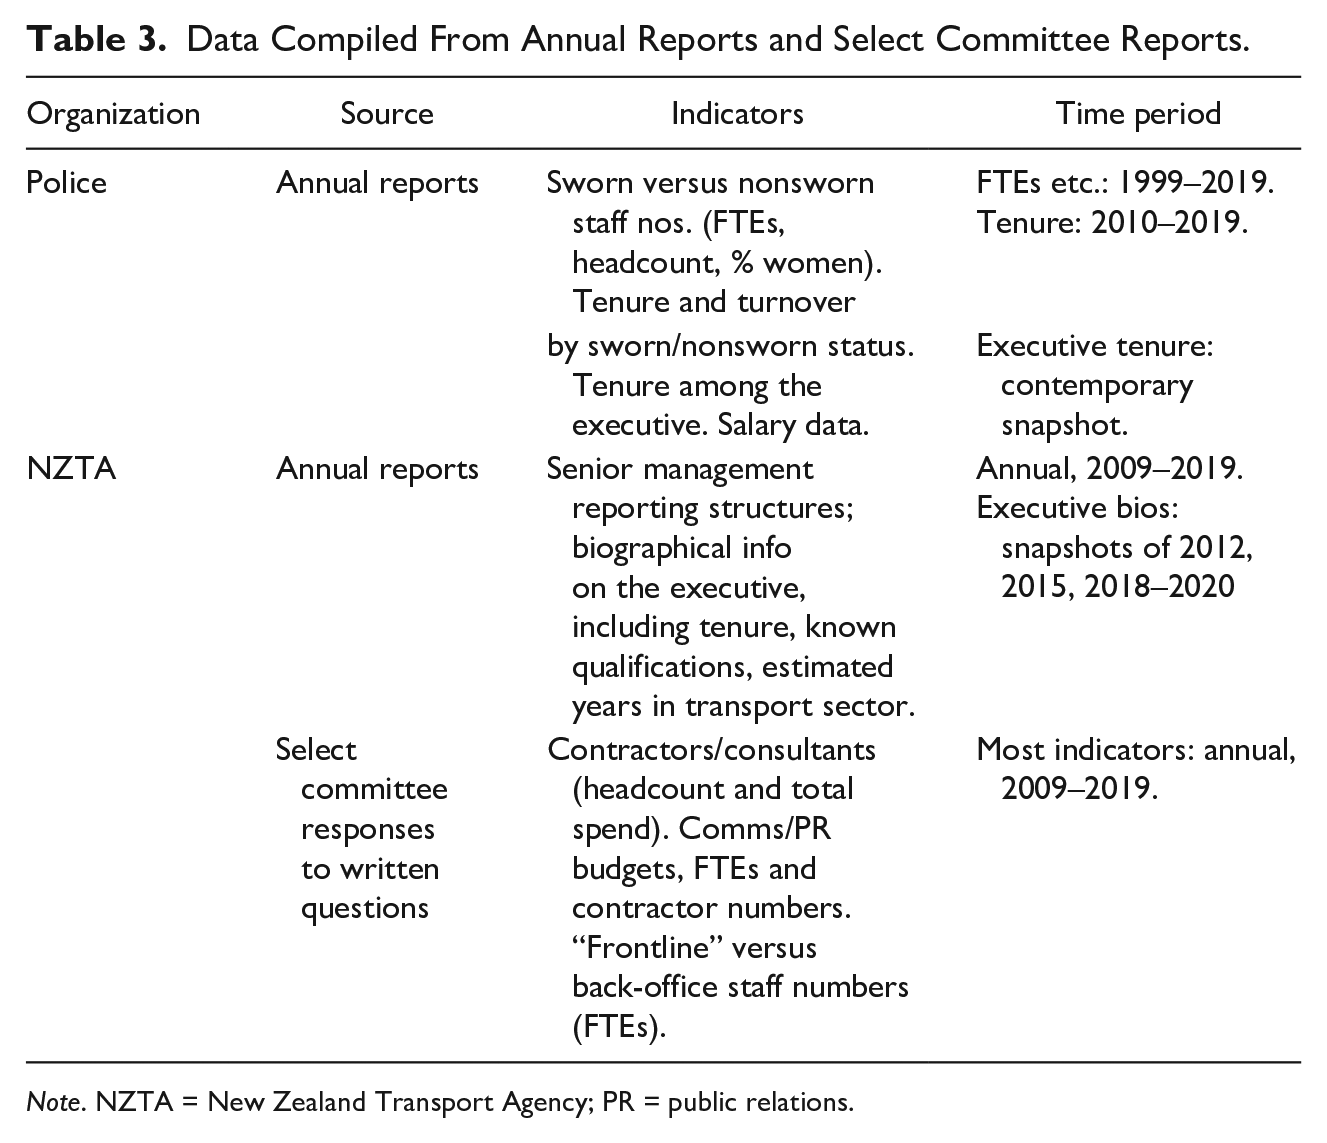
Note. NZTA = New Zealand Transport Agency; PR = public relations.
Bespoke Preparations and Institutional/Restricted Data sets.

Note. SSC = State Service Commission; NZ = New Zealand; ANZSCO = Australian and New Zealand Standard Classification of Occupations; NZTA = New Zealand Transport Agency; FTE = full-time equivalent.
The team was also given bespoke preparations and granted access to restricted, institutional data sets.
Qualitative Data and Analysis
In addition to the quantitative numbers, we adopt an informed respondent strategy sampling some voices of representatives involved in the two cases, and/or in defining professionalism and HR in the public sector. Our 13 respondents represent a broad range of interests including regulatory professional bodies, trade unions, the chief strategic apex of the state sector (the SSC), and representatives from the two case organizations, the Transport Agency and the Police. All the respondents had long time experience working with qualifications, HR, and professionalism. As some of the themes could be perceived as controversial, we decided to anonymise all the responses, and they are only identifiable through a number. The open-ended and semistructured interviews with the respondents were conducted face-to-face or video conferencing, lasted for between 45 and 60 minutes and were all audio-recorded and fully transcribed. The rationale was to capture reflections on our quantitative findings and/or just thoughts around continuity and change in the public sector workforce. The interviews are first and foremost applied as a commentary to the descriptive statistics.
Findings and Analysis
The General New Zealand Picture
The 2006, 2013, and 2018 census data 2 generally show an increase in both “occupational” and “organizational” professionals across NZ over that period, coupled with a decrease in technical, trades, and most clerical/administrative workers. Tables 5 and 6 convey that across the entire population:
Occupational professionals have grown with 50%, organizational professionals with 59% 2006 to 2018 (if we include office managers and program administrators, which possibly can be discussed).
Administrative and clerical staff have grown at a smaller rate than the employed population as a whole.
New Zealand Population (Headcount, Full/Part-Time Residents Aged 15+) by ANZSCO Submajor Occupational Group.
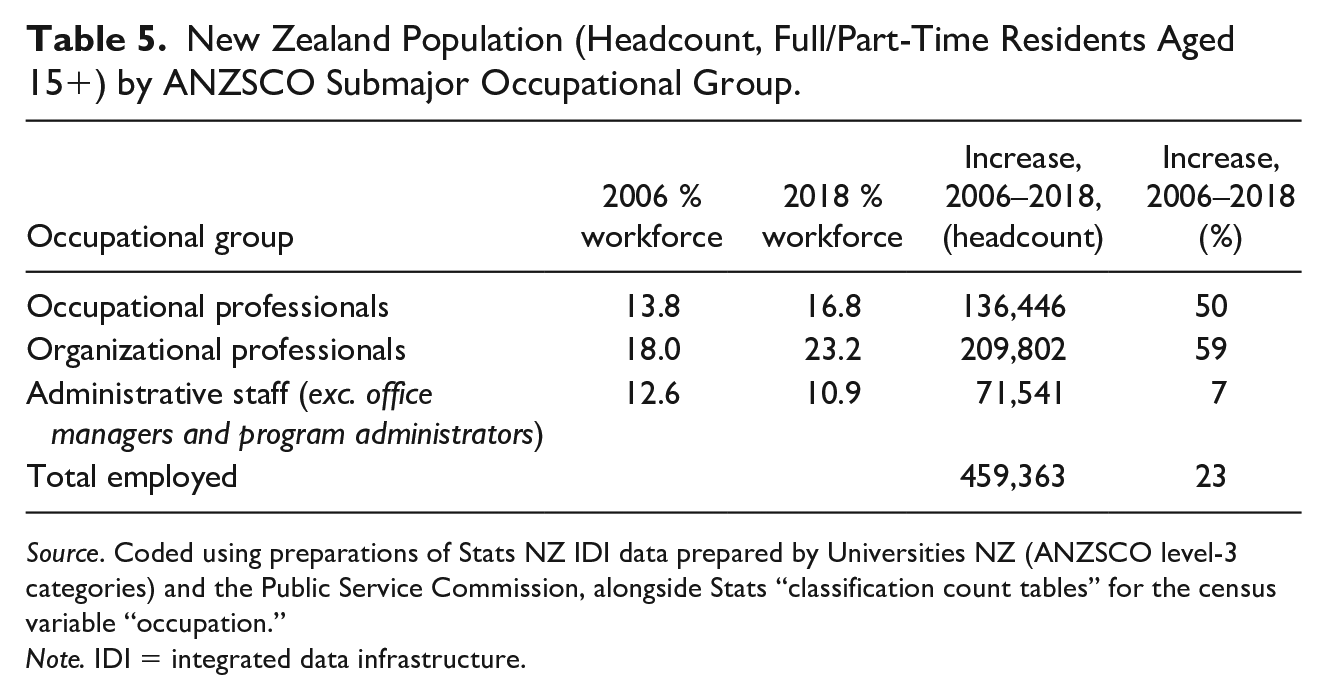
Source. Coded using preparations of Stats NZ IDI data prepared by Universities NZ (ANZSCO level-3 categories) and the Public Service Commission, alongside Stats “classification count tables” for the census variable “occupation.”
Note. IDI = integrated data infrastructure.
Population Change (Increase in Percentage, Increase in Headcount in Brackets) Among Organizational Professionals 2006–2013, by Sector.
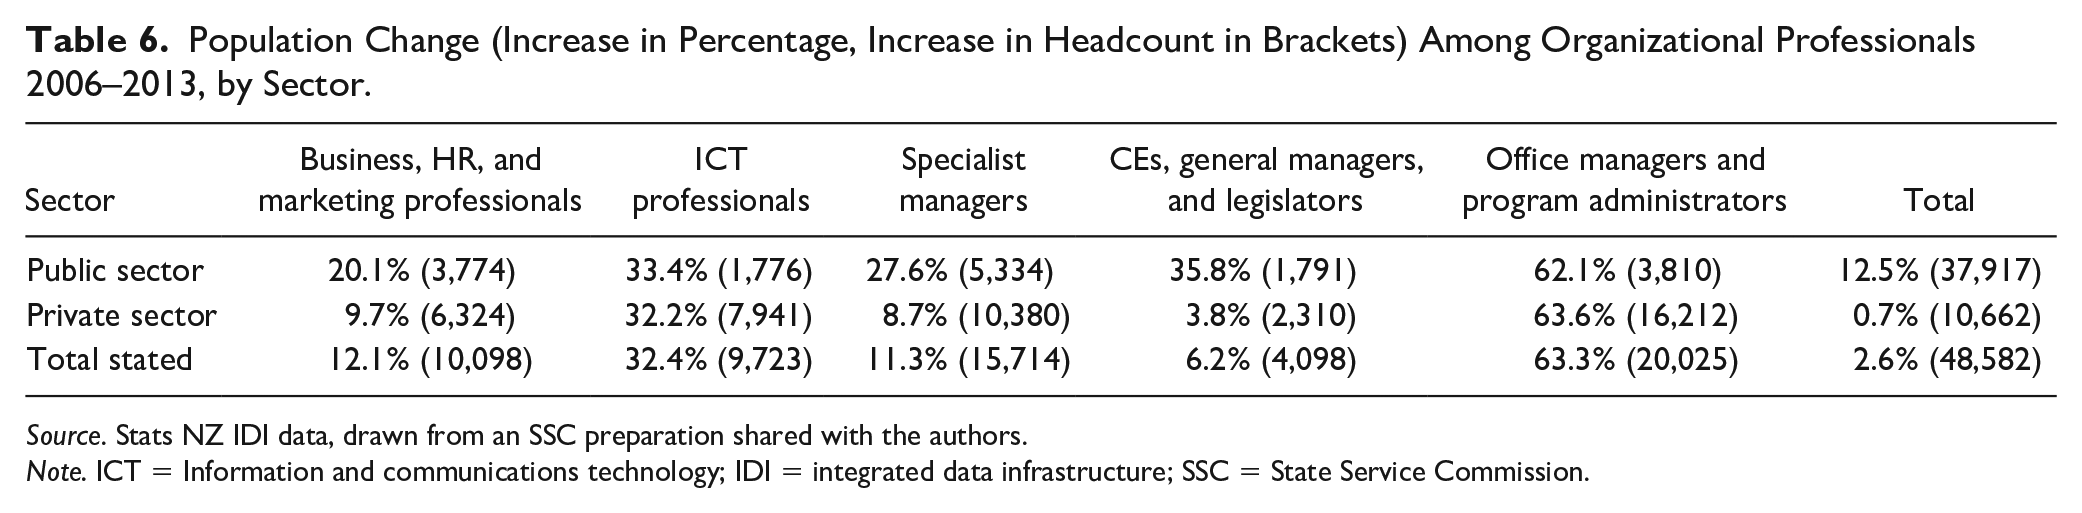
Source. Stats NZ IDI data, drawn from an SSC preparation shared with the authors.
Note. ICT = Information and communications technology; IDI = integrated data infrastructure; SSC = State Service Commission.
The administrative grouping “office managers and program administrators” (which arguably straddles the boundary between professional organizational and administrative functions) grew faster than any of the other 40 ANZSCO submajor categories (Figure 2).

Population-wide increases (%) by submajor ANZSCO occupational group, 2006–2018.
This growth among senior administrators is substantial, perhaps reflecting a shift toward more qualified administrative staff and the “upskilling” of clerical jobs. We also witness an expected decrease in unskilled clerical jobs.
Although office managers and senior administrators grew faster than any other groups in the public sector, this was in line with the group’s national growth. Information and communications technology (ICT) professionals increased by about a third across all sectors. The public sector increase in specialist managers dwarfed its private sector equivalent: for CEs and general managers, this multiple is almost 10. At the unit level, this growth was driven by corporate general managers, who increased by 76.6% in the public service alone. Total workforce growth was only 12.5% over the same period. Hence, managers have witnessed a comparatively significant growth in the public sector and represent an important part of the increase in organizational professionals.
Organizational Professionals in the Core Public Service
Table 7 demonstrates that customer service representatives and information professionals have enjoyed the highest growth among public servants since 2007, when PSWD records began. Interestingly, contact center workers increase at virtually the same pace as clerical and administrative workers decrease. They are followed by occupational (core service) professionals, managers, then other professional organizational support roles and, finally, administrative workers.
Public Service FTE Growth by Customized Public Service HRC Occupational Grouping (Based on ANZSCO L1 Occupational Categories), 2007–2018.
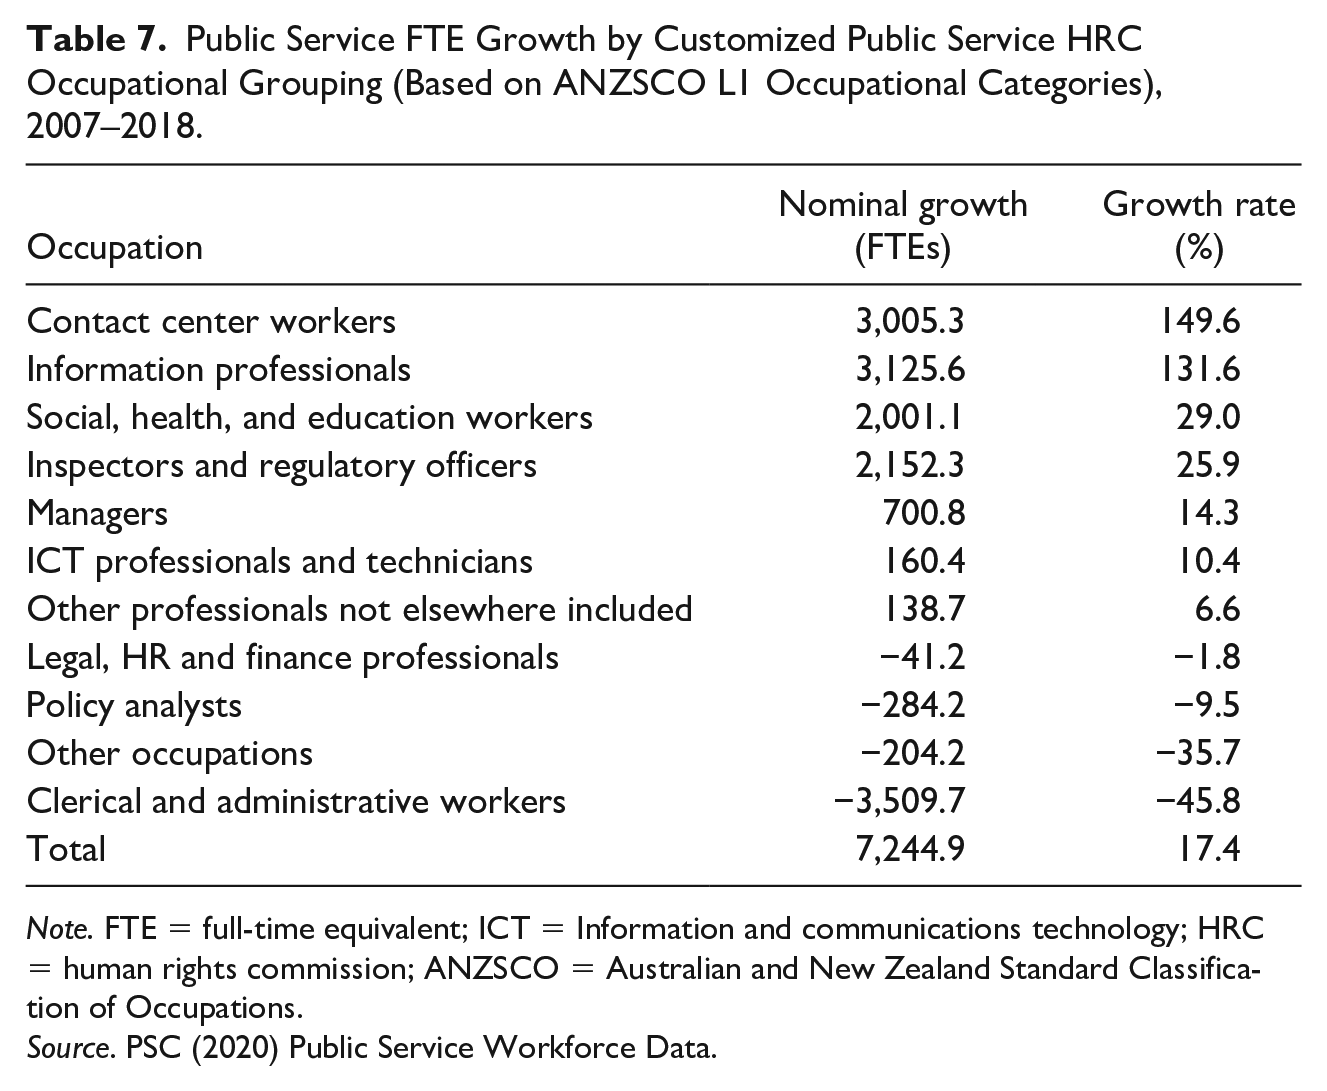
Note. FTE = full-time equivalent; ICT = Information and communications technology; HRC = human rights commission; ANZSCO = Australian and New Zealand Standard Classification of Occupations.
Source. PSC (2020) Public Service Workforce Data.
Figure 3 differentiates between “senior leadership” and lower rungs of management. The numbers of senior (tiers 1–3) leaders fell nominally from 2001 to 2016, even as the total workforce and numbers of middle managers grew (SSC, 2018, p. 23), although 2019 saw the third consecutive year of growth among tier 2 and 3 leaders. Linear estimators display these trends clearly in Figure 3. The rise in middle managers is consistent with the logic of responses to the cap, which meant hiring decisions were constrained more by personnel numbers than costs, skewing recruitment toward higher earners (also mentioned by one of our respondents).
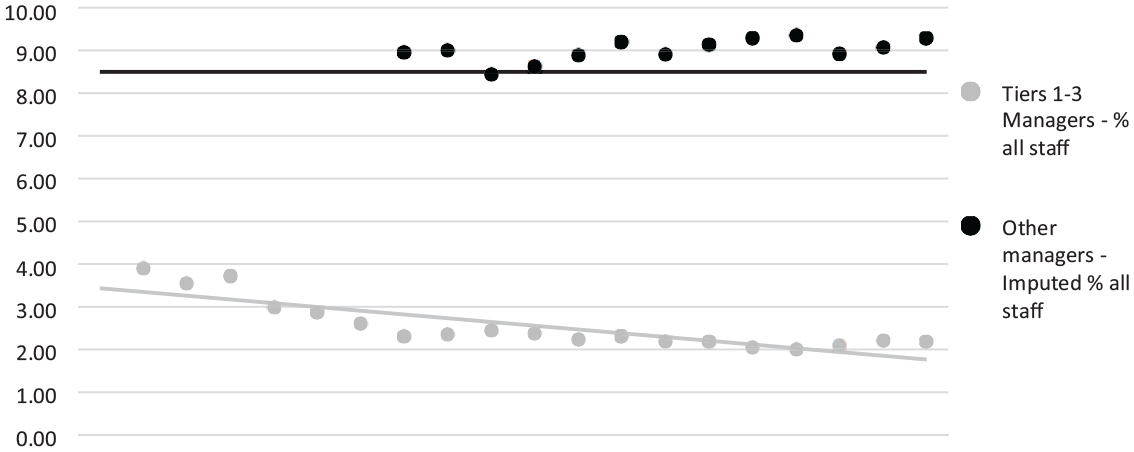
Proportions of public-service-managers.
It should be noted that the census figures presented in Table 6, when they are broken down further by subsector, show specialist managers increasing by 29.3%, office/project managers by 48.7%, and general managers by 58.6%, between the 2006 and 2013 censuses, superficially contradicting the PSWD projection of stable managerial numbers in the public service. However, it seems clear that the higher echelons of management represent a large part of the managerial increase in the public sector.
The Two Individual Organizations
(1) NZTA
The proportion of self-reported frontline/back-office staff 3 has remained stable at about 76%/24% for 11 years, since the agency’s formation. A few general observations can be made. First, managerial numbers are high, making up one sixth of the workforce. Second, contractors/consultant headcounts and spends remained fairly constant until 2013 but have mushroomed since. The numbers of contractors/consultants per employee has risen from 6 or 7 in a hundred, in 2009, to 1 in 2 in 2019 (with an equivalent rise in costs).
The NZTA has undergone a period of heavy restructuring over the last 3 years (Table 8). This took the form of a “botched” initial restructure (in the words of one interview respondent), followed by a period of “turbulence” during which retention of new staff dropped to almost 70%. The executive was overhauled and (rounded) median tenure in the senior leadership team 4 dropped from 7 years in 2015 to zero in 2019.
FTE Growth NZTA 2015–2020. The Coding Scheme Behind the Classification is Included in Appendix.
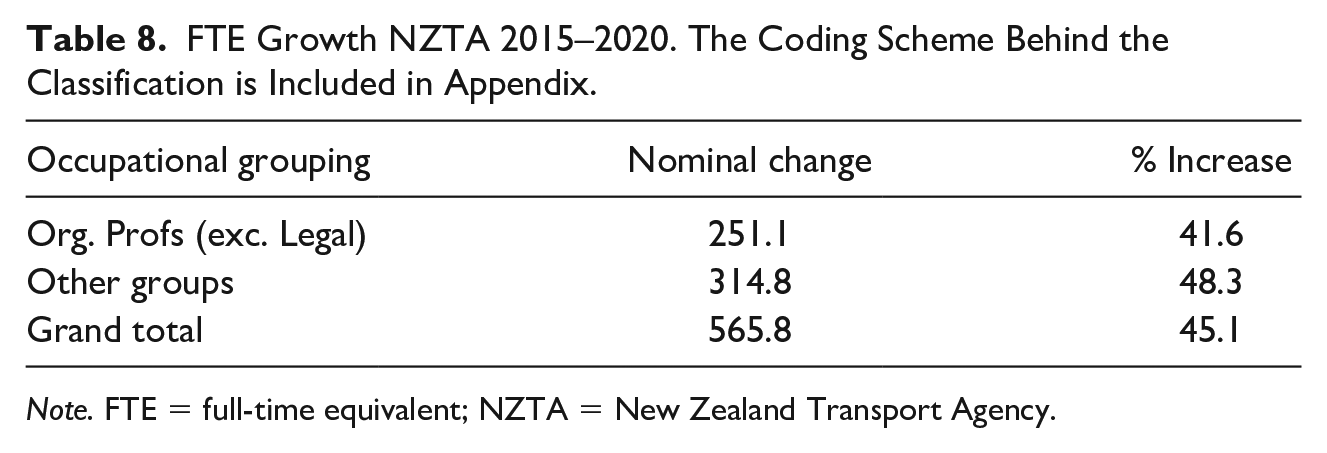
Note. FTE = full-time equivalent; NZTA = New Zealand Transport Agency.
Both organizational professionals and other groups have increased rapidly at the NZTA over the last 5 years (Table 9). Two reasons for this are given in the interviews: first, the removal of the administrative cap, incentivising a move to reduce the reliance on contractors (see above) by hiring permanent personnel instead; second, a boosting of compliance staff following regulatory failures in 2018 and 2019. 5 Organizational professionals comprise some of the fastest- and slowest-growing groups.
Authors’ Groupings of Role Types by Function Area—Nominal and Proportional Staff Increases in the NZTA, 2015–2020.
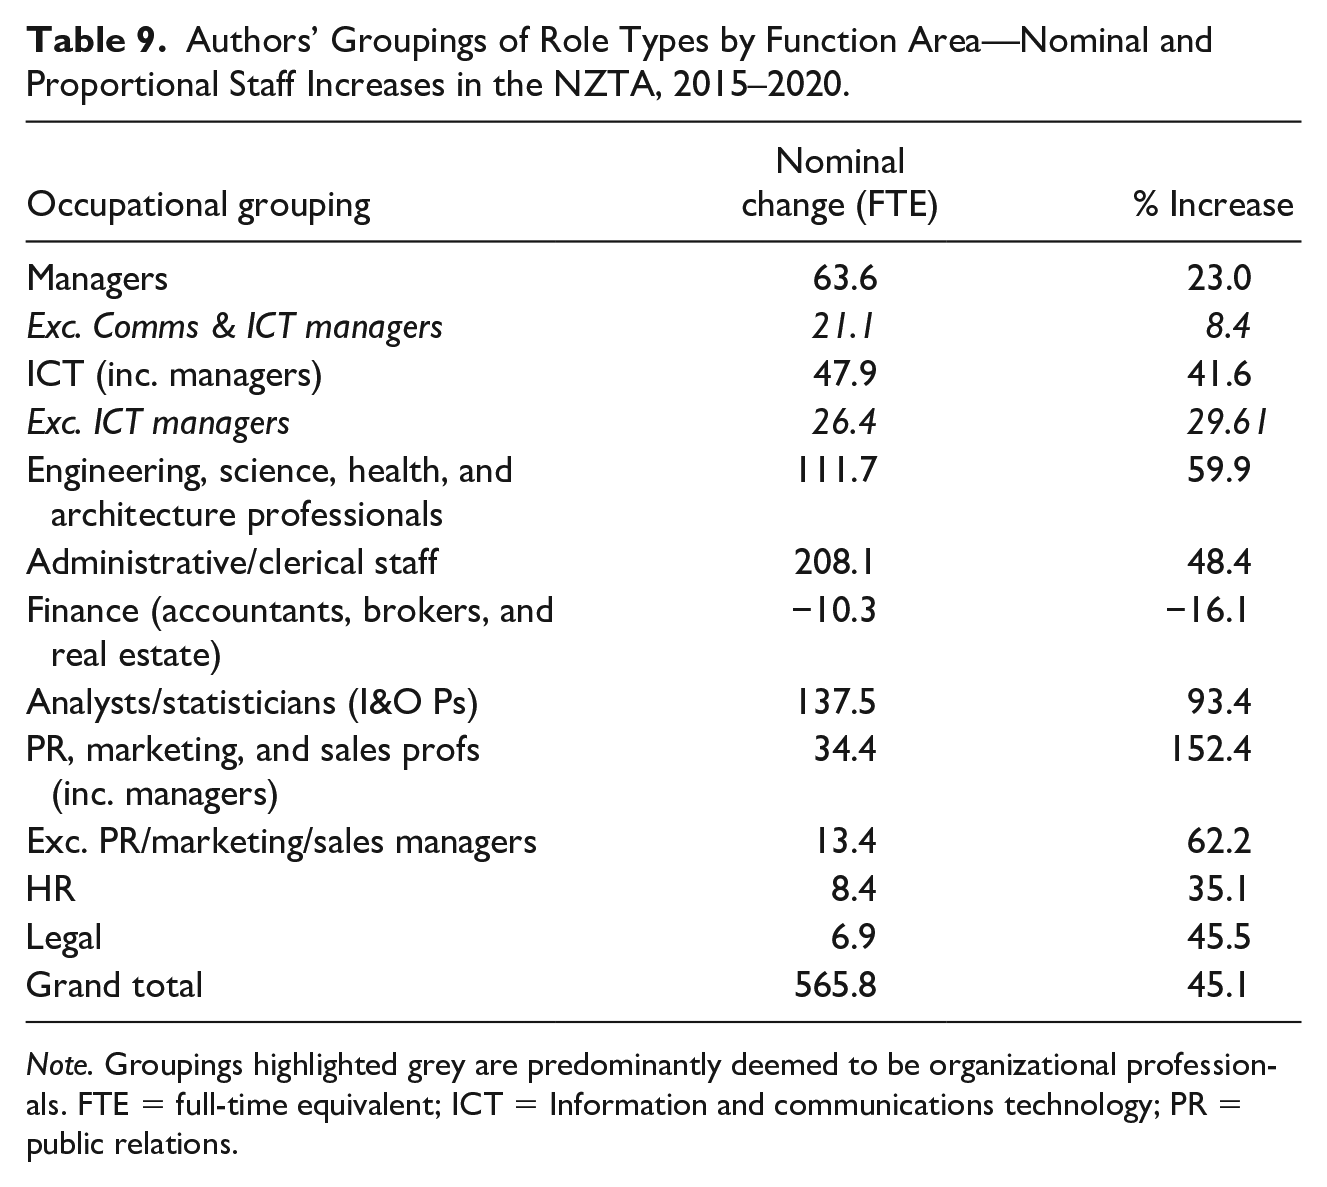
Note. Groupings highlighted grey are predominantly deemed to be organizational professionals. FTE = full-time equivalent; ICT = Information and communications technology; PR = public relations.
The data shows an expansion of managers, communicators, and analysts over these 5 years, but a smaller increase in HR. This is contradicted by one of the interviewed representatives of NZTA who opined that HR has mushroomed, at least 2019-2020. Financial professionals (accountants and auditors) have increased by 20 FTEs, along with accounting clerks; the inclusion of real estate sales professionals and brokers has negated this and presents a picture of a shrinking finance function. In summary, the expansion of agency personnel during recent years consists of several groups, including some of the organizational professional groups, most notably managers.
(2) The NZ Police
The Police represents an organization where senior officers “earn” their positions through dedicated service. The constabulary’s exceptionally high tenure seems to trickle over into the nonsworn (civilian) side. Professional (i.e., civilian) staff typically serve for almost 10 years (among senior leaders, the average was 14.6 6 years in 2020).
Police boast a “lean” back office, claiming that many “back-office staff” are actually in “frontline support” roles, including contact center staff and radio despatchers, and that the “true” back-office numbers only 6 to 700 people in an organization of 13,500 (interview respondent no.7). However, the official back-office/frontline ratio 7 rose steadily from 19.6% in 2000 to 26.1% in 2009 before plateauing, rising again slightly in 2018 (Table 10). Figure 4 shows that budgeted figures proportionally reduce the numbers of nonsworn staff, implying that this upward creep goes against policy objectives. As pointed out by one of our interview respondents from the Police: “the (back-office) work needs to be done though, and government cyclically tries to increase the proportion of sworn staff, then coppers are brought in to fill back-office gaps, and then the government says why aren’t they on the street, and more civilian staff are employed.”
Nonsworn Police Staff Increases by ANZSCO Major Occupational Group, 2015–2020.

Note: The figures yield slightly lower totals than those stated elsewhere, as they exclude 2 to 4 handypersons, 60 “N/As” and 4 untitled employees. ANZSCO = Australian and New Zealand Standard Classification of Occupations.

Historical and budgeted staff numbers of “other” (nonconstabulary) employees in the police, 2000–2023, (% total FTEs).
Tables 11 and 12 include the five ANZSCO categories (out of eight) that make up almost all nonsworn employees with role descriptions. Unlike elsewhere in the public sector, professionals’ growth appears to have been eclipsed by that of both administrators and managers.
Nonsworn Police Staff Increases by “Organizational Professional” Status, 2015–2020 Coded Using Level-5 ANZSCO Occupational Categories.
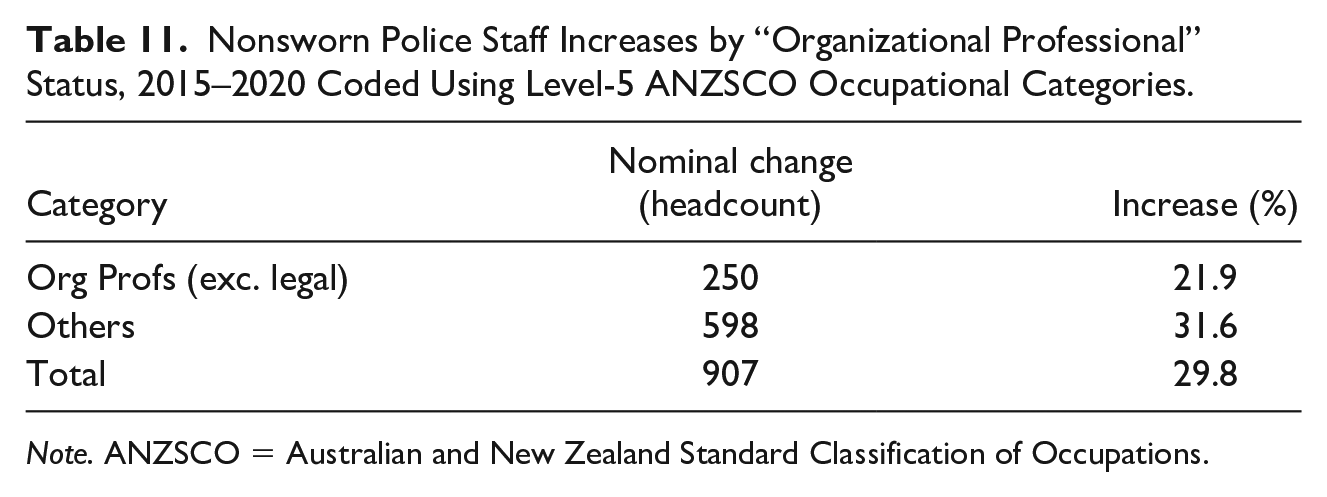
Note. ANZSCO = Australian and New Zealand Standard Classification of Occupations.
Nonsworn Police Staff Increases, by Customized Staff Function Area/Role Type, 2015–2020.
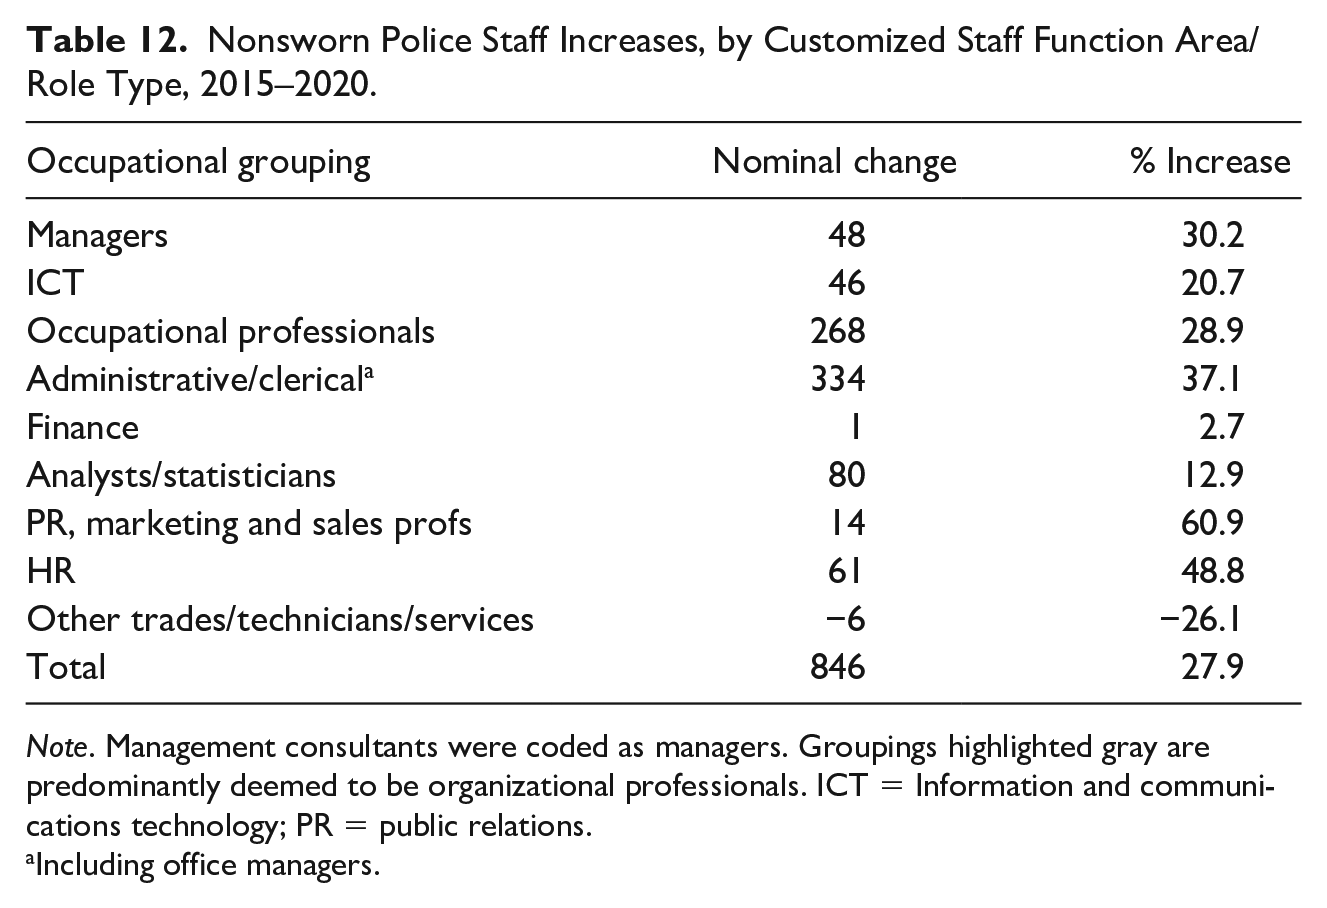
Note. Management consultants were coded as managers. Groupings highlighted gray are predominantly deemed to be organizational professionals. ICT = Information and communications technology; PR = public relations.
Including office managers.
Once again, organizational professionals showcase diverging growth patterns and cannot be associated with any clear, homogeneous trend. Factions within this umbrella constellation of support functions have variously experienced the fastest (communications and HR) and slowest (ICT and finance) growth, as compared to administrative, managerial, and core sector professional staff.
Contravening the common narrative of administrative decline, administrative/clerical staff increased significantly over 5 years—“general clerks” increased by 339 employees (62.4%), although it is unclear how many of these are contact center workers, rather than office clerks. The next-largest (nominal) increase was among “radio despatchers” (233 staff, 44.5%), who fall under the “clerical” ANZSCO grouping but exemplify “frontline support” roles.
Concluding Discussion
While one naturally can object to our crude head-counting approach, it does present us with some thought-provoking findings. Our findings also both confirm and challenge some of the existing body of theoretical assumptions in public administration.
First, our pure workforce data confirms a general growth of organizational professionals, albeit not overpowering. However, if we turn to the more granulated workforce data (and our two case organizations), we notice that there are certain groups that have expanded beyond the average growth; particularly so the subgroup “managers.” Equally, our interviewees confirm the storyline about new, or at least rearranged, groups of organizational professionals mainly working toward the cohesion and accountability of the organization (in e.g., communication, HR, “accountability,” and in general “advisory” and managerial roles). In particular the expansion of managers, new tiers of managers and various new titles and job descriptions in the top echelon of the organization, are factors our respondents have noticed. But as also pointed out by the same group, the traditional meaning of manager as in “people manager” has been supplanted by anyone high up the pay-scale with some kind of “managerial” responsibility in their job description.
Second, contact center workers seem to have grown at virtually the same pace as clerical/administrative workers have diminished. None of these groups are included in our category “organizational professionals” but the development may well be related to an expansion in organizational professionals. An increase in contact center work in the public sector is obviously related to business-mimicking behavior and the expansion in strategic communication.
In conclusion, there is some evidence for the expansion of a new public bureaucracy within the public sector. Occupational professionals are expanding as well, signifying that we are also witnessing a more general trend toward an increasing dominance of qualified jobs (not least academically) at the expense of less-qualified ones—the latter maybe either privatized or virtually disappearing.
The first question we may ask ourselves is naturally what is driving this development? One way to reflect upon our results is the external/internal dimension which was discussed in terms of contingency versus public choice in our review section. Are changes in the composition of the public workforce driven by external factors such as politics, governmental policy, and the economy (Pollitt & Bouckaert, 2017), or are they the outcome of organizational, or even individual motivations? (Pfeffer, 1978). One example of the latter is Dunleavy’s classical bureau-shaping theory (Dunleavy, 1991), according to which bureaucrats do not seek to maximize budgets, or creating large organizations. Instead, the motivation for any (senior) bureaucrat is to “reshape their departments as small staff agencies, removed from the line responsibilities and hence more insulated from adverse impacts in the event of overall spending reductions in their policy area” (Dunleavy, 1989, p. 252). Dunleavy identifies, as a way of example, how policy-making roles (which is included in our new public bureaucracy) are being conceived as more profitable from an individual career perspective than traditional operative functions. The occupational changes in NZTA represents an example of this. The production side (primarily constructing and maintaining roads) is outsourced, while the core organization seems to be overwhelmed by new layers of managers (most untied from people management responsibilities). One of our respondents from the organization describes it as (senior) managers “building up their own little empires of corporate roles.”
However, while individual and motivational factors may play an important role, it is difficult to decide how decisive this motivational explanation really is. Still building on the NZTA case, it is also plausible to argue that the organization mirrors external developments and strives for bureaucratic reputation building (Christensen & Gornitzka, 2018; Boon et al., 2019). Following such a development, it becomes imperative to mirror the counterparts (“alliance partners”) from the private sector (where the organizational professionals have grown as well) but also to brace the organization against any external actor seeking to hold them accountable.
A slightly alternative explanation to the growth of a new public bureaucracy is situated in managerialism per se. Modern public sector managers (and in particularly New Zealand ones) are subjected to performance regimes, with key performance indicators (KPIs) specifying targets to meet for the individual leader (Moynihan, 2009). Besides the fact that these targets make the individual leader vulnerable, gratifying the performance targets require skills and competencies in communication, performance management, human resources, marketing, and so on. Consequently, we are witnessing the creation of “new bureaucratic entourages” with the prime objective of supporting, upholding, and protecting the individual leader. Also, these new cohorts of supporters makes it easier to play the “blame game” (Hood, 2011) deflecting the individual leader from direct external criticism from the political principal, and/or other stakeholders. And it is naturally not farfetched to suspect that this individual strategy is replicated by other parts of the organization.
Second, although we do not witness any overall extraordinary growth numbers in the organizational group, the tendency shows a steady (albeit slower than expected) growth of these cadres of bureaucrats in the public sector offsetting traditional administrative (or clerical) jobs. And despite the lack of longitudinal data from 1990s and back, there is a reason that this has been under way for a long time (which is also confirmed by our respondents). It is possible to suspect that the long-term effects of the managerial reforms in the 1980s are finally manifesting themselves. The previous New Zealand National Party’s government cap on nonessential workers in the public sector just constituted a short and passing interruption in this growth (and where many managers quickly learnt how to bypass the rules).
Finally, we should also ask ourselves what the consequences are for the public sector and its workforce. Notwithstanding the aforementioned on-going administrative intensity discussion and threats to cost-efficiency, there is a concern that the organizational professionals in public sector organizations constitutes an assault on many of the other professional groups working in the public sector (Kolsaker, 2014; Noordegraaf & de Wit, 2012) and in general manifests an occupational estrangement for the individual staff members (something which resonates with the older Marxist discussion on alienation (Jaeggi, 2014) and deskilling (Braverman, 1998[1974])). This is not vindicated in our figures since occupational professionals have expanded at almost the same degree as organizational professionals. But more than anything, the effects of this growth of public bureaucrats should be seen in light of the power structures of the individual workplaces. The new cohorts of managers, communication officers, HR advisors, and risk analysts are perpetuating the maintenance and justification of the existing power structures bracing the “leader.”
The brief descriptive identification of the rise of a new public bureaucracy presented in this article raises a number of questions for future research. Apart from sectoral and jurisdictional differences, we lack empirical evidences on how this group differs from other segments of the public sector workforce in terms of careers, salaries, and conditions, demography, and educational backgrounds. Another imperative question is also how this development resonates with the current body of literature on public sector reforms around the world.
Footnotes
Appendix
Coding Example: Organizational Professionals in the NZTA (1 = Yes; 0 = No)

| ANZSCO L3 Occupational category | Organizational professional? |
|---|---|
| Accountants, auditors, and company secretaries | 1 |
| Advertising, public relations, and sales managers | 1 |
| Business administration managers | 1 |
| Business and systems analysts and programmers | 1 |
| Chief executives, general managers, and legislators | 1 |
| Construction, distribution, and production managers | 1 |
| Database and systems administrators, and ICT security specialists | 1 |
| Education, health, and welfare services managers | 1 |
| Financial brokers and dealers, and investment advisers | 1 |
| Health diagnostic and promotion professionals | 1 |
| Human resource and training professionals | 1 |
| ICT managers | 1 |
| ICT network and support professionals | 1 |
| Information and organization professionals | 1 |
| Legal professionals | 1 |
| Media professionals | 1 |
| Miscellaneous hospitality, retail, and service managers | 1 |
| Miscellaneous specialist managers | 1 |
| Sales, marketing, and public relations professionals | 1 |
| Accounting clerks and bookkeepers | 0 |
| Architects, designers, planners, and surveyors | 0 |
| Building and engineering technicians | 0 |
| Call or contact center information clerks | 0 |
| Contract, program, and project administrators | 0 |
| Engineering professionals | 0 |
| Financial and insurance clerks | 0 |
| General clerks | 0 |
| ICT and telecommunications technicians | 0 |
| Keyboard operators | 0 |
| Logistics clerks | 0 |
| Miscellaneous clerical and administrative workers | 0 |
| Miscellaneous education professionals | 0 |
| Natural and physical science professionals | 0 |
| Personal assistants and secretaries | 0 |
| Prison and security officers | 0 |
| Real estate sales agents | 0 |
| Receptionists | 0 |
Note. NZTA = New Zealand Transport Agency; ANZSCO = Australian and New Zealand Standard Classification of Occupations; ICT = Information and communications technology.
Declaration of Conflicting Interests
The author(s) declared no potential conflicts of interest with respect to the research, authorship, and/or publication of this article.
Funding
The author(s) disclosed receipt of the following financial support for the research, authorship, and/or publication of this article: The research was funded by the Swedish Research Council for Health, Working Life and Welfare (STYA-2019/0002).