



Abstract
Previous research demonstrates that children delineate more nuanced color boundaries with increased exposure to their native language. As socioeconomic status (SES) is known to correlate with differences in the amount of language input children receive, this study attempts to extend previous research by asking how both age (age 3 vs 5) and SES (under-resourced vs advantaged) might impact color name acquisition of preschool children. The results confirm the findings of previous research, showing that older children labeled the color continuum more accurately than did younger participants. In addition, we found that while SES did not make a difference in how children labeled the continuum using basic color terms (e.g. blue), basic color terms with achromatic modifiers (e.g. light blue), and compound terms (e.g. blueish-green), 5-year-olds from more advantaged economic environments used significantly more non-basic color terms (e.g. turquoise) compared to their counterparts from under-resourced environments. We suggest that, as children hear more non-basic terms, these world-to-word mappings become solidified, and exposure to such labels may contribute to the timing of when children can map those terms to the color continuum.
Research on vocabulary learning has traditionally focused on children’s ability to label the typical referents of words, the best examples of semantic categories (e.g. Carey & Bartlett, 1978; Markman, 1989). Relatedly, most conventional standardized vocabulary tests for children, such as the Peabody Picture Vocabulary Test (PPVT; Dunn & Dunn, 2007), only assess whether children are able to identify a prototypical referent of a word among a few reasonably dissimilar options. Adding more questions to standardized tests might be challenging, but a growing body of evidence suggests the importance of recognizing the complexity of the vocabulary children learn and emphasizes the need to understand how children learn typical as well as atypical referents of words (Ameel et al., 2008; Saji, Imai, & Asano, 2020; Saji, Imai, Saalbach, et al., 2011; see also Göksun et al., 2010; Seston et al., 2009). The present study uses the learning of color terms as an example to explore developmental changes in word knowledge and the effects of the social environment on the learning process.
Much research aims to understand how children learn to associate a word with a referent. Even very young infants are able to fast-map words onto denotata (i.e. infer the meaning of a novel word when they first encounter it) (Carey & Bartlett, 1978; Golinkoff et al., 1992; Spiegel & Halberda, 2011). Children also learn the meanings of words by encountering different referents of those words (Oakes et al., 1997; Perry et al., 2010). For example, by seeing different types of birds and hearing the label bird, children extract the essential semantic features of the category and develop an adult-like representation of birds. A less-explored question is how children determine all members of a category, including both typical and atypical examples, and find the boundaries of categories within a semantic space of different domains.
The question of boundary finding has been explored in some domains. Eve Clark’s (1973, 1978, 1987) work demonstrated that young children often apply one term to various objects. For example, a child might first extend the term dog to cats, sheep, and other four-legged animals, and eventually narrow down their overextensions. Ameel et al. (2008) also examined how children ranging from ages 5 to 14 years name various types of containers. They found that, over time, children paid more attention to adult-like features of these objects when naming them, likely driven by a reorganization in lexical categories as children aged. More recently, Saji, Imai, Saalbach, et al. (2011) explored how Chinese-speaking 3-, 5-, and 7 year-olds learn the semantic boundaries between 13 Chinese action verbs that are denoted by the verbs carry and hold in English. Results showed that, even at age 7, the pattern of verb use in children was largely different from that of adults, indicating that finding exact boundaries takes much longer than learning to produce words (see also Göksun et al., 2010; Seston et al., 2009). Similarly, learning to produce adult words for time duration (e.g. minute, hour, year; Shatz et al., 2010) and emotion words (e.g. fear, sadness, happiness; Widen & Russell, 2008) takes many years.
Word learning is a long and continuous process of understanding all meanings encompassed by each word, and the environment of the child can have significant effects on the process. Indeed, Vygotsky theorized that children’s language acquisition occurs in and is inherent to the social environment (Vygotsky, 1986). It is well documented that socioeconomically advantaged caregivers tend to talk more, use more diverse vocabulary, and engage in higher quality language interactions with their children compared to caregivers from less-advantaged backgrounds (Gilkerson et al., 2017; Golinkoff et al., 2019; Hart & Risley, 1995; Hoff, 2013; Rowe, 2008). Moreover, many children grow up in environments with structural inequalities that may impact learning (i.e. unsafe neighborhoods, food deserts, housing instability, and access to high-quality childcare and healthcare, just to name a few). Research documents there are differences in language ability between children from disadvantaged backgrounds and their more advantaged peers before the age of 3 (Fernald et al., 2013; Golinkoff et al., 2019; Hart & Risley, 1995).
How differences in children’s early experiences and exposures impact the complex process of learning lexical boundary delineations is less well explored. Therefore, in addition to documenting the complex process of finding category boundaries by examining the color term knowledge of English-speaking children, we provide novel insights regarding the use of more precise color terms (e.g. aqua and light blue) and the influence of the learning environment.
Finding colors
Children’s acquisition of color terms (referred to as CTs moving forward) offers a particularly good case for evaluating the question of finding category boundaries because there are a seemingly infinite number of colors on the continuum. Consider, for example, just some of the hues that reside on the blue color continuum: sky, indigo, navy, sapphire, azure, lapis, and many more. Moreover, studies reveal that even infants as young as 4 months categorize colors into groups (Maule & Franklin, 2019; Skelton et al., 2017). Although every sighted child with no color blindness can perceive the same colors regardless of their language (Franklin et al., 2005), languages differ dramatically in how they carve up the color continuum – English has 11 basic CTs (black, white, red, green, yellow, blue, brown, orange, pink, purple, and gray), whereas the Dani language in Papua New Guinea has only two (mili ‘dark’ and mola ‘light’; Heider, 1972).
Recent research also demonstrates that the order in which certain CTs are learned varies between languages (Forbes & Plunkett, 2020; see also Roberson et al., 2004). Some researchers posit that the delay between color term production and the adult-like understanding of CTs reflects a process through which children slowly determine the language-specific boundaries of color words (Wagner et al., 2013). In two tasks, Wagner et al. (2013) presented young children (between 22 and 61 months of age) with 11 different colors one by one. They found that a significant portion of children’s errors were ‘overextensions’, where they assigned broader meanings for certain color words (e.g. correctly labeling a red object as red, but also labeling orange and yellow objects as red). In other words, an adult-like understanding of CTs appears as children learn to determine the boundaries of linguistic color categories. The authors posit that children go from making broad hypotheses about color meaning to gradually narrowing those meanings as they gain linguistic exposure. Likewise, Istomina (1963) identified young Russian children’s early overextensions and later narrowing of CTs with development. Similarly, Pitchford and Mullen (2003) found that as young children acquire more CTs with age, ‘the mappings between perceptual colour categories and conceptual colour space become increasingly refined’ (p. 69).
To probe the details of this learning process, Saji, Imai, and Asano (2020) asked Japanese-speaking 3-, 4-, and 5-year-old children and adults to name 93 color swatches. The data suggest that linguistic mapping of the color space becomes refined as children are exposed more to the ambient language with age. For example, Japanese children must learn that there is a cluster of pale blues that are not labeled ao (blue), rather mizuiro (light blue), and then narrow down the overextended area of ao. Saji, Imai, and Asano (2020) also demonstrated that both quantity (input frequency of words) and quality (e.g. consistent application of the word along the category boundary) of the adult’s input are important for the developmental change toward the adult-like color lexical system as a connected whole (see also Kinnear & Sahraie, 2002; Knoblauch, Vital-Duran, & Barbur, 2001 for age-related changes in color vision).
As the first to test a wide space of color (93 color swatches), Saji, Imai, and Asano (2020) provided important theoretical and practical insights into the boundary finding process. However, several issues are left to be addressed, three of which the current study explored. First is the generalizability of their findings. The findings by Saji, Imai, and Asano (2020) must be evaluated through extension. This study adopts the method used by their research team and extends the original finding with English-speaking 3- and 5-year-olds. Second, in addition to age-related developmental changes, we explored the variability among children of the same age. In particular, we examined the influence of the child’s language learning environment based on socioeconomic status (SES). The link between SES and language ability has been of major concern across the globe as children from less resourced environments, on average, hear and learn fewer words than their peers, and these language differences seem to remain as children grow older (e.g. Cartmill et al., 2013; Hirsh-Pasek et al., 2015; Hoff, 2003). The relation between children’s color word knowledge and SES has not been explored, but work by Yurovsky et al. (2015) found that parental input frequency of color words is significantly correlated with children’s color word knowledge.
Based on the study by Levine et al. (2020), which found on a standardized language screener that 5-year-olds from underprivileged backgrounds were up to 2 years behind their more advantaged peers on a variety of language skills, we hypothesized that the color-naming abilities of 5-year-olds from under-resourced environments might be comparable to that of 3-year-olds from more advantaged backgrounds. To test this hypothesis, we recruited 5-year-olds from under-resourced environments and from more advantaged environments. Third, we examined the use of more precise color words including non-basic color terms (e.g. aqua, magenta) (referred to as non-BCTs moving forward) which are not part of the 11 English basic CTs, basic color terms (referred to as BCTs moving forward) with achromatic modifiers (e.g. light blue, dark green), and compound terms that combined two CTs (e.g. bluish green, yellowish pink).
Our hypotheses are as follows:
Hypothesis 1 (H1). Three-year-olds would have less adult-like semantic boundaries (e.g. using the same label – red – for both red and purple swatches) and produce fewer precise CTs compared to 5-year-olds
Hypothesis 2 (H2). Five-year-olds from under-resourced backgrounds would show less adult-like semantic boundaries and produce fewer precise CTs than their peers from more resourced environments.
Method
Participants
Twenty-one 3-year-olds (Nfemale = 10; Nmale = 11) and thirty-eight 5 year-olds (Nfemale = 16; Nmale = 22) participated in the study. All 3-year-olds were recruited from a township near Philadelphia, Pennsylvania, USA, where the median income for a household was US$114,755 in 2017 (U.S. Census Bureau). Among the thirty-eight 5-year-olds, 18 were also recruited from the same township (Nfemale = 6; Nmale = 12; hereafter referred to as 5-year-olds from more advantaged SES environments [ASEs]). Because these two groups were recruited from the same township, they are matched on income level.
Twenty 5-year-old children (Nfemale = 10; Nmale = 10) were recruited from (and tested in) three Head Start locations in the suburbs of Philadelphia (hereafter referred to as 5-year-olds from under-resourced environments [UREs]). Head Start is a federally funded early childhood education program for families who earn no more than 100% of the federal poverty line. In 2017, when the study was conducted, the federal poverty line was US$24,600 for a family of four. These children participated in a quiet room located at their schools, and the 3- and 5-year-old children from more advantaged backgrounds were tested in the laboratory setting.
Twenty native English-speaking adults (Nfemale = 12; Nmale = 8) were also tested in a laboratory setting in a suburb of Philadelphia to determine the ‘correct’ (culturally appropriate) names for the color swatches. All participants were native monolingual English speakers.
Materials
Following Saji, Imai, and Asano (2020), we used 93 color swatches derived from the Practical Color Coordinate System (PCCS) 1 and developed by the Japan Color Research Institute (Nayatani, 2003; Figure 1).
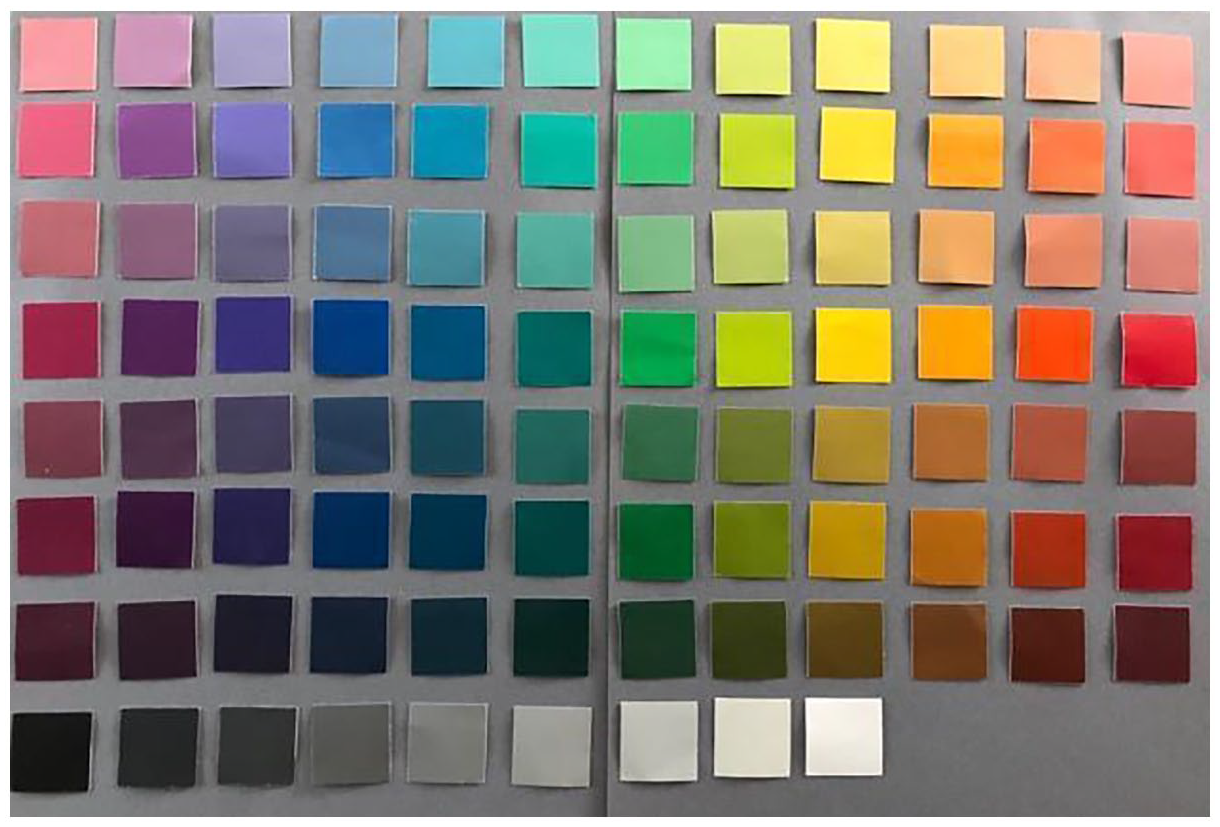
Image of the 93 Color Swatches Shown to Participants.
Procedure
All participants saw each of the 93 color swatches one at a time in random order. A trained experimenter presented the swatches to participants on a gray background and a second experimenter recorded responses. Children received the following instructions: Today we are going to play a color game! I am going to show you different colors on this piece of paper. I want you to look at the colors carefully and tell me what you think each color is. You can use words like green, blue, and red . . . any color name you know. And if you don’t know, you can say you don’t know.
If a child responded that they didn’t know the name of a particular swatch, the researcher encouraged them to take their best guess. If a child still did not know the label, the response was recorded as ‘Don’t know’ and was only used in the Multidimensional Scaling (MDS) analysis (see below).
Adult participants received the following instructions: I will show you various colors one by one, using these chips. Please say the name of each color. There are some rules you need to follow for naming them. Please choose ordinary names that even young children would understand. For each of the color chips, please come up with a basic color name – for example, red, blue, and black. However, if necessary, it is okay for you to add adjectives like dark blue and light red. It is also fine to combine basic color names to form a compound such as blueish green. Do not use color names that are not commonly used, such as lavender or burgundy. Also, do not say something like, wine color that can be interpreted as different colors such as red and white. Once again, please make sure that you use basic color names that 3-year-old children would know.
Adults saw the 93 color swatches in one session, without a break. Children went through three sessions where 31 swatches were presented. Between these sessions, children watched a 2-minute child-friendly video on a tablet. After the study, children received a small prize.
Results
We first present data that probed any differences on children’s color-naming accuracy based on age and SES. Adult data were used as the ‘correct’ responses to which children’s responses were compared (detailed in Analysis 1). We then present data that asked if there were any age or SES differences in providing more precise CTs (detailed in Analysis 2).
Analysis 1: accuracy
Accuracy was determined by comparing children’s responses to adults’ responses on 72 chips in which 75% or more adults agreed upon a color term. Table 1 summarizes the proportion of children who correctly named the most typical referent color swatch for each word. These 72 CTs were all single-word, basic color term responses (e.g. blue, green, red). When children produced BCTs with achromatic modifiers (e.g. light blue) or compound terms (e.g. bluish green), only the heads in phrases (e.g. blue in light blue and green in bluish green) were coded for accuracy calculation. Children’s use of more precise terms including non-BCTs, BCTs with achromatic modifiers, and compound terms are captured in our second set of analyses reported in the next section.
Proportion of children who produced the correct word for the most typical referent of each color category.
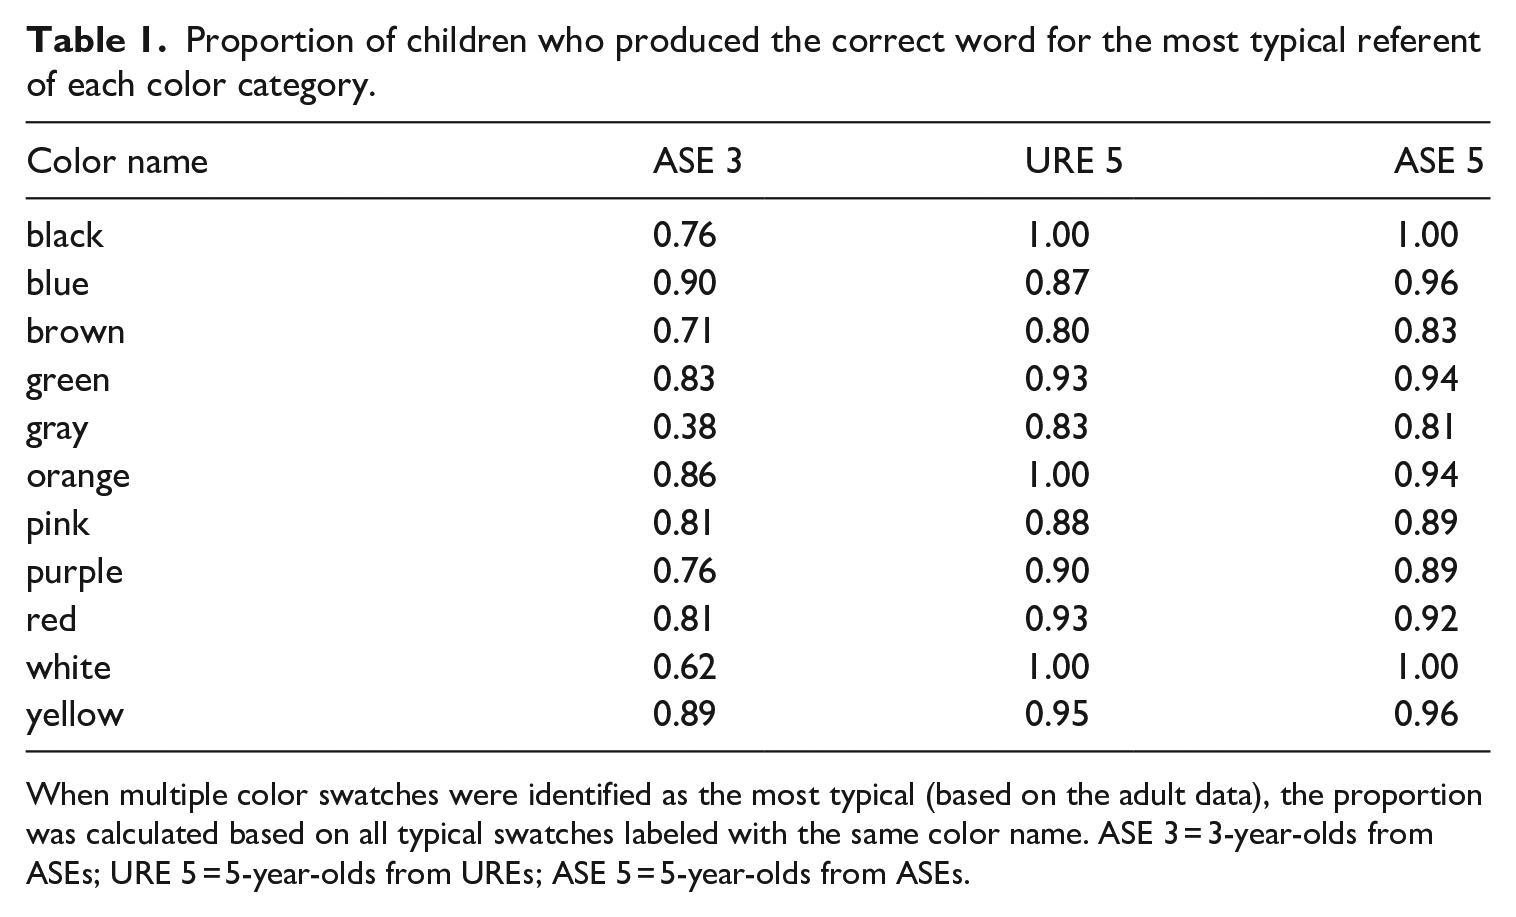
When multiple color swatches were identified as the most typical (based on the adult data), the proportion was calculated based on all typical swatches labeled with the same color name. ASE 3 = 3-year-olds from ASEs; URE 5 = 5-year-olds from UREs; ASE 5 = 5-year-olds from ASEs.
Independent samples t-tests were run to determine differences in providing adult-like responses between the groups. There was a significant age difference between 3- and 5-year-olds in giving adult-like responses (i.e. providing the same basic color name adults agreed on for a given swatch), t(37) = 2.50, p = .02. Five-year-olds from ASEs provided an average of 59.78 adult-like responses (M = 59.78; SD = 5.29) and 3 year-olds from ASEs gave an average of 53.81 adult-like responses (M = 53.81; SD = 8.85). There was no SES difference in giving adult-like responses, t(36) = 0.44, p = .66, with 5 year-olds from UREs giving an average of 58.85 adult-like responses (M = 58.85; SD = 7.46). Three-year-olds from ASEs gave an average of 1.37 ‘I don’t know’ responses and 5-year-olds from UREs gave an average of 1.40 ‘I don’t know’ responses, which was not a statistically significant difference. 5-year-olds from ASEs gave an average of 0.11 ‘I don’t know’ responses, and this was significantly different from the amount of ‘I don’t know’ responses given by the 5-year-olds from UREs (p = .01) and from the amount of ‘I don’t know’ responses given by the 3-year-olds from ASEs (p < .01).
We conducted another analysis to ask whether children and adults named typical and atypical shades of color categories differently. As we did for the most typical swatches for the basic 11 color categories (see Table 1), we identified the most atypical swatches for each color name based on the responses of adult participants. A Typicality (typical vs atypical) × Group (3-year-olds from ASEs vs 5-year-olds from UREs vs 5-year-olds from ASEs vs adults) analysis of variance (ANOVA) tested the number of correct labels produced by participants. We found the main effects of Typicality, F(3,132) = 10.754, p < .001, and Group, F(1, 132) = 315.795, p < .001, but no interaction between the two, F(3,132) = 0.669, p = .573. According to Tukey’s honestly significant difference (HSD) post hoc test comparing all four groups, adults (M = 17.05, SD = 4.53) produced the dominant name of each swatch more frequently than did any of the child groups (M = 13.74, SD = 5.44, p < .001 for 3-year-olds from ASEs; M = 15.2, SD = 5.35, p = .04 for 5-year-olds from UREs; and M = 13.74, SD = 5.25, p < .001 for 5-year-olds from ASEs), but no difference was found among the three child groups (p = .14 for 3-year-olds from ASEs vs 5-year-olds from UREs; p = 1.00 for 3-year-olds from ASEs vs 5-year-olds from ASEs; and p = .14 for 5 year-olds from UREs vs 5 year-olds from ASEs). These results suggest that typicality affected the responses regardless of age although the responses of adults were more consistent than those of children.
To get a more accurate picture of how children delineated the boundaries of the color space, we conducted a multidimensional scaling (MDS) procedure (see Malt et al., 1999; Saji, Imai, Saalbach, et al., 2011). MDS is a method that uses a distance to represent the similarity of two data points so that relations among all points can be visually represented and interpreted easily. We used the PROXSCAL algorithm implemented in IBM SPSS Statistics 22 to conduct the nonmetric-MDS solution. For the MDS input, we created similarity 93 × 93 matrices with each row and column representing the stimulus color swatches for each group (i.e. Three-year-olds from ASEs, 5-year-olds from UREs, 5 year-olds from ASEs, and adults). Each cell in the matrix contained the number of times the two swatches were named with the same term by each participant. Note that these terms were always single-word, basic color term responses (e.g. red). We conducted the MDS solutions with the 4 matrices that visually demonstrated how participants categorized the swatches with color names by plotting similarly named color swatches close to each other. ‘Don’t know’ (DK) responses were coded as different labels (e.g. DK1 for Swatch A, DK2 for Swatch B, etc.). Thus, DK responses contributed to distancing the swatches in MDS space (the same procedure was adopted by Saji, Imai, & Asano, 2020).
The results based on adult responses showed that the chromatic (e.g. non-black, non-white, non-gray) and achromatic swatches (e.g. black, white, gray) were clearly separated. This indicates that the adult participants did not confuse their naming of achromatic swatches with chromatic swatches, so some of the achromatic swatches were outliers within the MDS solutions. Because we were specifically interested in how children categorize the continuous color space, a second MDS analysis was conducted for each group (adults and the 3 child groups) on only the 84 chromatic swatches. We adopted three-dimensional solutions, and the stress values were substantially low (0.06, 0.05, 0.05, and 0.10 for adults, 5-year-olds from ASEs, 5-year-olds from UREs, and 3-year-olds from ASEs, respectively). The MDS solutions are presented in Figures 2 and 3. The points in the figures correspond to the 84 swatches, and the colors of dots approximate the colors of the original swatches. Each point represents a color swatch, and the distance between any two points reflects the naming similarity of the two swatches (i.e. the likelihood of the pair being labeled by the same color term). In other words, the distance between two points on the MDS plane indicates the degree of disagreement in naming.
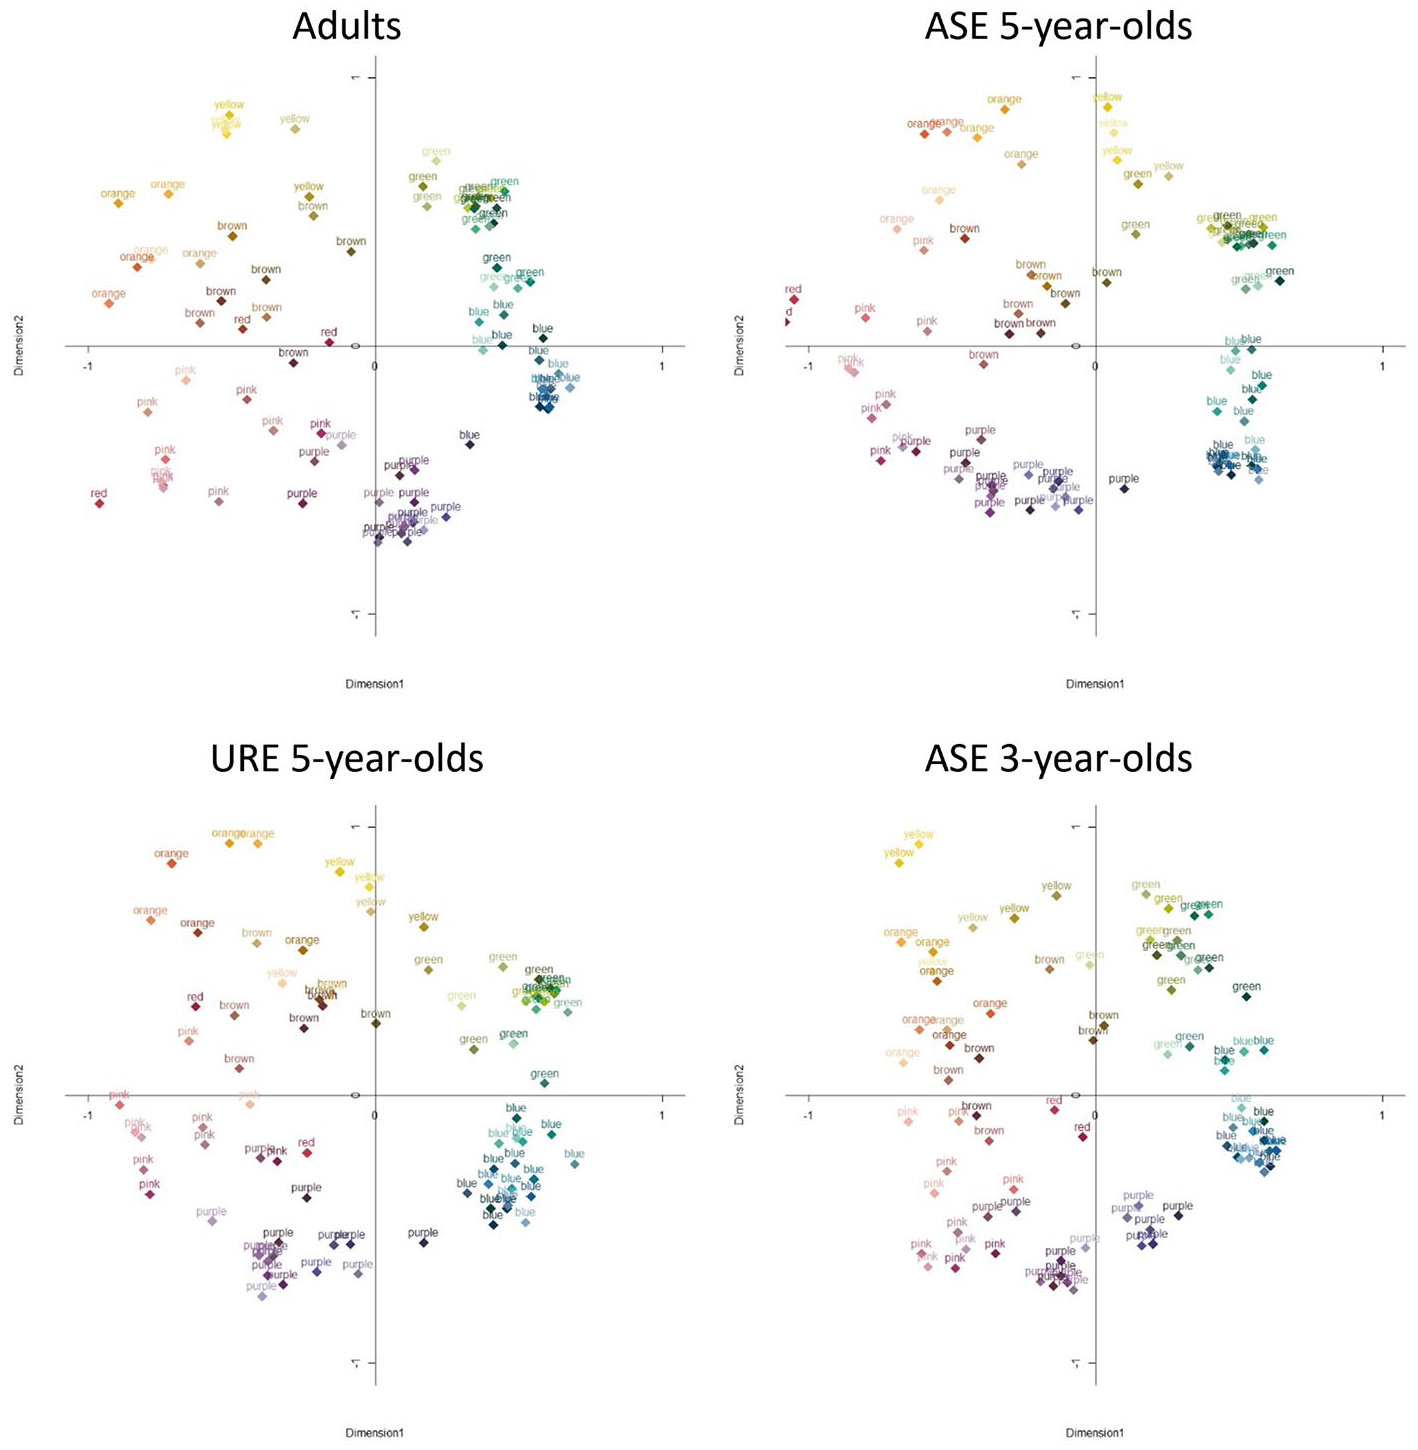
Multidimensional Scaling (MDS) Solutions for Adults, 5-Year-Olds from ASEs, 5-Year-Olds from UREs, and 3-Year-Olds from ASEs (Dimension 1 and Dimension 2).
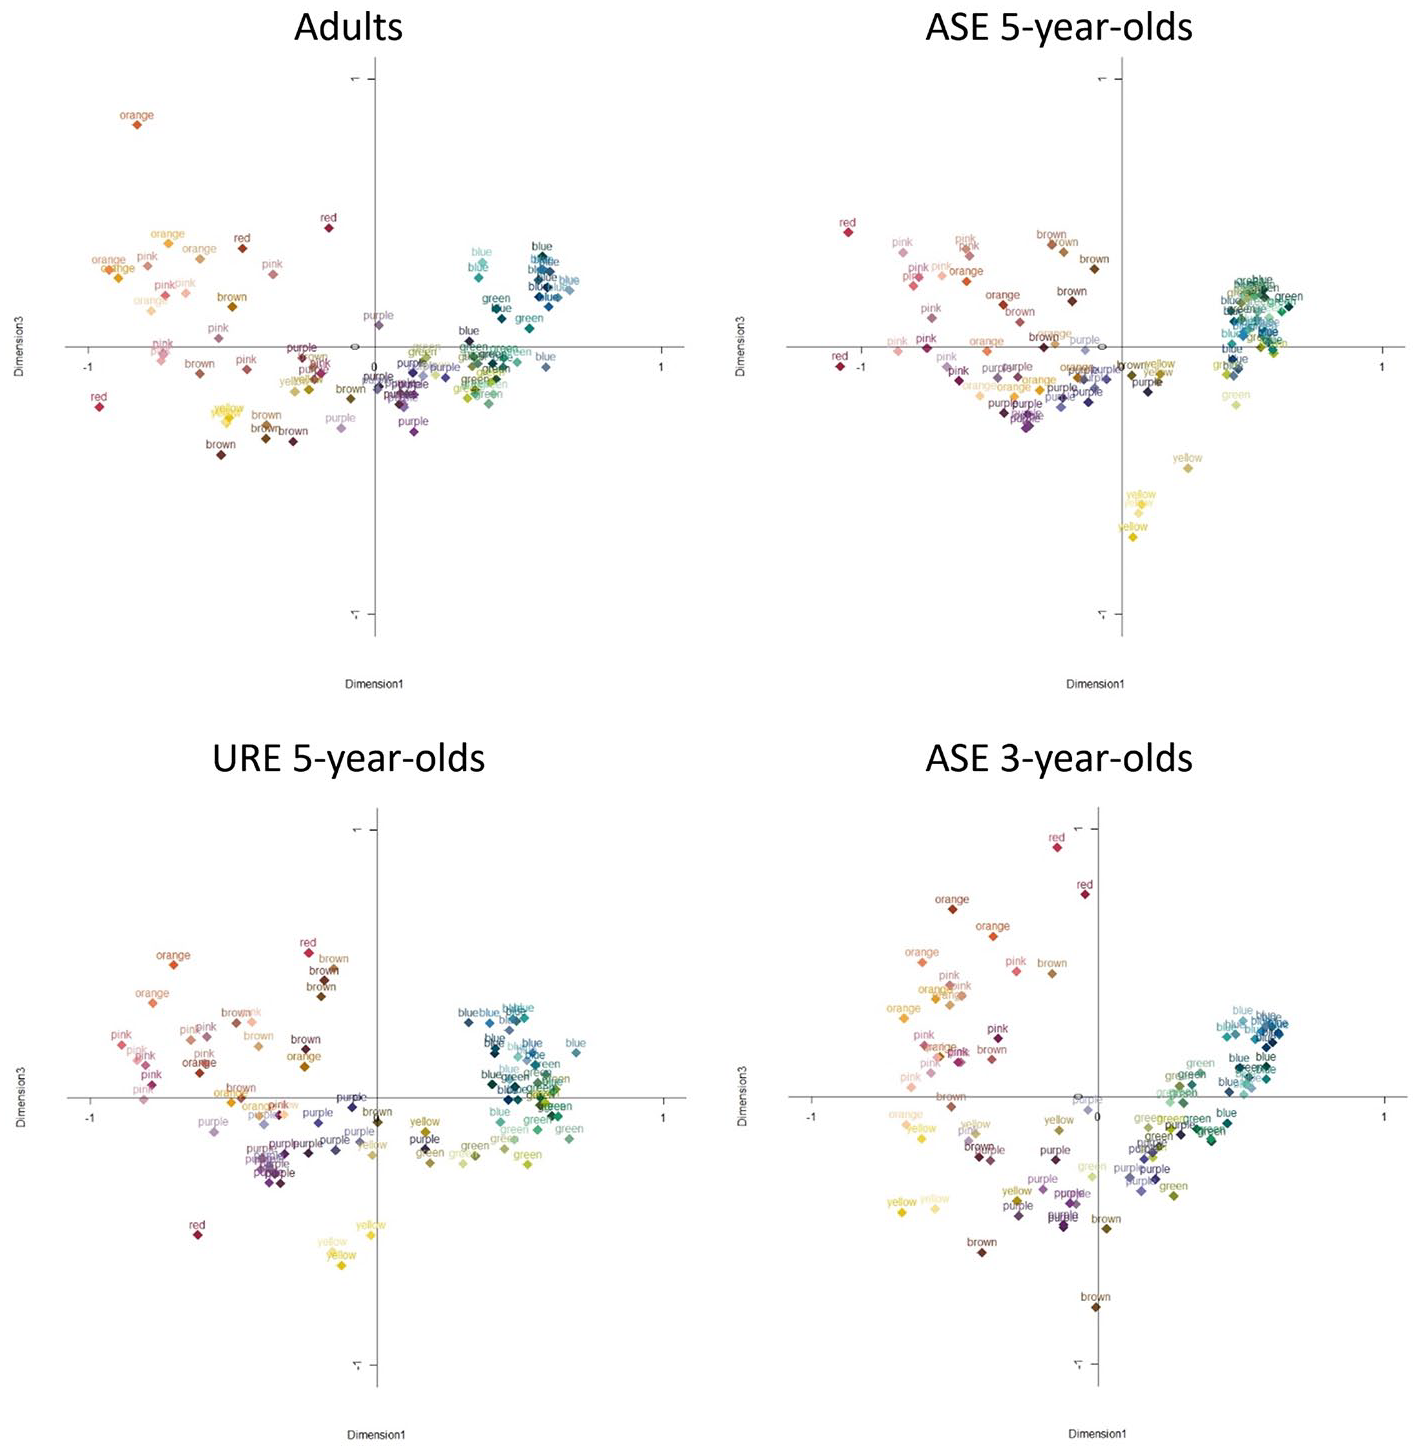
Multidimensional Scaling (MDS) Solutions for Adults, 5-Year-Olds from ASEs, 5-Year-Olds from UREs, and 3-Year-Olds from ASEs (Dimension 1 and Dimension 3).
The MDS solutions appear to reflect perceptual opponency: the red-green distinction (D1) and blue-yellow distinction (D2). Importantly, the configurations of these points are similar across the age groups and consistent with previous research (Shepard & Cooper, 1992). The last dimension (D3), however, did not show consistent patterns across the groups. To measure the difference among the age groups quantitatively, Euclidean distances between all possible pairs of color swatches were calculated. Based on these distances, the correlation between the adult group and each of the three child groups was determined. The naming pattern of 5-year-olds from ASEs and 5-year-olds from UREs was closer to that of adults (children from ASEs: r = 0.89; children from UREs: r = 0.87) than the naming pattern of 3-year-olds from ASEs (r = 0.84). We conducted a z-test to examine the differences between the correlation for two groups of 5-year-old children and 3-year-old children. We first converted the two correlations into z values with the formula:

where
We then used normal distribution for the test of z1-z2, and found that the correlation values for 5-year-olds were significantly higher than those for 3-year-olds (5-year-olds from ASEs vs 3-year-olds from ASEs: z = 8.38, p < .001; 5-year-olds from UREs vs 3-year-olds from ASEs: z = .4.67, p < .001). Consistent with the previous finding (Saji, Imai, & Asano, 2020), these correlations supported an age difference in naming accuracy, but did not show an SES difference. These MDS solutions show that, unlike 3-year-olds in Saji, Imai, and Asano (2020), overlaps of color categories in English-learning children are not as prominent as compared to Japanese-speaking age peers.
Analysis 2: more precise responses
We then performed analyses to probe whether there was an age and/or SES difference in providing more precise color responses including non-BCTs 2 that are not part of the 11 basic color terms (e.g. magenta), BCTs with achromatic modifiers (e.g. light purple), and compound words (e.g. bluish green) (Table 2). These data were analyzed using generalized linear models (GLMs). All analyses were conducted using R (version 4.1.2; R Core Team, 2020). As the independent variable in the data set included many zeros (i.e. children often produce more precise CTs), we constructed three GLMs for the negative binomial family (nbinom2), using the glmmTMB package (Brooks et al., 2017; Hardin & Hilbe, 2007). Each model tested the number of non-basic color names, the number of basic color terms with achromatic modifiers, or the number of compound words as the DV and Group (3-year-olds from ASEs, 5-year-olds from UREs, 5-year-olds from ASEs) as the sole fixed effect. Adults were not included in this analysis because they were explicitly asked not to use more sophisticated or atypical terms.
Descriptives for non-basic CTs, basic CTs with achromatic modifiers, and compound terms per group.

SE = standard error; BCT = basic color term; URE 5 = 5-year-olds from UREs; ASE 5 = 5-year-olds from ASEs; ASE 3 = 3-year-olds from ASEs.
Figure 4 shows the average number of non-BCTs, BCTs with achromatic modifiers, and compound terms produced by children, and Table 3 summarizes the three GLMs examining statistical differences in the responses across the participant groups. Five-year-olds from UREs were a reference group in all models as this study assesses if they are more similar to their age-matched peers (i.e. 5-year-olds from ASEs) or struggled due to their environment. The results suggest that 5-year-olds from UREs produced non-basic terms more than 3-year-olds from ASEs, but less than 5-year-olds from ASEs. However, 5-year-olds from UREs produced BCTs with achromatic modifiers more than 3-year-olds from ASEs, and as much as did 5-year-olds from ASEs. There were no significant differences between 5-year-olds from UREs and 3-year-olds from ASEs or 5-year-olds from ASEs in production of compound terms. The patterns found in the production of non-BCTs suggest that 5-year-olds from UREs have a less advanced range of CTs than their more affluent peers. We also conducted the same set of analyses including the outliers, but the finding remained consistent.
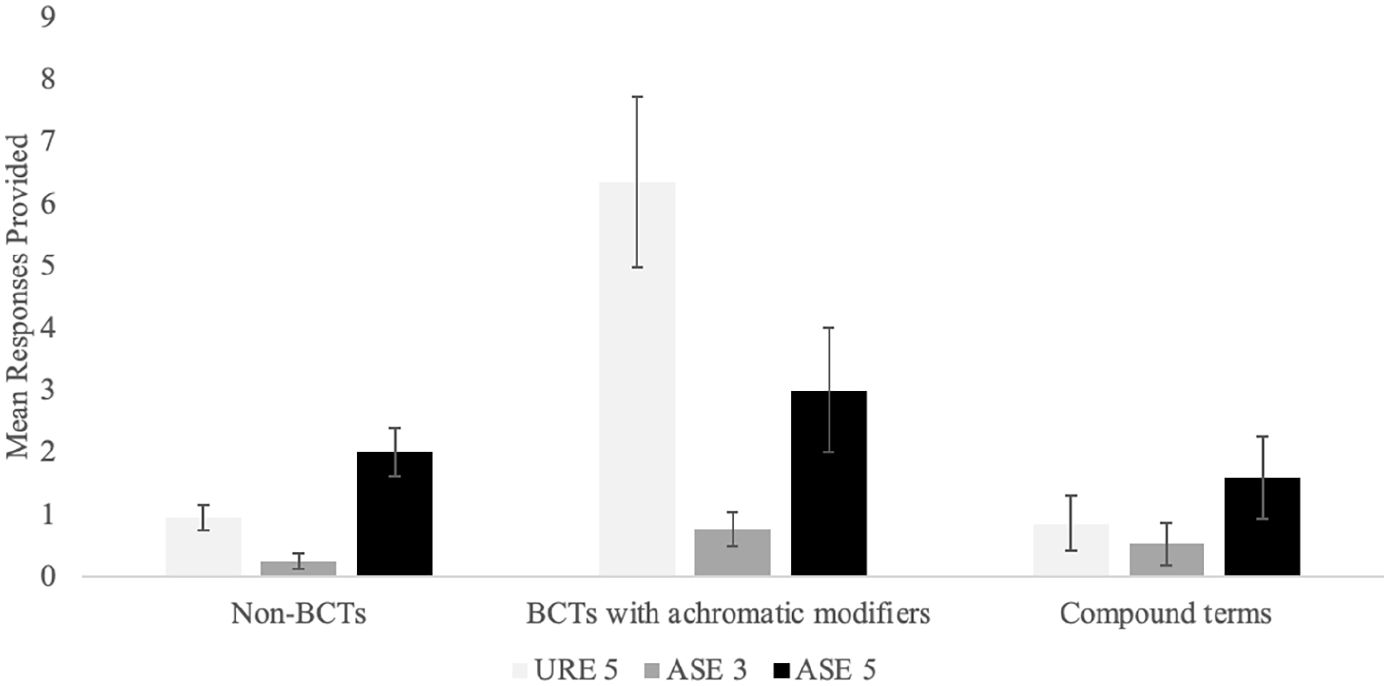
BCTs with Achromatic Modifiers, Compound Terms, and Non-BCTs Per Group.
The GLM tested the effects of Group on the number of BCTs with achromatic modifiers, compound terms, and non-BCTs produced.

SE = standard error; BCT = basic color term; URE 5 = 5-year-olds from UREs; ASE 5 = 5-year-olds from ASEs; ASE 3 = 3-year-olds from ASEs. The GLMs are conducted using the URE 5 as the reference group.
Such difference in the use of non-BCTs between 5-year-olds from UREs and their peers from ASEs was particularly interesting, given that the correlations between the MDS configuration of adults and these two child groups were the same (r = .86 for children from both environments). It is important to recognize, though, that the MDS configurations were calculated using only BCTs. In other words, children from all SES groups at this age can appropriately use core color names to label the color continuum. However, in the analysis examining children’s use of precise responses, we see that children from less-advantaged backgrounds do not use as many non-BCTs to label the color continuum. These results suggest that 5-year-olds from UREs and 5-year-olds from ASEs were similar in their abilities to use known BCTs, but differed in how they used non-BCTs. The fact that 5-year-olds from ASEs used more non-BCTs than 5-year-olds from UREs, but had similar configurations of the color space, may indicate that these less-advantaged children have yet to be exposed to these non-BCTs.
Discussion
This study extended the work of Saji, Imai, and Asano (2020) and asked whether age and environmental resources predict a leap in color term mapping in English-speaking children. Two results emerged from this study. First, at a global level, the finding of Saji, Imai, and Asano (2020) was extended in English, supporting the idea that mapping labels to the color space takes years after children learn relevant CTs for the first time. As in the original study, the 5-year-old participants applied BCTs more accurately than did our 3-year-old participants, regardless of their SES. In other words, at age 5, children from disadvantaged environments could use BCTs as accurately as their peers from more advantaged families.
Second, however, we showed that the influence of SES in English-speaking children arises in the use of non-BCTs (e.g. magenta). Importantly, though, we found that children from under-resourced environments tended to be weaker only in making finer linguistic discriminations of the color continuum using non-BCTs. Five-year-olds from under-resourced environments showed no difference in their naming of color swatches using BCTs with achromatic modifiers (e.g. light purple) or compound terms (e.g. blueish-green) compared to their more advantaged agemates.
Furthermore, we noted no difference between the number of non-BCTs provided by 5-year-olds from under-resourced areas and 3-year-olds from more advantaged environments. This finding is a unique contribution of the current study, in that we provided additional insights into how the complex and long-term process of color word acquisition takes place. Learning of basic-level color words is driven by age rather than SES, but social environment appears to affect color lexical acquisition in the naming of colors that are not category centroids of each basic color category. We urge readers to interpret this result with caution, though, as many children across the sample, including those in the ASE groups, did not utilize any non-BCT.
It is reassuring that 5-year-olds from both under-resourced environments and more advantaged backgrounds were able to use basic color names. However, we note that the use of non-BCTs by 5-year-olds from under-resourced backgrounds matched that of 3-year-olds from more advantaged environments. The patterns fit with the existing literature in which SES consistently influences the size of child vocabulary (Arriaga et al., 1998; Dollaghan et al., 1999; Fernald et al., 2013; Hart & Risley, 1995; Hoff, 2003; Noble et al., 2007; see Pace et al., 2017 for a review), and with research showing the relation between SES and vocabulary even in infants as young as 18 months (Fernald et al., 2013). This finding also aligns with work showing that parental input frequency of color words is significantly correlated with children’s color word knowledge (Yurovsky et al., 2015).
One possibility based on our findings is that the language learning environment of children, here measured as SES, affects the timing of when particulars within the semantic space become refined. For example, children from more advantaged backgrounds may receive more frequent exposure to non-BCTs compared to their less-advantaged peers in early childhood (e.g. having more access to books that describe an aqua ocean or a magenta gem, for instance). As children hear these nuanced labels such as indigo and navy in reference to various shades of blue, for example, these world-to-word mappings likely become solidified with more and more exposure to language. These experiences, or lack thereof, may contribute to the timing of when children can map those lexical boundaries to the color continuum. Another possibility is that children from a less-advantaged background hear non-BCTs less frequently than more advantaged children and thus although they may be familiar with the terms, regard them as unusual and refrain from using them. We believe that, in this scenario too, our finding demonstrates that, compared to their more advantaged peers, the meanings of non-basic terms are less established in these children as the consequence of receiving less input.
Moreover, the comparison between the results of the present study and those of Saji, Imai, and Asano (2020) suggests that the influence of parental input on the development of the color lexicon is moderated by both the structure of the lexicon and the everyday use of color words by adults. Whereas Japanese 3-year-olds in Saji et al.’s study (see Figure 5 in Saji, Imai, & Asano, 2020) seemed to struggle with acquiring the semantic boundaries of basic color words, showing very high boundary overlaps, 3-year-olds in this study already showed adult-like boundaries across the 11 basic color words. This suggests that English-learning children acquire the basic color lexicon at a faster rate than their Japanese peers. Interestingly, a recent study of German children found that these children also produce basic color words faster than Japanese children (Imai et al., 2020).
This discrepancy could be due to the fact that Japanese has as many as 16 statistically distinct chromatic categories (Kuriki et al., 2017). When adults consistently use different terms for light blue (mizuiro), indigo (kon), and regular blue (ao), as well as yellowish green (kimidori) and regular green (midori), it might heighten discriminability but create the burden of having to the learn a larger color vocabulary. 3 The Japanese color lexicon also contains loan words (e.g. buru [blue], gurin [green]), and adults use both Japanese words and loan words for the same colors, increasing the complexity of the lexical structure while decreasing the naming consistency of the parental input. The structure of the color lexicon in English (and German) is simpler in this respect; hence, English-learning children may be able to learn to map and delineate basic-level color words quicker than Japanese children (cf. Bowerman, 1996; Bowerman & Choi, 2001 for the relevant discussion).
The challenge for English-learning children may lie in learning to express nuanced colors (i.e. those that are around the peripheries of the basic color categories) in adult-like ways, using adjectives or BCTs with achromatic modifiers (e.g. light blue, dark green, yellowish pink) and non-BCTs (e.g. magenta, aqua). This may be where the quality of input produces a significant difference in how ‘adult-like’ children can express colors. It is possible that children from more advantaged backgrounds receive relatively more exposure to non-BCTs when hearing color words in their social environment than those from under-resourced areas.
Mapping words to referents is one of the most critical steps in the word learning process. Learning to accurately map word to world takes time, with a plethora of research demonstrating it can take years for children to label objects and events in their social environment as an adult would (Ameel et al., 2008; Göksun et al., 2010; Saji, Imai, Saalbach, et al., 2011; Shatz et al., 2010; Widen & Russell, 2008). As children refine more global labels and allow for more precise vocabulary, children learn where the linguistic boundaries of their native language exist and, hence, their semantic space becomes refined. It is well-established that children from disadvantaged backgrounds experience less language exposure compared to their more advantaged peers (Gilkerson et al., 2017; Golinkoff et al., 2019; Hart & Risley, 1995; Hoff, 2013; Rowe, 2008). Exactly how this disadvantage influences children’s adult-like use of words is currently being investigated. In this study, we asked if social-environmental differences could impact the process of learning lexical boundary delineation. We document one way in which both the amount and quality of the input language might be relevant to the fine-tuning of semantic categories. It is crucial to acknowledge that a child’s language environment is not limited to parental language input and that many structural inequalities must be considered in ongoing and future work investigating word learning.
One limitation of this study is the small sample size of each participant group. Future work must replicate this study with more participants, especially to probe the impact of SES on the production of more precise CTs. The inclusion of 4-year-old children could also provide further insight into preschoolers’ semantic refinement. Another possible limitation to this study is that the children from more advantaged environments were tested in a different location from the participants from disadvantaged backgrounds. However, children in both locations were tested in a quiet room free of distractions. Moreover, it is possible that while a child may not have used a particular color term in the laboratory setting, they could still be familiar with that term. In addition, color vision was not screened in our participants. Finally, we did not measure the color language input that our participants received, but rather utilized SES as our variable of interest. Future work should examine caregiver input of CTs.
Future research should further examine children’s exposure to colors and color terms in the home environment. Researchers may survey caregivers to see how often they engage in color-related activities (e.g. drawing with crayons or colored pencils) and how often caregiver-child conversations involving color words take place in the child’s life. We must also consider whether an SES difference exists in the way caregivers and children talk about colors. Although more research is needed to understand the complex process of how children learn to draw category boundaries, the current study presents one promising way to explore the trajectory of development and the mechanism underlying the process.
Footnotes
Acknowledgements
The authors thank the administrators, teachers, parents, and children who participated in this study. The authors also thank the anonymous reviewers who provided invaluable feedback on the manuscript.
