
Abstract
As a critical component of the global energy portfolio, shale oil has garnered considerable attention, making it essential to understand its enrichment mechanisms and controlling factors. However, accurately evaluating the hydrocarbon potential of shale oil reservoirs remains a significant challenge, particularly in quantifying oil adsorption by clay minerals, for which cost-effective and efficient evaluation methods are still limited. In this study, integrated geochemical and reservoir characterization experiments were conducted to investigate the factors controlling oil adsorption by clay minerals in shale reservoirs. Results show that cation exchange capacity (Qv) is a key parameter—second only to clay content and specific surface area—in assessing oil adsorption capacity. Based on this finding, the classical Waxman–Smits (W–S) model was improved by incorporating a quantitative relationship between Qv and oil adsorption. The resulting modified W–S model enables rapid, continuous, and quantitative evaluation of oil adsorbed by clay minerals directly from well log data, with predictive accuracy suitable for practical application. This model provides a new approach for evaluating oil adsorption in shale reservoirs and offers practical guidance for reservoir quality assessment, target selection, and optimization of development strategies.
Introduction
Occurrence state of adsorbed oil in shale
Shale oil primarily exists in three forms: adsorbed, free, and dissolved. Among these, the adsorbed and free states are dominant, while the dissolved component is typically negligible (Sun et al., 2021). Organic matter, particularly kerogen, serves as the principal medium for hydrocarbon adsorption due to its strong affinity for hydrocarbon molecules (Jarvie, 2014; Wang et al., 2016). Molecular dynamics simulations reveal that liquid alkanes confined within the pores of organic matter exhibit multilayer molecular adsorption behavior (Wang et al., 2015). The density of the adsorbed phase decreases progressively from the pore wall to the center (Tian et al., 2017). The oil adsorption effect of the clay minerals in shale cannot be ignored either, especially in shale with a low TOC content. (Xin et al., 2025). The occurrence state of shale oil is influenced by various factors, including pore size and geometry, temperature and pressure conditions, and the types of hydrocarbon molecules present. Regardless of whether the system involves a single hydrocarbon or a mixture, multilayer adsorption generally occurs on pore surfaces, strongly governed by the aforementioned factors (Chen et al., 2016; Do and Do, 2005; Mosher et al., 2013; Severson and Snurr, 2007).
Evaluation methods of adsorbed oil in shale
In summary, logging evaluation methods for shale oil continue to evolve—from adaptations of conventional models to the development of clay-rich reservoir models. This study systematically investigates oil adsorption by clay minerals in shale oil reservoirs through integrated reservoir and geochemical experiments. Based on identifying key controlling factors, a resistivity-based quantitative evaluation model was developed using well log data.
Samples and experiments
Basic geochemical analysis
To investigate the factors influencing the adsorption capacity of shale oil, 15 core samples were collected from the Qingshankou Formation in the Gulong Depression. The Gulong Depression is a secondary tectonic belt of the Songliao Basin, with the Qingshankou Formation as the main target shale oil layer. With a TOC content of ∼2.7%, Type I organic matter, and a vitrinite reflectance (Ro) of 1.2%∼1.7%, abnormal overpressure facilitates reservoir development, laying a foundation for shale oil accumulation.
Total organic carbon (TOC) content and rock pyrolysis analyses were first conducted. TOC measurements were performed using a LECO CS-230 carbon-sulfur analyzer (LECO, USA), while pyrolysis data were obtained using a Rock-Eval standard pyrolysis system. Subsequently, X-ray diffraction (XRD) analysis was conducted to determine the mineralogical composition of both clay and non-clay minerals in the samples. Mineralogical analysis was performed using a D8 Advance X-ray diffractometer (Bruker, Germany).
In addition, multi-temperature interval pyrolysis experiments and cation exchange capacity (Qv) tests were carried out to quantify shale and clay mineral oil adsorption and to evaluate the Qv values of the samples, respectively.
Determination of the oil adsorption amount of clay minerals
Separation of clay minerals
In this study, the sedimentation method was employed to isolate clay minerals from shale samples. Initially, 20–50 g of crushed shale (particle size <300 mesh) was dispersed using sodium hexametaphosphate. Dilute hydrochloric acid was then added to dissolve carbonate minerals. Free iron oxides and hydroxides on clay surfaces were removed using sodium dithionite, followed by the addition of sodium hydroxide to eliminate residual silica. Finally, the treated samples were transferred to a large porcelain crucible, and sodium carbonate solution was added to obtain relatively pure clay mineral fractions.
Multi-temperature-stage pyrolysis experiments
The multi-temperature pyrolysis method developed by Jiang Qigui was employed to quantify the oil adsorption capacity of shale and isolated clay minerals (Jiang et al., 2016). Experiments were conducted using a Rock-Eval 6 pyrolysis analyzer (Vinci Technologies, France). The procedure was as follows: the sample was initially heated to 200 °C and held for 1 min to obtain S1–1. The temperature was then increased at a rate of 25 °C/min to 350 °C and held for 1 min to obtain S1–2. Subsequently, the temperature was raised to 450 °C and held for 1 min to generate S2–1, followed by a final ramp to 600 °C with a 1-min hold to obtain S2–2.
S1–1 and S1–2 together represent the free oil content in the shale and reflect the maximum volume of movable oil. S2–1, released at higher temperatures, includes heavier hydrocarbons such as resins and asphaltenes, which exhibit low mobility and are considered the adsorbed oil fraction—mainly retained in kerogen and clay mineral pores. S2–2 represents hydrocarbons generated from kerogen pyrolysis, indicating the remaining hydrocarbon generation potential. Therefore, the sum of S1–1, S1–2, and S2–1 reflects the total oil content in the shale.
Results
Characteristics of organic matter
The total organic carbon (TOC) content of the shale oil reservoir interval in the studied well ranges from 0.99% to 7.53%, with an average of 1.98%. The hydrocarbon generation potential (S1 + S2) varies from 6.12 to 29.85 mg/g, averaging 7.79 mg/g. These values indicate that the interval possesses good source rock quality. The hydrogen index (HI) versus maximum pyrolysis temperature (Tmax) plot shows that the kerogen is predominantly Type II₁ (Figure 1a). Vitrinite reflectance (%Ro) values range from 1.0% to 1.3%, indicating that the samples are in the late mature stage within the oil generation window. According to the hydrocarbon generation potential diagram, the analyzed interval falls within the “fair” to “good” category, confirming its oil-prone nature (Figure 1b).

Kerogen types and hydrocarbon generation potential diagrams of the shale oil section: (a) HI versus Tmax diagram, and (b) S1 + S2 versus TOC diagram.
Mineral composition
Whole-rock X-ray diffraction (XRD) analysis reveals that the primary mineral constituents of the samples are clay minerals, quartz, plagioclase, and calcite, with minor amounts of potassium feldspar, pyrite, and ankerite. Overall, the mineral composition is dominated by clay minerals, siliciclastic minerals (quartz + feldspar), and carbonates (calcite + dolomite). The average contents of clay minerals, quartz, and calcite are 33.3%, 30.9%, and 8.8%, respectively, while other minerals make up approximately 27% of the total mineral assemblage (Figure 2). The samples are thus characterized by high proportions of clay and felsic minerals and relatively low carbonate content. Previous studies have shown that shale oil reservoirs dominated by mixed siliceous mudstone and clay-rich siliceous mudstone exhibit favorable reservoir quality (Gamero et al., 2012). Therefore, the mineral composition of the studied interval is favorable for shale oil accumulation (Figure 2).

The X-ray diffraction mineral composition of shale oil reservoirs.
XRD analysis of the clay fraction indicates that the dominant clay minerals are illite and illite–smectite mixed layers. Illite content ranges from 13% to 68%, with an average of 44.7% (Figure 3). The illite-to-smectite ratio in the mixed layers is approximately 1:5.5. Minor chlorite is also present, while kaolinite is absent.
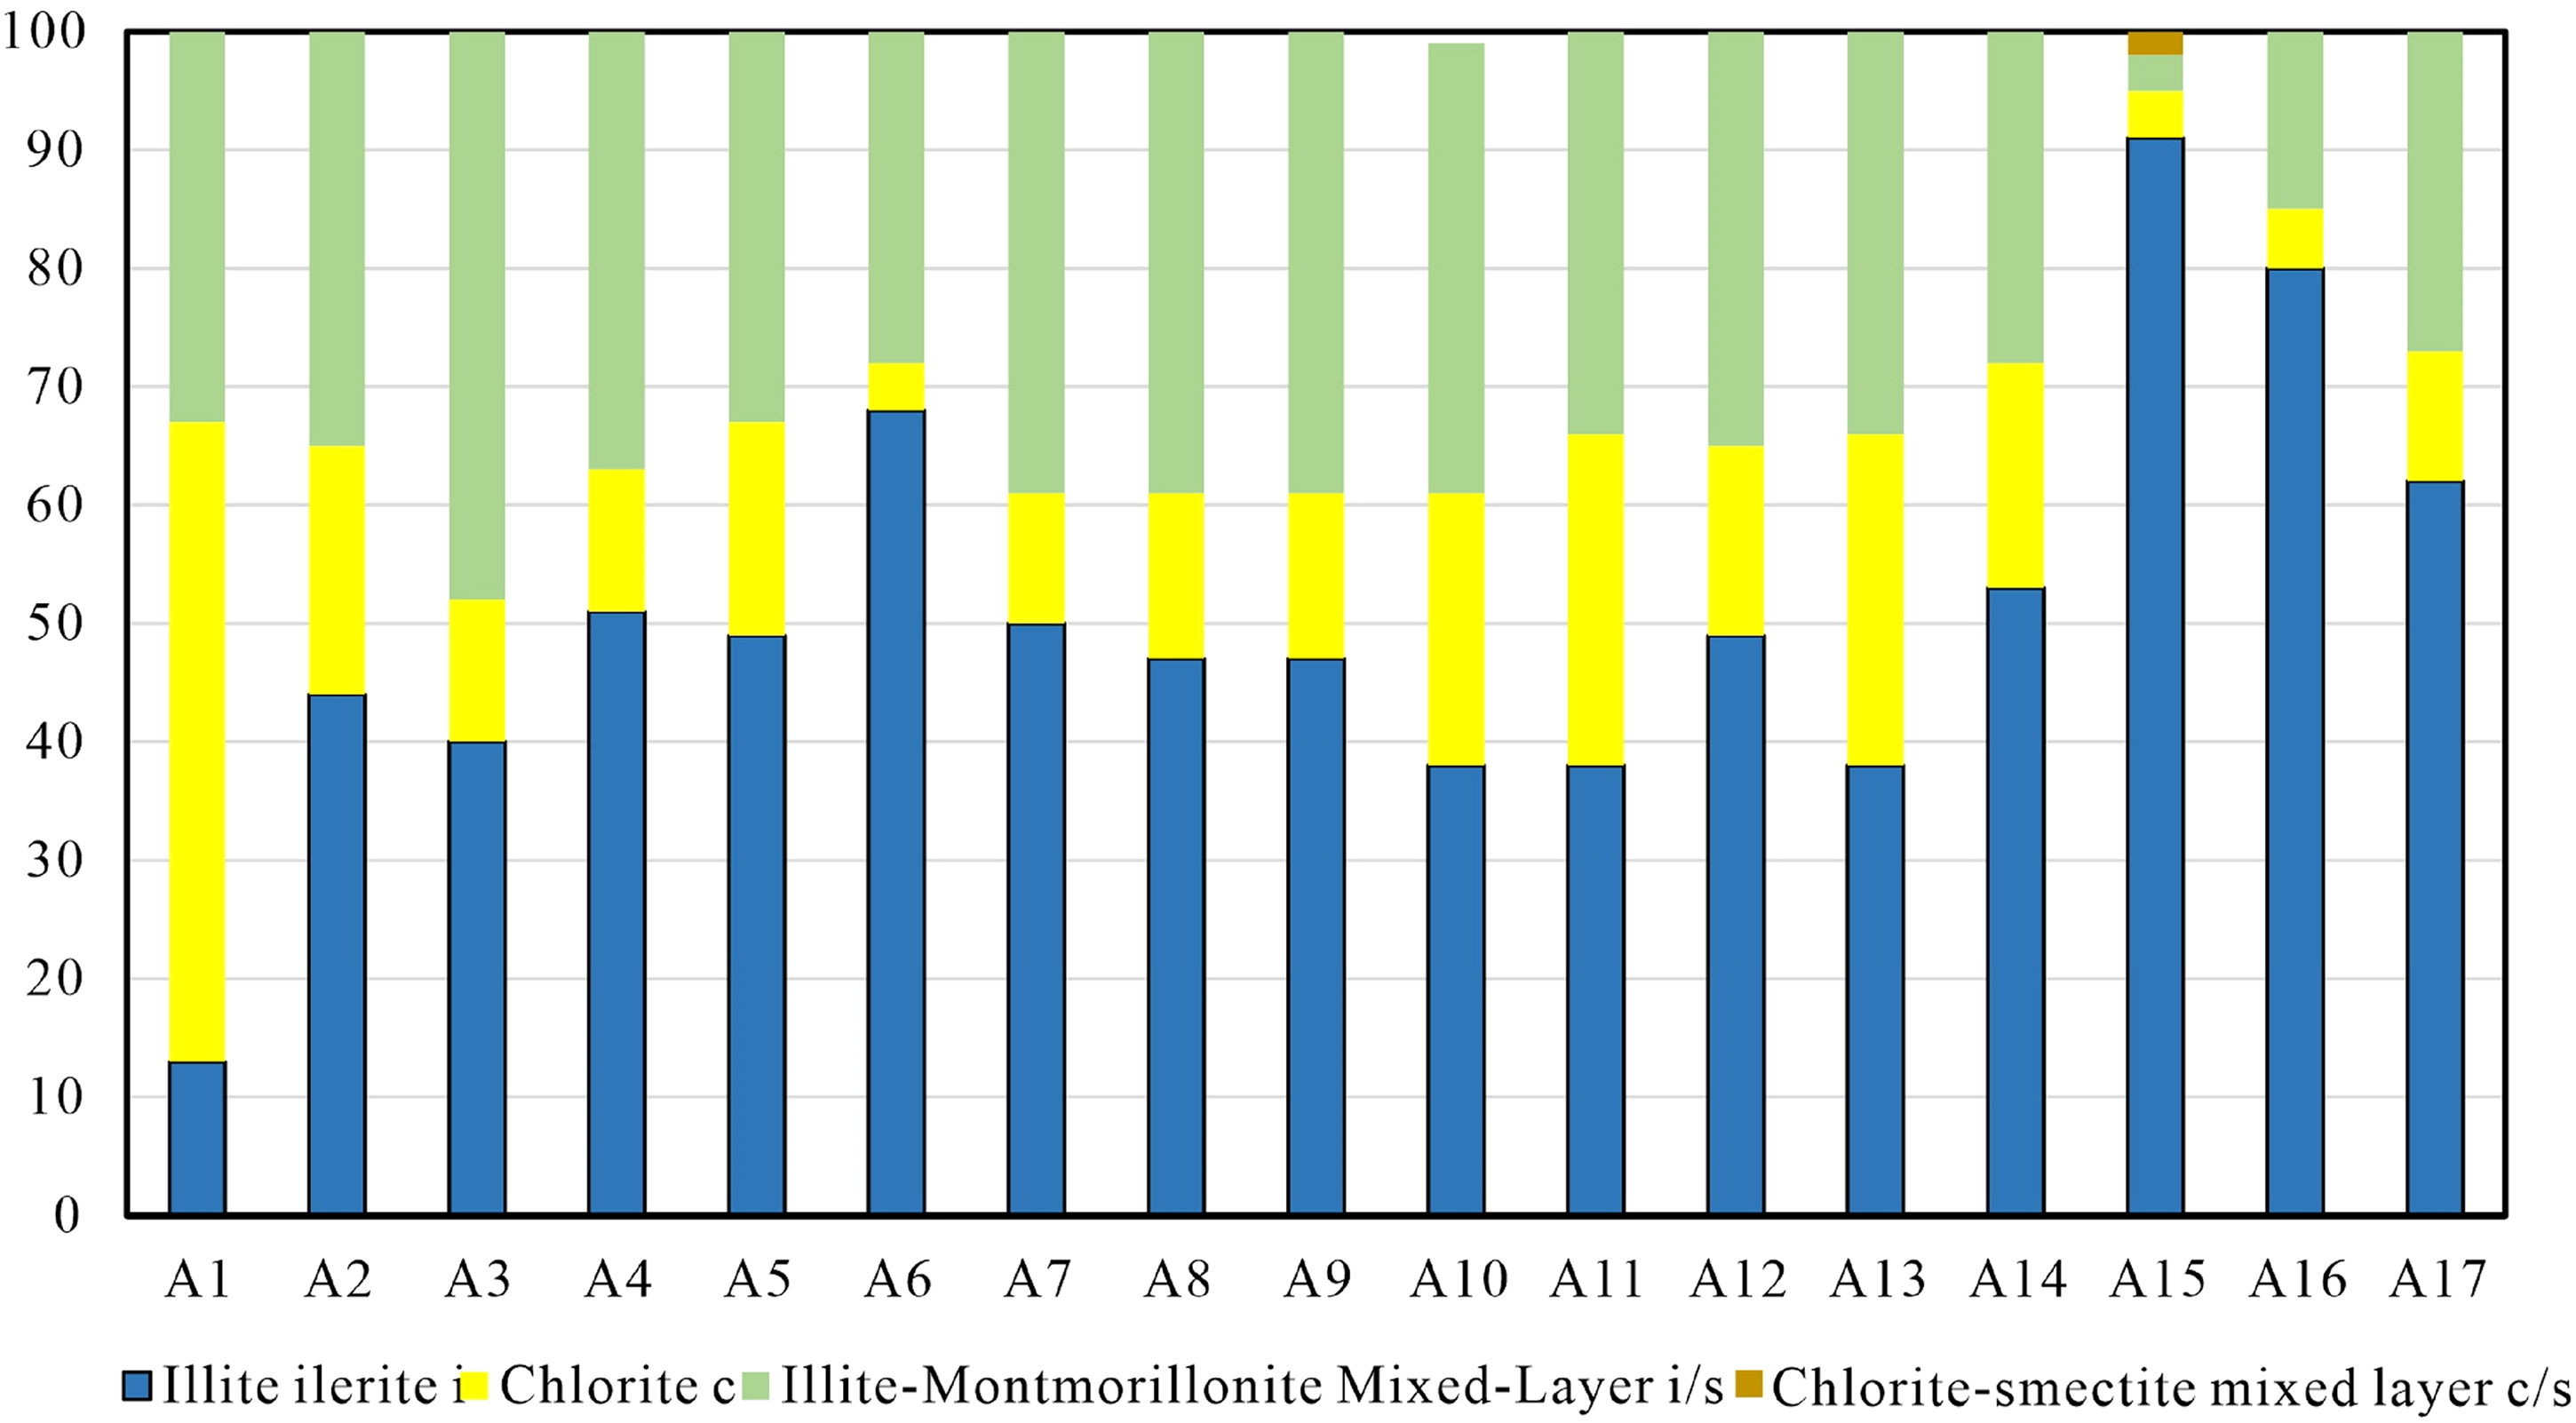
The X-ray diffraction clay mineral composition of shale oil reservoirs.
Adsorption oil of components in shale
Global adsorption oil of shale
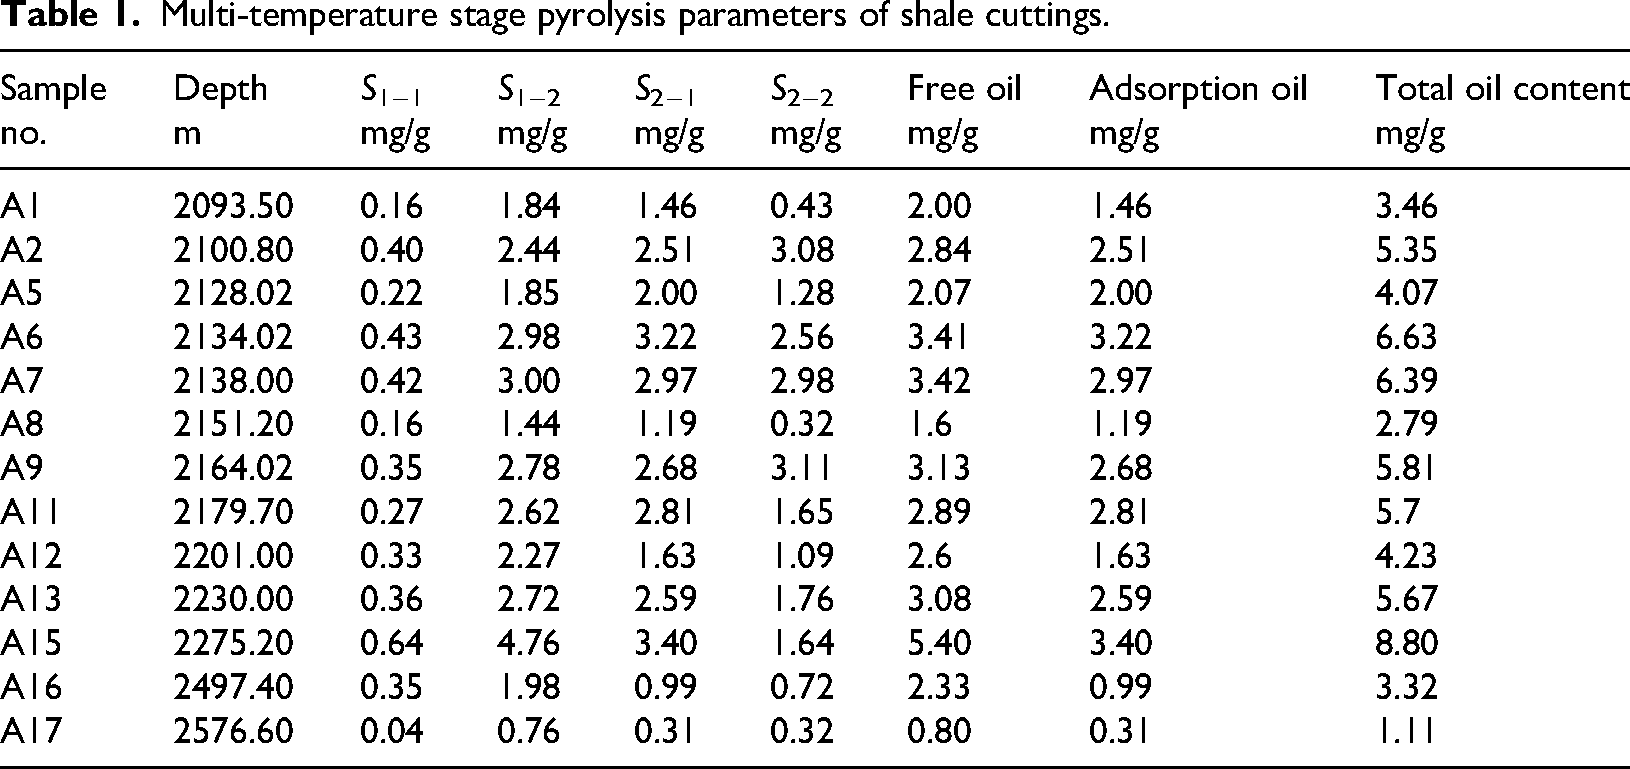
A multi-temperature stage pyrolysis experiment was conducted on 17 shale samples from the example well. The total oil content (S1–1 + S1–2 + S2–1) ranges from 1.1 to 8.8 mg/g, with an average of 4.77 mg/g. The free oil content (S1–1 + S1–2) ranges from 0.8 to 5.4 mg/g, averaging 2.70 mg/g, while the adsorbed oil content (S2–1) varies from 0.31 to 3.4 mg/g, with an average of 2.07 mg/g. The results indicate that free oil content is generally higher than adsorbed oil content. Adsorbed oil accounts for approximately 39%–50% of the total oil content in the shale (Table 1).
Multi-temperature stage pyrolysis parameters of shale cuttings.
Adsorption oil of clay minerals
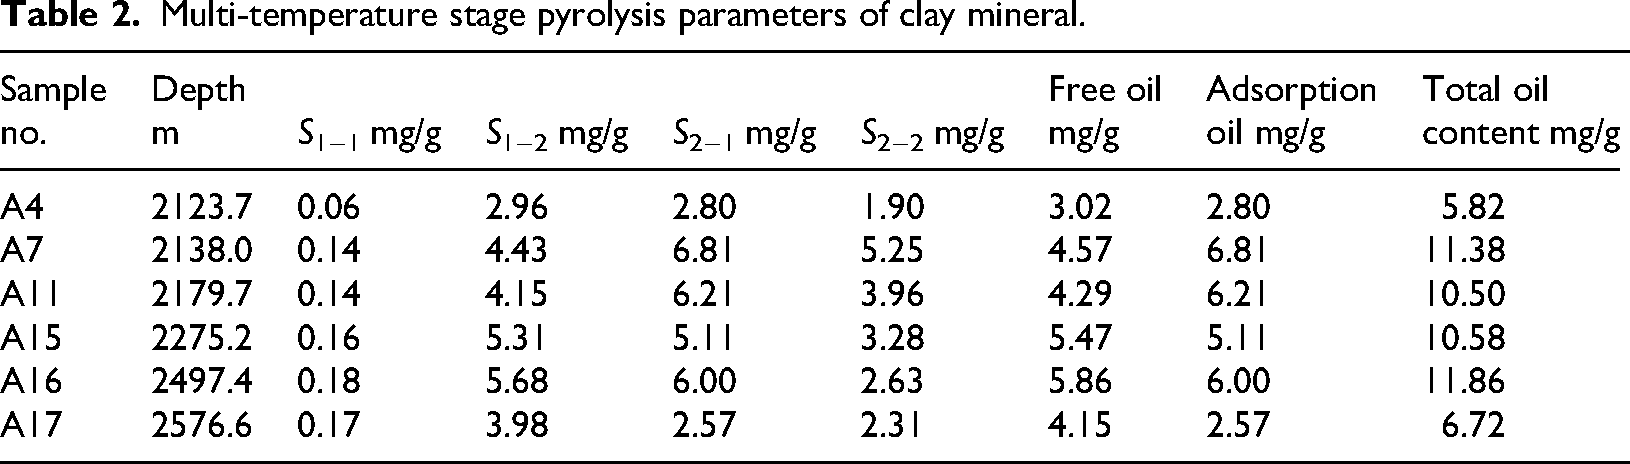
To quantify the oil adsorption capacity of clay minerals, six shale samples were selected for clay mineral separation followed by multi-temperature stage pyrolysis analysis (Table 2). The results show that the total oil content (S1–1 + S1–2 + S2–1) per unit mass of clay minerals ranges from 5.82 to 11.84 mg/g, with an average of 9.48 mg/g. Free oil content (S1–1 + S1–2) ranges from 3.02 to 5.86 mg/g, averaging 4.56 mg/g, while adsorbed oil content (S2–1) ranges from 2.57 to 6.81 mg/g, with an average of 4.92 mg/g. Unlike the whole-rock shale samples where free oil dominates, the clay mineral fraction exhibits higher adsorbed oil content than free oil. Adsorbed oil accounts for 39%–60% of the total oil in the clay minerals, with an average proportion of 50%.
Multi-temperature stage pyrolysis parameters of clay mineral.
Since the results of the multi-temperature stage pyrolysis experiment reflect the oil content adsorbed per unit mass of clay minerals, they do not directly indicate the contribution of clay minerals to the total adsorbed oil in shale. To address this, the adsorption data presented in Table 2 were normalized to shale mass, allowing for the calculation of oil adsorbed by clay minerals per unit mass of shale. The conversion procedure is as follows:

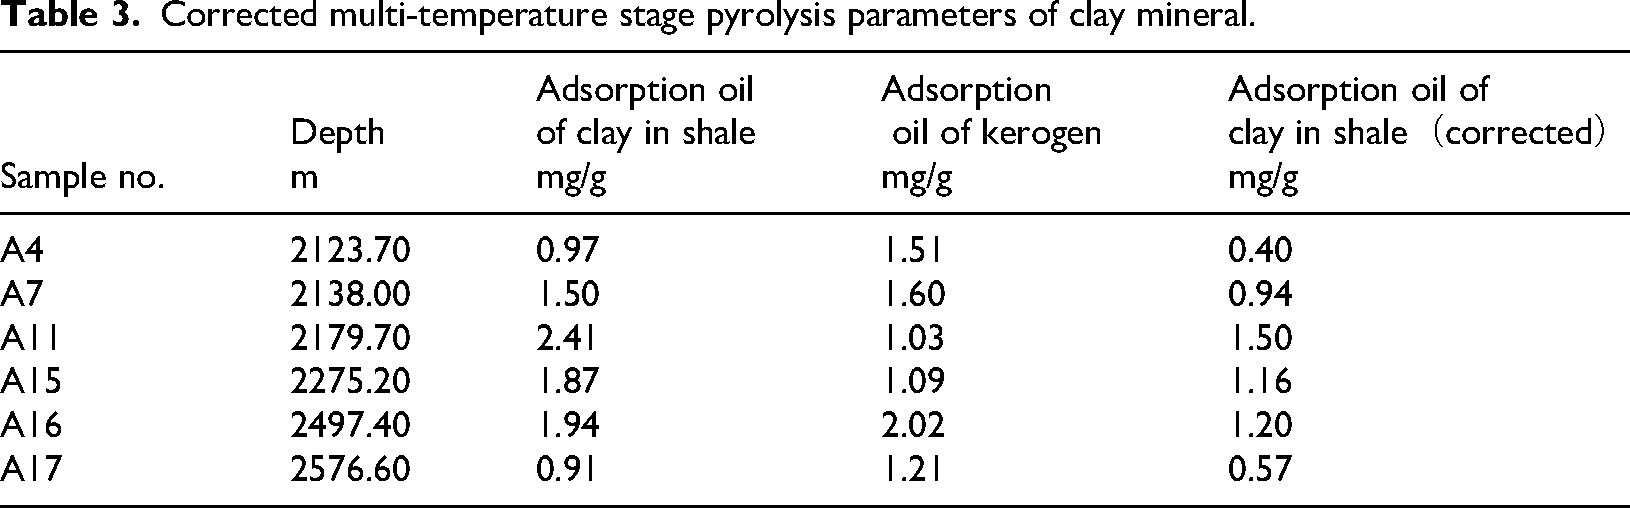
The corrected amounts of oil adsorbed by clay minerals are presented in Table 3. These values are generally lower than the total adsorbed oil content of the bulk shale samples (Table 2), indicating that a portion of the adsorbed oil originates from non-clay components, such as kerogen. Typically, hydrogen peroxide is used to remove organic matter during clay mineral preparation. However, to avoid potential oxidation and dissolution of adsorbed hydrocarbons, hydrogen peroxide was not used in this study. As a result, the measured adsorbed oil in the clay fraction includes contributions from residual kerogen, necessitating further correction.
Corrected multi-temperature stage pyrolysis parameters of clay mineral.
To address this, the adsorbed oil from residual kerogen was treated as a systematic experimental error, which is primarily influenced by variations in sample preparation, analytical standards, and operator technique. Assuming that all samples were prepared and analyzed under consistent conditions, the proportion (x) of residual kerogen-derived oil in the separated clay fraction can be considered constant. This proportion was estimated by solving a system of equations derived from multiple sample analyses.
The total adsorbed oil content of kerogen can be obtained through direct measurements or empirical models. In this study, we adopted the model developed by Li Jinbu (Li et al., 2023), which estimates kerogen adsorption capacity based on TOC and vitrinite reflectance (Ro). After correction, the clay mineral–derived adsorbed oil content in shale ranges from 0.40 to 1.50 mg/g, with an average of 0.96 mg/g (Table 3). This accounts for 21% to 60% of the total adsorbed oil, with an average proportion of 40%, indicating that clay minerals—alongside kerogen—serve as key hosts for adsorbed hydrocarbons in shale reservoirs.
The calculation process of the proportion (x) of the adsorbed oil from residual kerogen is as follows: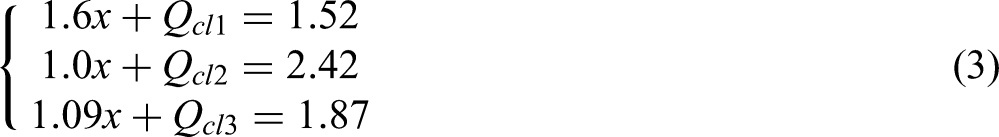

where:
x—the proportion of the oil adsorbed by the kerogen mixed in the clay minerals;
Qcl—The amount of oil adsorbed by the clay minerals, in mg/g, footnote 1, 2, 3,… represent the sample numbers;
Vcl—The volume of the clay mineral sample, in g/cm3;
qcl—The amount of oil adsorbed per unit volume of the clay minerals, in mg/g.
Discussion
Controlling factors of oil adsorption capacity of clay minerals
Clay minerals are the dominant mineral constituents in terrestrial shales and are the primary contributors to the specific surface area of mudstones. Due to their strong adsorption capacity relative to other minerals, it is critical to investigate the factors that influence their oil adsorption behavior. This study examines the effects of clay mineral content, specific surface area, cation exchange capacity (Qv), and thermal maturity (Ro) on the oil adsorption capacity of clay minerals.
The oil adsorption capacity of clay minerals exhibits strong positive correlations with both their content and specific surface area (Figure 4(a), (b)). As clay content increases, the overall specific surface area also increases, providing more adsorption sites and enhancing oil retention. Additionally, cation exchange capacity (Qv) shows an even stronger positive correlation with oil adsorption than either clay content or specific surface area (Figure 4(c)). Qv reflects the concentration of exchangeable cations (e.g., Ca2+, Mg2+, K+) on the mineral surface and is influenced by both mineral type and surface area. Since hydrocarbon molecules compete with hydrated cations for surface sites, higher Qv indicates more available adsorption sites, thereby enhancing oil adsorption capacity.
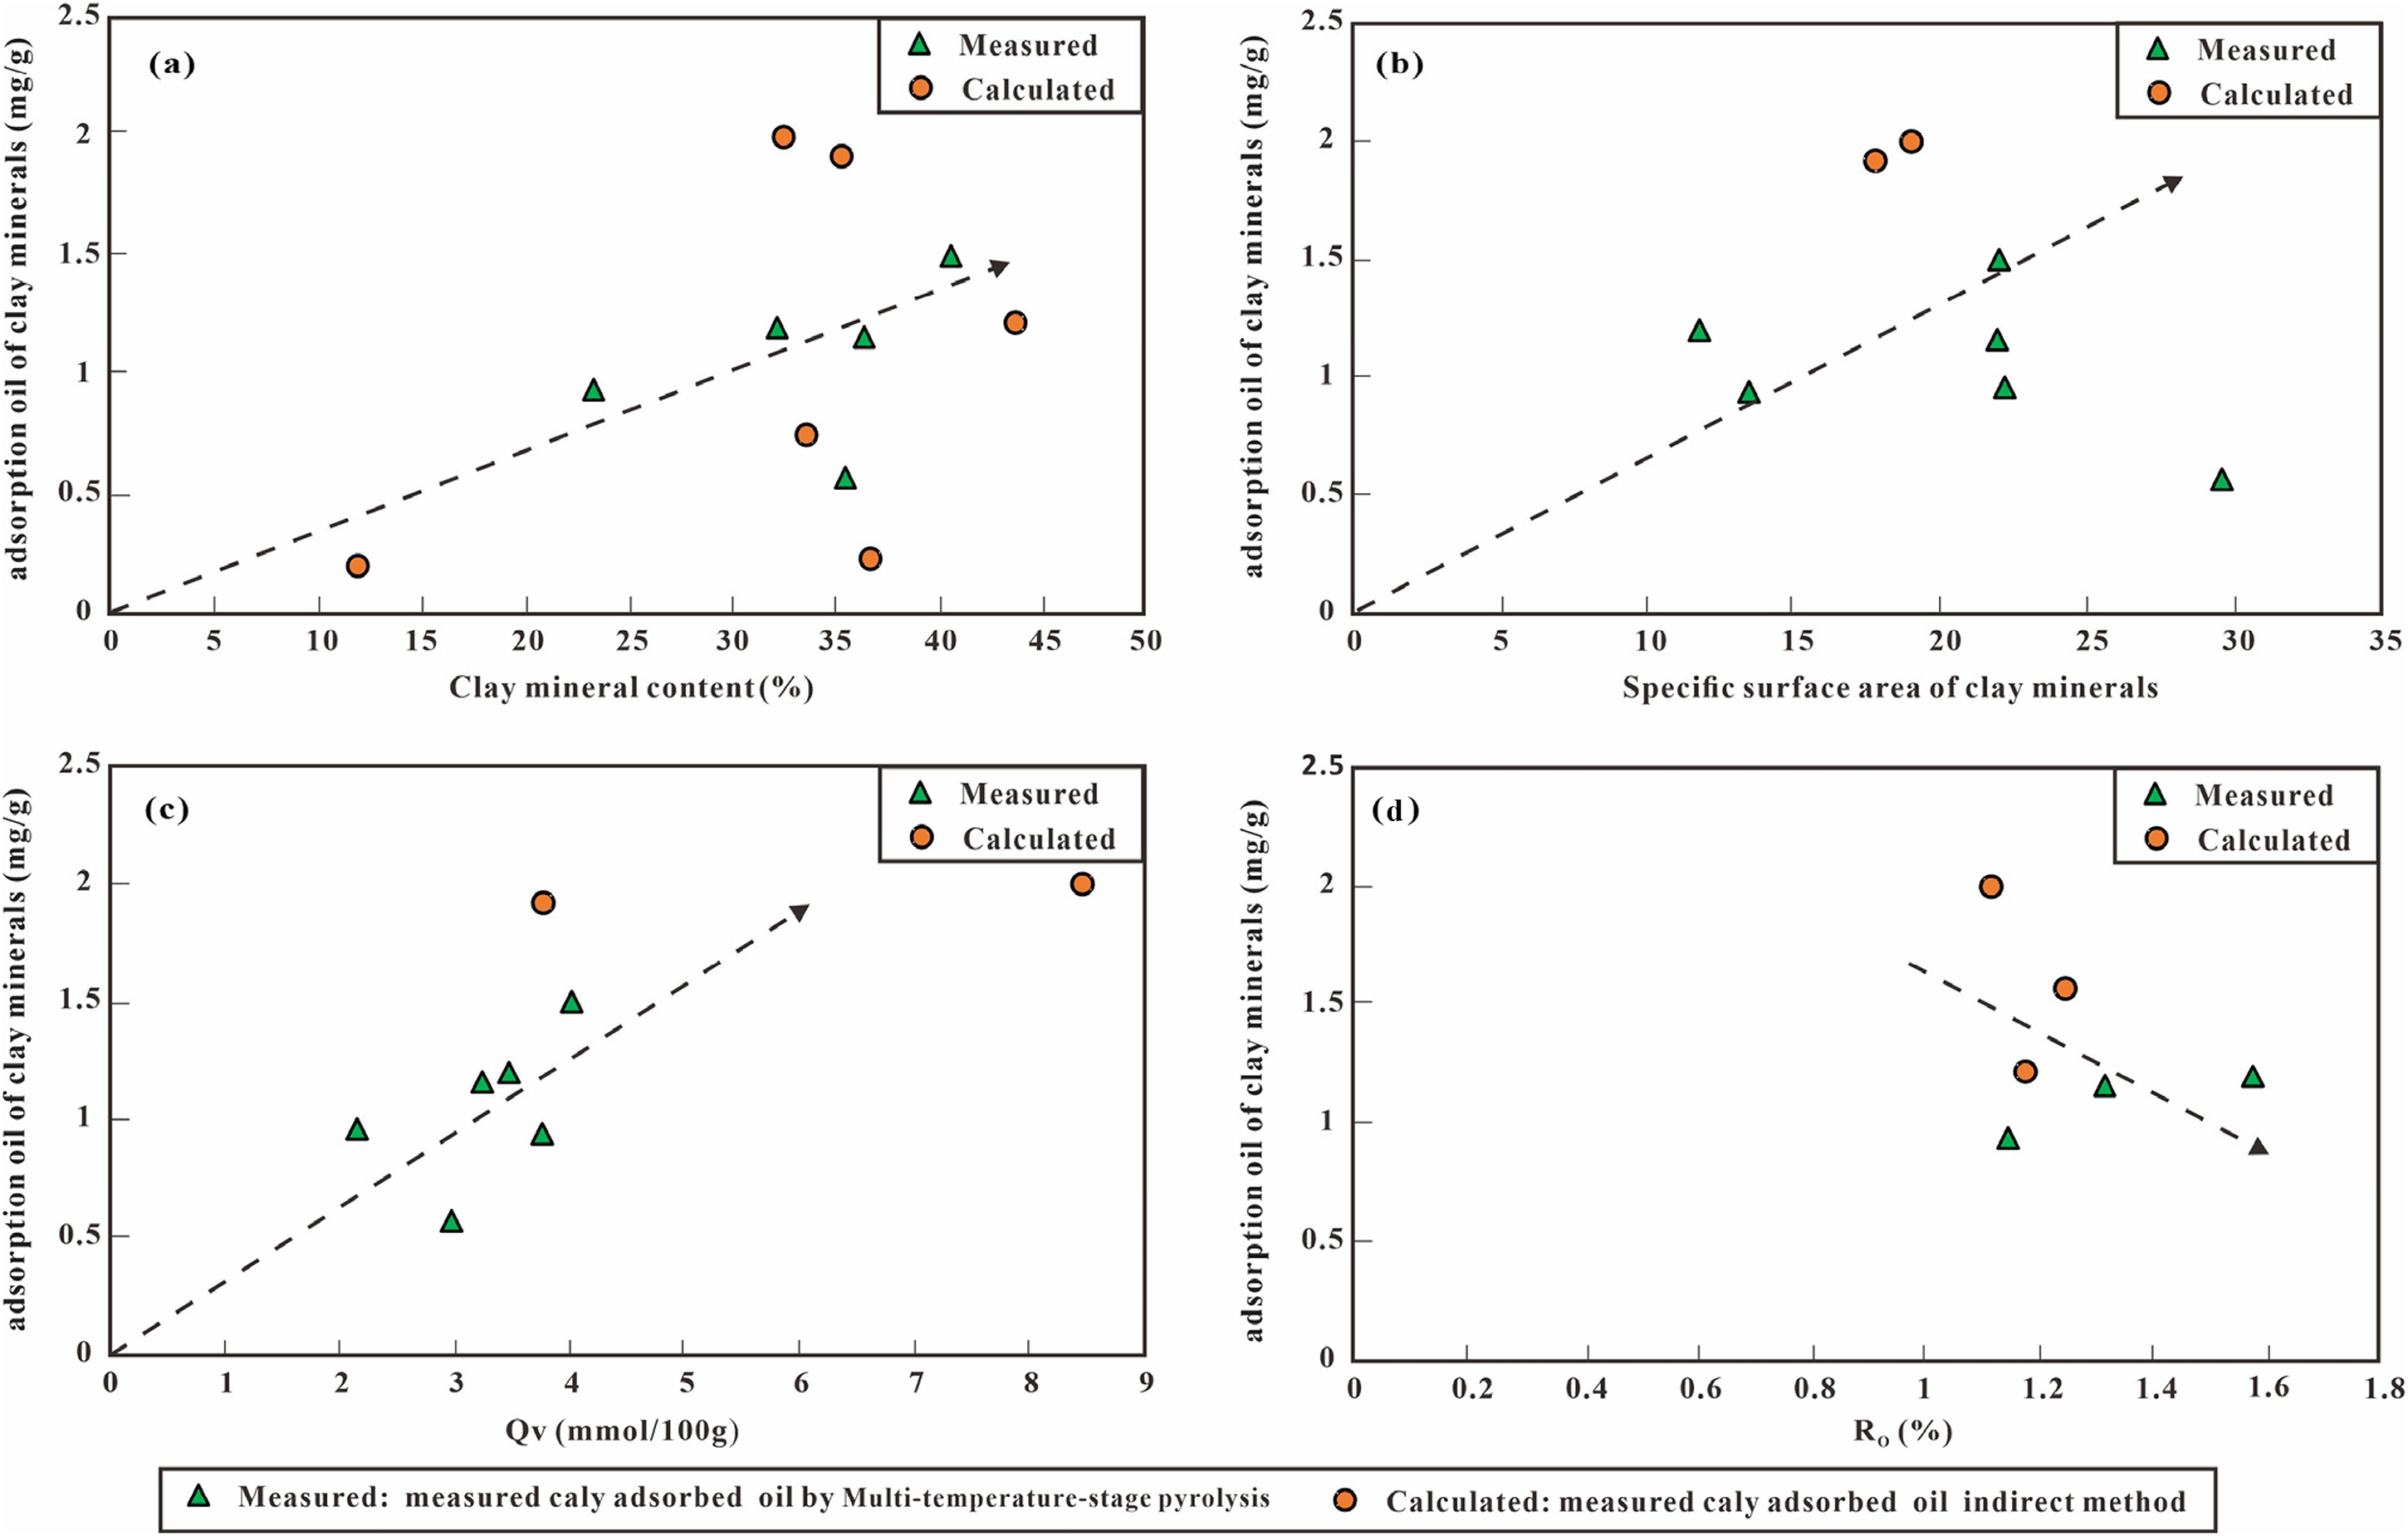
Correlation analysis of the main influencing factors of oil adsorption by clay minerals.
Thermal maturity also influences the adsorption capacity of clay minerals. As maturity (Ro) increases, adsorption capacity tends to decrease (Figure 4(d)). This is attributed to the temperature dependence of adsorption energy—higher temperatures reduce the binding strength between hydrocarbons and mineral surfaces, leading to weaker adsorption and lower oil retention.
In summary, clay mineral content, specific surface area, and cation exchange capacity are positively correlated with oil adsorption capacity, while thermal maturity exerts a negative influence.
Evaluation model of adsorption oil of clay minerals
Extensive studies have demonstrated that, aside from kerogen, clay minerals serve as the principal sites for oil adsorption in shale. The results from multi-temperature-stage pyrolysis experiments conducted on isolated clay fractions further support this conclusion. Analysis of key influencing factors indicates that the amount of oil adsorbed by clay minerals is positively correlated with clay content, specific surface area, and cation exchange capacity (Qv), and negatively correlated with vitrinite reflectance (Ro). For instance, Li introduced the parameter f—the ratio of the surface area of oil-adsorbed clay pores to the total surface area—to evaluate oil adsorption in clay minerals (Li et al., 2023). Similarly, Tian developed empirical curves describing the variation in oil adsorption capacity of clay minerals with temperature [6].
In practical applications, conventional methods such as well logging often fail to provide rapid or continuous evaluation of the specific surface area of clay minerals. In contrast, clay content and Qv can be quantitatively derived from logging data. For example, natural gamma logs can estimate clay mineral content, while Qv is closely associated with formation resistivity. Accordingly, this study employs the Waxman–Smits (W–S) model—widely used for quantifying Qv from resistivity logs—to develop a predictive model for evaluating the adsorbed oil content of clay minerals in shale reservoirs.
W–S model
The electrical conductivity of clay minerals arises from cation exchange processes occurring on their negatively charged surfaces (Yong and Zhang, 1999). A well-established correlation exists between the cation exchange capacity (Qv) of clay minerals and the electrical conductivity of argillaceous rocks. Higher clay content typically corresponds to greater Qv, resulting in enhanced electrical conductivity in clay-rich sandstones (Hill and Milburn, 1956).
In 1968, Waxman and Smits introduced an empirical model—commonly referred to as the Waxman–Smits (W–S) model—to quantify the impact of Qv on the electrical conductivity of shaly formations. The W–S model explains why the measured formation water conductivity often exceeds the theoretical value based solely on salinity. This discrepancy is attributed to the presence of clay minerals, whose surface-bound exchangeable cations (e.g., Na+, K+, Ca2+, Mg2+) contribute additional conductive pathways when mobilized by an electric field (Figure 5(a)). The resulting increase in conductivity due to these cations is expressed as
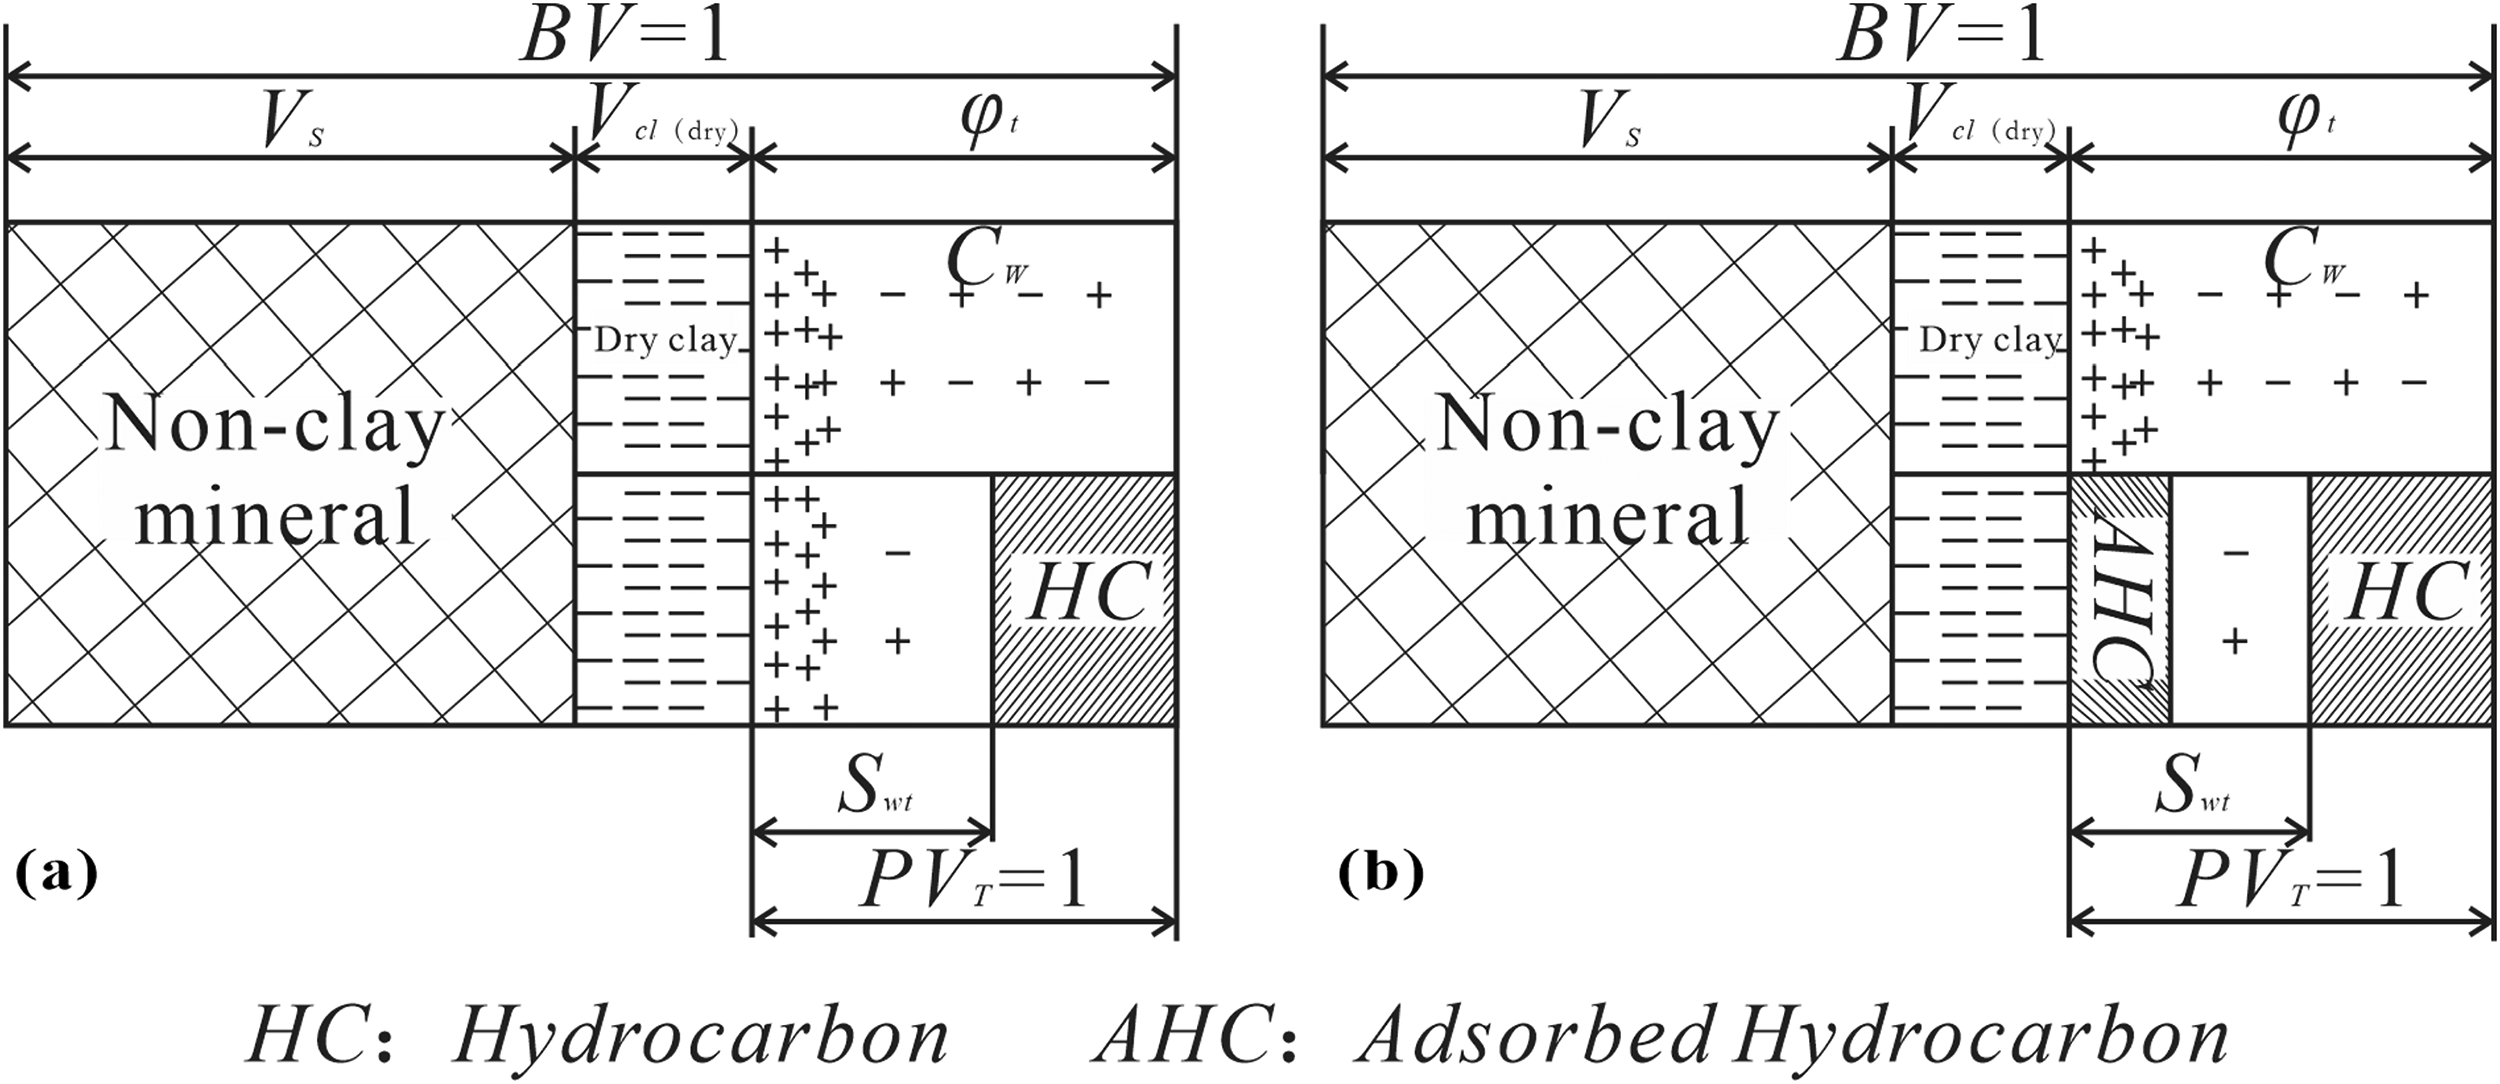
W–S shale model (a) and modified W–S model (b).
The W-S model assumes that the conductivity of shale is the parallel conduction of free electrolyte and cation exchange. As a result, the resistance of water-bearing shale is composed of two parallel resistors: one is the conductance of the free electrolyte contained in the sandstone skeleton minerals and the pores between them; the other is the conductance generated by the cation exchange of clay (Fan, 2021). Therefore, the electrical conductivity equation for shale sandstone containing clay according to the W–S model is:
where Ct—The electrical conductivity of oil and gas-bearing shale, S/m; n*—The saturation index equivalent to that of the rock without clay, and usually n* = 2; F*—The formation factor of pure sandstone with a porosity equal to the total porosity φt of the shale; Qv—The cation exchange capacity of the shale, mmol/cm3; Swt—The total water saturation of the shale, %; Cw—The electrical conductivity of the formation water, S/m; B—The equivalent electrical conductivity of the exchangeable cations, S·cm3/(mmol·m), and the empirical relationship of B here is obtained for Na+ at 25°C.
Modified W–S model
Previous studies have shown that there is a competitive adsorption effect between hydrocarbon and water on the surface of clay minerals (Winsauer W, McCardell W., 1953). The molecular radius of liquid hydrocarbons is much larger than that of water molecules, which leads to the diffusion layer that can be affected by the negative charges on the surface of clay minerals being occupied by liquid hydrocarbon molecules (Figure 5(b)). As a result, the concentration of exchangeable cations within the diffusion layer decreases. Therefore, when the adsorption sites of clay-water are replaced by hydrocarbon molecules, it will lead to a decrease in the exchangeable cation capacity of clay minerals, and thus reduce their electrical conductivity. Theoretically, there is a correlation between the concentration of adsorbed oil and the cation exchange capacity on the surface of clay minerals (Figure 4(c)). Based on this relationship, the correlation between the adsorbed oil and the cation exchange capacity of clay minerals can be established, and thus the quantitative evaluation of the oil adsorbed by clay minerals can be achieved.
It should be noted that the positive correlation in Figure 4(c) mainly represents that, macroscopically, there is a positive relation between the adsorption capacity of clay minerals and their cation exchange capacity, rather than being a direct representation of the oil adsorbed by clay minerals. In practical evaluations, the Qv calculated based on logging data is the residual cation exchange capacity (Qvr) of clay minerals under the condition of the presence of adsorbed oil. In contrast, what can directly represent the concentration of adsorbed oil is the difference between the original and residual cation exchange capacities of clay minerals (Qvo − Qvr). Figure 6 shows the relationship between the actually measured clay minerals adsorbed oil and Qvo − Qvr, where Qvo is the actually measured cation exchange capacity of clay minerals after oil washing, and Qvr is calculated based on the W–S model combined with logging data. It can be seen that there is an obvious positive correlation between the oil adsorbed by clay minerals and Qvo − Qvr, and the correlation coefficient (R2) of this relationship is better than that between the adsorbed oil and Qvo (Figure 6).
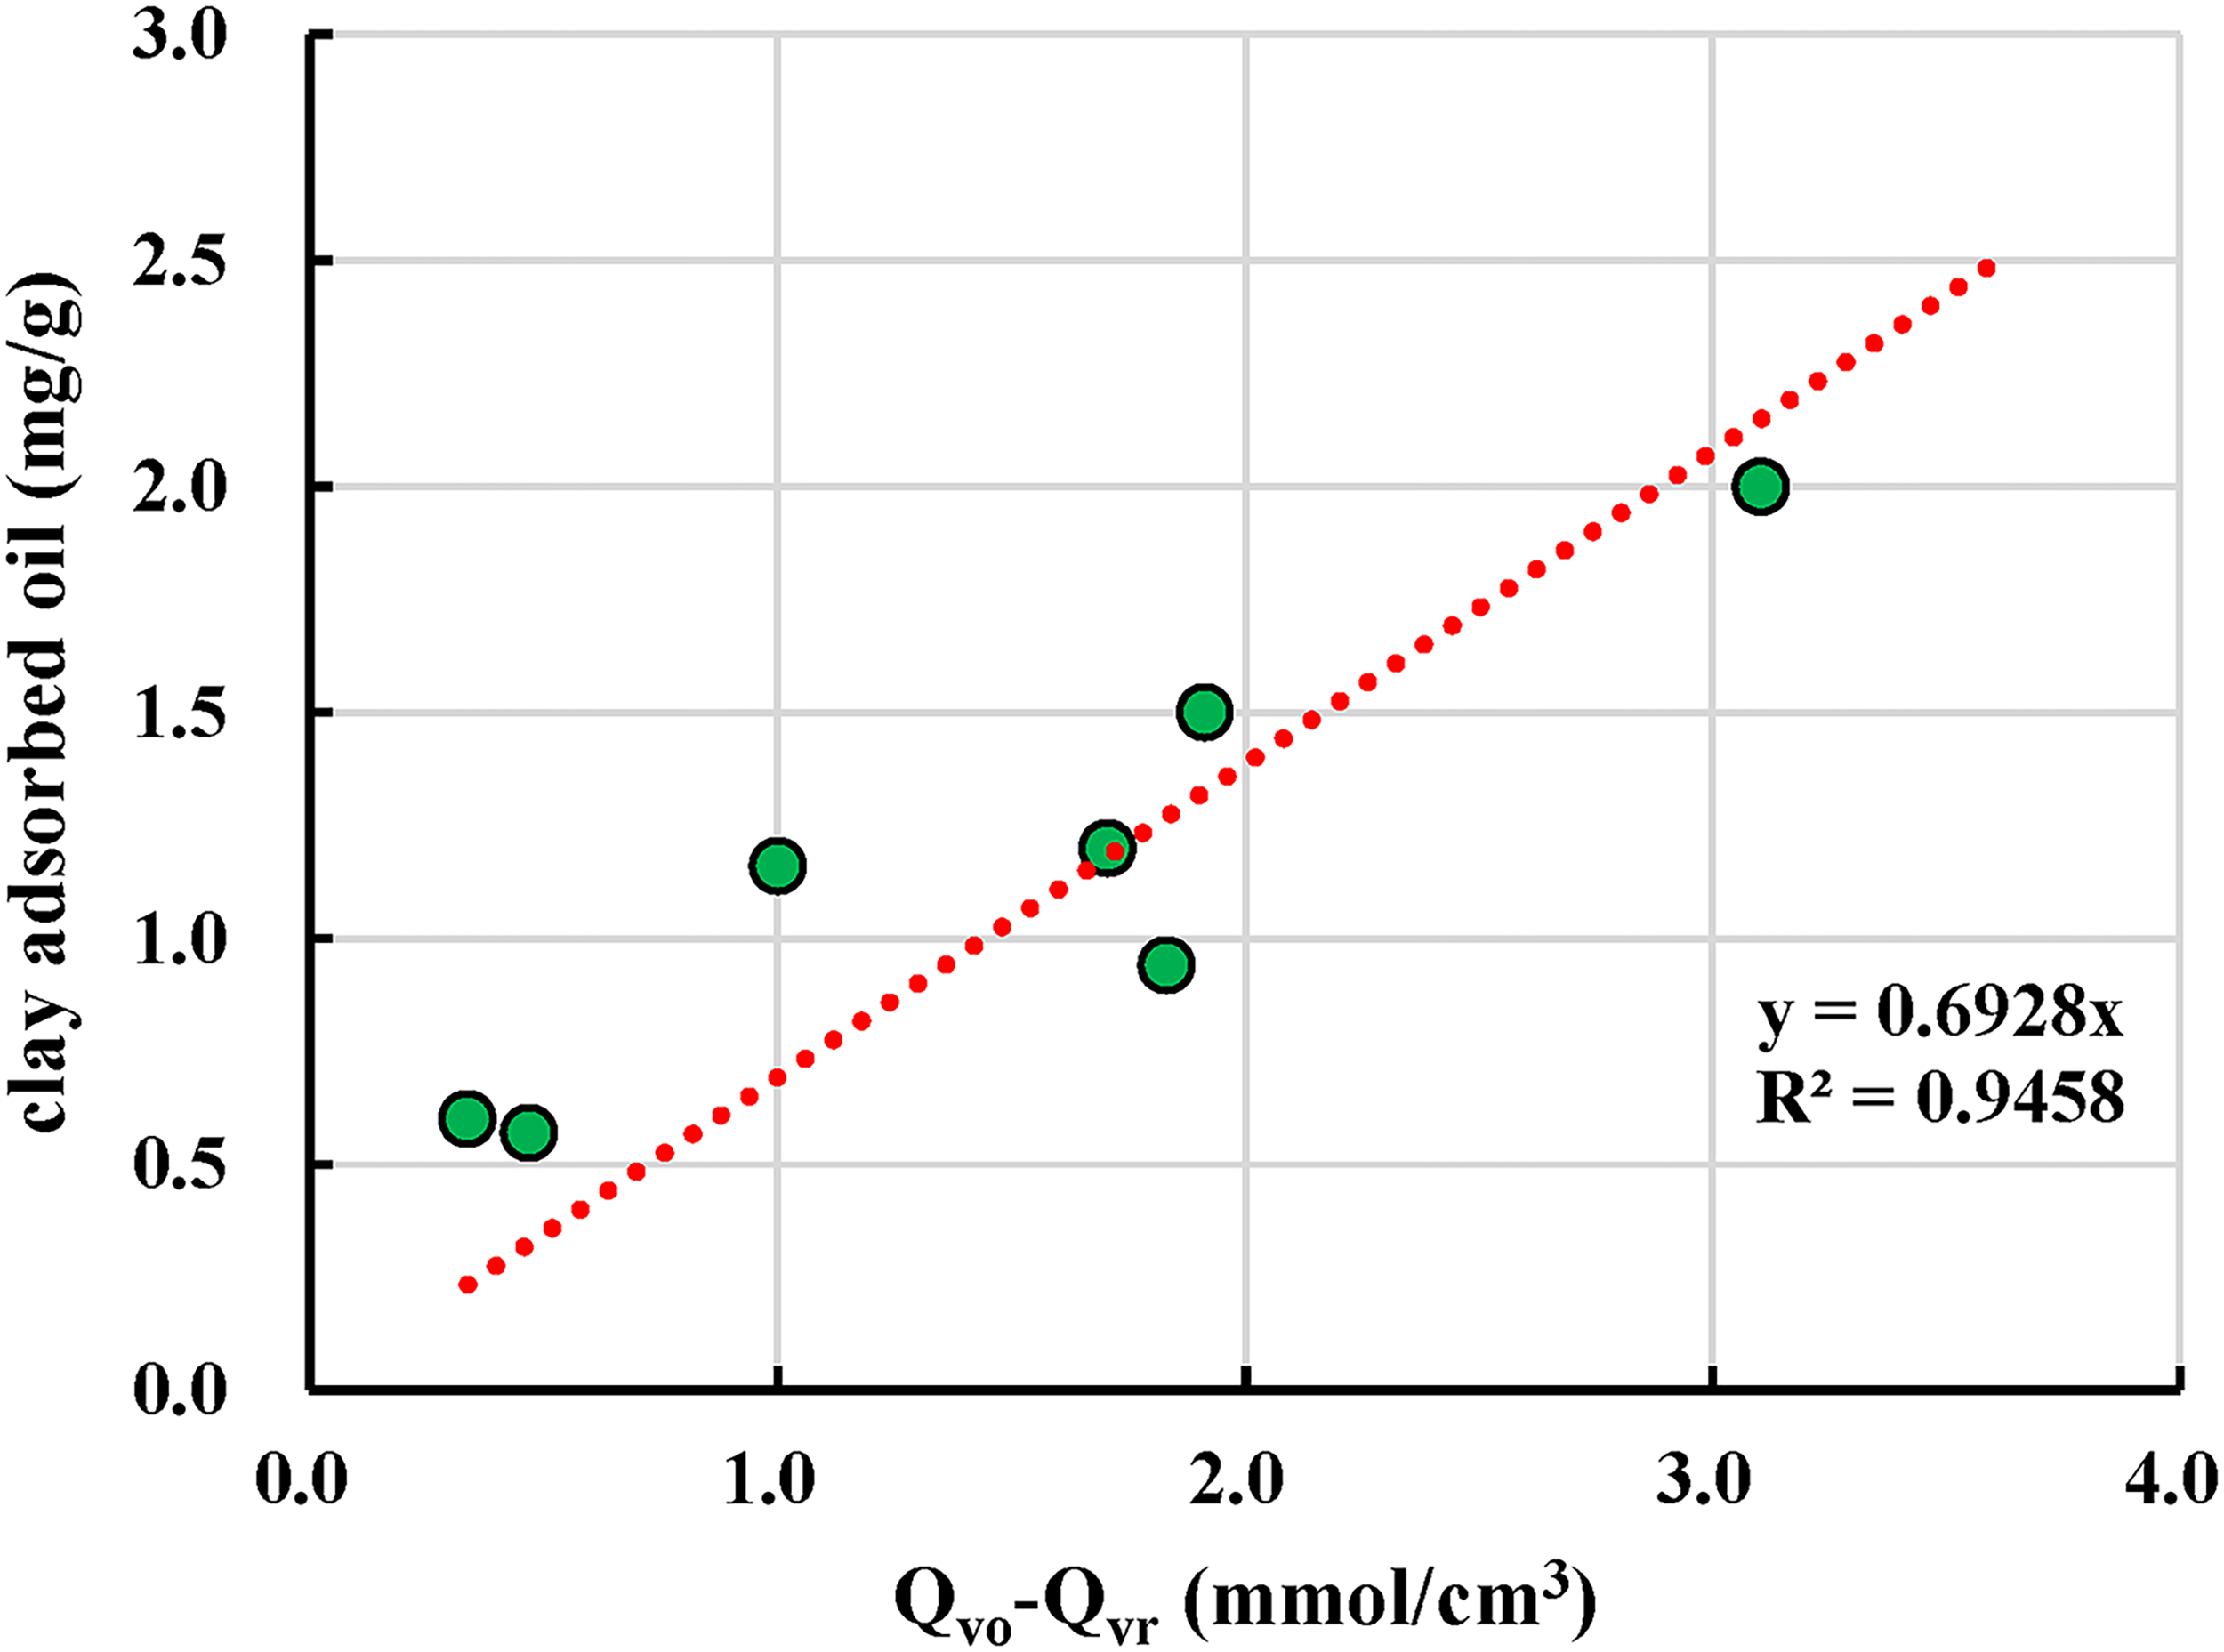
Correlation between Qvo–Qvr and clay-adsorbed oil.
Based on this, a mathematical relationship between the oil adsorbed by clay minerals (Qads) and the cation exchange capacity of clay can be established.
Assuming that the reduction in the cation exchange capacity (Qv) of clay minerals is primarily due to hydrocarbon adsorption, then when Qvo − Qvr = 0, the amount of adsorbed oil is also zero. Accordingly, the intercept term b in the correlation equation can be considered zero. In practical evaluations, Qvo is directly related to the clay mineral content in shale, and can therefore be expressed as follows:
Among them, Qvclay is the cation exchange capacity of the main clay minerals in the shale, and Vclay is the volume of clay minerals in the shale per unit volume. Then, Qvr can be determined by combining the W–S model with the actual logging data:
Substitute equation(7) and equation(8) into equation (6), and then the improved W–S mathematical model for the quantitative evaluation of oil adsorbed by clay minerals can be obtained:
The above equation can be rewritten as: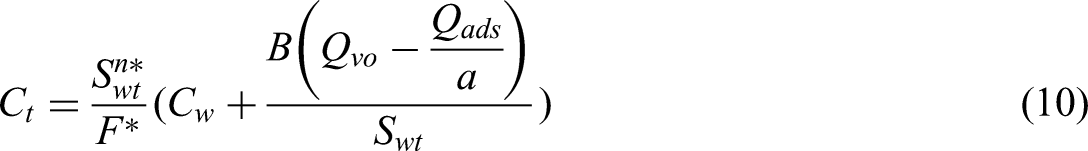
Theory analysis of the conductivity model
To ensure that the developed model (equation (10)) adheres to physical principles and geological reality, a theoretical analysis of key parameters was conducted using a single-variable control approach. By holding other parameters constant, we assessed the effects of formation water conductivity (Cw) and the amount of oil adsorbed by clay minerals (Qads) on the predicted bulk rock conductivity (Ct).
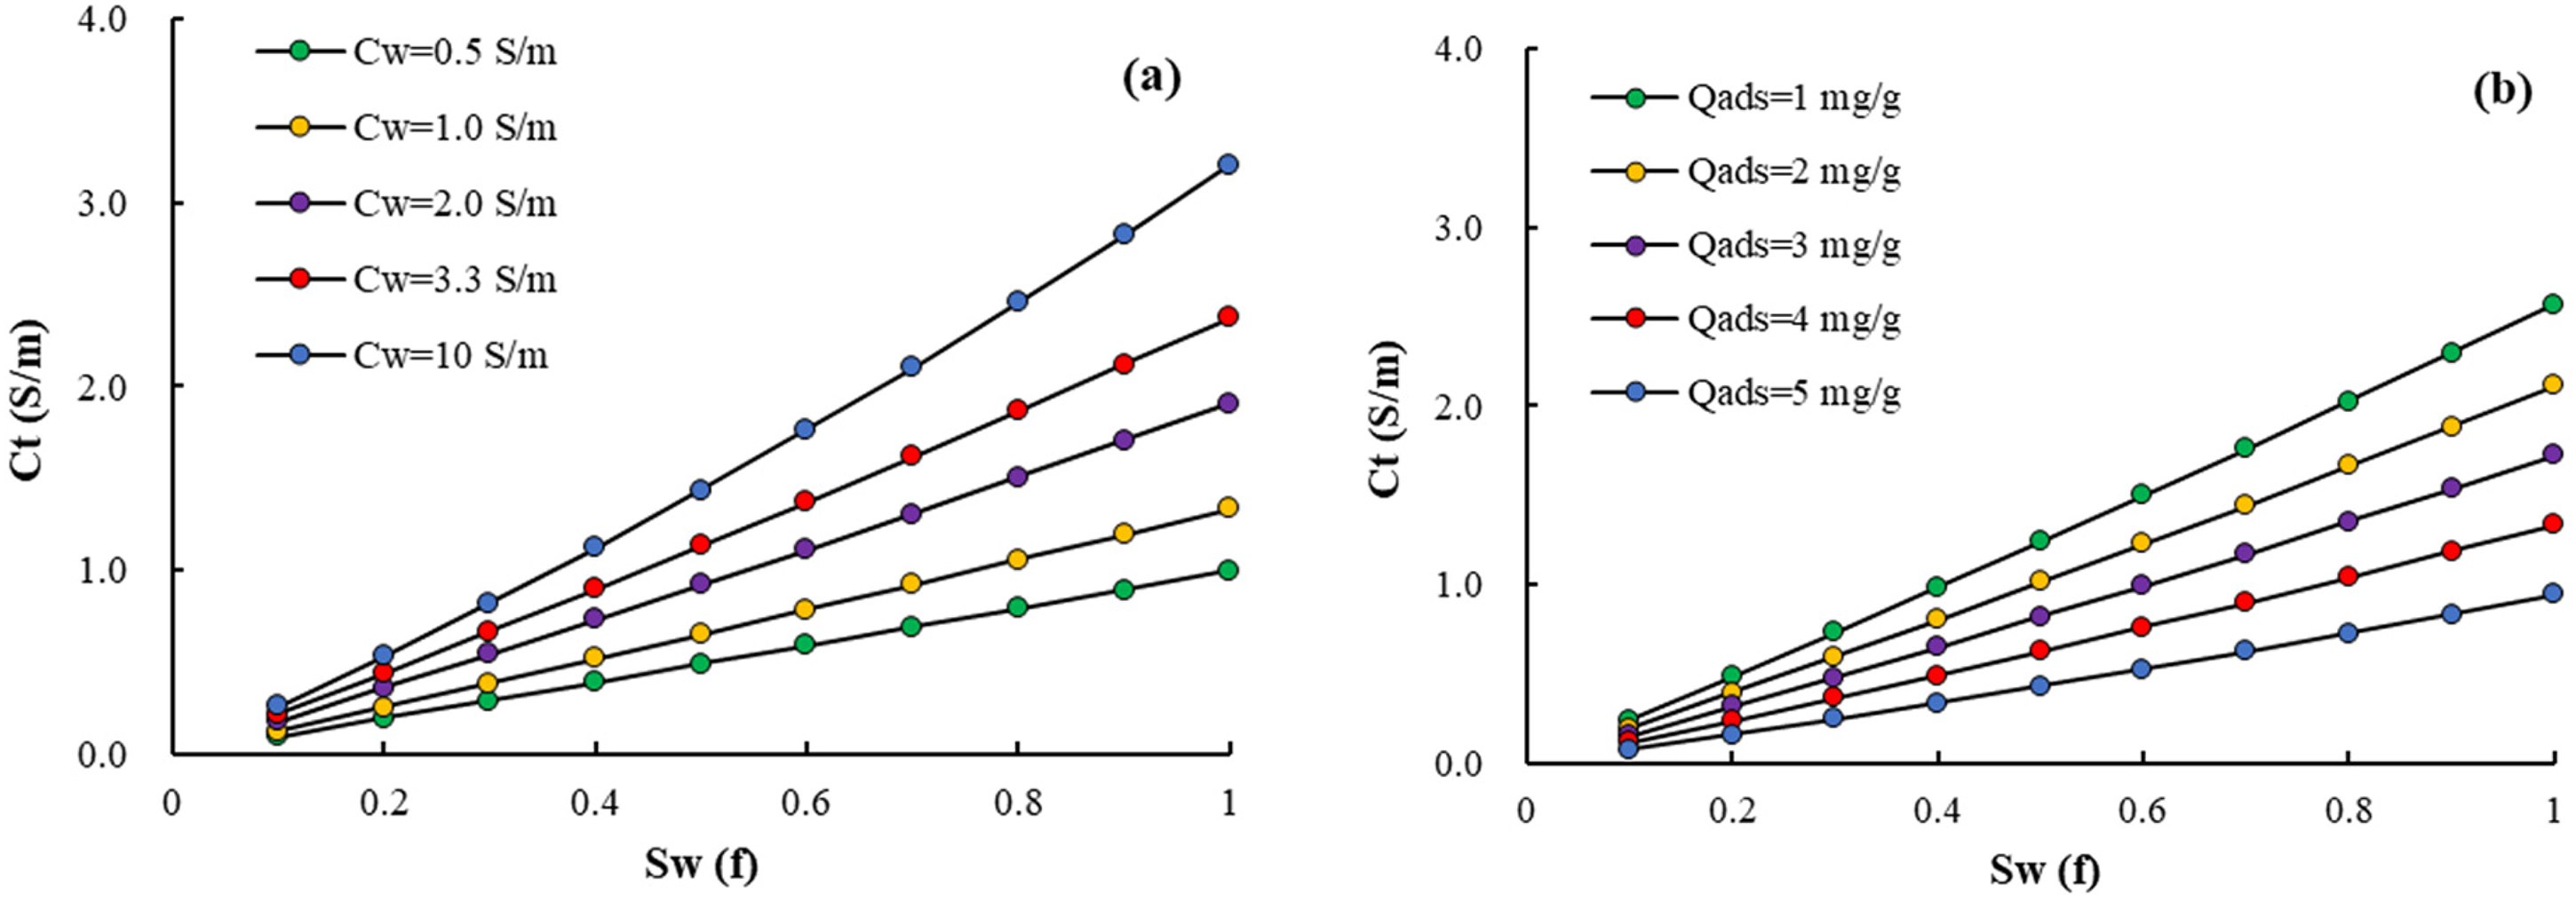
The influence of the changes in the electrical conductivity Cw of formation water (a) and the amount of oil adsorbed Qads by clay minerals (b) on the model.
Parameter determination
According to the modified Waxman–Smits (W–S) model, the key parameters required for calculating rock conductivity include formation water conductivity (Cw), equivalent conductivity of exchangeable cations (B), formation factor (F), water saturation (Sw), original cation exchange capacity of clay minerals (Qvo), and the coefficient a. Among these, Cw can be derived from the known relationship between the resistivity of NaCl solutions, their salinity, and temperature. The B value is calculated using the following equation:
The formation factor (F) can be obtained through rock electrical experiments or indirectly estimated using inversion techniques based on the classical W–S model. Water saturation (Sw) is determined through saturation analysis of shale samples and can be further constrained and predicted across the shale interval using well log data. The original cation exchange capacity of clay minerals (Qvo) is measured directly through laboratory experiments. The correlation coefficient a, representing the relationship between the amount of oil adsorbed by clay minerals and the loss in cation exchange capacity (Qvo − Qvr), must be calibrated using results from multi-temperature-stage pyrolysis experiments on clay minerals.
Model application
Oil adsorption in shale primarily comprises two components: adsorption by kerogen and adsorption by clay minerals. The evaluation methodology, procedures, and results for kerogen adsorption have been detailed in previous sections. In this study, kerogen adsorption capacity was calculated using the model developed by Li et al. (2023), while clay mineral adsorption capacity was evaluated using the improved Waxman–Smits (W–S) model proposed herein.
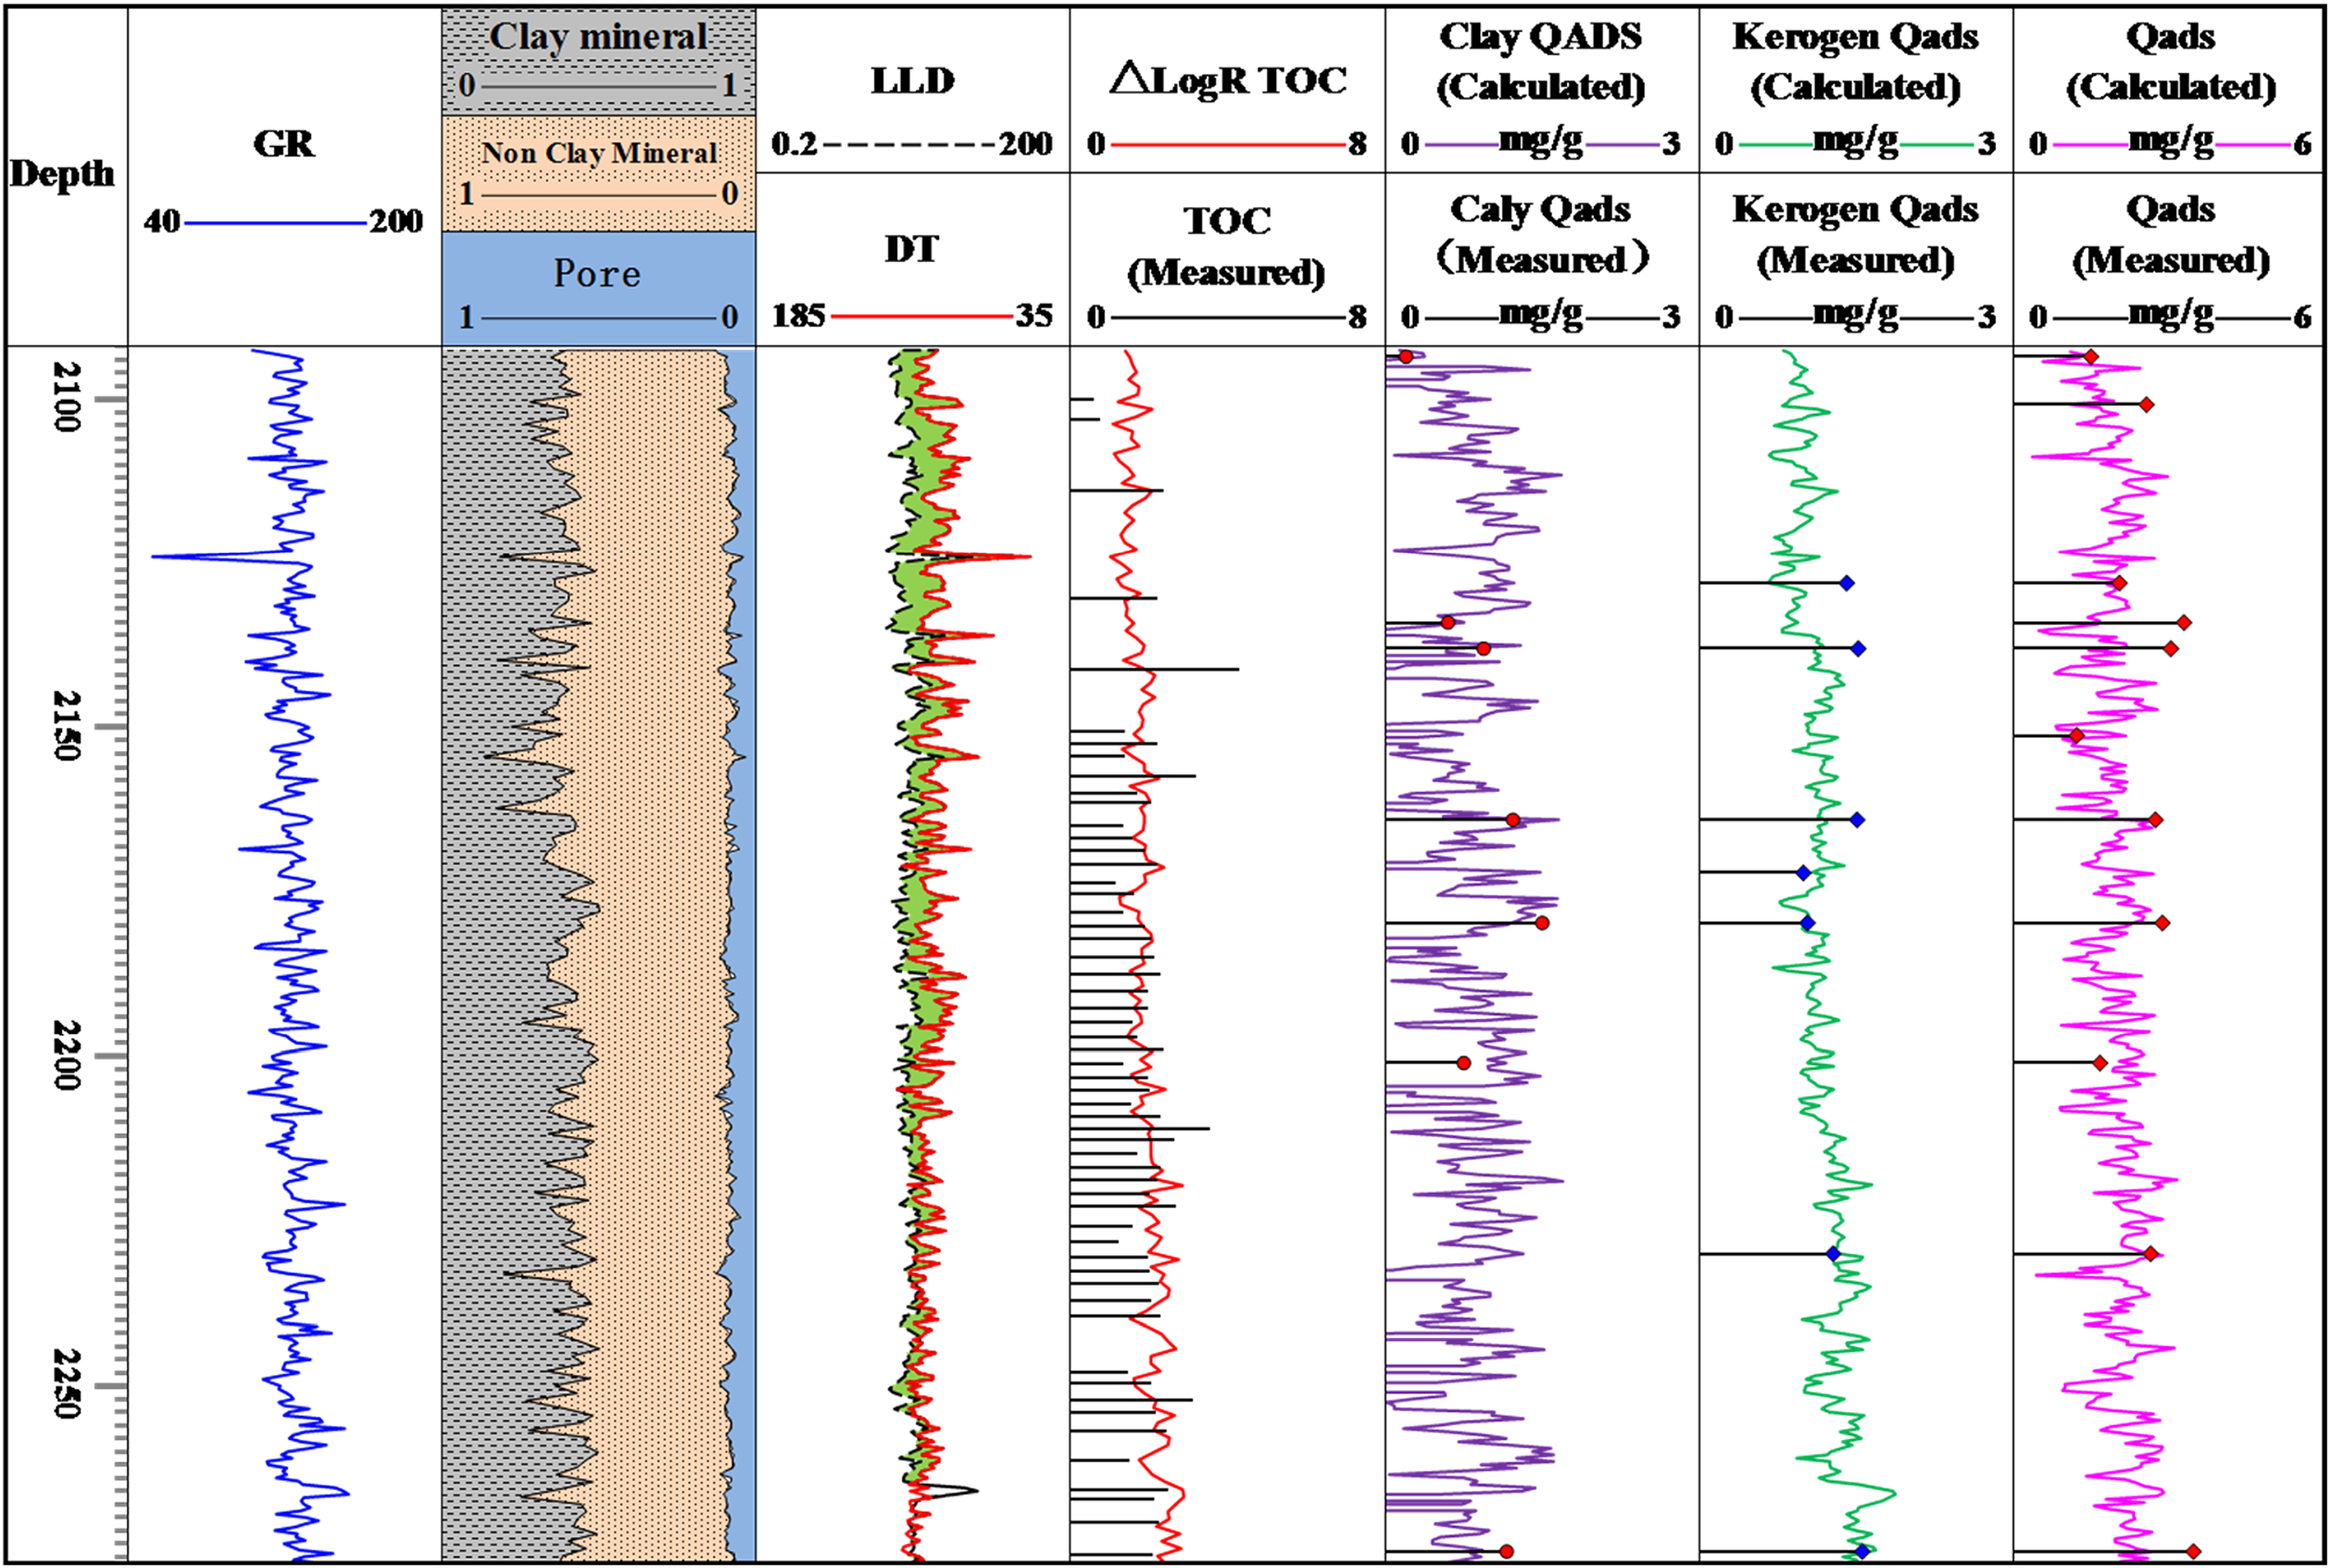
Figure 8 presents a composite column chart for the example well interval. Within the target shale oil reservoir section, clay mineral content ranges from 30% to 40%, porosity ranges from 5% to 10%, and water saturation generally falls between 50% and 60%. Based on the model predictions, clay mineral adsorption capacity ranges from 0.43 to 2.86 mg/g, consistent with the measured values (Figure 8). Kerogen adsorption capacity varies from 0.23 to 2.67 mg/g. The total predicted oil adsorption capacity ranges from 0.36 to 3.97 mg/g, with an average of 1.65 mg/g. Due to the relatively high clay mineral content in this mudstone-dominated interval, the contribution of clay minerals to total oil adsorption is correspondingly significant.
Comparison between predicted and measured adsorption oil of clay mineral.
A comparison between predicted and measured clay mineral adsorption capacities shows good agreement, with an average relative error of 34% and an average absolute error of 0.29 mg/g (Figure 9), meeting acceptable accuracy thresholds. These results confirm that the improved W–S model developed in this study provides a reliable method for predicting the oil adsorption capacity of clay minerals in shale oil reservoirs.
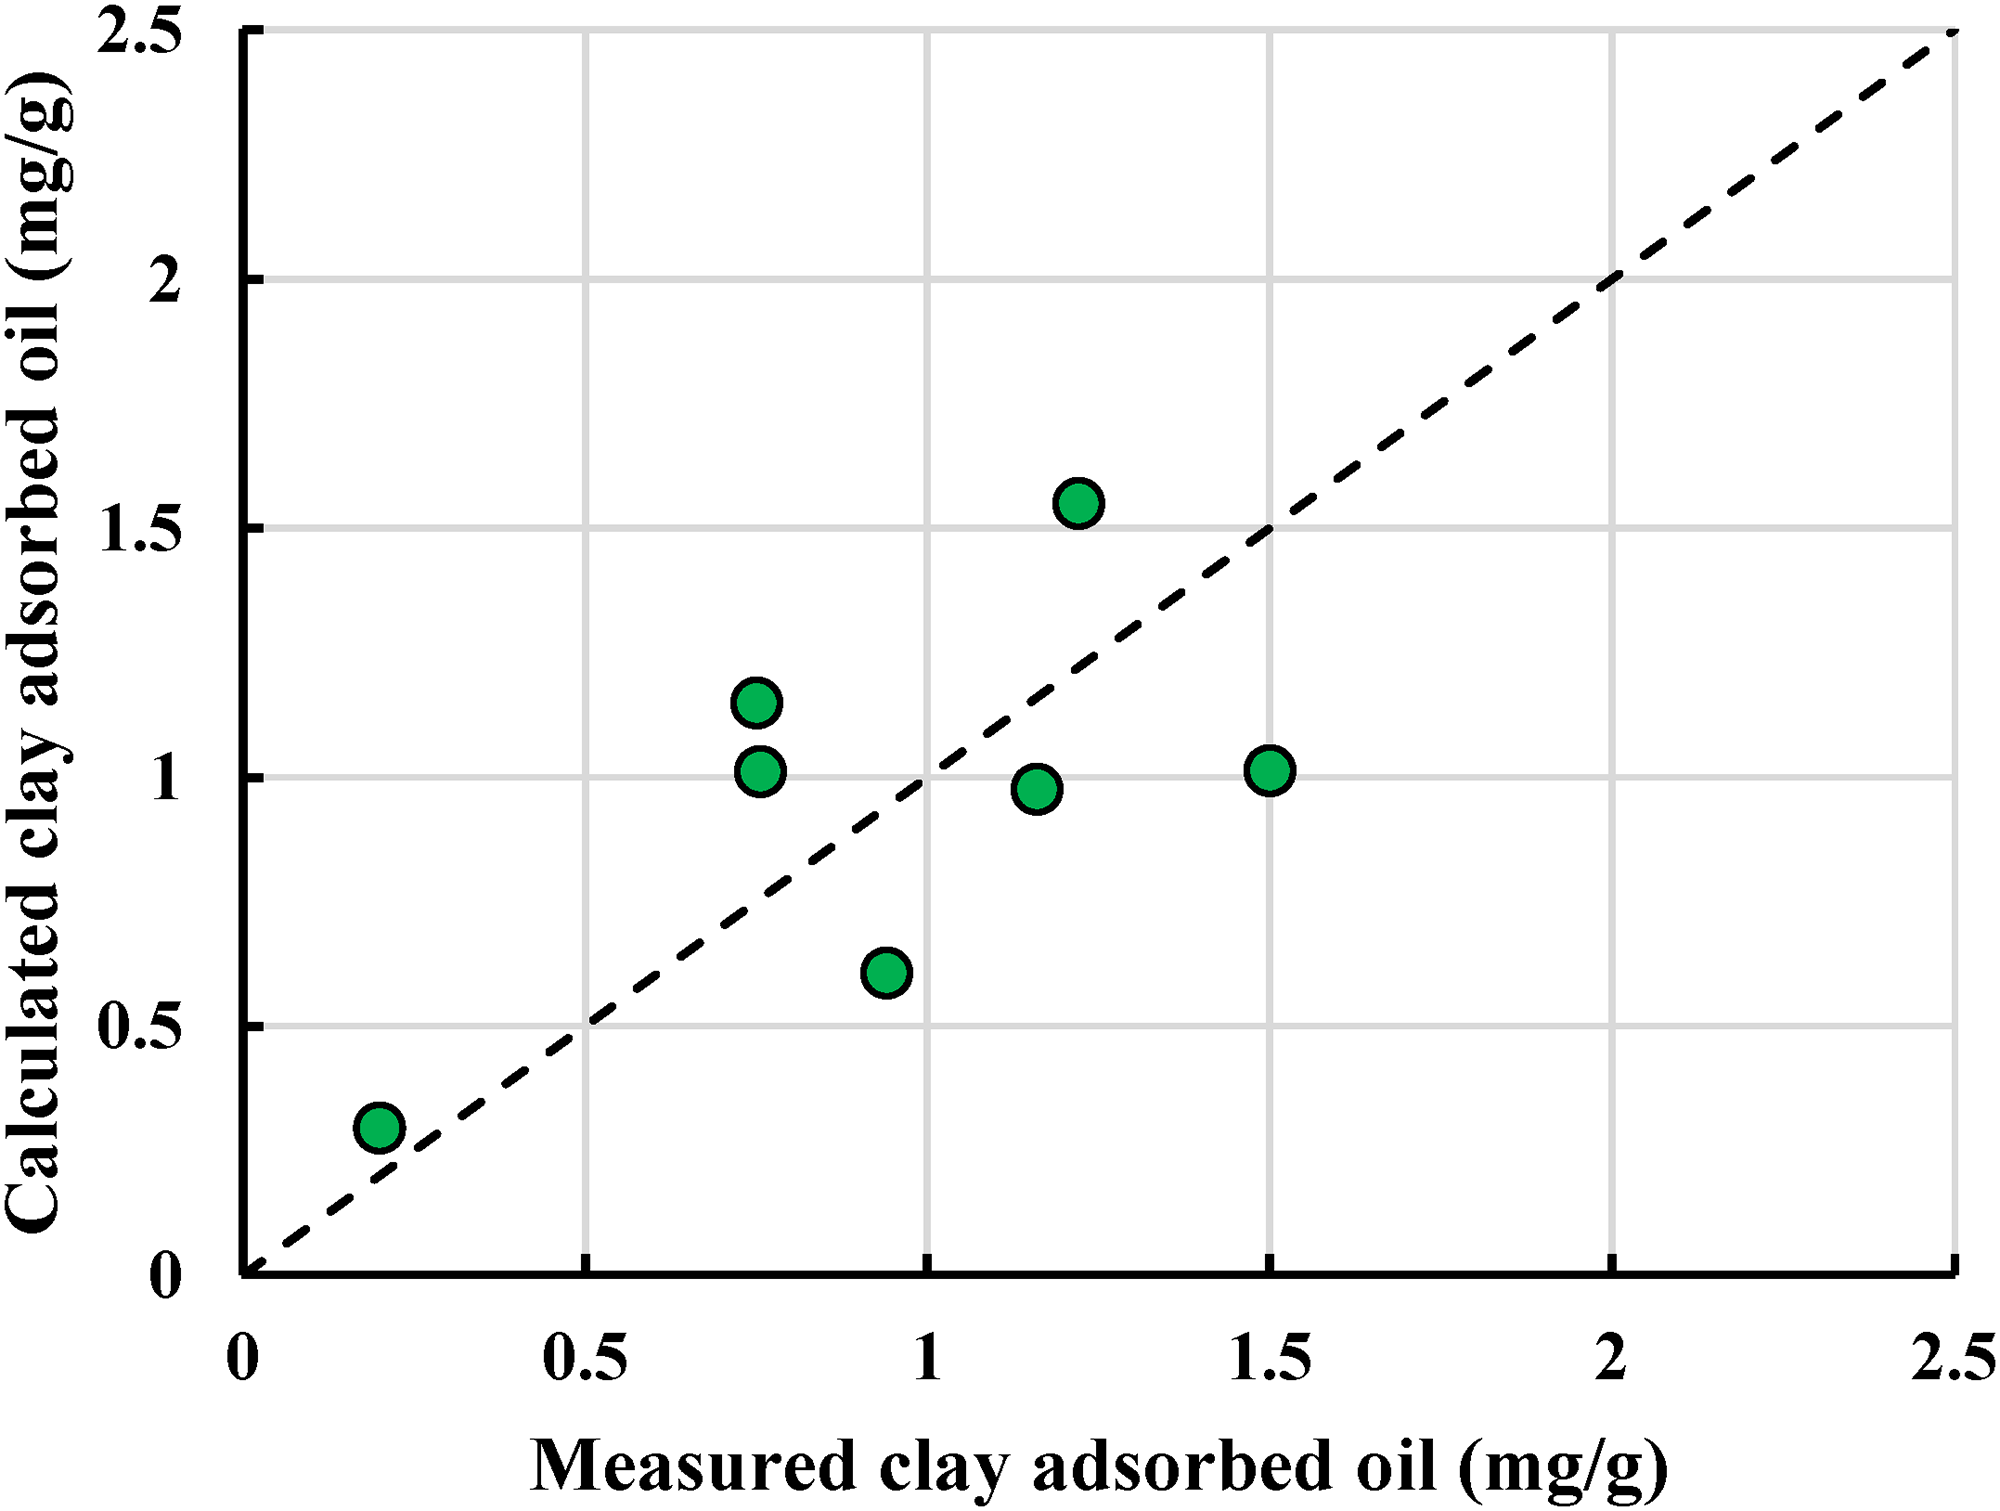
Comparison between predicted and measured adsorption oil of clay mineral.
Conclusion
Cation exchange capacity (Qv), along with clay mineral content and specific surface area, is a key parameter for evaluating oil adsorption by clay minerals in shale. As Qv increases, the number of available adsorption sites for hydrocarbon molecules on clay surfaces also increases, indicating a strong positive correlation between Qv and oil adsorption capacity. Unlike specific surface area, which requires laboratory measurement, Qv can be quantitatively estimated from well logging data.
Based on the classical Waxman–Smits (W–S) model, a modified W–S model was developed to assess the oil adsorption capacity of clay minerals in shale reservoirs. The modified model incorporates a quantitative relationship between adsorption oil and the Qv of clay minerals, enabling rapid and continuous evaluation of clay mineral oil adsorption directly from log-derived parameters, with accuracy meeting the requirements for practical applications.
The modified W–S model provides a novel and effective approach for quantifying oil adsorption by clay minerals in shale. It also offers valuable insights for evaluating shale reservoir quality, optimizing target intervals, and informing strategies for enhanced oil recovery.
Footnotes
Acknowledgments
This research was supported by the Open Fund Project of the Petroleum Accumulation Laboratory, Sinopec, under the project titled “Mechanism of Adsorbed Oil Occurrence in Nanopores and Logging Evaluation Method in Gulong Shale” (No. 33550007–22-ZC0613–0036).
Funding
The authors disclosed receipt of the following financial support for the research, authorship, and/or publication of this article: This work was supported by the Open Fund Project of the Petroleum Accumulation Laboratory, Sinopec (grant number 33550007-22-ZC0613-0036).
Declaration of conflicting interests
The authors declared no potential conflicts of interest with respect to the research, authorship, and/or publication of this article.