
Abstract
The research work proposes a novel high-gain boost converter (HGBC) with a Grasshopper Optimization Algorithm (GHO) Maximum Power Point Tracking (MPPT) for a solar photovoltaic (SPV)system. Traditionally used boost converters have low voltage gain, high switching stress, and poor dynamic response under partial shading and fast varying irradiance conditions. Further, traditional MPPT methods exhibit slow convergence behavior and are unable to achieve accurate global MPPT under nonlinear operating conditions. The HGBC utilizes a multi-inductor and multicapacitor topology, which establishes high voltage conversion gain in addition to low switching stress with enhanced output stability. The GHO algorithm dynamically varies the duty cycle to facilitate rapid and precise global MPPT. The proposed system is modeled and analyzed using MATLAB simulation under steady-state and dynamic irradiance (500–1000 W/m2). Results exhibit that the proposed HGBC–GHO achieves a peak efficiency of 93.6%, which is greater than that of Whale Optimization Algorithm (92.4%), Adaptive Neuro Fuzzy Inference Systems (91.4%), Marine Predator Algorithm (MPA) (91.2%), Fuzzy Logic Control (90.4%), and Artificial Neural Network (ANN) (89.8%). It shows a fast convergence time of 0.17 s, low output ripple at 1.2%, and reduced computational effort with only 65 iterations, compared with MPA's 150 and ANN's 125 iterations. At dynamic irradiance (1000, 700, and 500 W/m2), the output power levels of the system are stable at 204.5, 108.1, and 56.02 W, respectively, with a settling time of less than 36 ms. These results demonstrate improved tracking accuracy, reduced oscillations, and enhanced dynamic responses, thus confirming the proposed HGBC–GHO's performance potential for SPV applications.
Keywords
Introduction
Worldwide demand for electrical energy has increased due to the fast rise of urbanization, industry, and the continuous improvement of people's socioeconomic status. Consequently, the power sectors are using capacity augmentation programs to boost the quantity of electricity that can be produced (Khan and Islam, 2021). Natural fuels are the main source of energy used by traditional power plants to produce electricity. Fuels of this kind include diesel, petrol, and coal. The Indian government has released figures showing thermal power plants share more than 60% of the country's demands. And 52.6% of the power used in the country comes from coal-fired power plants, 1.7% from lignite, 6.5% from petrol, and 0.1% from diesel. However, RER (renewable energy resources) was responsible for 40% of the remaining amount (Basha and Rani, 2020). A few disadvantages of conventional power plants include their finite resource base, their unstable fuel prices, and their release of pollutants into the atmosphere (Mariprasath et al., 2019). As a result, RER plays a vital role in the generation of electrical energy.
RER include solar, wind, water, and tidal power. With the right technique, RER is transformed into a form suitable for extraction of electrical power (Mariprasath et al., 2021). In wind power plants, for example, blades are employed to help convert kinetic energy into electrical energy. Kinetic energy is produced as a result of the blades rotating when air comes into contact with them. This mechanical energy is utilized to bring the turbine into rotation. It is somehow related to the wind generator. As a result, it generates electrical energy in line with the induction principle. Some of the disadvantages of the technology are that it requires a larger land area, is expensive to start, and is hard to maintain (Basha and Rani, 2020). Furthermore, it exacerbates the current issues with the grid's quality of energy. Therefore, in order to achieve the standards outlined to provide appropriate power quality, the cost of the compensatory equipment must be raised. Still, India ranks fourth in the world right now for the quantity of electricity generated by wind farms. India has an installed capacity of 38.789 gigawatts overall.
Additionally, because the cost of the solar photovoltaic (SPV) cell is gradually declining every day, solar-based power plants are approaching an impact growth rate. This is a direct outcome of the price gradually falling. The basic idea underlying photovoltaic (PV) power generation is the PV effect. SPV is constructed of P-type semiconducting materials and is encircled by N-type semiconductor materials (Sim et al., 2021). P-type semiconducting materials contain fewer electrons than N-type materials made by the semiconductor. The N-layer will migrate in the direction of the P-layer when the solar cell is exposed to sunlight because the excited electrons in the N-type material will cause them to move. A load is connected across the P- and N-type semiconductor materials in order to collect the current generated by the PV effect (Sohani et al., 2021).
Even though a single PV cell has a maximum voltage of 0.7 V, this value is insufficient to power the load. Consequently, the quantity of PV cells utilized to create cell strings is linked in series. After that, a specific number of cell strings are connected to one another to make the module. The number of modules that are linked to one another makes up the string. The region that receives solar radiation, also known as the catchment area, is significantly increased by this process in order to boost the quantity of power that SPV is capable of producing (Mirza et al., 2020). Currently, the mono, poly, and thin film types of SPV cell technologies are the most widely used types. The costliest of these alternatives is monocrystalline. Conversely, the efficiency of monocrystalline is comparable to all other kinds. Furthermore, compared to other solar panel types, monocrystalline SPV uses less area to produce the same quantity of power. However, in terms of cost, polycrystalline is the better choice when compared to other varieties (Misaghi and Yaghoobi, 2019).
To meet consumer requirements, it is necessary to increase the PV voltage generated by boost converters. The primary components of the boost converter are the inductor, capacitor, and switch. The voltage stepup is based on the adjustment of the duty cycle of the boost converter. When the duty cycle is increased, the corresponding output voltage is also enhanced, and vice versa. The limitations of traditionally used boost converters are low voltage gain, more power loss due to excessive heat generation, and voltage stress across the components used in them. Hence, isolated converters have been developed to suppress the limitations of the existing converter. However, their cost and size are bulky due to the magnetic components used. Also, high-voltage and current harmonics are produced (da Rocha et al., 2020).
The available irradiance, the temperature of the cell, and the ambient air all have a significant impact on potential SPV energy production. It is not possible for the SPV system to generate steady amounts of power all day long due to the fact that the available radiation in the Earth's atmosphere varies continuously with time. As a result, the voltage and current have a nonlinear connection. Therefore, maximizing the power of the SPV is a crucial task. An innovative technology called Maximum Power Point Tracking (MPPT) has been incorporated into the SPV system in order to maximize its power output. The MPPT is responsible for monitoring the maximum power point (MPP) and keeping the SPV system operating at that precise point. Meanwhile, the MPP point itself changes with time. As a result, MPPT continuously records the MPP using both recent and historical data. All MPPT strategies rely on measurements of the power generated both historically and currently to monitor the MPP. There has been substantial debate over the most crucial criterion for monitoring the MPP, namely the approach that should be employed (Bhattacharyya et al., 2020).
Recent advancements in renewable energy systems and intelligent control strategies have significantly contributed to the reliability and efficiency of PV-based power generation. A research article (Senapati et al., 2024) demonstrated the effectiveness of computational intelligence-based MPPT techniques, supported by small-signal analysis, in enhancing PV system performance under dynamic operating conditions. Similarly, the role of intelligent control in stabilizing DC (direct current) microgrids for electric vehicle charging ecosystems was emphasized by the authors, showcasing the interdependence between renewable energy integration and modern transportation needs. In parallel, highlighted the importance of intelligent load forecasting and renewable integration for improving grid reliability, reinforcing the necessity of advanced predictive and control mechanisms. Furthermore, adaptive optimization approaches, such as the modified adaptive Jaya algorithm proposed (Saxena et al., 2024) have shown promising results in improving MPPT resilience under partial shading and variable load conditions. Complementing these contributions (Prakash et al., 2023) investigated the modeling and dynamic stability of grid-following inverters integrated with PV systems, providing insights into maintaining system stability while maximizing renewable penetration. These studies collectively highlight the growing role of computational intelligence, optimization, and stability-focused designs in advancing PV-based renewable energy systems, thereby justifying the present investigation.
Contemporary developments in SPV systems have increasingly focused on overcoming partial shading and dynamic irradiance challenges through intelligent MPPT techniques and optimization algorithms (Senapati et al., 2026). A novel Sooty Tern Optimization-based MPPT was proposed for handling complex shading conditions with superior convergence by Kaaitan et al. (2025). A broad comparison of optimization strategies and MPPT controllers in solar systems was presented by Güven (2024), highlighting the advantages of metaheuristic algorithms under nonlinear conditions. Enhancing real-time adaptability, Mohammed Nafa et al. (2025) introduced a sensorless particle swarm optimization (PSO)-MPPT approach coupled with internet of things (IoT)-based irradiance prediction to improve accuracy and reduce system cost. Addressing global MPPT, the Marine Predator Algorithm (MPA) was employed by Vankadara et al. (2022) to handle partial shading effects efficiently. In terms of controller responsiveness, Ibrahim et al. (2025) demonstrated that fuzzy logic-based MPPT improves dynamic performance under varying irradiance. To achieve fast tracking with robust disturbance rejection, Ibrahim et al. (2025) applied the Horse Herd Optimization Algorithm combined with dynamic linear active disturbance rejection control for PV battery charging. Hardware–software integration was explored by Meenakshi Sundaram et al. (2019), who developed a novel converter and MPPT hybrid for optimized power harnessing. Real-time experimentation was carried out by Abdelmalek et al. (2024), validating a hybrid Grey Wolf Equilibrium Optimization technique that enhanced overall system efficiency. Cost-effective implementations of conventional algorithms using Proteus simulations for flyback converters were investigated by Saleh et al. (2020). In a grid-interactive context, Oliver et al. (2022) optimized MPPT integration for brushless direct current pump operation, improving energy reliability. Hybrid control approaches were further enhanced by Deghfel et al. (2024a), introduced a genetic algorithm-WOA (Whale Optimization Algorithm) MPPT scheme coupled with model reference adaptive control. A low-cost, current sensorless fuzzy MPPT for solar battery charging was presented by Yaqoob et al. (2023), offering simplicity without sacrificing accuracy. For enhanced tracking under partial shading, a Zebra Optimization Algorithm-based MPPT was experimentally validated by Abdelmalek et al. (2025). Similarly, Belghiti et al. (2024) developed a robust integral model reference adaptive control-controlled adaptive fractional open-circuit voltage algorithm for standalone systems, ensuring sustainable performance. The general applicability of metaheuristic algorithms in MPPT under shaded conditions was examined by Vankadara et al. (2023), reinforcing their adaptive strength. In grid-connected applications, a hybrid MPPT was proposed by Zaghba et al. (2024) to improve performance under atmospheric variability, Abbas et al. (2023) conducted a comparative study of traditional MPPTs versus PSO under fast-changing irradiance, affirming the superiority of swarm-based methods. Expanding beyond PV, Rekioua et al. (2024b) applied hybrid MPPT approaches to wind systems with hybrid storage, demonstrating algorithmic flexibility. For multisource hybrid energy systems, a coordinated power management strategy using hybrid MPPTs was also proposed by Rekioua et al. (2024a). Enhancing robustness further, Deghfel et al. (2024b) employed a super-twisting sliding mode controller with Grey Wolf Optimizer (GWO) to boost MPPT efficiency. A broader evaluation of metaheuristic versus classical MPPT approaches was conducted by Naseem et al. (2021), revealing that intelligent methods are more effective for global maximum power point tracking. The versatility of MPPT methods was highlighted by Devakirubakaran et al. (2024), applied Adaptive Neuro Fuzzy Inference Systems (ANFIS)-based MPPT in proton exchange membrane (PEM) fuel cells. A comparative techno–economic analysis of grid–connected PV–battery and PV–fuel cell systems for sustainable academic laboratory applications was conducted by Agajie et al. (2025), highlighting the viability and effectiveness of hybrid renewable energy configurations. In electric vehicle charging applications, Panchanathan et al. (2025) demonstrated a boost converter using Perturb & Observation (P&O)-based MPPT for improved charging performance. The importance of metaheuristics in integrated PV systems was extensively reviewed by Sharma et al. (2023). Supporting nanogrid applications, a multi-input DC–DC converter for SPV integration was proposed by Natarajan Vijayanathan et al. (2024). Enhanced transient performance using interleaved boost converters was studied by Sarkar et al. (2021), while further improvement using a three-step converter was examined by Sarkar et al. (2022). Authors in Belmadani et al. (2023) introduced a guided Seagull Optimization Algorithm for MPPT under partial shading, showcasing improved tracking accuracy and robustness. The efficiency enhancement in PEM fuel cells through a bio-inspired MPPT framework designed to operate under variable temperature (Kebbab et al., 2026), hydrogen flow, and load conditions, demonstrating that adaptive swarm-based tracking significantly improves electrochemical power extraction compared to classical perturbative schemes. Building upon fuel cell optimization, Bettahar et al. (2025) shift focus to a solar-driven application, proposing a smart single-stage solar battery desalination system that integrates hybrid MPPT with optimal control, where intelligent power tracking directly enhances brackish water treatment efficiency under fluctuating irradiance. Extending hybridization further in PEM systems, Badoud et al. (2025) introduced an adaptive type-2 fuzzy MPPT tuned using Lightning Search and Whale Optimization, improving robustness against uncertainty and nonlinear parameter variations in fuel cell dynamics. In grid-connected renewable systems, Dunna et al. (2024) propose a super-twisting sliding mode MPPT combined with a higher-order observer for PV/battery integration, achieving strong disturbance rejection and minimized steady-state oscillations under grid and load perturbations. Continuing with PEM-focused optimization, Bouguerra et al. (2024) employ Flying Squirrel Search Optimization and Cuckoo Search MPPT techniques to enhance fuel cell efficiency in dynamically operating environments, highlighting improved convergence and resilience against rapid operating point shifts. Then provide a comprehensive review of classical, artificial intelligence (AI)-based, and metaheuristic MPPT strategies in PV systems, concluding that hybrid and swarm-based approaches outperform traditional techniques under partial shading and fast irradiance transitions (Yaqoob et al., 2025). Complementing advanced control strategies, Deghfel et al. (2024c) combine a super-twisting algorithm with GWO to improve PV MPPT accuracy, dynamic response, and ripple reduction, reinforcing the effectiveness of integrating sliding mode control with swarm intelligence. Nadimuthu et al. (2025) broaden the application scope by integrating a solar-thermoelectric mobile storage system with electric vehicles to reduce postharvest losses during agro-produce transportation, demonstrating how intelligent energy harvesting and optimized storage management can enhance sustainability beyond conventional grid or standalone PV systems. Various optimization algorithms have been systematically compared to enhance the optimal placement and sizing of PV-distributed generation across diverse network configurations, demonstrating improved efficiency, loss reduction, and voltage profile enhancement (Özden and Ertekin, 2026). Collectively, these studies demonstrate a clear research trajectory toward intelligent, adaptive, and hybrid MPPT strategies integrated with advanced converter topologies for maximizing the efficiency and reliability of next-generation SPV systems.
The Improved Invasive Weed Optimization (IIWO) algorithm proposed (M. Misaghi and M. Yaghoobi, 2019) provides an effective global search ability through chaos theory, faster convergence speed, and good performance in optimal proportional–integral–derivative controller design. Expanding on this argument, Mohsen Jalaeian Farimani et al. (2025) proposed an Event-Triggered Dynamic Seed IWO (ET-DSIWO) in Nonlinear Dynamics to dynamically adapt the seed generation during execution by absorbing information of past individuals, which proposes more robustness for nonstationary optimization problems affected by time-varying conditions. Furthermore, Benyamin Katanchi et al. (2024), in Electric Power Components and Systems, researched advanced multiobjective optimization solutions for distribution network reconfiguration with consideration of distributed generations, electric vehicle charging stations, and demand response programs to provide system efficiency improvement, loss minimization, and operational flexibility. In summary, the presented studies demonstrate the evolutionary enhancement of IIWO and hybrid optimization methods from control system design tasks during its early versions to applying them in complex, real-world power system problems characterized by a wider applicative context including improved convergence behavior, adaptability, and multiobjective decision-making capability.
This manuscript presents several novel contributions toward enhancing the efficiency and adaptability of SPV systems under dynamic environmental conditions. First, a new high-gain boost converter (HGBC) topology is proposed, which achieves significantly higher voltage gain and improved power quality by reducing switching stress and suppressing output harmonics. Second, an intelligent MPPT technique based on the Grasshopper Optimization Algorithm (GHO) is developed and integrated into the system. The GHO-MPPT method introduces a swarm-intelligence-based approach capable of fast convergence, global MPP detection, and robust performance under partial shading and rapidly fluctuating irradiance. Third, a comprehensive performance evaluation is conducted through simulations, comparing the proposed HGBC-GHO system against conventional and advanced MPPT methods including P&O, incremental and conductance (INC), Artificial Neural Network (ANN), Fuzzy Logic Control (FLC), ANFIS, WOA, and MPA. Results demonstrate that the proposed method consistently outperforms all benchmark techniques in terms of tracking accuracy, response time, voltage gain, and overall energy conversion efficiency—achieving a peak efficiency of 93.6%. These contributions collectively advance the state-of-the-art in converter design and bio-inspired MPPT strategies, providing a high-performance and scalable solution for next-generation SPV applications.
The manuscript is structured into six well-defined sections to systematically present the proposed methodology and its validation. The first section introduces the motivation behind the study, emphasizing the limitations of conventional boost converters and MPPT techniques in SPV systems under dynamic climatic conditions. The second section provides a critical review of existing MPPT algorithms, including classical, intelligent, and bio-inspired approaches, outlining their operational principles and associated drawbacks. The third section describes the proposed HGBC topology in detail, including its circuit configuration, operating modes, and mathematical modeling. The fourth section discusses the implementation of advanced swarm-based MPPT algorithms, with a particular focus on the GHO, and compares it against the MPA and WOA. The fifth section presents the simulation results and comparative analysis of different MPPT strategies integrated with the proposed converter under varying irradiance levels, highlighting the superior performance of the HGBC-GHO system. Finally, the sixth section concludes the manuscript with key findings, emphasizing the advantages of the proposed approach in terms of tracking efficiency, voltage gain, and real-time adaptability, while suggesting its applicability for future SPV system designs.
Critical study on existing SPV
The P&O approach uses both the current and previous period's power. First, the appropriate sensors pick up the voltage, V(x), and the current, I(x). Next, a notation called P(x) is used to approximate the power. By measuring the instantaneous voltage V(x + 1) and current I(x + 1), one can estimate the present power, P(x + 1), after a certain amount of time has passed. Then, we compare the previous power, P, with the current power, P(x + 1) (Bouaouaou et al., 2022). If the difference between the current and previous power outputs is zero, then there is no neighboring node on the duty cycle. Recheck at a later time if the difference between the current and prior powers is greater than zero, and recheck at a later time whether the current and previous voltages are both greater than zero. If the condition is satisfied, the duty cycle of the switching device should be either reduced or increased. The duty cycle will be increased if the voltage difference between the current and previous voltages is greater than zero and the condition is met at this moment; otherwise, it will be decreased. To keep track of the MPP, this is the simplest MPPT algorithm that may be used. The program tracks the MPP well under steady-state conditions but fails under scenarios involving partial shading condition or rapid climatic change (Gaur, 2021).
The incremental conductance method accounts for variations in both voltage (dV) and power (dP). When the voltage-to-power ratio is zero, it means the MPPT is operating at full performance. The SPV can function on the left side of the PV curve if the relationship between the change in potential and the change in voltage is greater than zero (Garg et al., 2021). Due to this, increasing the voltage, which results in more power, is crucial. This causes the SPV operating point to move closer to the MPP points. Reducing the voltage increases the power, which in turn brings the SPV's operating point closer to the MPP. Because the MPP lies on the right side of the P-V curve, this phenomenon occurs. By adjusting the duty cycle in this manner, the output voltage may be increased or decreased. A decrease in the duty cycle causes a corresponding decrease in voltage; an increase in the duty cycle causes the voltage to rise.
For optimal solar power extraction in the presence of temperature and irradiance variability (Yilmaz et al., 2018). suggest FLC. Also, a controller for charging batteries has been implemented using proportional integral. Two parameters, error E and change in error delE, were input into the fuzzy logic controller. The voltage Vk and the power Pk indicate the SPV system's current voltage and power, respectively; Vk-1 and Pk-1 represent the voltage and power from the previous stage, respectively. We need to increase the voltage to reach MPP whenever the change in power and the change in voltage are both positive and negative. Conversely, to achieve maximum MPP when the power change is positive and the voltage change is negative, we must decrease the voltage. A set of 48 rules for creating duty cycles based on error and change in error has been established for use in fuzzy implementation. The Ziegler-Nichols approach has been used to determine the proportional gain and integral gain; a PI controller is also necessary for voltage regulation. The integral controller Ki has removed the steady-state error. To investigate how well the suggested MPPT works, a Matlab simulation model was developed. A shift from 94.8% to 99.4% efficiency characterizes the fuzzy-based MPPT. Also, the buck converter's voltage and load current were stable (Bakkar, 2021). Several studies have explored advanced MPPT techniques and high step-up DC–DC converters for SPV and fuel cell systems. A research article is provided a comprehensive analysis of both conventional and soft computing MPPT methods (Motahhir et al., 2017). Further enhancements using AI were discussed by (Kiran et al., 2022), while (Hussaian Basha et al., 2024) introduced a cuckoo search-based MPPT algorithm. Authors proposed (Hussaian Basha et al., 2019b) a transformer less high step-up converter with a hybrid fuzzy logic MPPT controller, complemented by Li et al. (2023) emphasized fuzzy logic and metaheuristic approaches, respectively. Recently, Govinda Chowdary et al. (2019) demonstrated the effectiveness of hybrid MPPT in fuel cell applications with high step-up power converters.
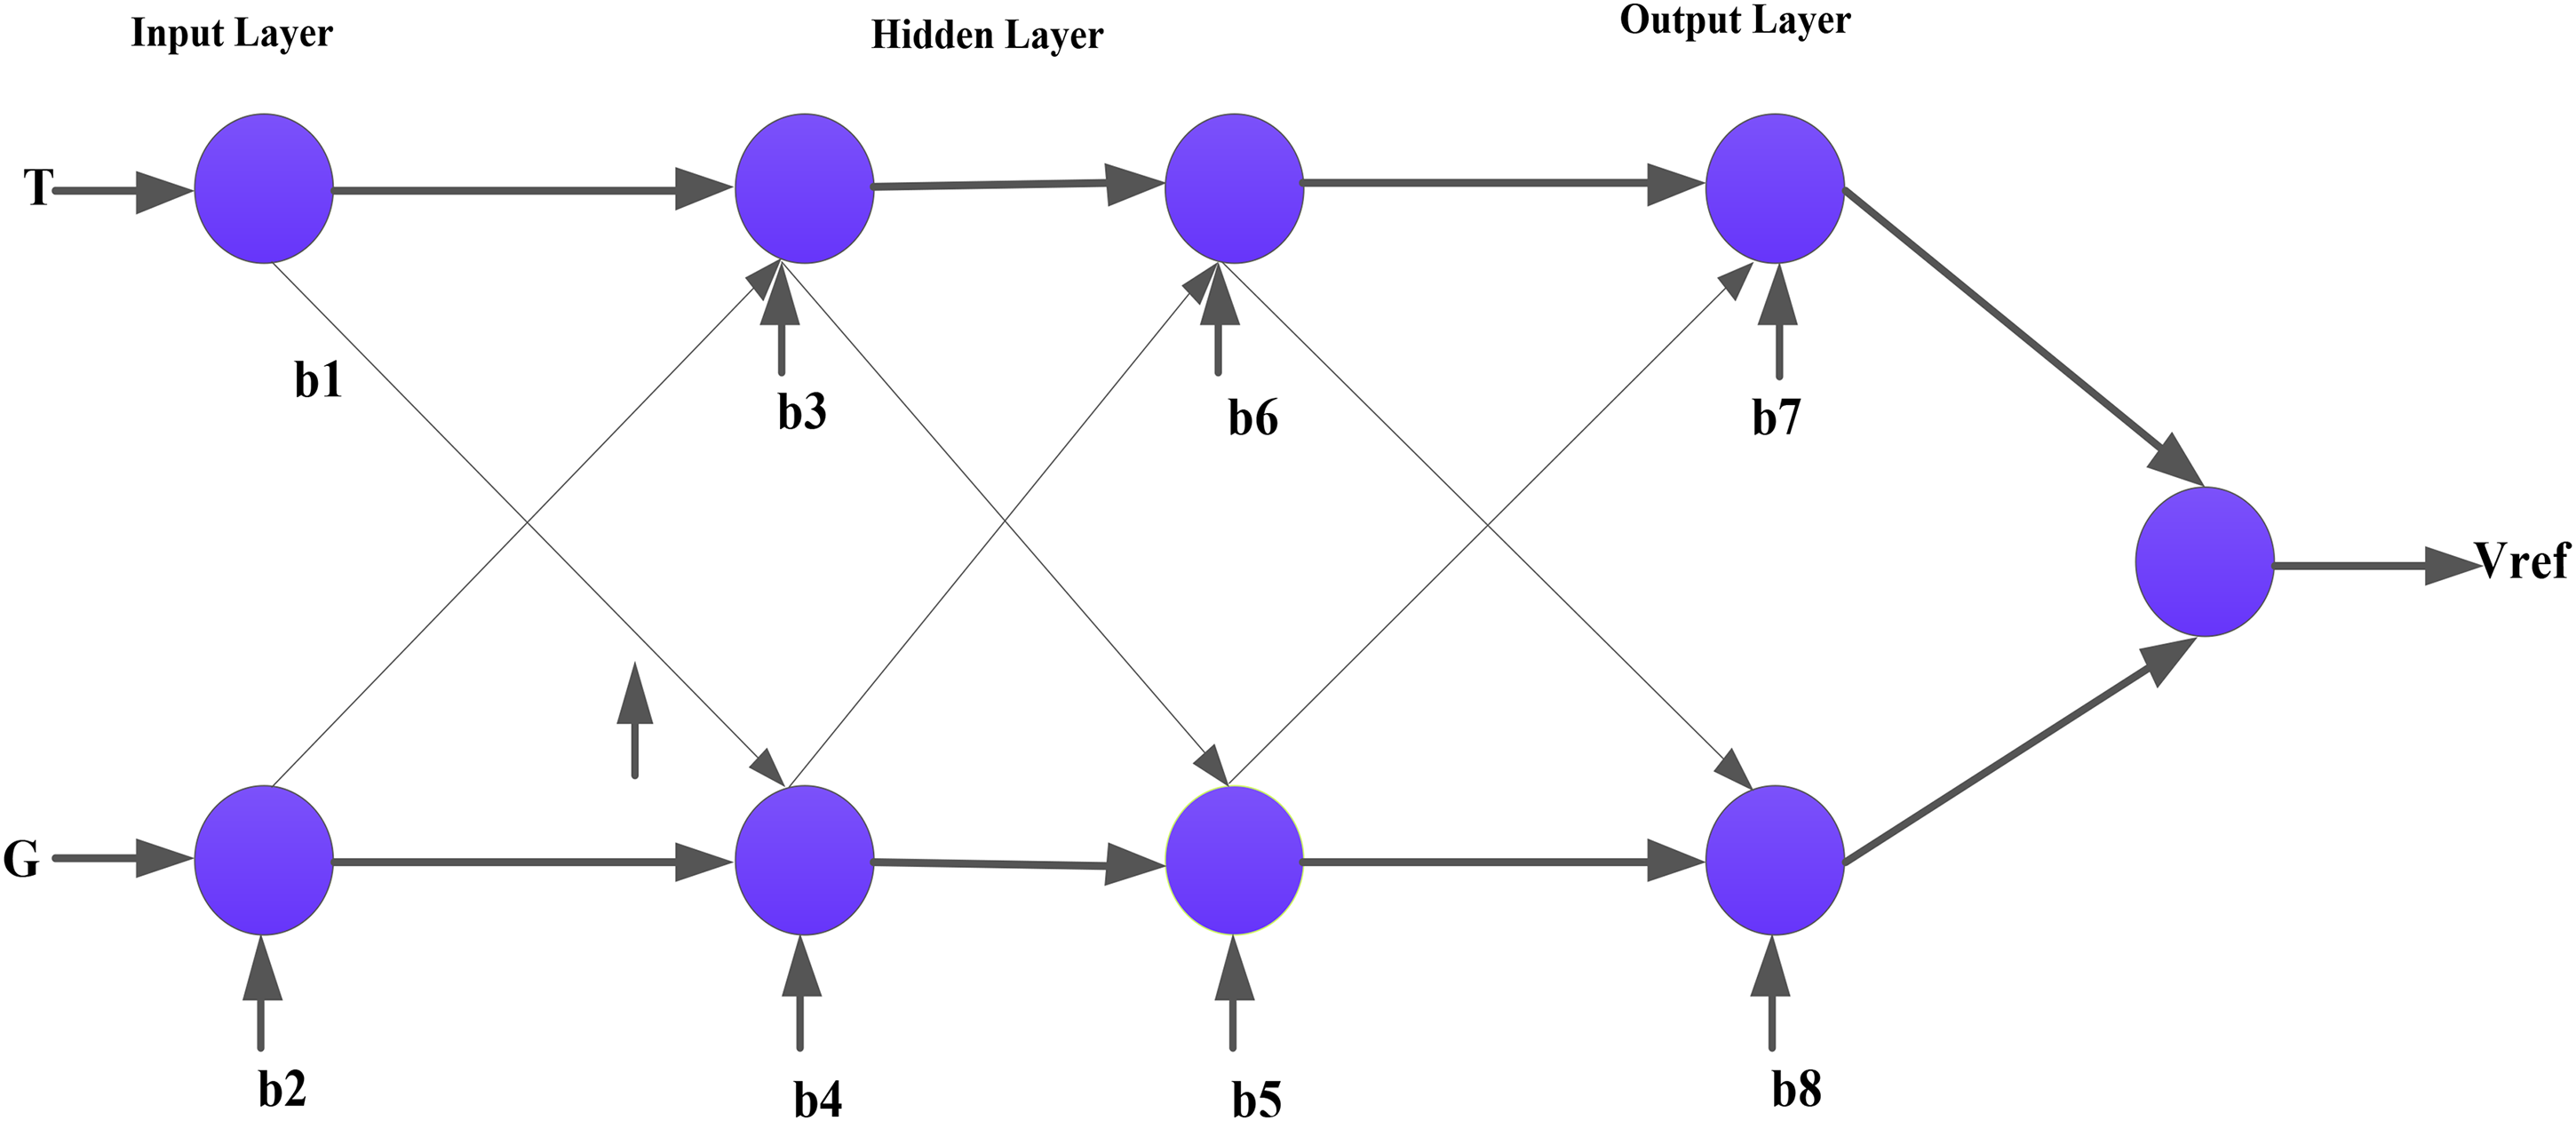
In order to improve upon and overcome the limits of the standard MPPT approach, ANN-based MPPTs were created. The main part of ANN-based MPPT is training. The training has a significant impact on how well one can predict the peak's location (Hussaian Basha et al., 2019a). The output of an ANN-based MPPT is very sensitive to environmental factors like temperature and radiation levels. Thus, the neural network is trained using temperature (T) and irradiation (G) as its input variables. Using three-layer, complex neural networks, the Vmpp may be predicted. The structure consists of three layers: input, a hidden layer, and output. Every layer has its own bias, as has been noted. The input layer is where data such as temperatures and irradiances are received. Processing of the input occurs in the hidden layer, while generation of the Vmpp occurs in the output layer. One method that was mentioned in and used to train the neural network was error-back propagation. The ANN start instruction is the one to use when constructing a neural network model in MATLAB. Out of the thousand data points collected, 70% are used for training the neural network, 15% for training validation, and 15% for model testing. Once the number of hidden layers has been decided, the neural network is trained using the Levenberg–Marquardt method. With this configuration, there are 10 hidden layers. The R-value is 1 since the training and input data fit perfectly, as seen in the regression image (Rizzo and Scelba, 2015).
To get the most out of electric vehicles’ rooftop SPV systems, Santi-Agatino-Rizzo et al. presented an ANN-based MPPT method. They started by taking rapid readings of the PV terminal's voltage and current. Any time the irradiation distribution is altered, the accompanying power change is greater than the threshold value. By integrating P&O and ANN-based approaches, the suggested MPPT method simulates the MPP method. In this case, the P&O approach is able to extract the maximum power since the change in power value is within the threshold value. Alternatively, the MPP is monitored using a local approach, and then an ANN method is applied once the change in power value exceeds the threshold value at any given moment. A back propagation approach with a Levenberg–Marquardt optimization method was employed by the author to train the neural network. In order to train the neural network, current and voltage measurements are utilized. Each layer's weight is first determined at random. Subsequently, a supervised machine learning method was used to appropriately adjust the weight. The discrepancy between the intended output patterns and the ANN-provided solutions for their corresponding input patterns is used to alter the weights. The gobal maximum power (GMP) may be precisely located using the suggested MPPT method, which relies on the ANN structure and learning process. Two strings of the three-series-connected module have tested the suggested method's efficacy.
An improved ANN-P&O hybrid MPPT method for solar systems to maximize power extraction in partially shaded environments is suggested. An expensive sensor has assessed the light intensity. In order to estimate the intensity of illumination using inexpensive current and voltage sensors, the author suggests an indirect technique. In this case, the light intensity is fed into the ANN, and it discovers the GMP that corresponds to that light intensity. In order to extract a high voltage from solar PV, the PV modules are linked in both series and parallel. The modules are protected by two kinds of diodes: blocking diodes and bypass diodes. Hot spots on SPV modules occur if even a small amount of shadow falls on a region of the module, causing negative current production. The bypass diode can fix this since, even when partially shaded, it has a very low resistance. Additionally, using the blocking diode can stop the flow of backward current. The ANN approach has the following limitations: It takes a long time to train the ANN since it uses costly lighting sensors, it has slow MPP tracking speed, and so on. Therefore, an ANN-MPO-based modified hybrid is what the author suggests. Over a thousand designs have been produced with light intensities ranging from 100 to 1000 W/m2. The optimal location of the GMP point is precisely pinpointed using ANN. The suggested ANN model is a three-layer feed-forward neural network. The ANN takes the light intensity as input and returns the ideal voltage as output. Levenberg–Marquardt is employed for neural network training, and the sigmoid function is employed to estimate the input and output properties of nodes. In addition, the MP&O determines the GMP by using adaptive step size (Ye, 2020).
In order to get beyond the constraints of conventional MPPT, the ANN-based MPPT approach is typically employed. However, for ANN-based MPPT to operate, a large enough dataset must be used to train the neural network on how to accurately predict MPP. If it turns out that the data isn't accurate, fuzzy logic is helpful to resolve the nonlinearity, but it is by no means required. It requires an essential mathematical operation. Essential components of fuzzy logic controllers include fuzzification, a rule foundation, and defuzzification. The fuzzy logic controller takes the error signal and the developing error as inputs and outputs the duty cycle. It is the responsibility of the membership function to convert the numerical values into linguistic variables. When it comes to language, there are five variables: high, low, zero, small, and large. This means it can serve five distinct membership purposes (Patel et al., 2020). For the trapezoidal membership function, the inputs are error and changes in error. The quantity of errors and the rate of change in that quantity are used to produce rules by the fuzzy inference engine. A total of 25 rules is generated. When you input variables, the rules are matched with them. As a result of the defuzzification process, the linguistic value is reduced to a crisp value. The reference voltage is sent through the filter unit, which removes impulses, and then the input voltage is normalized by passing it through the normalization unit. Afterwards, the error signal SPV is generated by comparing the SPV voltage with the reference voltage Vpv. Thirty volts is the reference voltage here. To calculate the duty cycle, the fuzzy logic controller takes into account both the error and its rate of change.
To increase the efficiency of SPV systems’ energy production, Saban Ozdemir et al. suggested a high-step-up-ratio quadratic boost converter. Fuzzy logic has also been employed to monitor the maximum power under partial shade. Depending on the needs, the quadratic converter has been utilized as either a buck or a boost converter. Diodes, inductors, switches, and capacitors are the four basic building blocks of a converter. By removing the secondary switch, two converters are cascaded to form the quadratic converter. It is cost-effective since it uses fewer components than conventional converters (Ozdemir et al., 2017). However, a conventional converter's efficiency is on par with a quadratic converter. The traditional DC–DC buck or boost converter produces a high voltage at high duty cycles. Reduced converter efficiency is a direct result of increased duty cycles. More than that, a high-duty cycle results in significant electromagnetic interference and voltage stress on the switch. Consequently, applications requiring high voltage or step-up typically benefit from quadratic converters. The quadratic converter is important because, due to its low duty cycle ratio and low voltage stress, the switch provides good efficiency, resulting in a high voltage conversion ratio. Because it is less reliant on mathematical models and system factors, FLC is significant. The suggested MPPT takes two variables—power and voltage—as inputs and returns a function of duty cycle. Seven membership functions have been constructed using the input variable (Tara and Suresh, 2022). Increased tracking speed and reduced oscillation under steady state are both significantly impacted by the rule basis. We utilized the minimum–maximum strategy in our proposed methodology. A combination of defuzzified inputs and the minimal operator yields rule strength in fuzzy inference. By using the maximum operator, the results of the rules are merged. Both in steady-state and rapidly changing climates, the simulation results show that the suggested fuzzy MPPT has better tracking efficacy and energy output. Power oscillation is also minimal due to the low converter ripple (Bhukya et al., 2021).
Recent developments in solar power grid systems have surely focused on using fewer switches in power circuits along with smart optimization methods. Moreover, these approaches help improve efficiency and maintain better voltage control in the overall system. In Mukherjee and Mallick’s (2022) study, a new multilevel inverter design with fewer switches for solar power systems connected to the grid, which only shows better harmonic performance and less switching losses while keeping proper timing in both island and grid-connected modes. They studied the same adaptive swarm optimization method for an 11-level inverter with fewer switches, getting lower total harmonic distortion and better dynamic response (Kumar et al., 2023a). Further, these studies show that reduced-switch structures and swarm intelligence work well for improving inverter performance. However, as per the research focus, these methods mainly deal with grid connection and switching optimization rather than regarding DC–DC voltage boosting or MPPT improvement at the PV source side.
At the same time, swarm-intelligent methods have surely been used to solve voltage control problems in power grids. Moreover, these algorithms help in fixing voltage issues at the grid level. In Kumar et al.’s (2023b) study, researchers actually used a smart swarm method to make a solar-powered static synchronous series compensator work better, which definitely improved power control and voltage stability when conditions were not normal. Similarly, Kumar et al. (2024) suggested a group-based smart method for better series compensation that can only improve system loading capacity and dynamic response in connected power networks. As per these studies, swarm-based optimization shows good results and fast solving in power system problems, but they mainly focus on grid compensation and transmission stability. Regarding PV systems, these works do not address nonlinear duty-cycle control, high-gain DC–DC conversion, or global maximum power tracking under partial shading conditions.
Fuzzy logic and ANNs can both monitor maximum power production, regardless of how rapidly the surrounding variables change. The FLC has several benefits over the ANN-based MPP, such as an inexpensive price tag, an easy-to-understand design, and the capacity to handle nonlinearity and ambiguity. On the other hand, developing fuzzy principles requires very high expertise. A larger quantity of training data may be necessary to execute an ANN-based MPPT. The integration of ANNs with fuzzy logic, known as ANFIS, has enhanced the learning capacity and provided trained assistance in reaching MPPT objectives. While tracing, ANFIS may mimic the actions of fuzzy logic and neural networks. As shown in Figure 1, the input layer is responsible for collecting the input signal and is the first layer of the five-layer ANFIS that has been suggested. The input signals consist of the error and its variation. Layer 1, or the input layer, is also called the fuzzification layer occasionally. Layers 2 and 3 of the structure include the rule foundation for a fuzzy inference system. You may find the defuzzification layer, which is also called the output membership function, on layer 4. Here, the processing of inputs and outputs by the neural network is used to adjust the weight between two levels. Initially, the MATLAB editing window is used to create datasets. Next, the neural network may be trained using the collected data. We used ANFIS to finalize the design of the ANFIS application. To build an ANFIS properly, you must adhere to these procedures. Data import, grid partition selection, and hybrid algorithm selection are the three steps necessary to train the neural network. The next step is to modify the total number of membership functions. It involves applying the triangle membership function and then running ANFIS. In ANFIS, the voltage of Vpv is compared to the voltage that ANFIS produces, Vref. The range encompasses all conceivable values, with the lowest being 4.9271e−17, which is the training error.
Structure of the Adaptive Neuro Fuzzy Inference Systems model.
Proposed HGBC
Figure 2 shows the block diagram of the SPV system with MPPT controller. Figure 2(a) shows the proposed HGBC topology. Figure 2(b) shows the current flow when the switch is ON, and this further demonstrates the circuit operation. Figure 2(c) shows the current flow when the switch in OFF state, which further demonstrates the circuit behavior during this condition. During switching, capacitors C1 and C2 store energy and then release it one after the other. As per the OFF-state operation, both capacitors discharge and transfer their stored energy to the output stage, regarding the energy supply to capacitors C4 and C5 and load support. Moreover, the proposed HGBC offers the higher voltage conversion ratio than conventional existing boost converters because of the cascaded capacitor energy transfer method. Moreover, this switching behavior directly determines the voltage values across each capacitor.
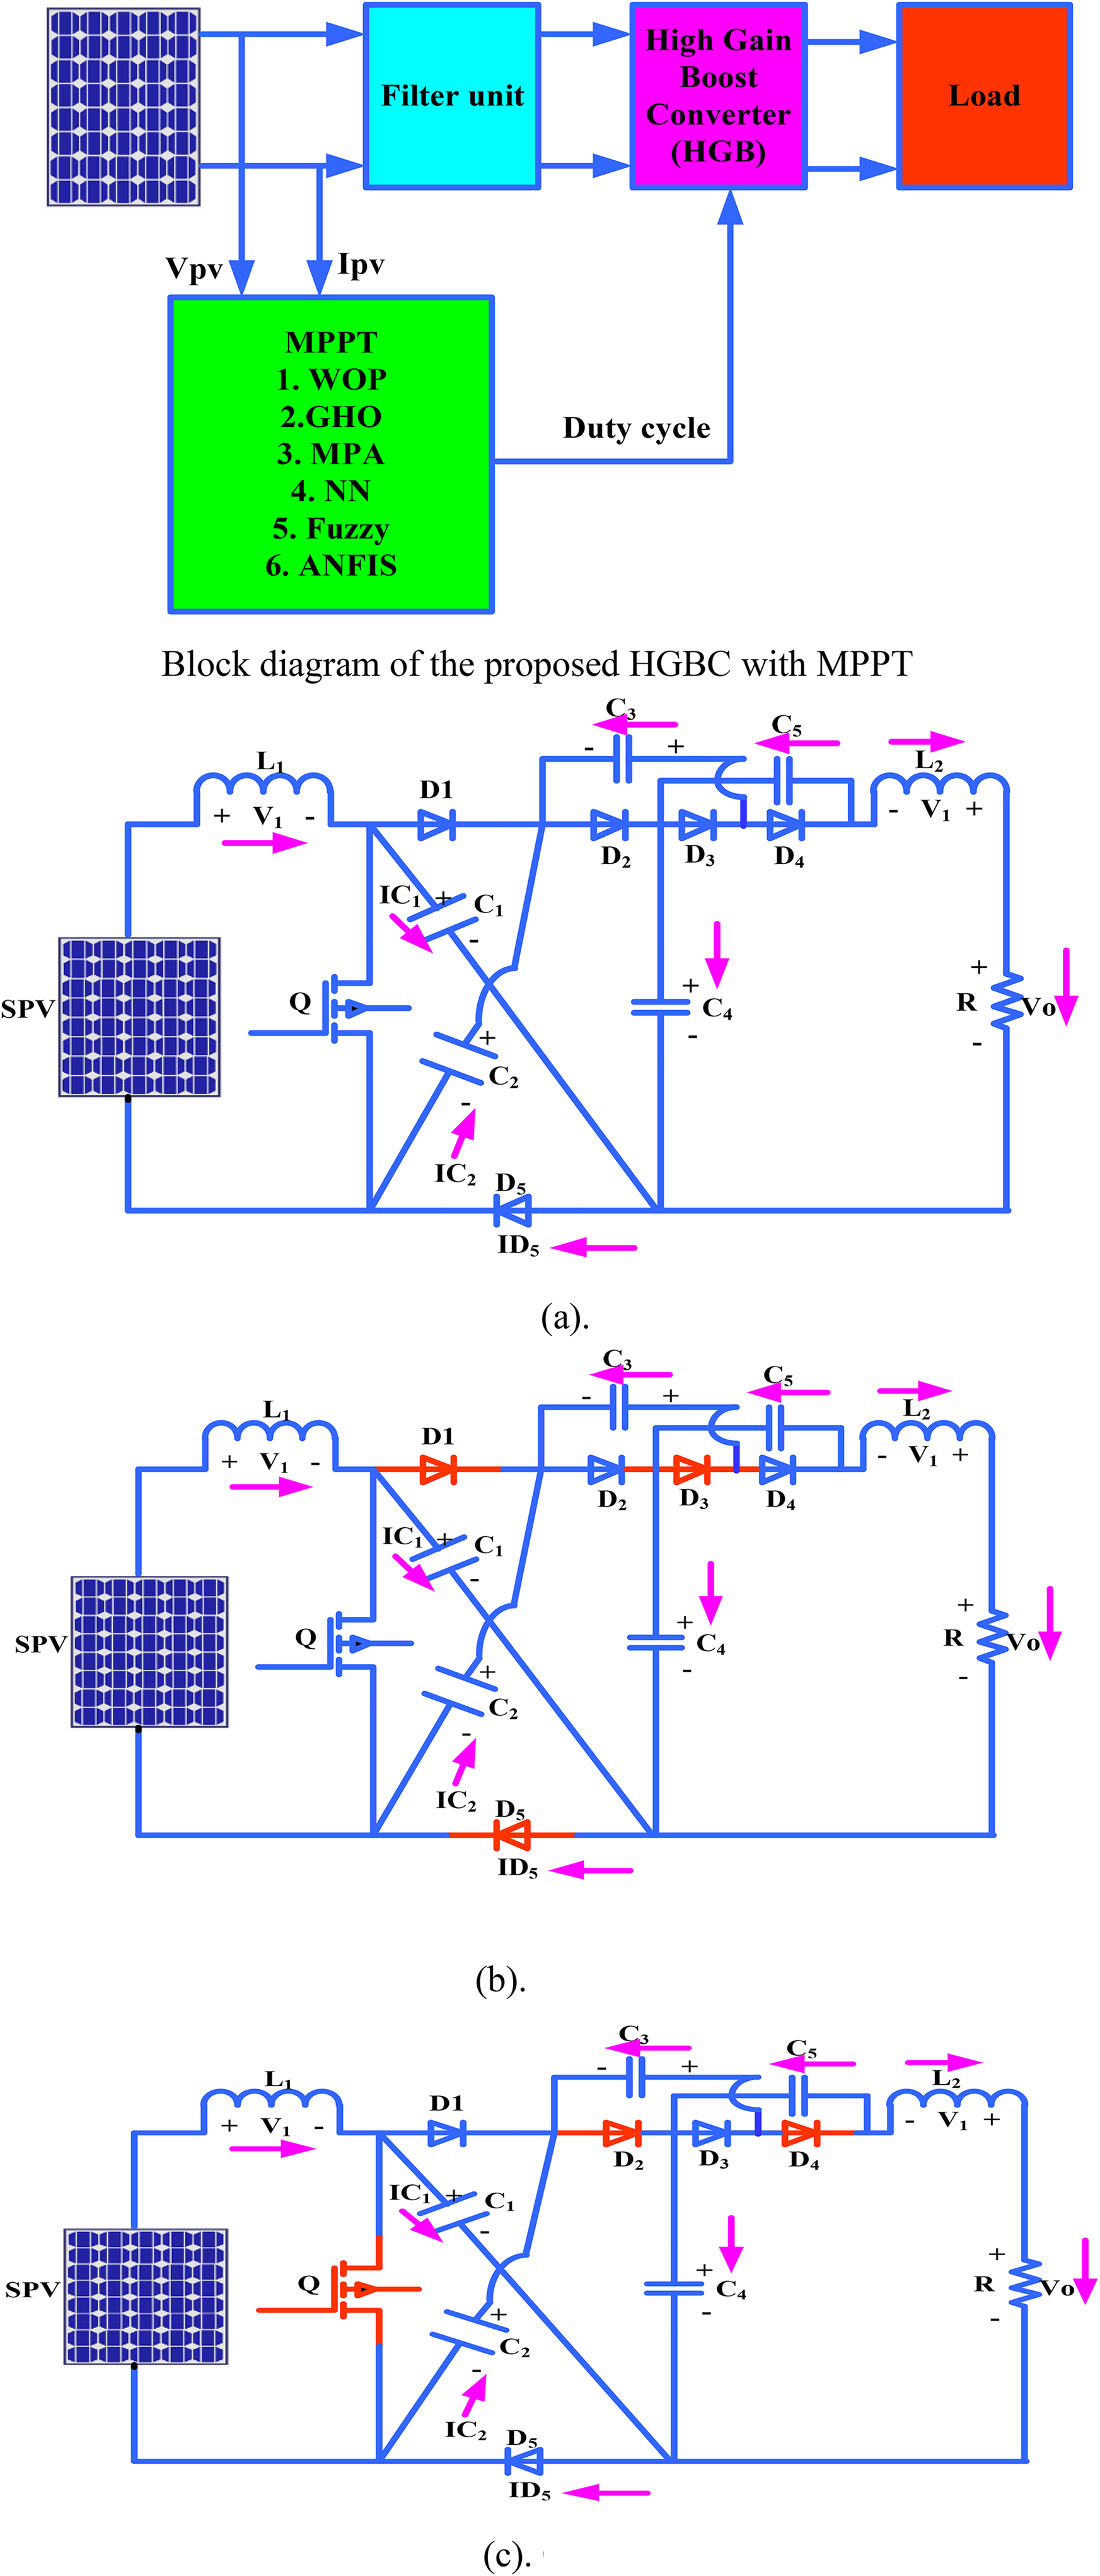
Block diagram of the proposed HGBC with MPPT. (a) Configuration of the proposed HGBC. (b) Short-circuit condition of the proposed HGBC. (c) Open-circuit condition of the proposed HGBC. HGBC: high-gain boost converter; MPPT: Maximum Power Point Tracking.
Where


Capacitors C1, C2, C3, and C5 are charged to the same voltage level. Moreover, this condition can be expressed using equation (1). When capacitors are connected in series charging, capacitor C4 gets twice the same voltage as shown in equation (2). The converter output voltage by combining the voltages of capacitors C1, C3, and C5, which is the same as shown in equation (3). The proposed converter achieves higher voltage gain than conventional boost converter topology. Moreover, the converter operates in continuous conduction mode for constant loads but may enter discontinuous conduction mode during transient conditions. In discontinuous conduction mode operation, the inductor current drops to zero before the same switching cycle starts again. The inductor current change during the ON time can actually be found using equation (4).
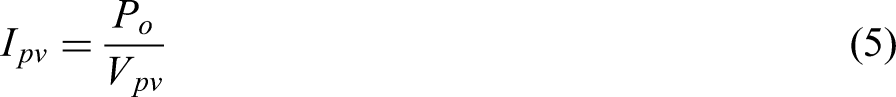
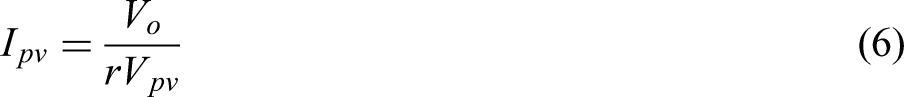


In discontinuous conduction mode, the inductor current surely reaches zero before the next switching cycle starts. Moreover, this happens because the current falls completely during each cycle. Essentially, the SPV current during inductor charging can be estimated using the same equation. This actually comes from equation (8), which is definitely based on how voltage and current relate in an inductor. Further, the duty cycle of the proposed converter is obtained from the capacitor voltage relation itself and is expressed in equation (9). The duty-cycle–to–output-voltage relationship of the proposed HGBC is highly nonlinear due to its multistage energy transfer paths. Conventional MPPT techniques and model-dependent controllers exhibit slow convergence and oscillations under such nonlinear dynamics. Therefore, a swarm-intelligence-based GHO is employed to adaptively optimize the duty cycle, enabling fast global MPP tracking with reduced steady-state oscillations. This converter-aware MPPT design represents a co-optimized hardware–control framework rather than an isolated application of a metaheuristic algorithm.
To demonstrate a proper study of the proposed HGBC, the converter working is evaluated over two switching periods within one complete switching cycle. Moreover, this analysis provides a clear understanding of the circuit operation. The analysis is done under steady-state conditions and further carried out in continuous conduction mode. For mathematical clarity, assume the switching frequency stays constant and capacitor voltage ripple is definitely small. The converter is initially analyzed under ideal conditions before practical effects are discussed separately. During mode I


From the switching interval analysis, we can further derive the inductor ripple current, peak current, and average/peak current stresses of the switch and diode as given in equations (14) to (19). The analysis itself shows these important parameters clearly. Also, as per the requirement, these expressions are useful regarding selecting the present rating of active devices.


As per equations (20) to (22), the capacitor current, output voltage ripple, and charge-balance relation are given. These equations show the mathematical expressions regarding these three parameters. Also, these relations are used to further check passive component stress and output voltage stability itself.
To find the conduction-mode boundary, we actually set the minimum inductor current to zero. This definitely helps identify the exact boundary point. The continuous conduction mode-DCM condition and minimum inductance requirement are actually given by these equations. This definitely shows the boundary conditions needed. The study further examines equations (23) and (24) itself.

The changing current relationships must be studied, and moreover, the voltage stress on active and passive devices should surely be checked for reliable converter design. We are seeing that the switch voltage stress, diode reverse voltage stress, and capacitor blocking voltages can only be found from the OFF-state circuit and how voltage gets distributed across capacitors. The cascaded capacitor network actually shares the boosted voltage, so the switch definitely does not face the full output voltage. This actually reduces device stress compared to a conventional boost converter. We are seeing that the stress on the switch, diodes, inductors, and capacitors is only found from the current paths in each mode. We are seeing that the switch current is directly connected to the inductor current only when it is in ON-state, while diode currents take over during OFF-state. These stress expressions are the same necessary things for practical device sizing and thermal design.
The above analysis is derived under ideal component assumptions to simplify the mathematical formulation and highlight the fundamental operation of the proposed HGBC. However, in practical implementation, semiconductor, and passive components exhibit nonideal characteristics such as switch on-state resistance


Equation (25) actually shows the real output voltage of the converter when we definitely include voltage drops from resistances and diode voltage. Equation (26) surely models the total power loss in the circuit. Moreover, it includes conduction losses in the switch and inductor, diode losses, and switching losses. The converter's overall efficiency is surely affected by parasitic effects and operating conditions, as shown in equation (27). Moreover, these losses directly determine how well the converter performs in practical applications.
Swarm-based MPPT's
Marine predator algorithm
To tackle complex and nonlinear optimization problems, the MPA is a nature-inspired metaheuristic that models the cooperative hunting and foraging behavior of marine predators, particularly sharks. The algorithm was developed to address challenging global optimization tasks characterized by multimodal search spaces and dynamic constraints. By mimicking predator–prey interactions through adaptive exploration and exploitation mechanisms, MPA has demonstrated strong performance across diverse optimization domains, including fog computing task scheduling problems (Mahfouz et al., 2025), crossover-integrated feature selection for intrusion detection in IoT environments (Abualigah et al., 2024a), and a wide range of engineering applications as comprehensively reviewed in Abualigah et al. (2024b). These cross-domain successes highlight the robustness and flexibility of MPA in solving complex optimization problems. A population of marine predators is introduced into the marine protected area to search for and capture the best possible solution. Potential solutions are compared to prey in this system. The algorithm performs an initialization of a set of marine predators and prey. The predators are intended to symbolize various solutions to the optimization problem. Both the movement and updating rules are designed to imitate the hunting and foraging procedures of marine predators. These rules incorporate exploration to discover potentially useful prey and exploitation to converge on the best possible solution. Predators can share knowledge about potentially fruitful places in the search space if they communicate with one another and work together. As marine predators dynamically modify their positions and strategies, fitness evaluation is based on an objective function, and the algorithm seeks to converge towards the optimal solution through successive iterations. This ensures that the system can accurately assess fitness. As a result of its versatility, MPA may be utilized to address a wide range of optimization difficulties in the fields of engineering and computer science. Furthermore, ongoing research investigates the possibility of adapting it to specific problem domains. One type of probability function, more specifically a Gaussian distribution, is responsible for determining the step lengths. Within the context of this paradigm, the Gaussian distribution is responsible for defining the probability density function (PDF) at a certain location c. In addition to being referred to as the normal distribution, the Gaussian distribution is distinguished by the bell-shaped curve that it possesses (Houssein et al., 2021; Mugemanyi et al., 2023; Faramarzi et al., 2020). The formula that can be used to calculate the probability density function for a Gaussian distribution is in equation (28). The procedural steps of the MPA are illustrated in Figure 3, which provides a clear overview of the initialization, elite matrix formation, and iterative update processes.


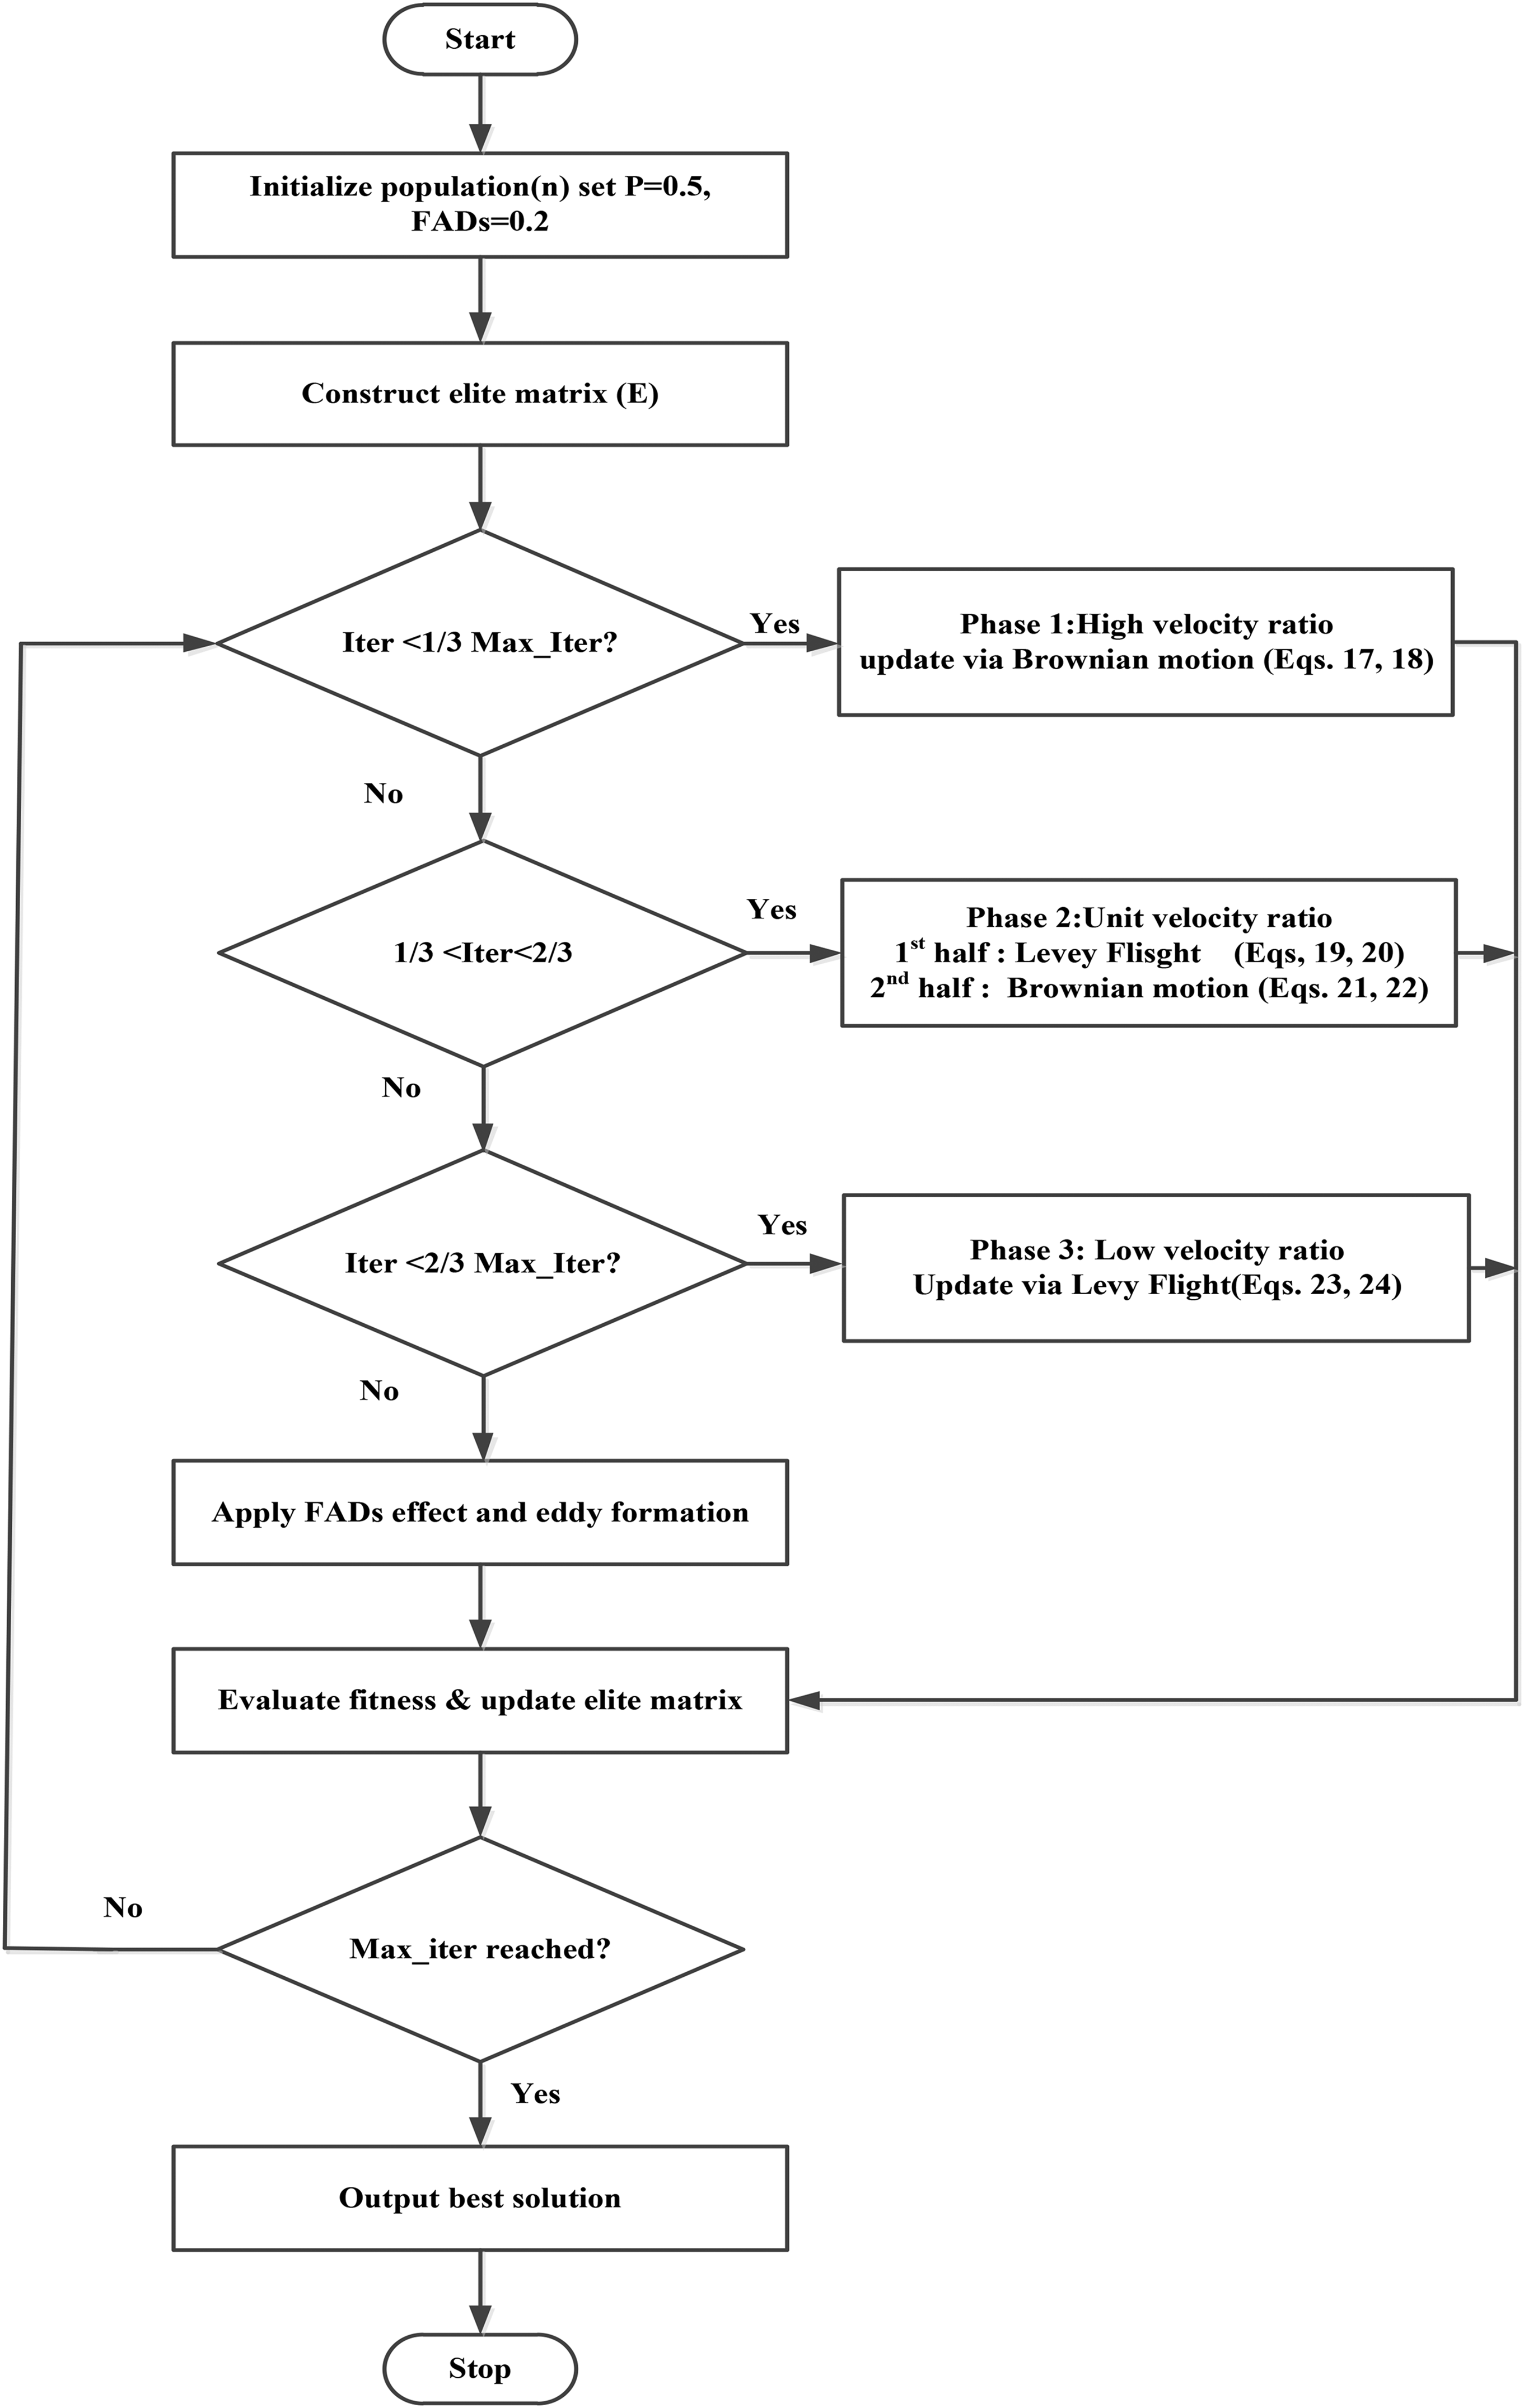
Flowchart of the Marine Predator Algorithm.
The scale properties of the model is adjusted by the distribution index which is represented by the
where the gamma function, as x tends to infinity, although the algorithm is initiated by the following relations in equation (32).

The lower limit and upper limit values are represented by the Ymin and Ymax. The random number vectors are represented by the rand functions, which lie between 0 and 1, and the values are randomly distributed. The strongest predators in an ecosystem are the ones that adapt to new environments the best. In order to capture and pass on these exceptional qualities, an Elite matrix is created. To guarantee that the elite individuals’ genetic information can be passed down across generations, this matrix stores it. Selecting and merging the DNA of the most fit predators is how the Elite matrix is reproduced. This keeps the population's best features and encourages continuous progress toward ideal solutions. The matrix can be expressed as E, and it represents equation (33).
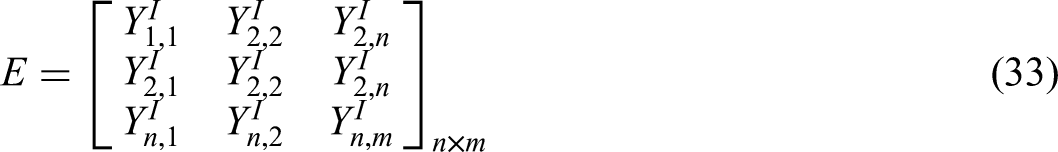
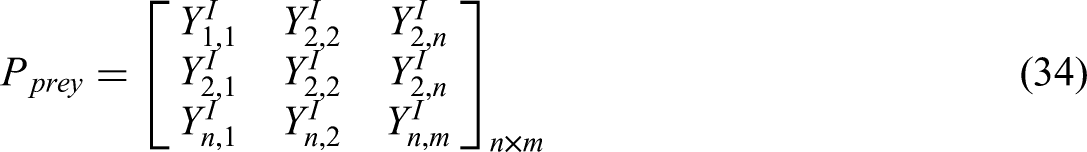
The fittest predator vector is represented by X, which can be produced by the n times used to formulate the elite matrix. The searching agent number is signified by N, and the dimension number is denoted by d. The array of the above matrix detects the prey based on its positions. It is inferred that the prey and predator are recognized as searching agents. The prey also has equal dimensions as an elite matrix, which can be represented as follows in equation (34). Equation (35) characterizes the social interaction, while equation (36) defines the location update mechanism.


The updating of predator's locations can be performed based on the prey matrix. Moreover, the optimization process of the MPA comprises four stages such that with a high velocity ratio, the predator travels at less speed compared to its prey. The predator and prey are moving at about equal speed, with a velocity ratio of unity. The predator's speed is lower than that of its victim. The searching phase occurs when the prey is outpacing the predator in terms of speed. It is provided by equations, and it only occurs in the first or early iterations of the algorithm. In this case, rand [0, 1] is represented by R. During the first three rounds, this phase occurs to establish a high level of exploration, and it is represented in equations (17) and (18). In the second stage, the predator and prey both move at the same speed to fool the eye. The intermediate of the repetition count is this phase that sets the exploratory and exploitative stages. This suggests that while one group is out investigating, the other is busy plundering. This suggests, though in a roundabout way, that the predator is responsible for exploitation and the prey is responsible for research. The following equations could be used to express it, in which RL is either the Lévy distribution number or a vector of random numbers derived from it. The pre-population can be estimated by the following relations (see equations (37) and (38)). The update mechanism of the proposed model is reigned by vector-based operations, as expressed in equation (39) and (40)


While PCF represents the predator parameter controlling factor, in third, the prey is not as swift as the assailant. A random number is used as the Lévy base to set a high exploitation stage. When changes occur in the underwater environment, predators in the water will also feel the effects. The actions of marine predators can be influenced by creating eddy patterns and fish aggregation apparatus. To prevent this, the marine predators take a long jump as shown in the equations, while the random index can be denoted by r1 and r2, which correspond to prey and binary vector. The long jump of marine predators is represented by the following equations (41) and (42).


The first equation is valid only when r is less than or equal to FAD1, and the second equation is valid only when r is less than or equal to FADs. Because there are four panels in the array, the particles should be initialized with a population count of four in the search space between Dmin and Dmax [0 to 1] in order to perform MPPT employing the MPA optimization technique. After that, we will apply the proposed algorithm to change the positions of all the initialized particles. The code will automatically restart or re-initialize when the power (PPV) varies as a result of changes in irradiance, which is presented by the following relation in equation (43). The MPA begins with the initialization of the population, where a set of random candidate solutions is generated within the defined search space. The algorithm parameters, including the maximum number of iterations and boundary limits, are set at this stage. Each individual in the population is then evaluated using the objective function to determine its fitness. Based on these values, an elite matrix is constructed to store the best-performing solutions, ensuring that the most promising candidates are retained for further exploration. The best solution is estimated from this elite matrix and recorded as a reference point for guiding future iterations.
As the algorithm progresses, the population is updated according to different strategies depending on the iteration stage. In the early phase (first quarter of iterations), exploration is emphasized using global search equations to diversify the candidate solutions. During the middle phase, a transition occurs: half of the population is updated with one set of equations, while the other half is updated with a different set, balancing exploration, and exploitation. In the final phase (second half of iterations), the algorithm focuses on exploitation by refining the search around the elite solutions using local search equations. After each update, fitness values are recalculated, and convergence conditions are checked. The process repeats until the stopping criteria, such as maximum iterations or an acceptable solution, are met. Finally, the best solution from the elite matrix is reported as the optimal result.
Grasshopper optimization
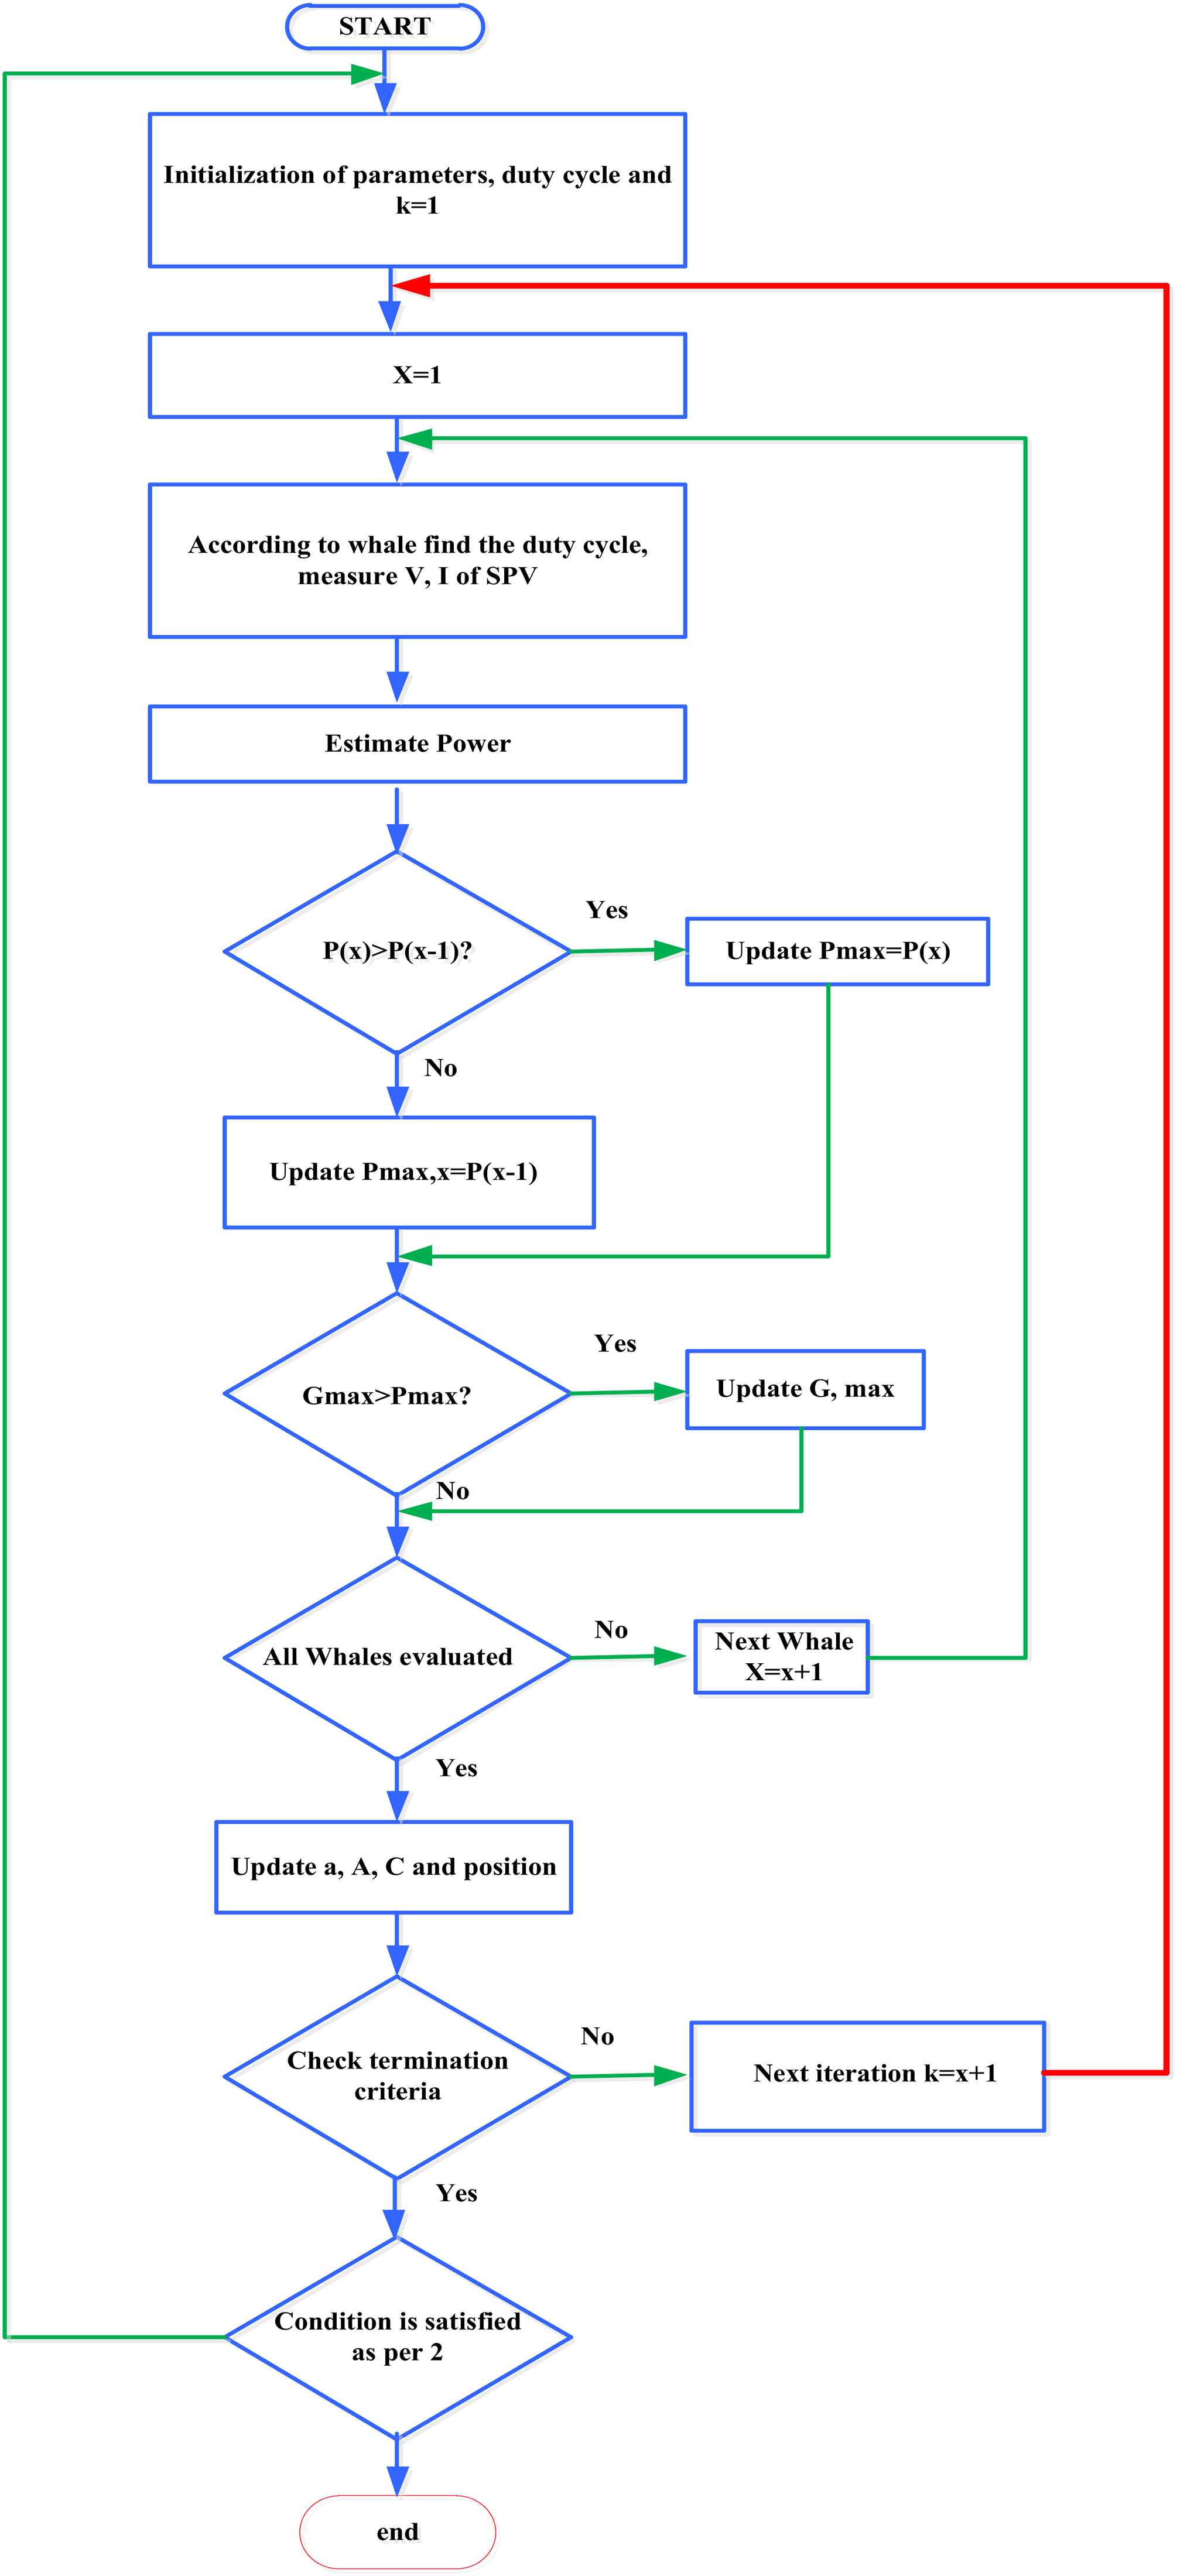
The collective and coordinated swarming behavior of grasshoppers in nature served as the inspiration for the GHO. GHO is an optimization algorithm that takes its inspiration from nature. Its primary objective is to optimize a specific objective function by first initializing a population of viable solutions denoted by grasshoppers. The grasshoppers, imitating swarming behavior, change their positions in the search space in an iterative manner, incorporating both exploration and exploitation methods. The sharing of information about favorable regions in the solution space is made possible through communication and collaboration among grasshoppers. The algorithm eventually arrives at optimal solutions for the optimization problem that has been presented to it as a result of these collective movements. Applications of GHO have been discovered in various fields, adding to the repertoire of nature-inspired algorithms that attempt to replicate the effectiveness of biological systems in resolving complex problems (Mansoor et al., 2020). The detailed workflow of the GHO is presented in Figure 4, showing the position update mechanism based on social interaction, gravity, and wind advection.
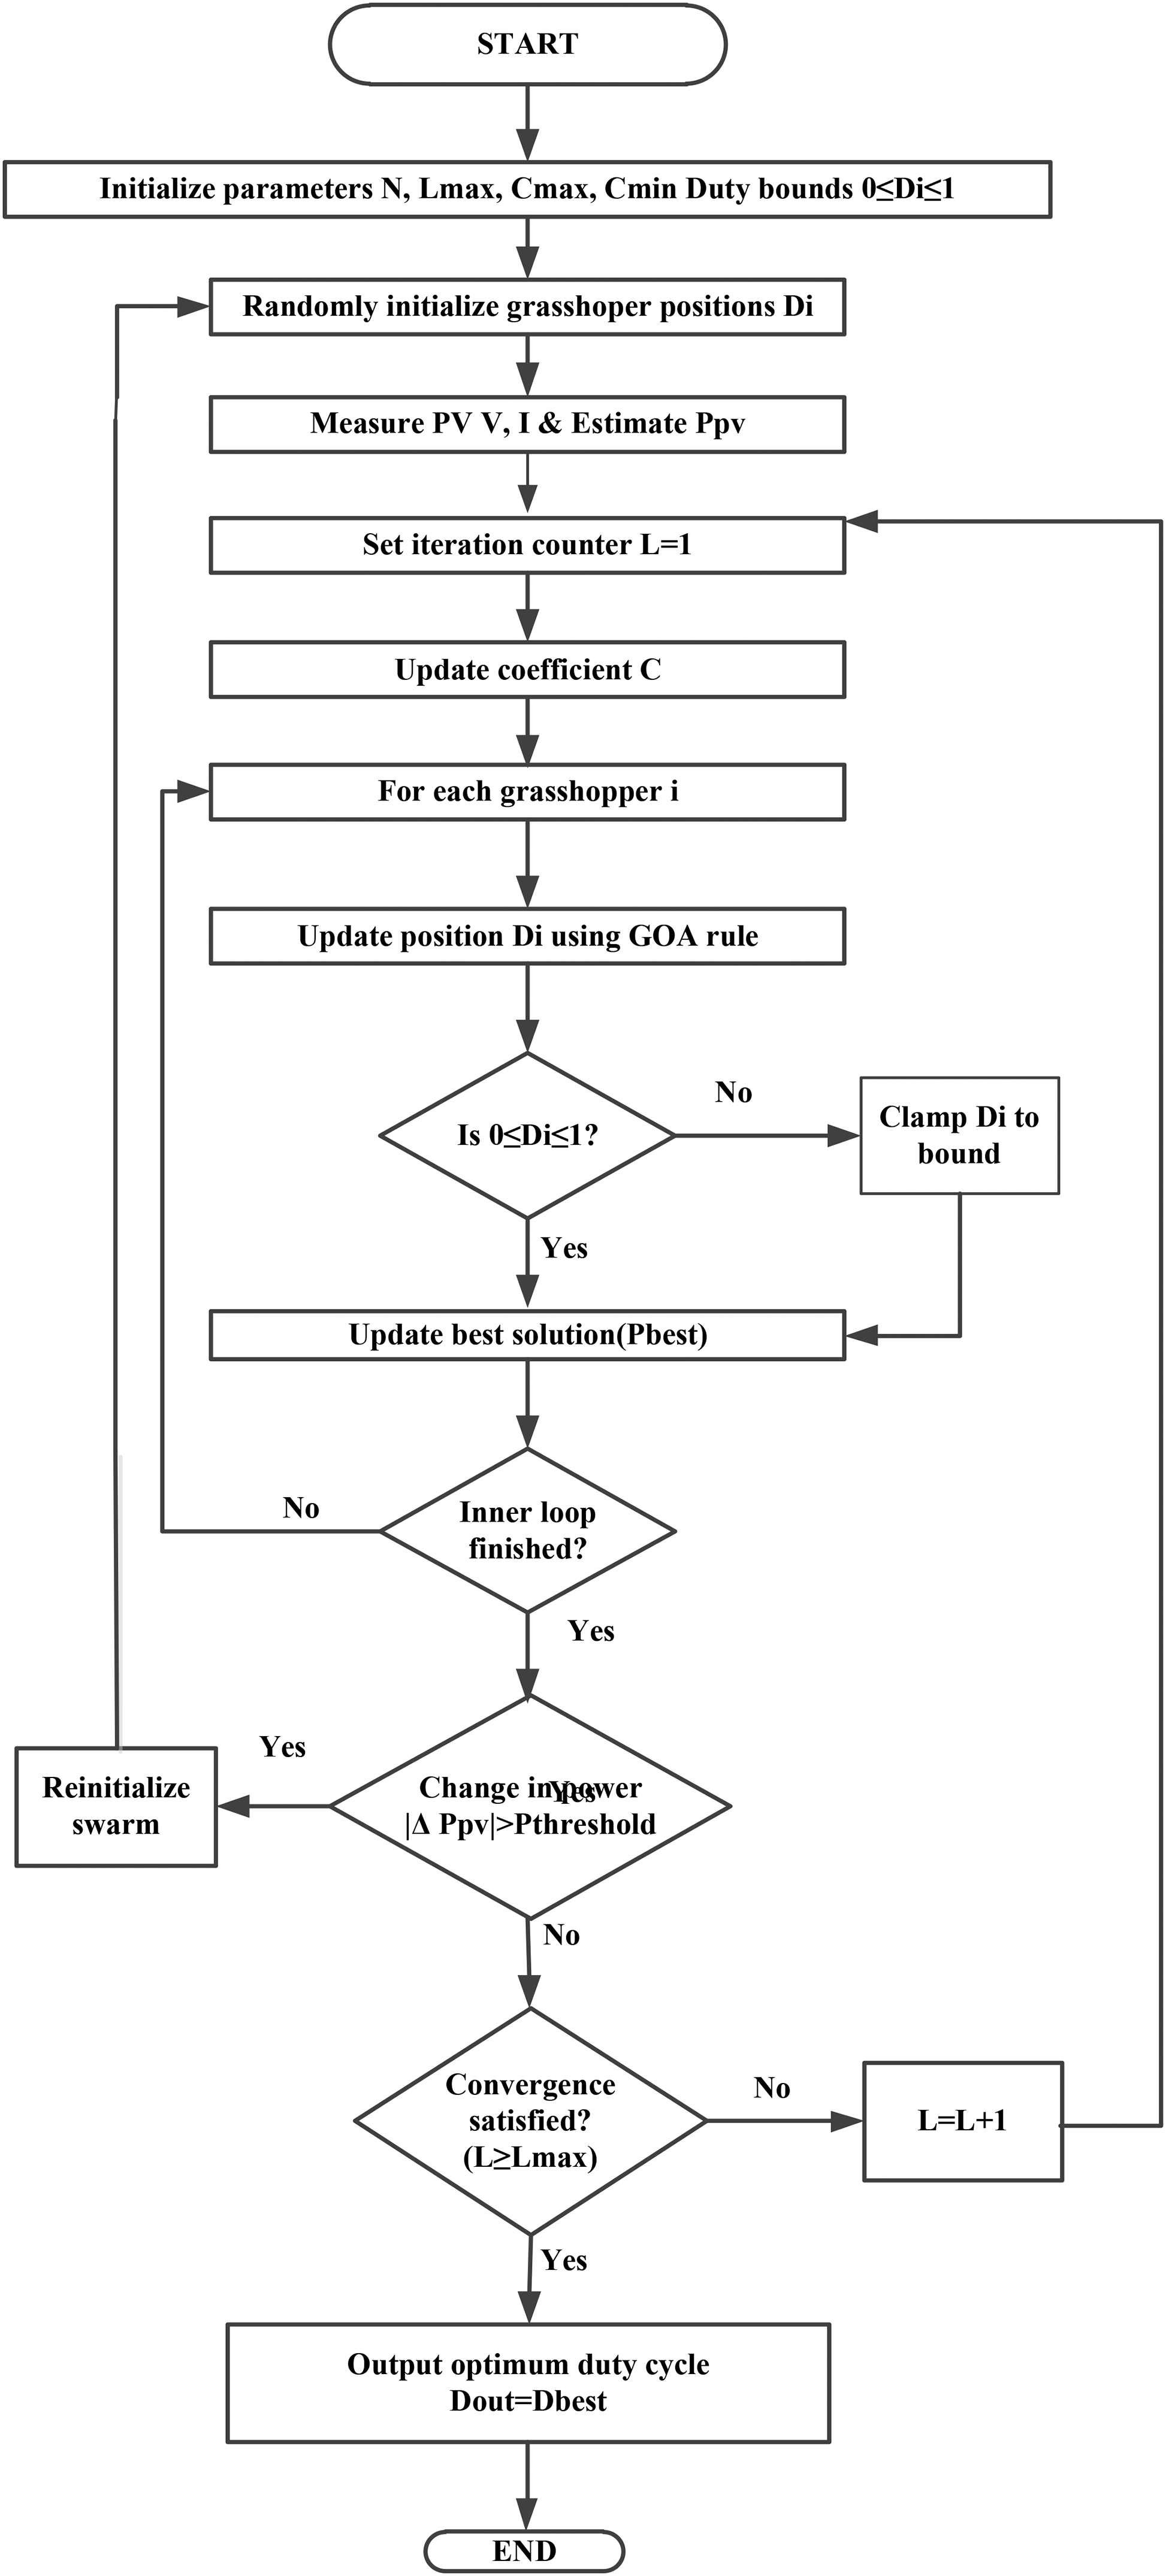
Flowchart of the Grasshopper Optimization Algorithm.
The GHO starts with the initialization of a swarm population, where each grasshopper represents a candidate solution within the defined search space. The algorithm then sets decreasing coefficients that control the balance between exploration and exploitation during the optimization process. Each individual's fitness is evaluated using the objective function, and the best solution found so far is recorded. The algorithm introduces two loop counters: the inner loop (i) for particle agent updates and the outer loop (L) for generations. At each generation, the controlling coefficient C is recalculated to progressively shrink the exploration range, ensuring convergence toward the global optimum. The distances between grasshoppers are estimated to simulate the biological swarming behavior. After this, the positions of the grasshoppers are updated accordingly. Constraint checks are performed, and if any candidate violates search space limits, refinement techniques are applied to ensure feasibility.
After updating positions, the fitness values are recalculated for all individuals, and the global best solution Dbest is updated if a superior candidate is found. This process is repeated until the outer loop reaches its maximum number of iterations (Lmax). At the final stage, the best candidate solution is assigned as the duty cycle (Dout = Dbest) or optimal decision variable. To validate the effectiveness of the solution, a change in the performance metric (such as output power) is estimated. If the improvement is confirmed, the algorithm terminates with the best solution; otherwise, refinement or additional iterations are carried out. In this way, GHO effectively mimics the natural swarming and foraging patterns of grasshoppers, balancing global exploration, and local exploitation to reach optimal or near-optimal solutions.


When it comes to the application of the GHO for MPPT. The GHO is a swarm-based MPPT algorithm. The movement of swarm particles is described by the following mathematical relations (see equation (44)). Where Y
i
represents the position of the ith grasshopper particle, Q
i
denotes the social interaction component, Gi represents the gravitational component, and R
i
corresponds to the wind advection component. It is necessary to include weighted social interactions, gravity factor and advection which i scaled by w1, w2, and w3, which is represented in equation (45). In order to find the global solution and disseminate knowledge inside the swarm, swarm intelligence relies on social contact, as shown in following equation (46)
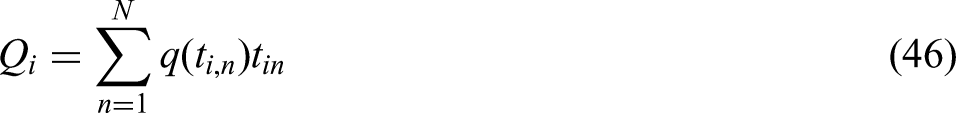
The distance between the adjacent grasshopper are represented by tin, GHO is selected due to the fact that it converges quickly and exhibits minimum oscillations when operating in steady environment settings. While, the social force is determined by the following equation (47)

where la = attraction length, f the intensity of the interaction, Q(i) the social interaction impacts the gravitational force and wind attraction is represented by equations (48) and (49)


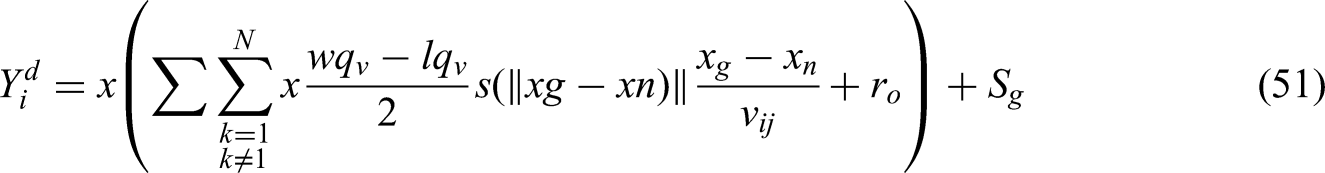
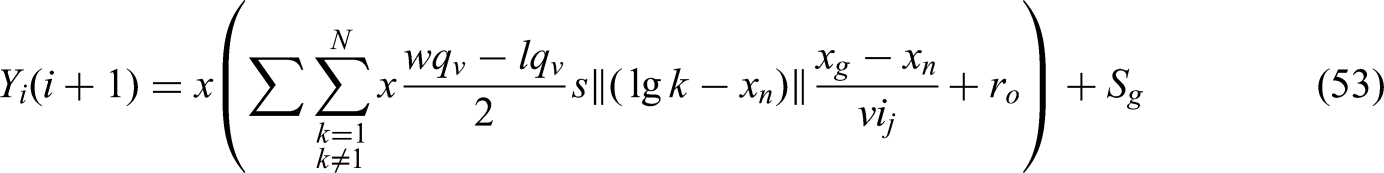
While the duty cycle of the boost converter serves as a representation of the search space, the limitations are restricted to values that fall between 0 and 1. The initial randomization of the population of GHO particles, which represent the various possible solutions, takes place within this time frame. The number of search particles has been set at 6, and the maximum number of iterations has been capped as required. The rapid comport zone is optimized by adjusting constant based on the following equations (51), (52), and (53).
where

In the equation, the updating rule for the position of GHO particles is defined. In this equation, the indices of GHO particles are denoted by g and n, the distance between them is represented by v, and the iteration index is denoted by i. Based on this equation, the duty cycle, which represents the position of GHO particles, is continuously updated. When there is a discernible shift in power that is greater than a predetermined threshold (PPV), GHO goes through the process of re-initialization. This occurs when there are considerable shifting conditions in the operating environment. The relative error or convergence criterion is represented in equation (54).

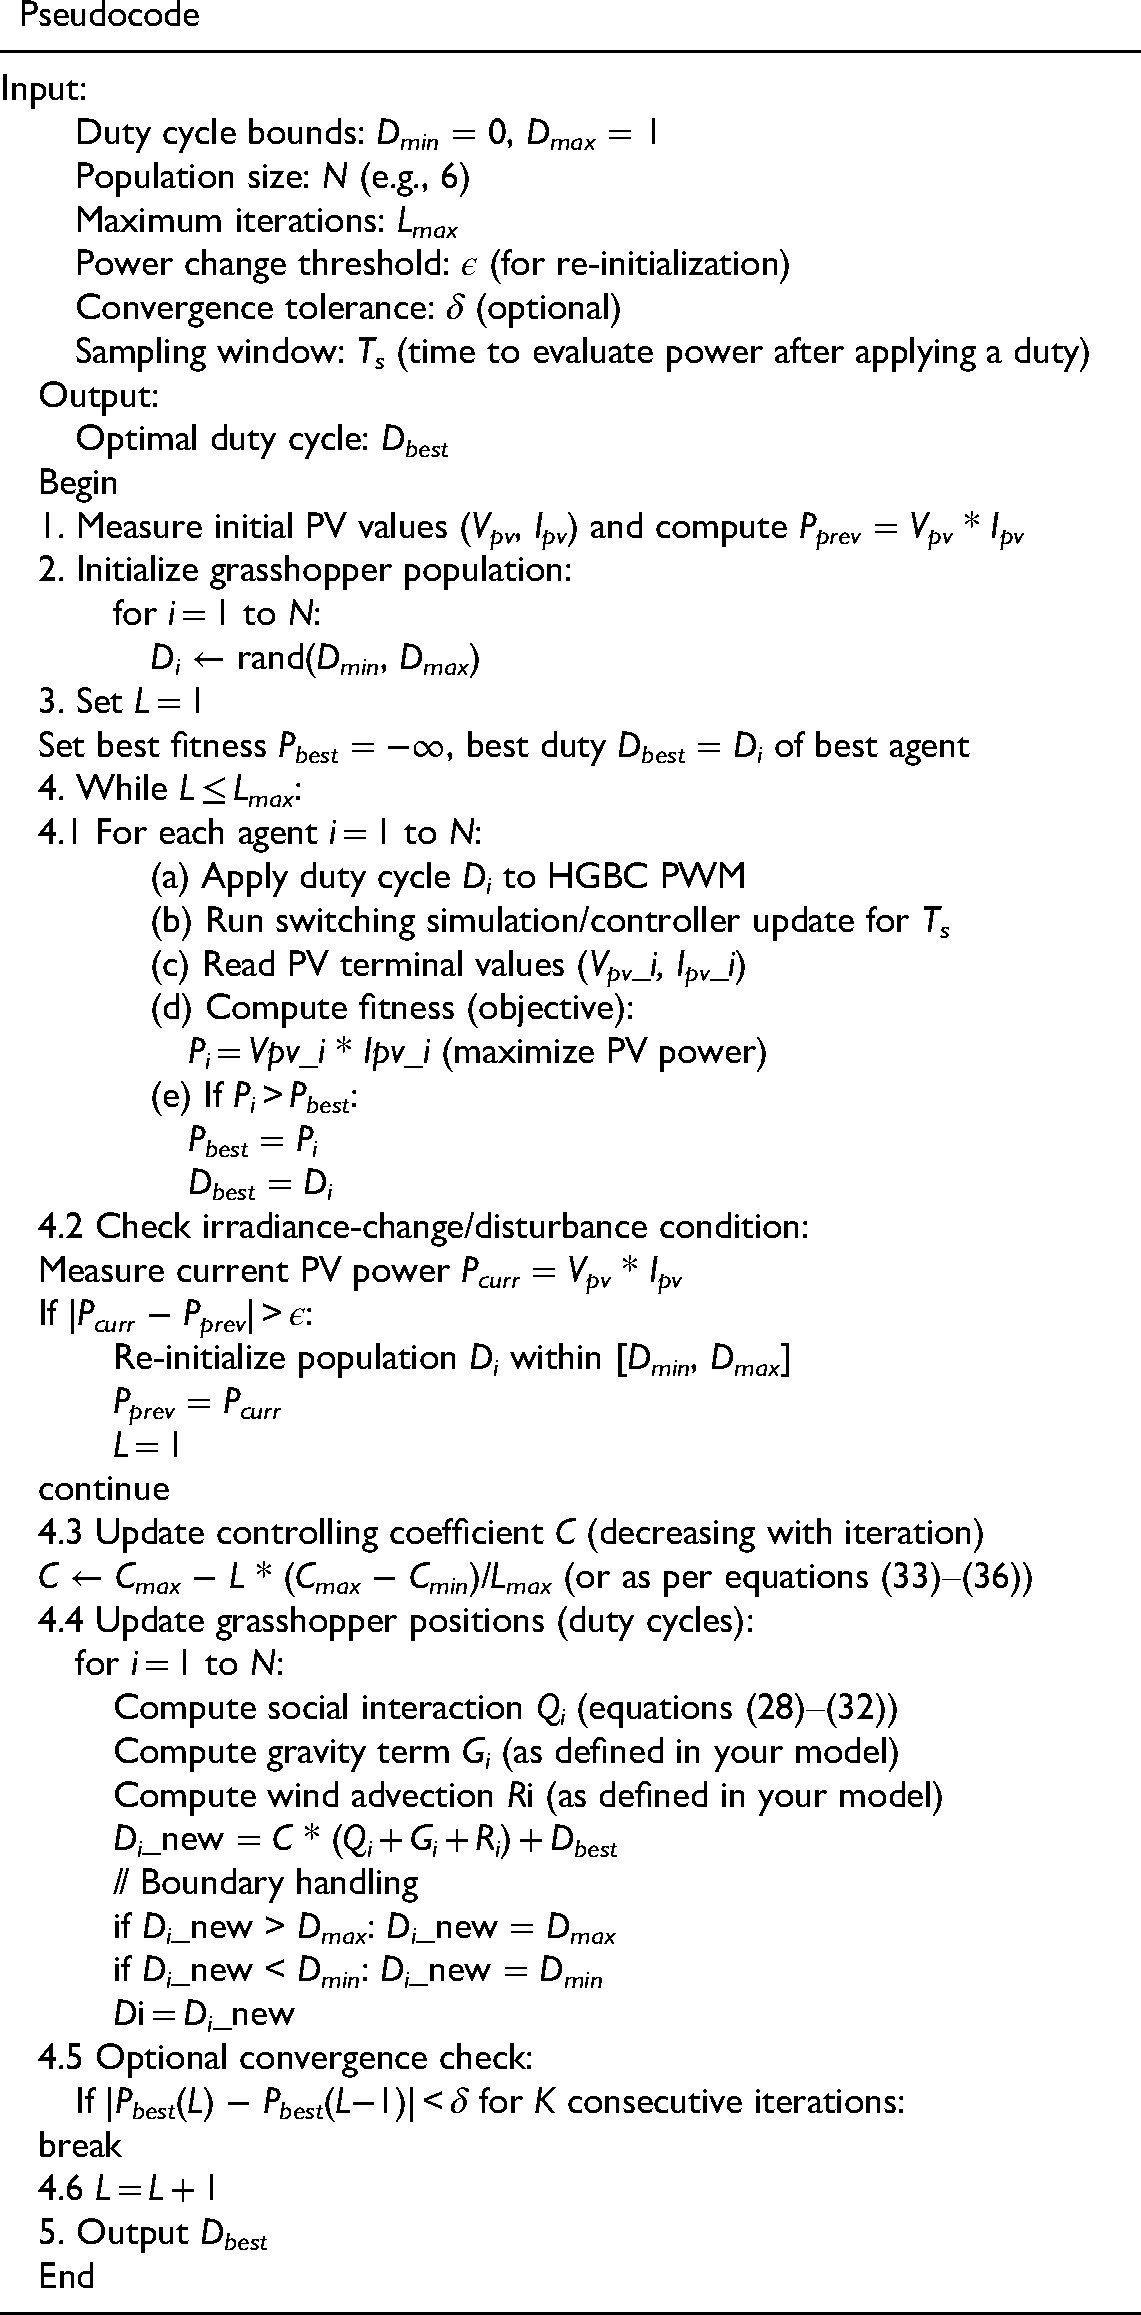
Pseudocode
The implementation of a search and skip strategy is done to improve the performance of the computation. It is important to take into account the possibility of overlap with another particle whenever a GHO particle Px is exploring an interval. When the upper bound of Px's interval is located within the interval of Pi, another phenomenon known as overlap occurs. Furthermore, if the updated position of Px is present within the interval of Pi, there is no requirement to rescan that particular region. In order to check for overlapping, equation (26) is utilized. This equation provides information that may be used to validate the upper and lower bounds on the voltage that is scanned by particle Pi. The utilization of this strategy contributes to the streamlining of the search process by preventing the duplicate examination of places that are already covered by other particles in the population. This provides GHO swarm particles with the maximum power that is available, and the output is assigned to the particle that is the most fit, making it the best solution on a global scale. Following an investigation into the search space for local maximums and current hill climbing, it is anticipated that the GM will be discovered at PGbest as represented in equation (55).
Whale optimization
The WOA is a nature-inspired optimization technique that was developed. The technique takes its inspiration from the cooperative hunting behavior of humpback whales (Diab et al., 2025). During the WOA process, a population of potential solutions, which are meant to represent whales, is randomly initialized. After that, the algorithm imitates the encircling approach that whales use, in which individuals travel in the direction of the best solution that has been discovered so far in the search space. During the process of optimization, this behavior encourages both exploration and exploitation of existing opportunities. Whales make adjustments to their positions based on the best solution that is currently available as well as their own positions, which contributes to the process of convergence toward the optimal solution. A balance is incorporated into WOA between exploration, which is accomplished through random jumps, and exploitation, which is accomplished by moving toward the best solution that is currently available. The method has been shown to be effective in handling a variety of optimization issues, and it can be applied to a wide range of domains. This demonstrates the algorithm's versatility in addressing both continuous and discrete optimization concerns. In the WOA, which was conceived as a result of the cooperative hunting behavior of humpback whales, the approach is designed to imitate the manner in which humpback whales recognize the locations of their prey and then encircle them jointly. Within the framework of the algorithm, the target prey is comparable to the most effective solution that is currently available. In order to solve the optimization problem that is being addressed, the algorithm assumes that the best solution that is currently available is the optimal solution possible.
In the WOA, the evaluation of the objective function is used to determine which search agent is the most effective. This agent is the whale that has found the solution that has the most potential for success. This process of updating takes place over the course of a number of iterations, beginning with the first iteration and working its way up to a maximum number of iterations that has been specified in advance (Ling et al., 2017). The flow chart of the whale optimization is shown in Figure 5. The purpose of these equations is to achieve a balance between exploration and exploitation, with each search agent iteratively refining its position in order to converge toward the optimal solution that has been determined and shown in equation (38).
Flowchart of the Whale Optimization Algorithm.
The WOA makes use of the collective intelligence of the community, modeling its actions after the cooperative and coordinated efforts that are seen in the hunting methods of humpback whales. The iterative nature of the method, in conjunction with the updating criteria, ensures that the search agents will gradually approach the ideal solution as the iterations progress. The natural behaviors of humpback whales served as a source of inspiration for this efficiency and adaptability, which is reflected in this cooperative and iterative technique. The maximum number of iterations can be achieved by following equations (56) and (57) to meet the desired results.

where i is presenting the current iteration, A and B are presenting the coefficients, y* the best solution vector, and y the current position. The coefficient values are estimated by the following equations (57) and (58)

Table 1 shows the standard settings and details used for all swarm-based MPPT algorithms to make the comparison fair and reproducible. All algorithms use the same population size (6), maximum iterations (65), and duty-cycle search space (0–1), and further the initial positions are randomly set within these bounds itself to avoid bias. The system actually updates duty cycle and checks power every 5 ms, which definitely keeps the control working the same way for all methods. The fitness function only works to make the PV output power maximum, where power equals voltage times current. The stopping rule uses a threshold value of 1 × 10⁻⁴ to ensure consistent convergence and reliable comparison among the MPPT methods. Also, different algorithms surely use specific methods like social interaction, predator–prey behavior, and bubble-net hunting to control how they search for solutions. Moreover, these systems can restart themselves when light conditions change, which helps them adapt to changing environments. This unified parameter setting isolates the effect of the optimization strategy itself and allows rigorous comparison among MPPT techniques. Further, this approach ensures unbiased performance evaluation of different methods.
Standardized parameter for swarm-based MPPT algorithms.
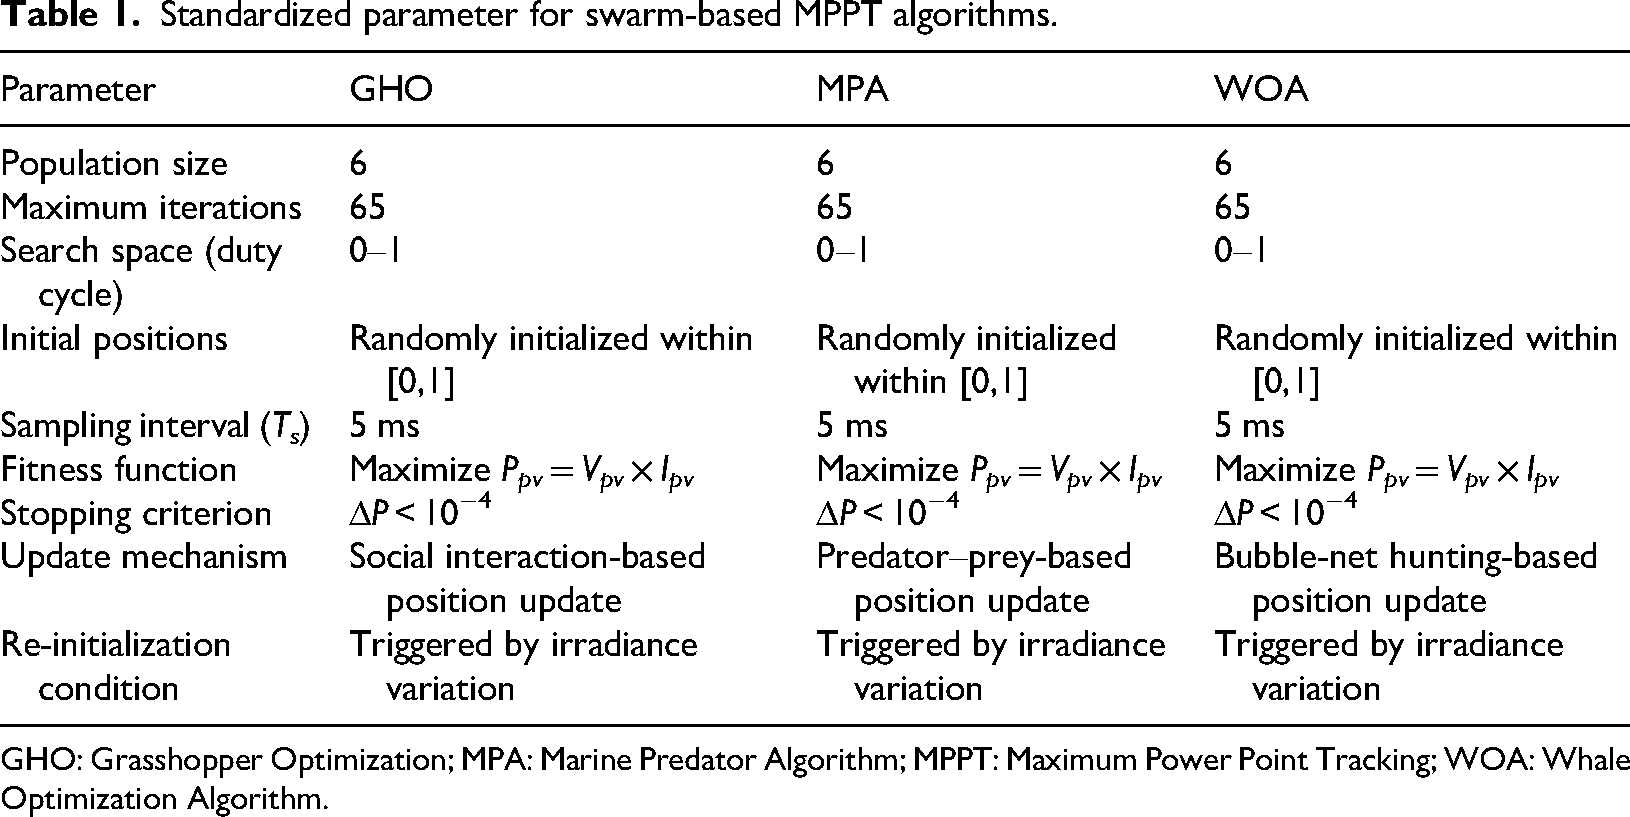
GHO: Grasshopper Optimization; MPA: Marine Predator Algorithm; MPPT: Maximum Power Point Tracking; WOA: Whale Optimization Algorithm.
Result and analysis
The SPV output power is influenced by the solar irradiations, as the boost converter voltage increases from only 22.14 V at 200 W/m2 to 68.9 V at 1000 W/m2 using P&O method as mentioned in Table 2. As per the results, there is a marginal increase in current and output power, confirming that higher sunlight improves the energy regarding the solar panel array. The boost converter duty cycle is surely adjusted dynamically to maintain MPP operation when irradiation changes and partial shading occur. Moreover, this adjustment ensures optimal performance under varying environmental conditions. When sunlight reduces from 1000 W/m2 to lower levels, the SPV voltage and power output decrease by the same proportion in all MPPT methods. Figure 6(a) shows how the boost converter can definitely increase voltage levels when using the P&O method. Moreover, at 1000 W/m2 irradiance, the SPV array surely produces 34.9 V voltage, and the boosted output voltage reaches 68.9 V. Moreover, this results in approximately 34 V voltage gain. As per Table 2, P&O shows clear steady-state oscillations with 2.5% ripple and 45 ms settling time, regarding moderate dynamic stability. The INC algorithm gives 69.7 V boosted output voltage at 1000 W/m2, which is the same as P&O but slightly higher. Also observed that, less oscillation compared to P&O method, with ripple values only around 2.5% but better voltage control behavior. The ANN-based MPPT gives 34.68 V output voltage with 1.6% ripple and 40 ms settling time, which is the same as having smoother performance compared to P&O method. However, ANN needs 150 iterations which is much higher than GHO with 65 iterations, and this itself shows more computational demand. Further, this difference reflects the increased processing requirements of ANN.
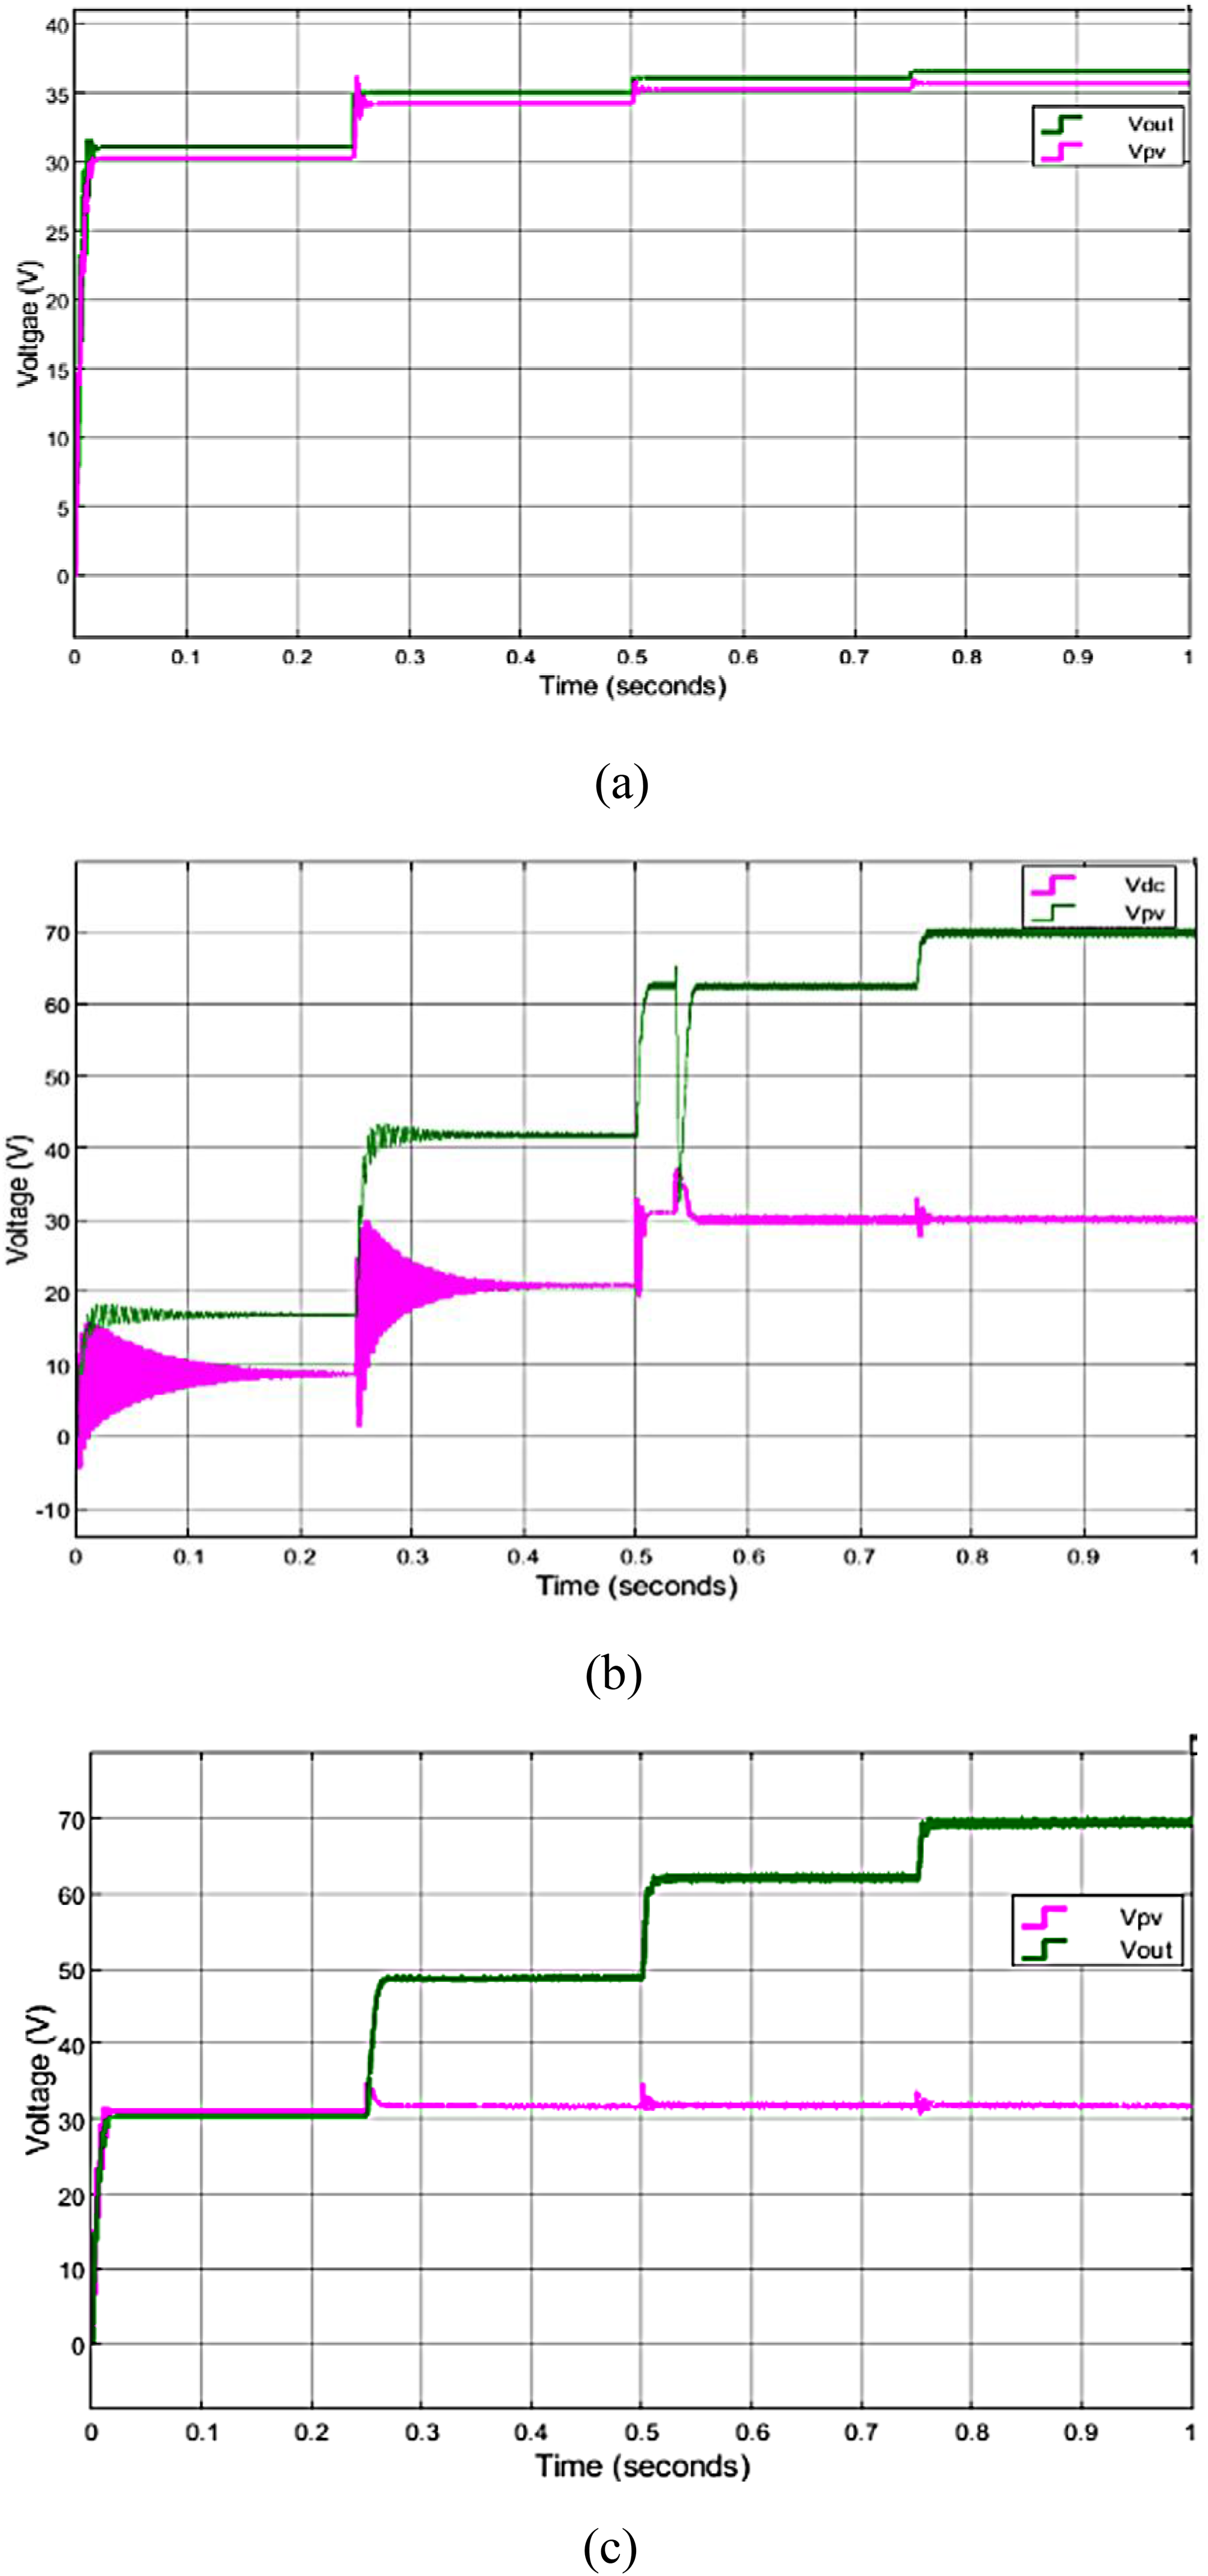
Solar photovoltaic input voltage and output voltage. (a) ANN-based MPPT technique. (b) Fuzzy-based MPPT technique. (c) ANFIS-based MPPT technique. ANFIS: Adaptive Neuro Fuzzy Inference Systems; ANN: Artificial Neural Network; MPPT: Maximum Power Point Tracking.
Performance of TBC with MPPT.
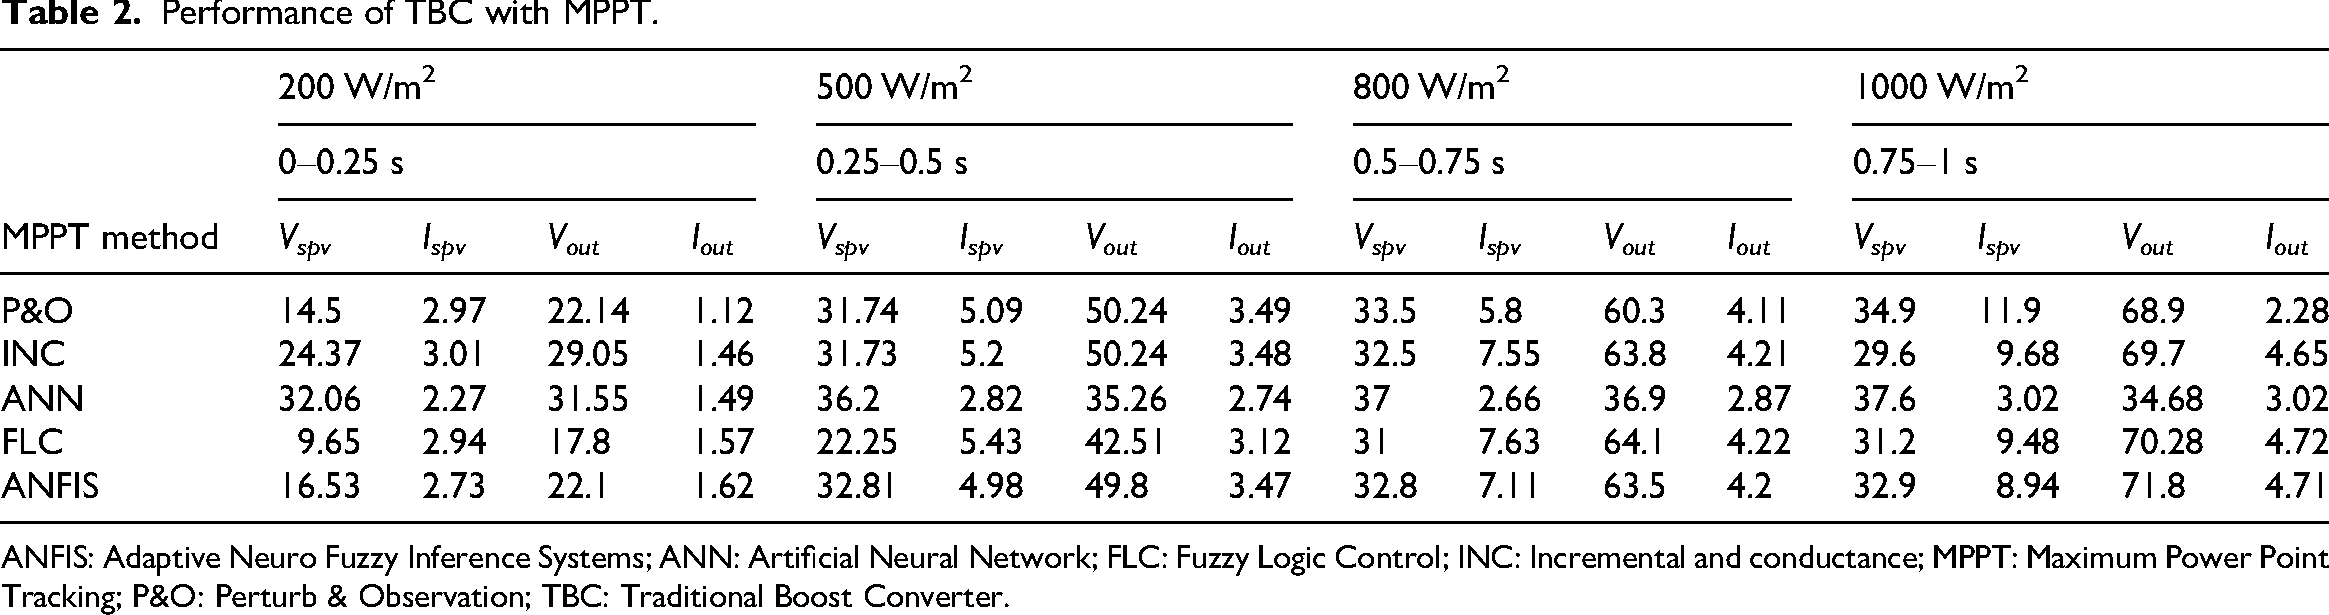
ANFIS: Adaptive Neuro Fuzzy Inference Systems; ANN: Artificial Neural Network; FLC: Fuzzy Logic Control; INC: Incremental and conductance; MPPT: Maximum Power Point Tracking; P&O: Perturb & Observation; TBC: Traditional Boost Converter.
The fuzzy logic controller actually gives 70.28 V output at 1000 W/m2, but it definitely shows more oscillations with 3.2% ripple and 50 ms settling time. This means the system takes more time to become stable. The ANFIS-based MPPT actually gives the highest output voltage of 71.8 V at 1000 W/m2 with 1.9% ripple and 25 ms settling time. This method definitely works better than P&O and fuzzy controllers for dynamic response. Principally, ANFIS needs 85 iterations, which means it has the same higher computational load compared to swarm-based methods like GHO (Figure 7).
Output of high-gain boost converter under constant irradiance
Figure 8 illustrates the dynamic response of the HGBC system under step changes in irradiance from 1000 to 700 W/m2 and subsequently to 500 W/m2. During the initial 0 to 2 s interval (1000 W/m2), the ANFIS-based MPPT achieves an output power of approximately 190 to 192 W, which is about 3 to 5 W higher than the ANN-based approach (≈187–189 W) and nearly 8 to 10 W higher than the fuzzy logic controller (≈180–184 W). The fuzzy controller also exhibits visibly larger oscillations during steady-state operation compared to ANFIS and ANN. When irradiance drops to 700 W/m2 at 2 s, the output power decreases proportionally. ANFIS stabilizes at approximately 93 to 95 W, ANN at 92 to 94 W, and fuzzy at 88 to 90 W.
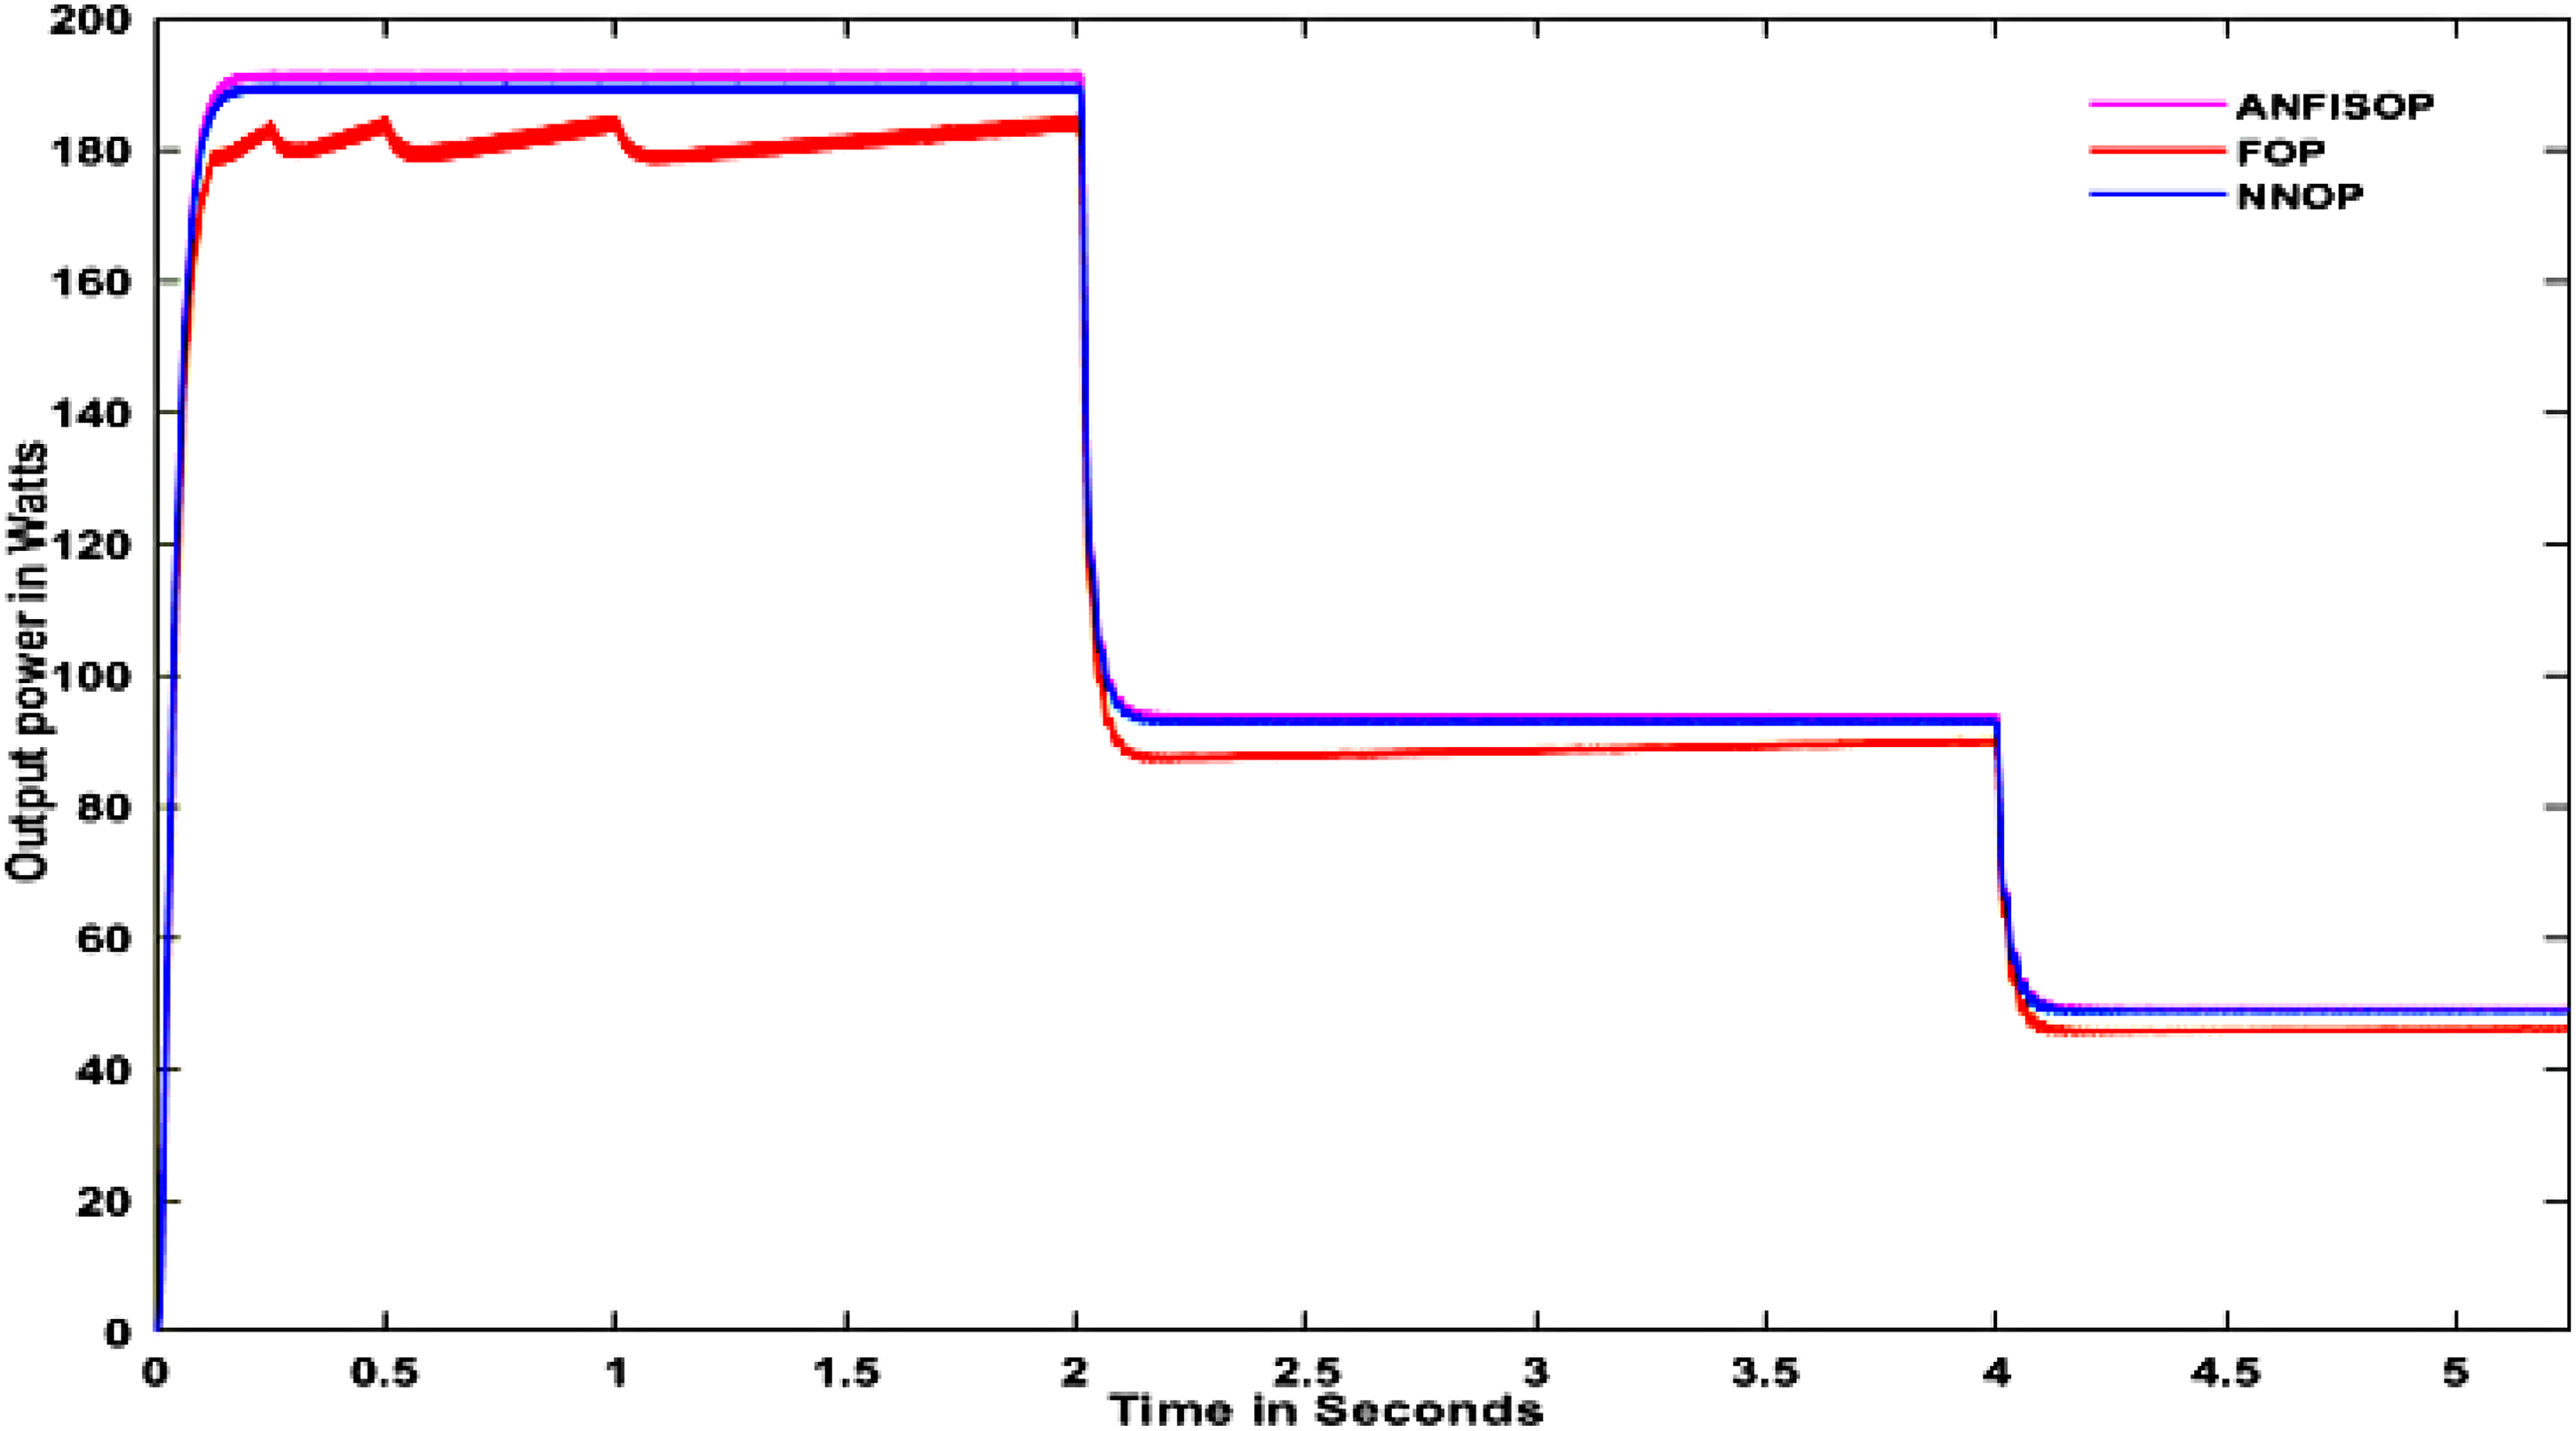
Output of high-gain boost converter under dynamic irradiance.
A similar trend is observed when irradiance further reduces to 500 W/m2 at 4 s, where ANFIS and ANN converge near 48 to 50 W, while fuzzy stabilizes slightly lower at 45 to 47 W. Across all irradiance transitions, ANFIS consistently achieves the highest steady-state power, whereas fuzzy logic exhibits larger transient oscillations and slightly lower stabilized output levels. These quantitative observations confirm that ANFIS provides improved steady-state energy extraction under dynamic irradiance variations, while ANN offers comparable tracking with slightly lower peak power, and fuzzy logic demonstrates comparatively higher oscillatory behavior.
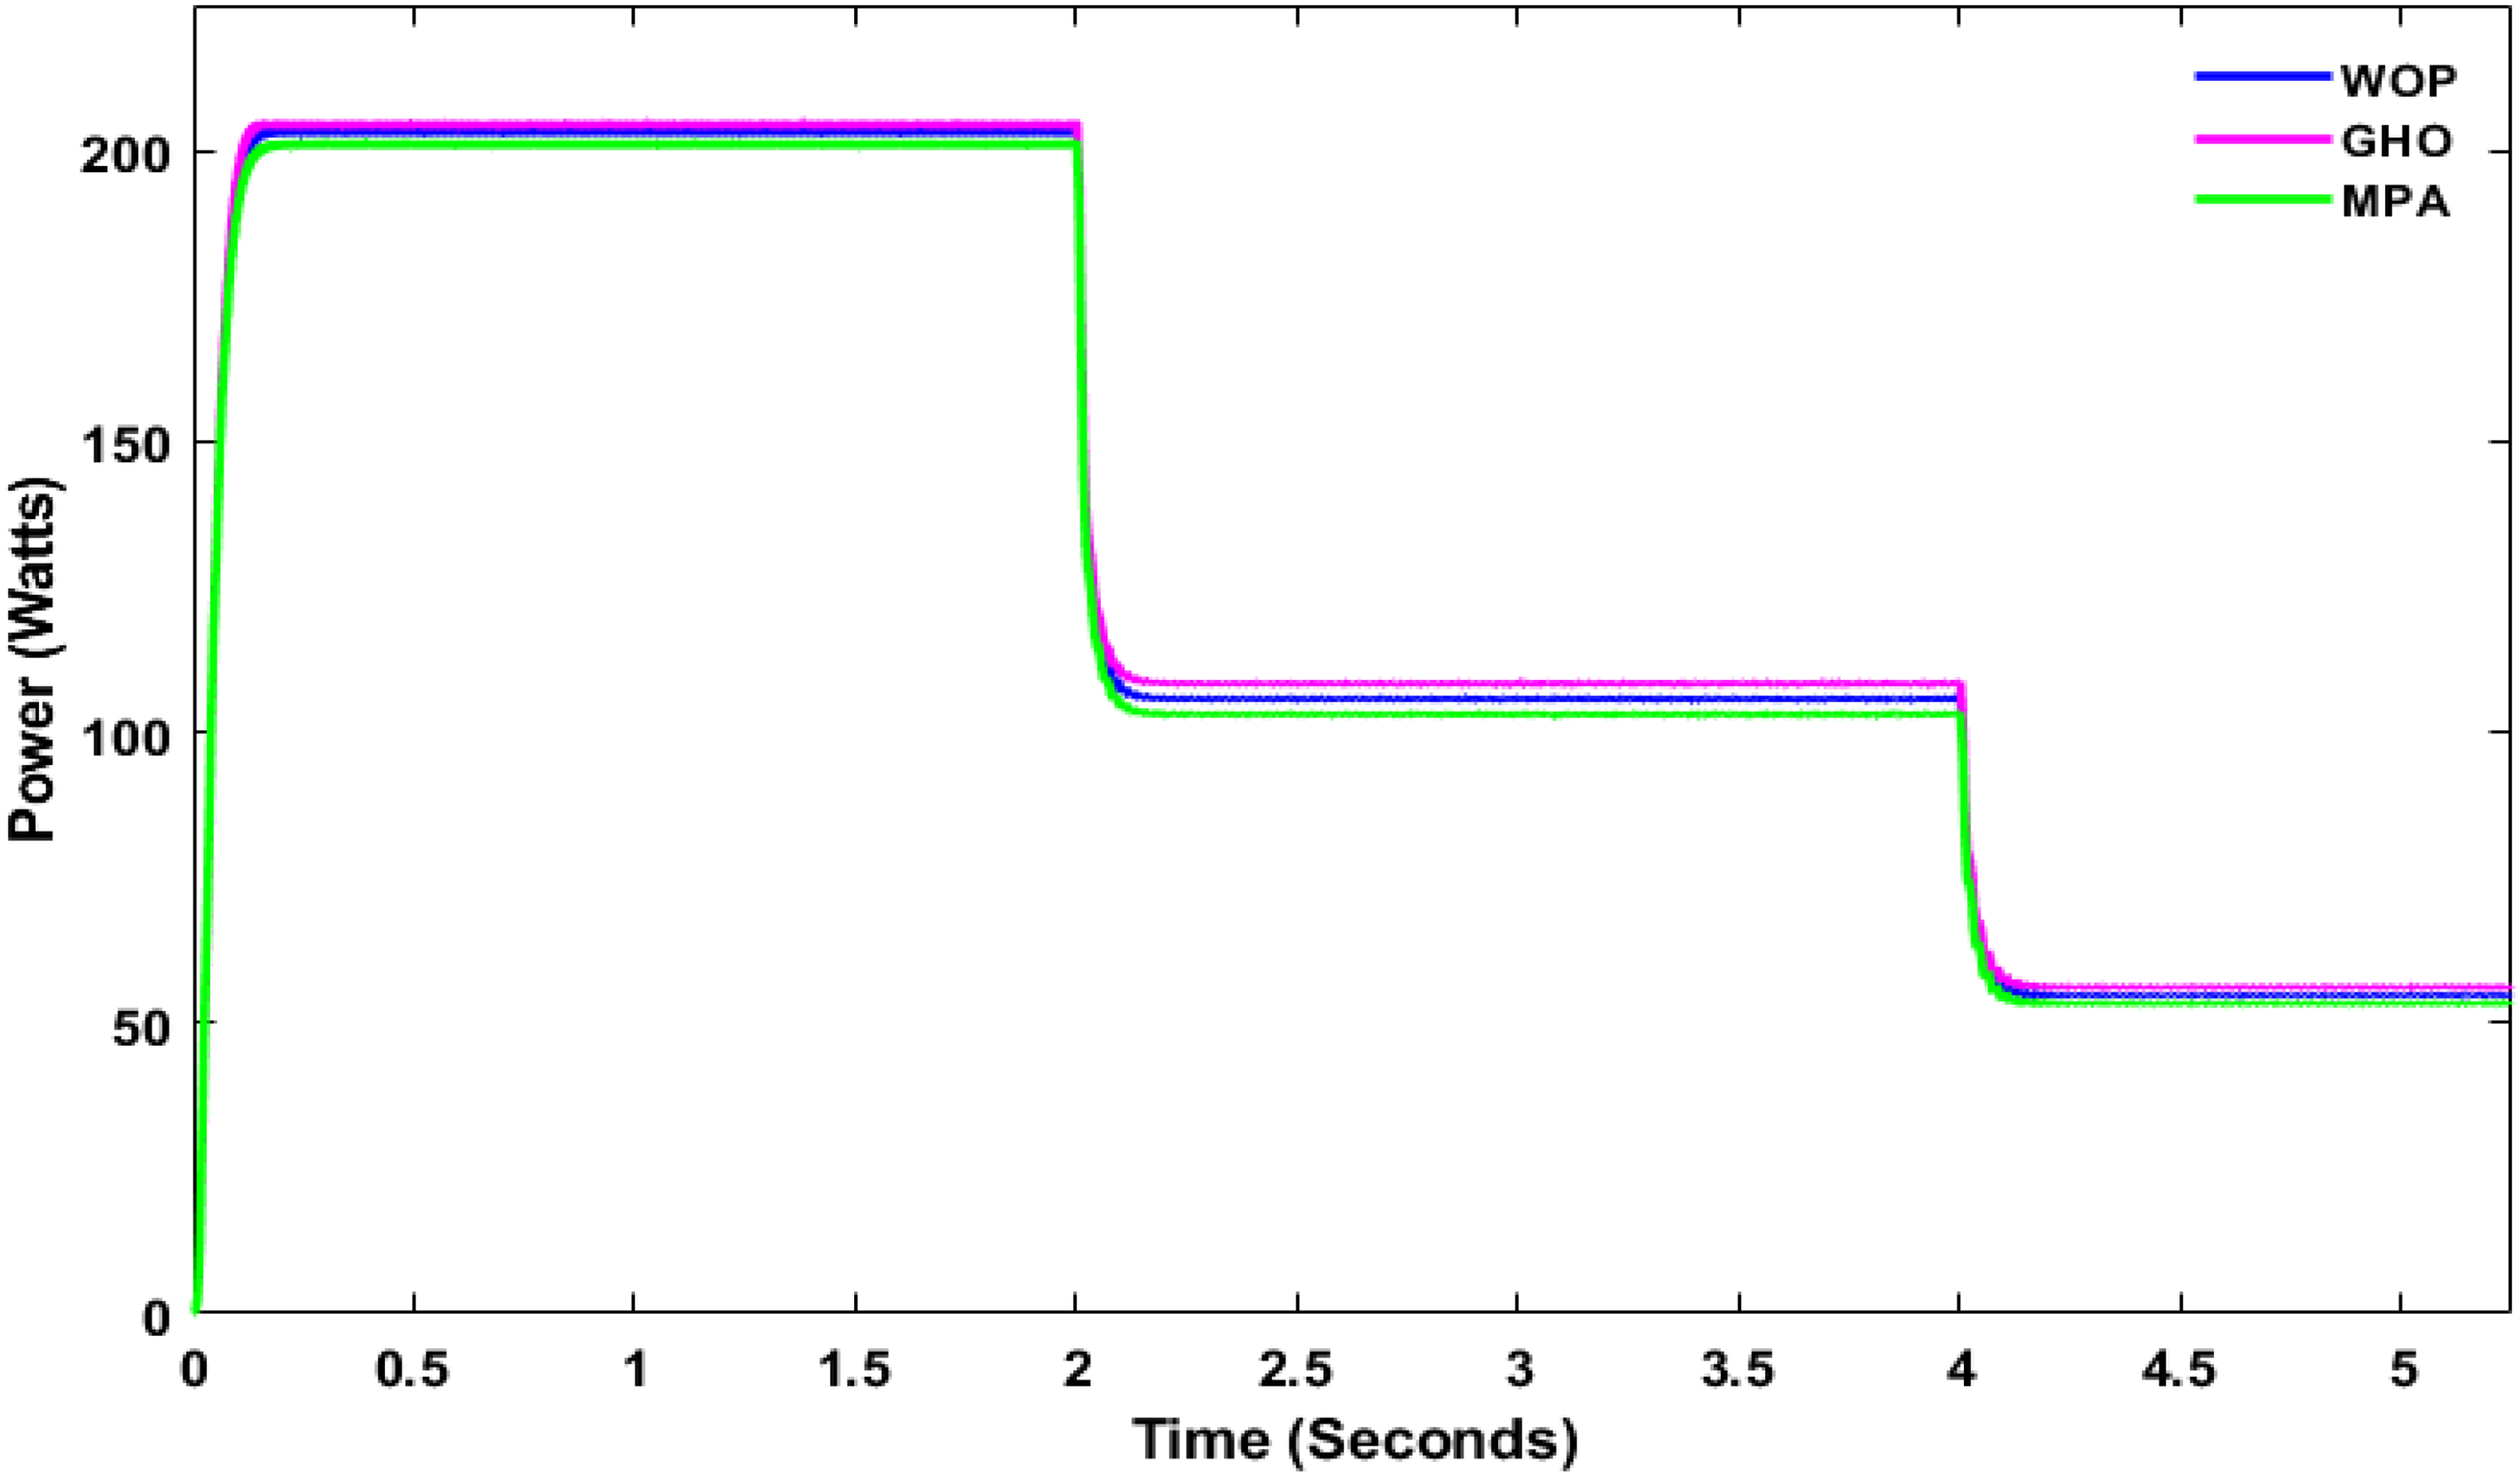
A detailed examination of the dynamic performance of different MPPT algorithms connected with an HGBC converter is made under different solar irradiances (1000, 700, and 500 W/m2). Figure 9 shows the power output profiles of the same configurations throughout time. It is clear that some algorithms, such as GHO and WOA, are capable of raising the power faster than the rest of the MPPT schemes, even in the case of sharp irradiance changes. Figure 10 again supports this by demonstrating the real-time dynamics of the HGBC converter combined with bio-inspired MPPT algorithms, while GHO provides smoother and more stable power output profiles with negligible behavior. This shows that GHO correctly follows and finds the MPP even under dynamically changing ambient conditions and ensures reliable energy harvesting. These qualitative observations are quantitatively confirmed by Table 3, which shows the relative values for the input/output voltages and the power at various irradiance levels. GHO consistently exhibits the best output power at any of the irradiance levels (203.7 W at 1000 W/m2, 108.1 W at 700 W/m2, and 56.02 W at 500 W/m2), while maintaining effective voltage regulation. MPA and WOA exhibit somewhat lower output power at lower irradiance levels. The results demonstrate that GHO has advantageous dynamic adaptability and energy conversion efficiency when coupled with HGBC, making it the most efficient MPPT scheme among the involved methods for practical PV systems operating under variable insolation levels.
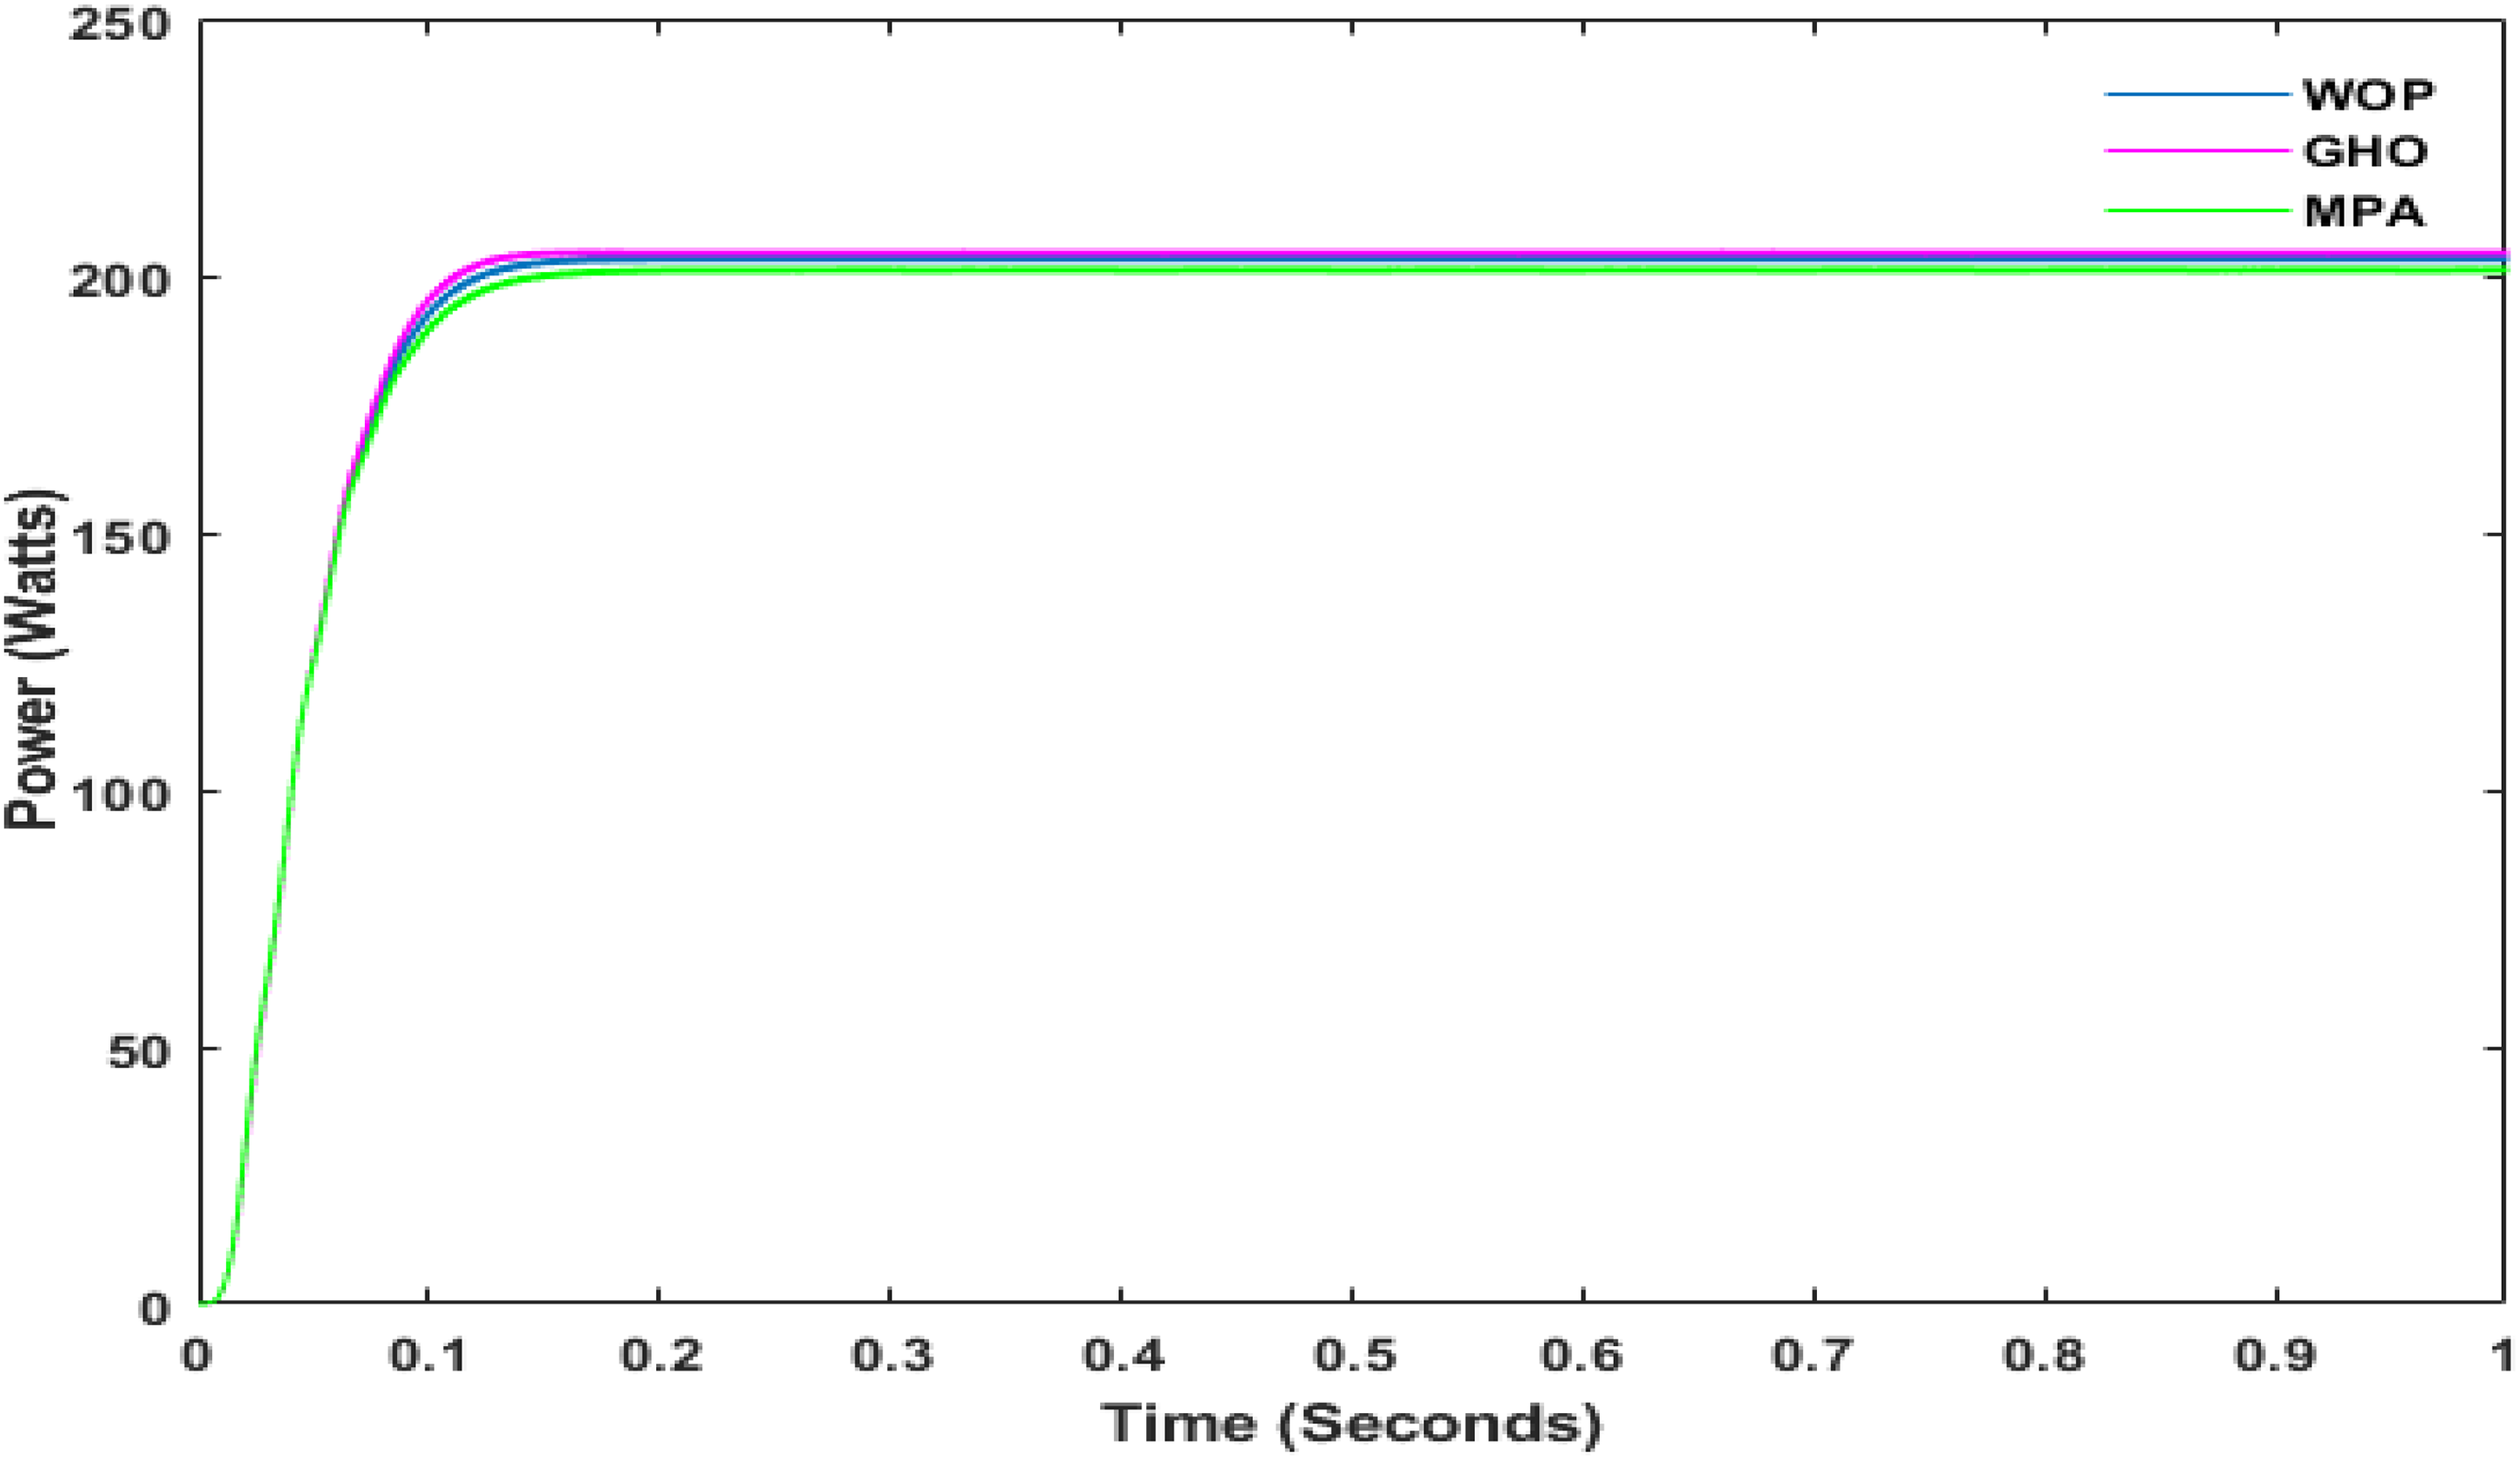
Power–time characteristics of high-gain boost converter.
HGBC with bio-inspired MPPT under dynamic irradiance conditions. HGBC: high-gain boost converter; MPPT: Maximum Power Point Tracking.
Comparative analysis of MPPT's efficiency.
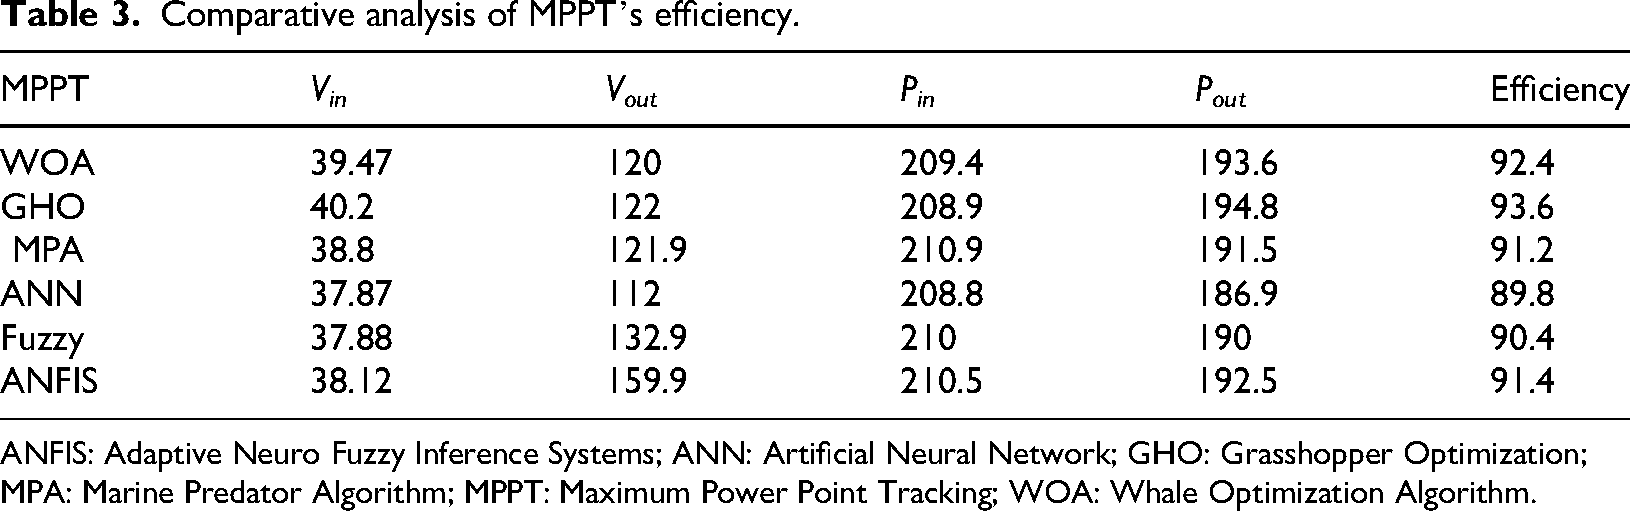
ANFIS: Adaptive Neuro Fuzzy Inference Systems; ANN: Artificial Neural Network; GHO: Grasshopper Optimization; MPA: Marine Predator Algorithm; MPPT: Maximum Power Point Tracking; WOA: Whale Optimization Algorithm.
Figures 9 and 10 illustrate the dynamic power response of the HGBC converter integrated with WOA, GHO, and MPA MPPT algorithms under step irradiance variations from 1000 to 700 W/m2 and subsequently to 500 W/m2. During the initial 1000 W/m2 interval, GHO achieves an output power of 204.5 W, compared to 203.7 W for WOA and 201.5 W for MPA (Table 3). This represents a power improvement of approximately 0.8 W over WOA and 3.0 W over MPA. When irradiance decreases to 700 W/m2, the output power of GHO stabilizes at 108.1 W, while WOA and MPA settle at 105.8 and 102.8 W, respectively.
The difference between GHO and MPA at this irradiance level is approximately 5.3 W, indicating improved energy extraction under moderate irradiance conditions. At 500 W/m2, GHO maintains 56.02 W, compared to 54.7 W (WOA) and 53.38 W (MPA), demonstrating consistent superiority across reduced irradiance levels. From the dynamic profiles in Figures 9 and 10, GHO exhibits comparable rise time to WOA during initial startup but shows slightly smoother stabilization following irradiance transitions, as evidenced by its higher stabilized output power at each step. Although all algorithms track the new MPP after irradiance variation, the steady-state output values confirm that GHO consistently delivers the highest extracted power across all operating conditions. The input–output voltage relationship in Table 4 further supports this observation. At 1000 W/m2, GHO produces a boosted output voltage of 126.4 V, compared to 124 V (WOA) and 121.8 V (MPA), while maintaining the highest output power. Similar voltage advantages are observed at 700 W/m2 (91.7 V for GHO vs 89.7 V for WOA) and 500 W/m2 (66.1 V for GHO vs 64.48 V for WOA). Overall, the numerical results confirm that GHO consistently achieves the highest steady-state output power across all irradiance levels, with a measurable improvement of approximately 1 to 5 W over WOA and MPA under dynamic conditions. These quantitative differences indicate enhanced dynamic energy extraction performance when GHO is integrated with the HGBC converter.
Comparative analysis of MPPT under dynamic condition.
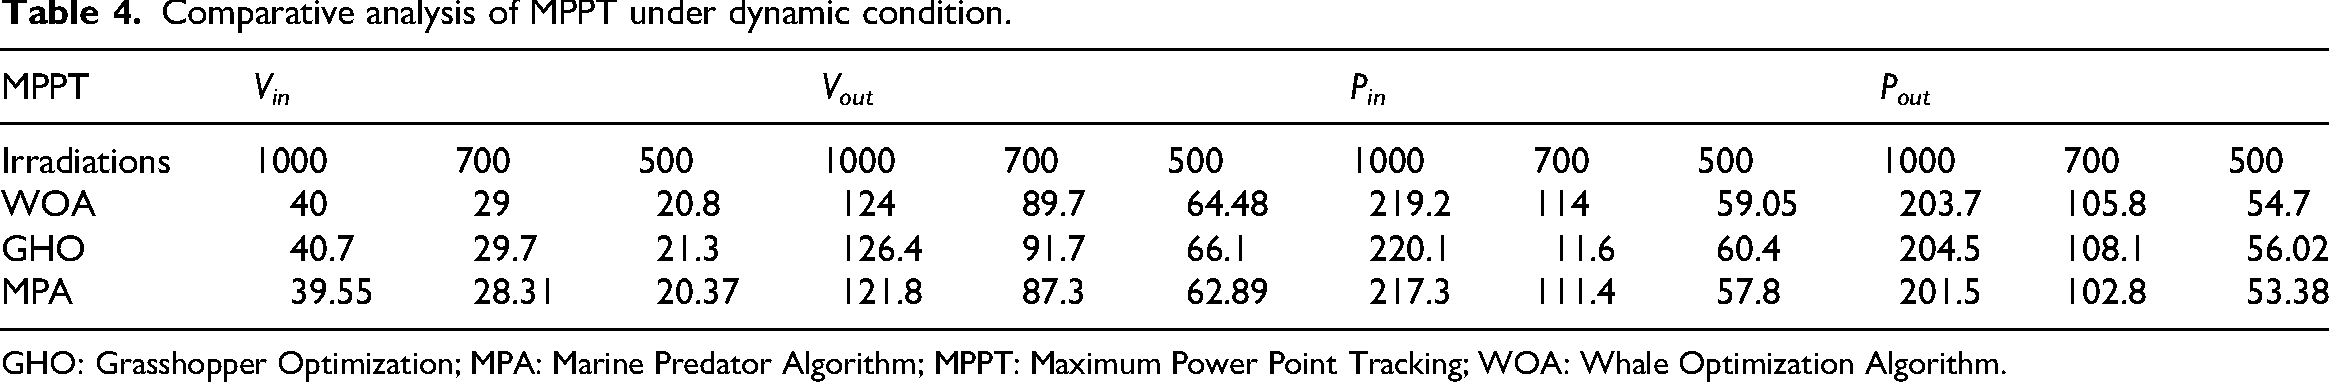
GHO: Grasshopper Optimization; MPA: Marine Predator Algorithm; MPPT: Maximum Power Point Tracking; WOA: Whale Optimization Algorithm.
Table 5 shows the MPPT algorithms perform under the same static conditions. Among all methods, the proposed GHO-based MPPT itself achieves the highest efficiency of 93.6%, which is further 1.2% higher than WOP (92.4%) and 2.4% higher than MPA (91.2%). GHO shows a settling time of 30 ms, which is further 15 ms faster than WOP (45 ms) and 20 ms faster than MPA and fuzzy logic itself (50 ms). GHO actually shows only 1.2% power ripple, which is definitely the smallest among all methods and much lower than fuzzy at 3.2% and MPA at 2.8%. GHO needs only 65 iterations, while MPA takes 125 and ANN takes 150, showing it works faster with less computer work. ANFIS surely settles faster at 25 ms, but its efficiency of 91.4% and ripple of 1.9% are not as good as GHO. Moreover, GHO performs better in these important measures despite taking more time to settle. Under changing light conditions (Table 6), similar performance trends are observed further, and the system itself shows consistent behavior.
Performance of MPPT algorithms at static condition.
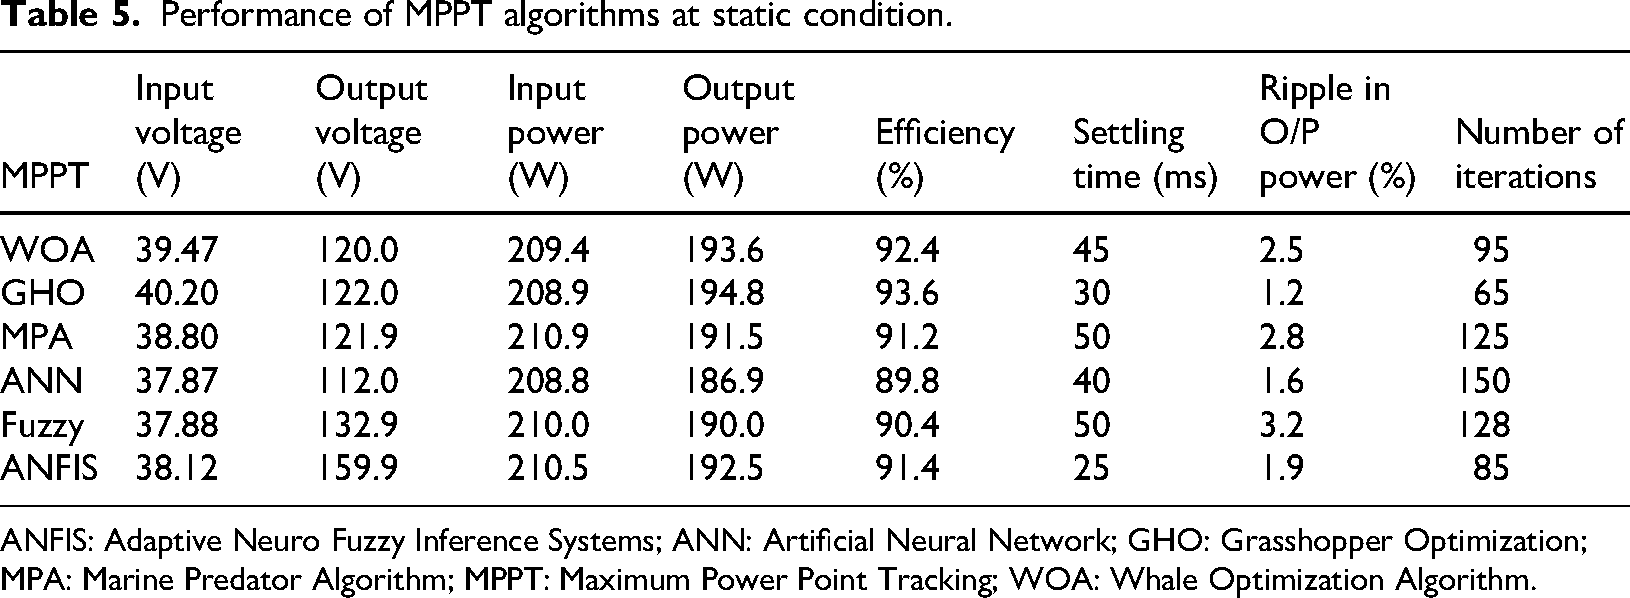
ANFIS: Adaptive Neuro Fuzzy Inference Systems; ANN: Artificial Neural Network; GHO: Grasshopper Optimization; MPA: Marine Predator Algorithm; MPPT: Maximum Power Point Tracking; WOA: Whale Optimization Algorithm.
Performance of MPPT algorithms at dynamic conditions.
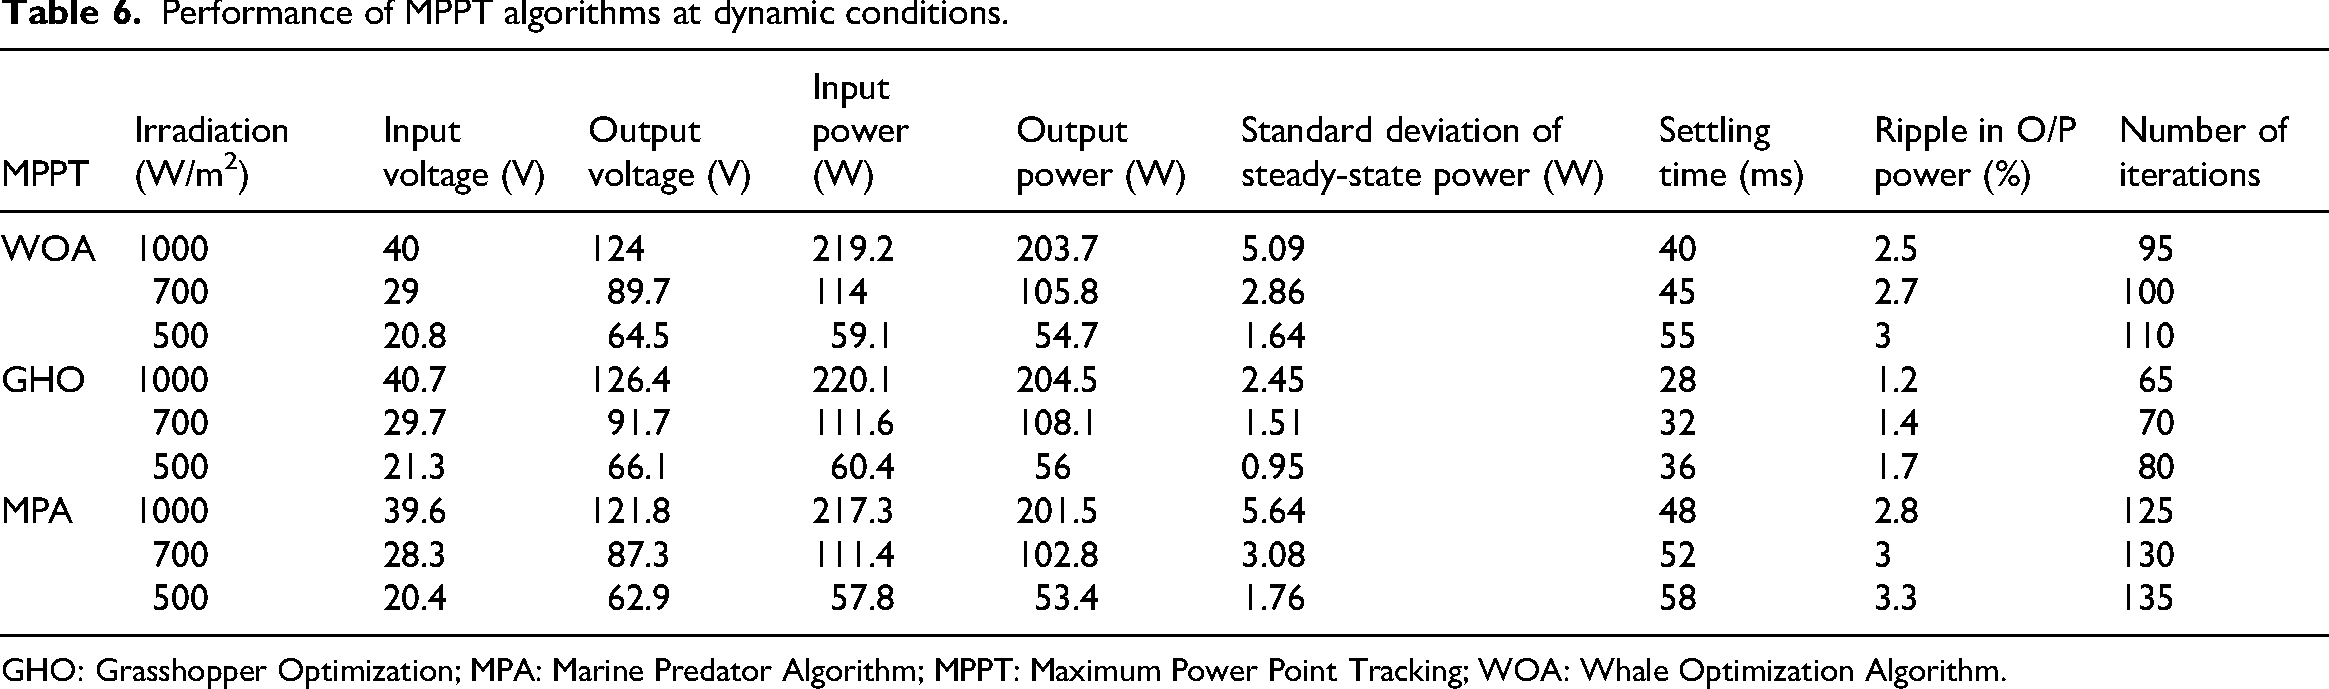
GHO: Grasshopper Optimization; MPA: Marine Predator Algorithm; MPPT: Maximum Power Point Tracking; WOA: Whale Optimization Algorithm.
Table 6 further includes the standard deviation of tracked output power to measure the steady-state oscillations after MPP convergence itself. The values are actually calculated from the steady part of the output power wave. This steady region definitely gives the most accurate results. As per the observations, the proposed GHO-based MPPT shows much less power deviation regarding WOA and MPA methods. Chiefly, at 1000 W/m2, GHO method shows the same 2.45 W deviation, but WOA and MPA show higher deviations of 5.09 and 5.64 W. We are seeing that the smaller standard deviation shows only minimal changes around the MPP, which confirms better steady-state stability. As per the test results, the proposed HGBC-GHO system shows better power tracking with less steady-state changes during dynamic conditions. Regarding performance, this system gives more accurate results compared to other methods.
The MPPT performance was actually tested under 13 different conditions (T1–T13), including steady sunlight, step changes, ramp changes, partial shading, moving clouds, and hotspot situations, refer Table 7. These tests definitely covered all the main operating scenarios that solar panels face in real conditions. The study further compared different methods using efficiency (%), settling time (ms), ripple (%), iteration count, and tracking speed (W/ms) as shown in Table 6. These parameters itself helped measure the performance of each approach. The proposed GHO-based MPPT shows efficiency of 91.0 ± 0.7% to 93.6 ± 0.4% under normal irradiance changes (T1–T6), which is further better than MPA by 0.3% to 1.7% and ANN/fuzzy controllers by 1.5% to 3.0%. The GHO method itself performs consistently well in all test conditions. As per T1 results, GHO shows 93.6 ± 0.4% accuracy, which is better than MPA (93.2 ± 0.5%), ANN (91.9 ± 0.6%), and fuzzy (91.2 ± 0.7%). As per the results, the ripple is lowest at 1.2 ± 0.3%. Regarding MPA and fuzzy methods, they show 1.3 ± 0.4% and 2.1 ± 0.5% ripple values. The settling time of 28 ± 4 ms is surely faster than ANN (35 ± 6 ms) and fuzzy (40 ± 7 ms), and moreover, this shows better transient convergence. The iteration count (65 ± 6) stays lower than ANN (75 ± 8) and fuzzy (80 ± 9), which means the same thing—less computational work is needed.
Comparative analysis of MPPT algorithms under dynamic conditions.
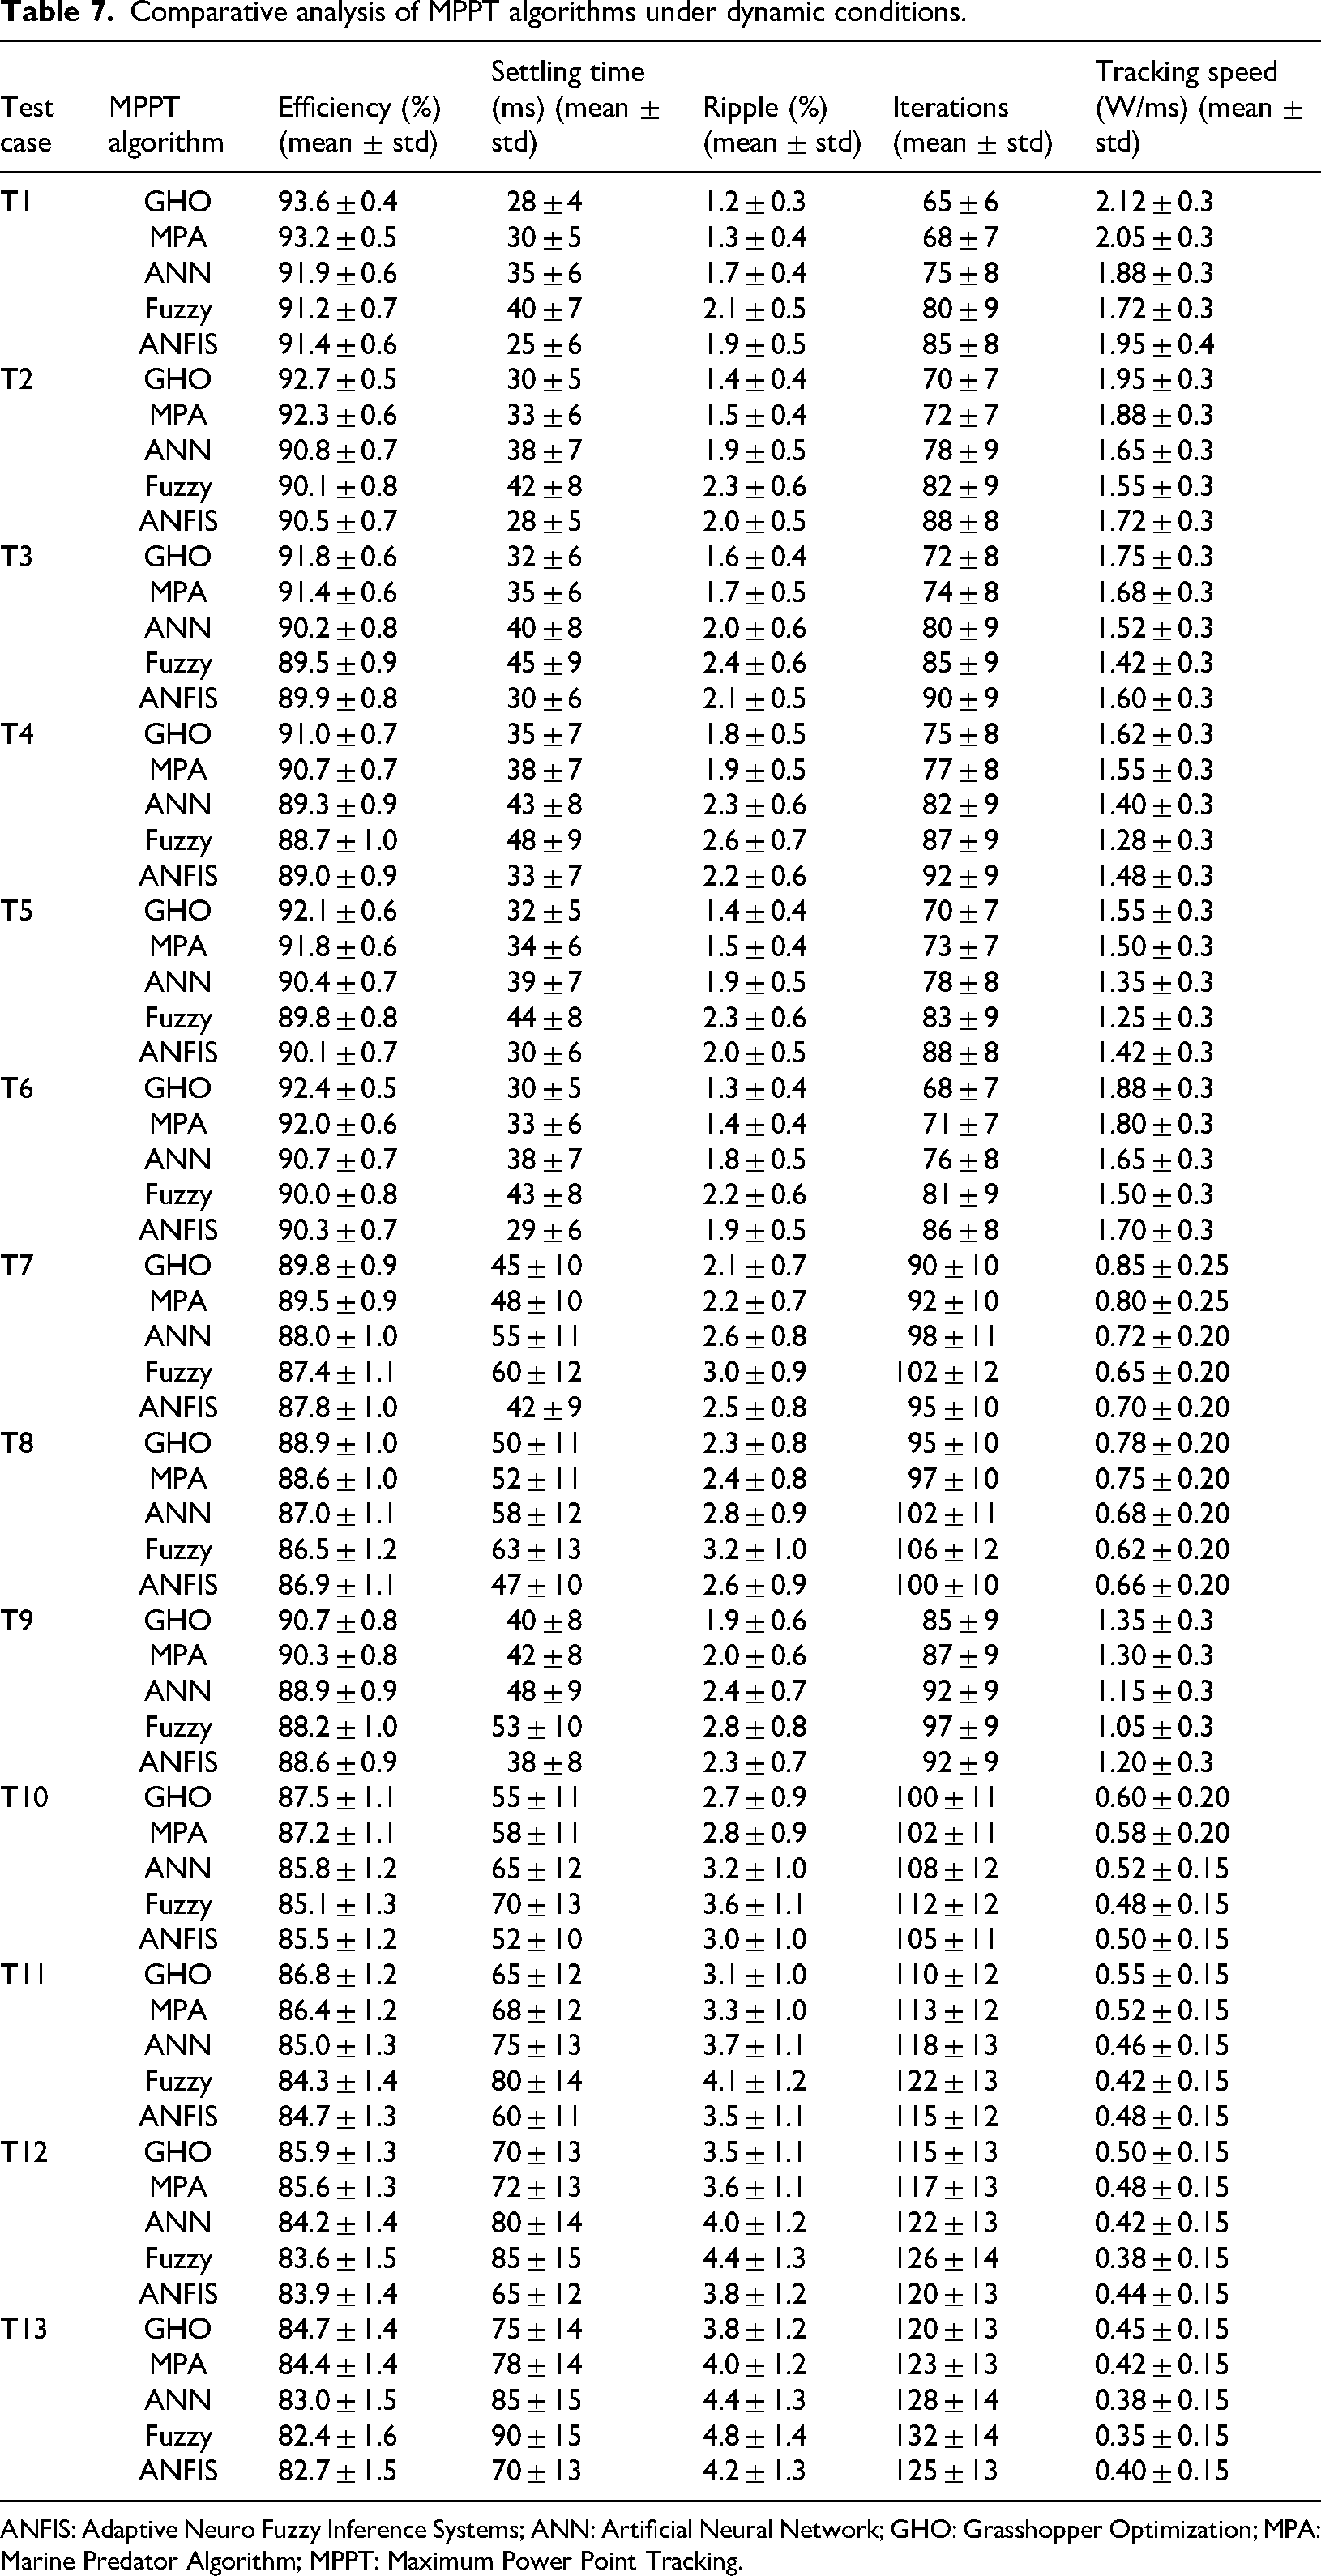
ANFIS: Adaptive Neuro Fuzzy Inference Systems; ANN: Artificial Neural Network; GHO: Grasshopper Optimization; MPA: Marine Predator Algorithm; MPPT: Maximum Power Point Tracking.
Under ramp and partial shading conditions (T7–T10), all algorithms further show reduced performance; however, GHO itself maintains the highest efficiency in each case. As per T10 results, GHO gets 87.5 ± 1.1% score, while MPA shows 87.2 ± 1.1% and ANN gives 85.8 ± 1.2%. Also, ripple goes up when there is very bad shading, but GHO only shows 2.7% ripple which is less than fuzzy at 3.6% and ANN at 3.2%. The settling time actually stays faster at 55 ± 11 ms compared to fuzzy at 70 ± 13 ms. The tracking speed definitely shows a small increase at 0.60 ± 0.20 W/ms against MPA's 0.58 ± 0.20 W/ms. GHO surely shows stable convergence even in highly dynamic conditions like moving clouds and hotspots (T11–T13). Moreover, the algorithm maintains its performance under these challenging scenarios. It is observing that, T11 gives 86.8 ± 1.2% efficiency, which is only better than MPA at 86.4 ± 1.2% and ANN at 85.0 ± 1.3%. The settling time actually increases to 65 ± 12 ms, but it definitely stays lower than ANN at 75 ± 13 ms and fuzzy at 80 ± 14 ms. It is noted that, ripple stays controlled at only 3.1 ± 1.0%, but fuzzy and ANN reach 4.1 ± 1.2% and 3.7 ± 1.1%, respectively. As per the thirteen scenarios tested, GHO shows efficiency changes within 0.4% to 1.4% standard deviation, confirming it works well regarding environmental uncertainty. As per Table 6, GHO shows better efficiency, less ripple, quick convergence, and fewer iterations than ANN and fuzzy methods. Regarding comparison with MPA, GHO performs better by a small but steady margin of 0.3% to 0.4%. These number-based results surely prove that the proposed GHO-based MPPT method works better in changing conditions. Moreover, it shows much better stability compared to other methods.
Further, the statistical assumptions were checked first before conducting further inferential analysis itself. Further, Shapiro–Wilk test was used only to check if the data was normal in each algorithm group, making sure parametric tests could be done properly. We actually used Levene's test to check if the different algorithm groups had similar variance patterns. This definitely helped confirm that our analysis of variance (ANOVA) analysis would work properly without breaking any basic rules. Also, these initial checks are surely important because unequal variances or non-normal distributions can make F-statistics wrong and give misleading results in algorithm comparison studies. Moreover, such problems can lead researchers to draw incorrect conclusions about which algorithm performs better.
After checking the data conditions, we actually ran a one-way ANOVA test at 95% confidence level to definitely find if there were real differences between the algorithm average scores for each measure. The null hypothesis surely stated that all algorithms show the same average performance. Moreover, this means no algorithm performs better than others. It is revels that when the F-test shows p < 0.05, it means at least one method is only different from others in a real way, not by chance. All test results were highly significant (p < 0.001), so we only used Tukey's HSD test to find specific differences between algorithm pairs. This procedure controls the overall error rate and ensures that the reported superiority claims are statistically justified rather than the same random fluctuation.
Figure 11 represents the comparative analysis of MPPT algorithms in terms of tracking efficiency. Figure 12 represents the comparative analysis of MPPT algorithms in terms of output ripple. Figure 13 represents the comparative analysis of MPPT algorithms in terms of settling time. From the analysis, it is evident that the GWO achieves the highest tracking efficiency of 98.3%, followed closely by MPA (97.8%) and ANFIS (96.7%), while conventional methods such as P&O and INC exhibit relatively lower efficiencies of 94.2% and 95.5%, respectively. Ripple performance, shown in Figure 12, highlights that GWO and MPA outperform the other algorithms with the lowest ripple values of 1.1% and 1.2%, respectively, indicating higher output stability. In contrast, the ANN-based approach shows the highest ripple at 3.4%, which can degrade system performance. Settling time results presented in Figure 13 further reinforce the superiority of GWO, which achieves the fastest response of 0.25 s, followed by MPA at 0.28 s, while ANN again demonstrates the slowest response with a settling time of 0.55 s. Results confirm that GWO not only provides the best efficiency but also ensures reduced ripple and faster dynamic response, making it the most robust MPPT algorithm among the compared methods.
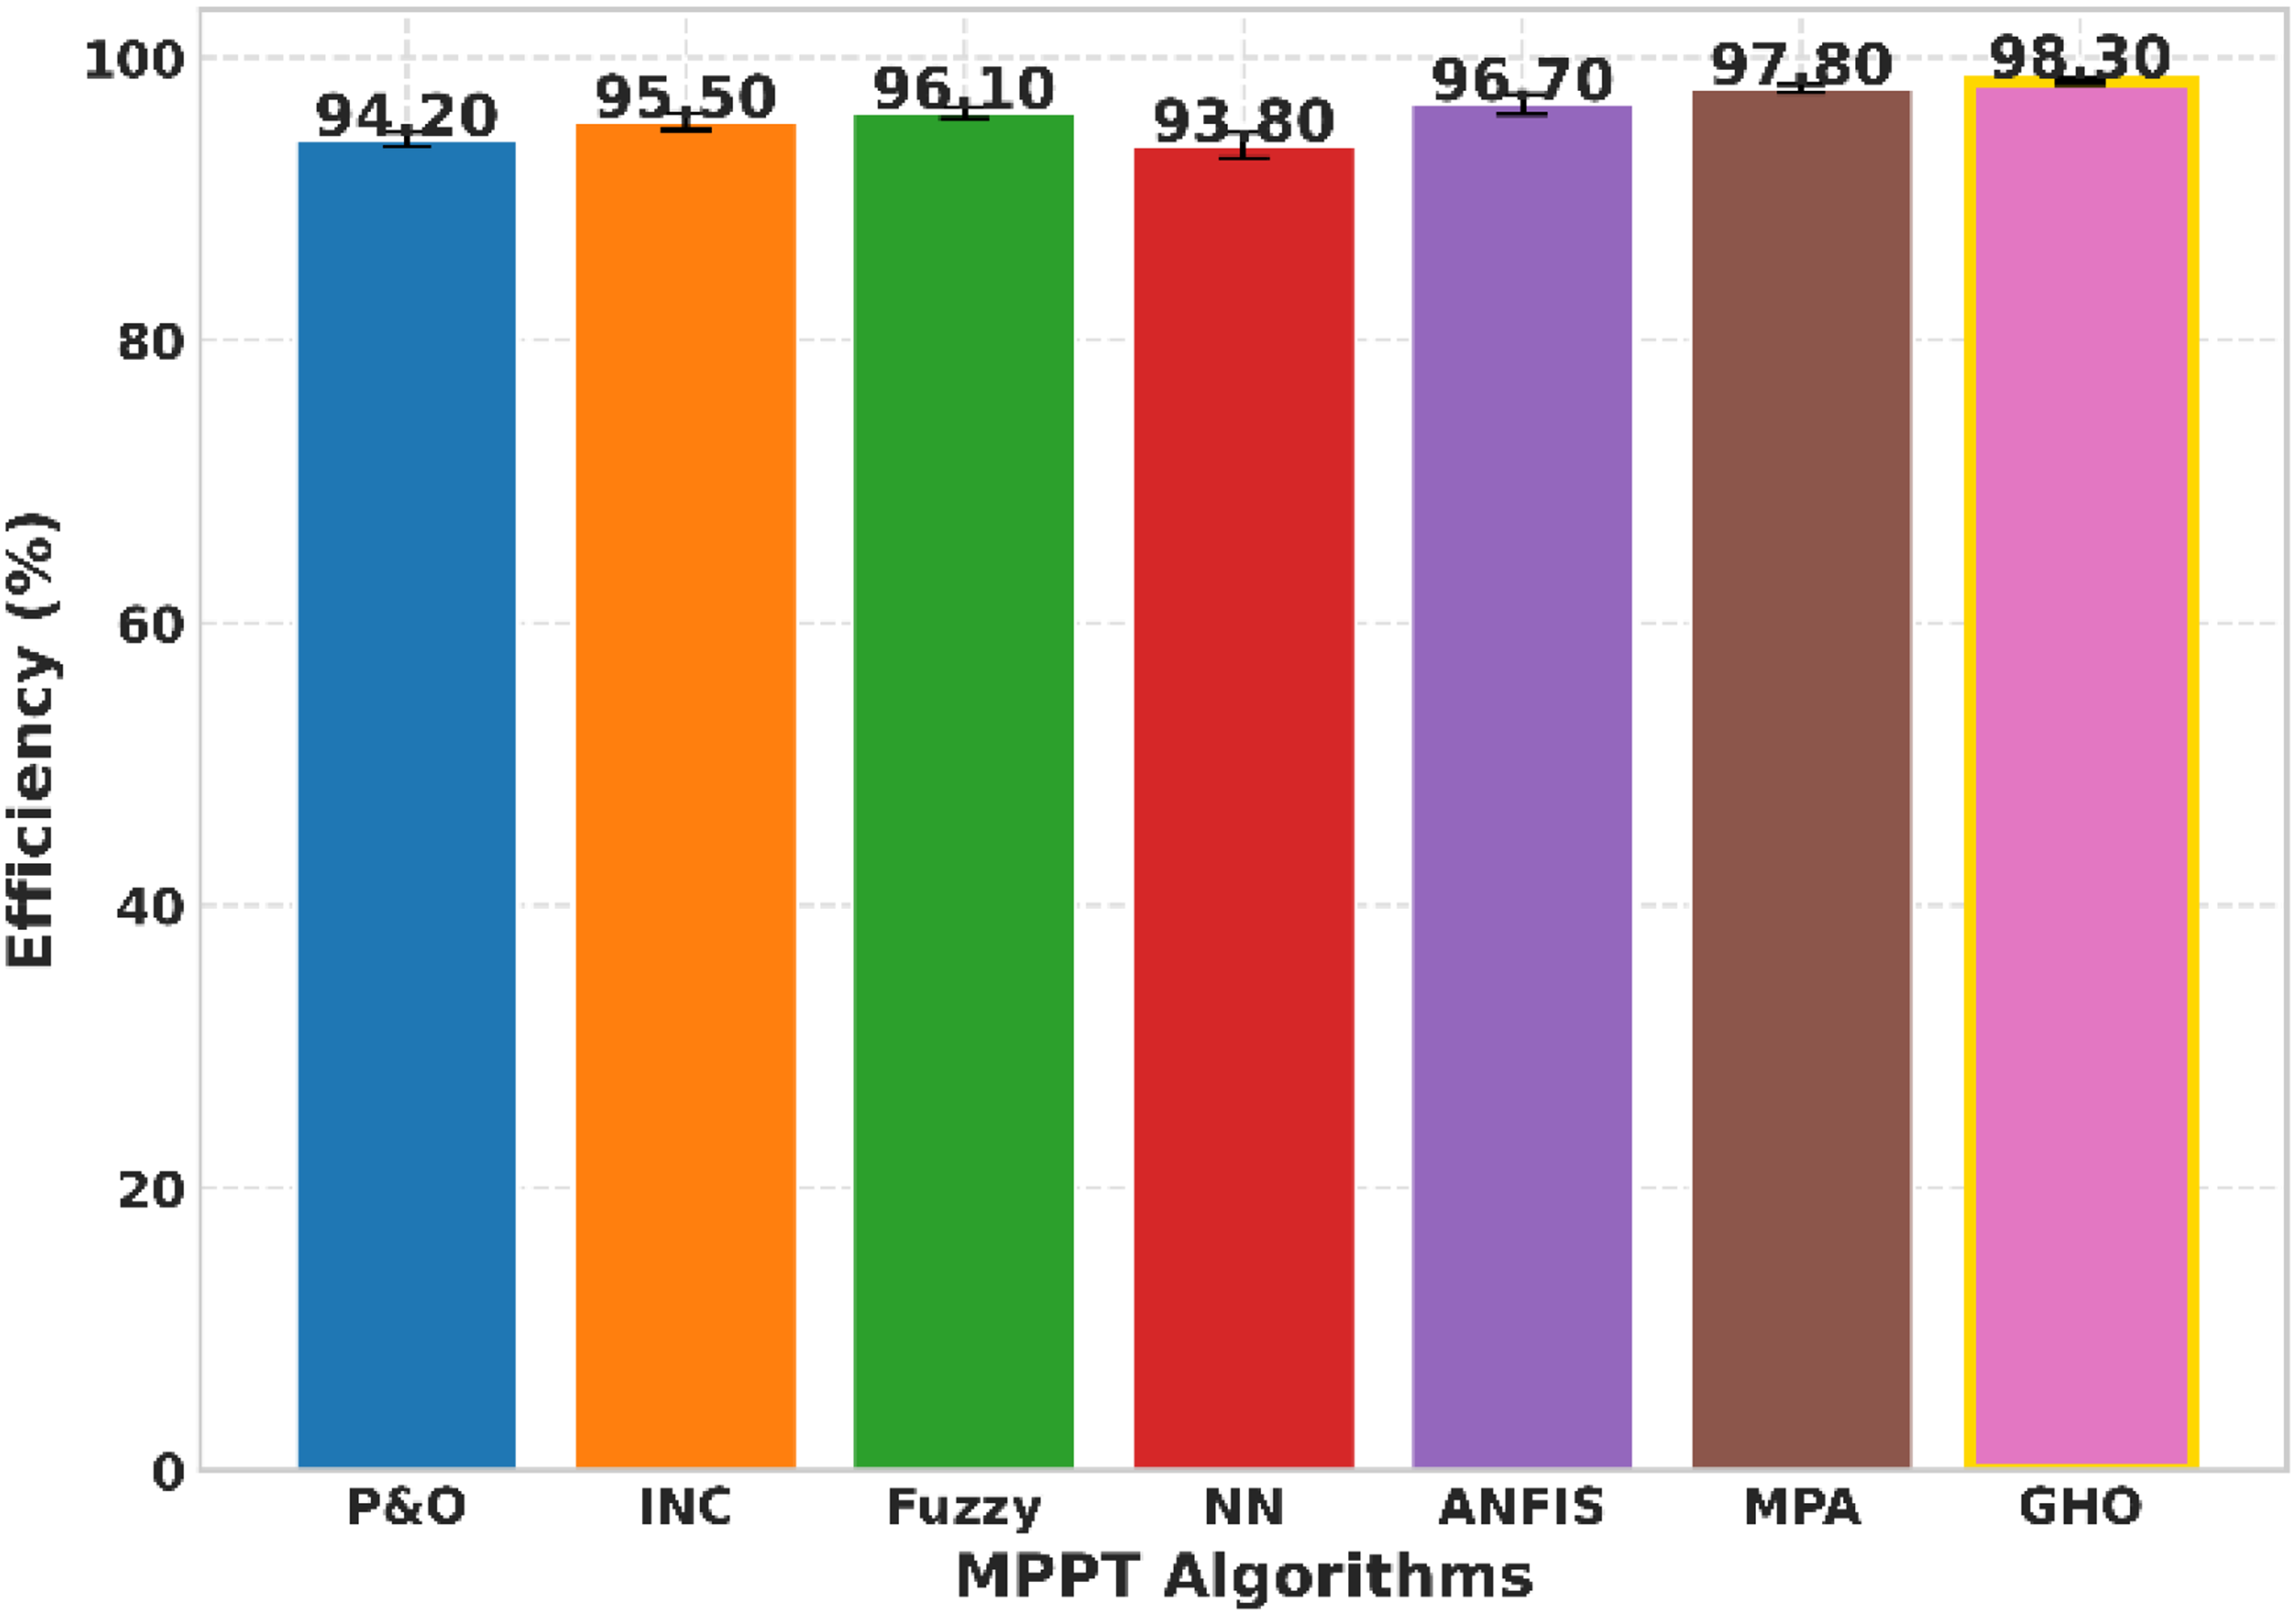
Tracking efficiency comparison of Maximum Power Point Tracking algorithms.
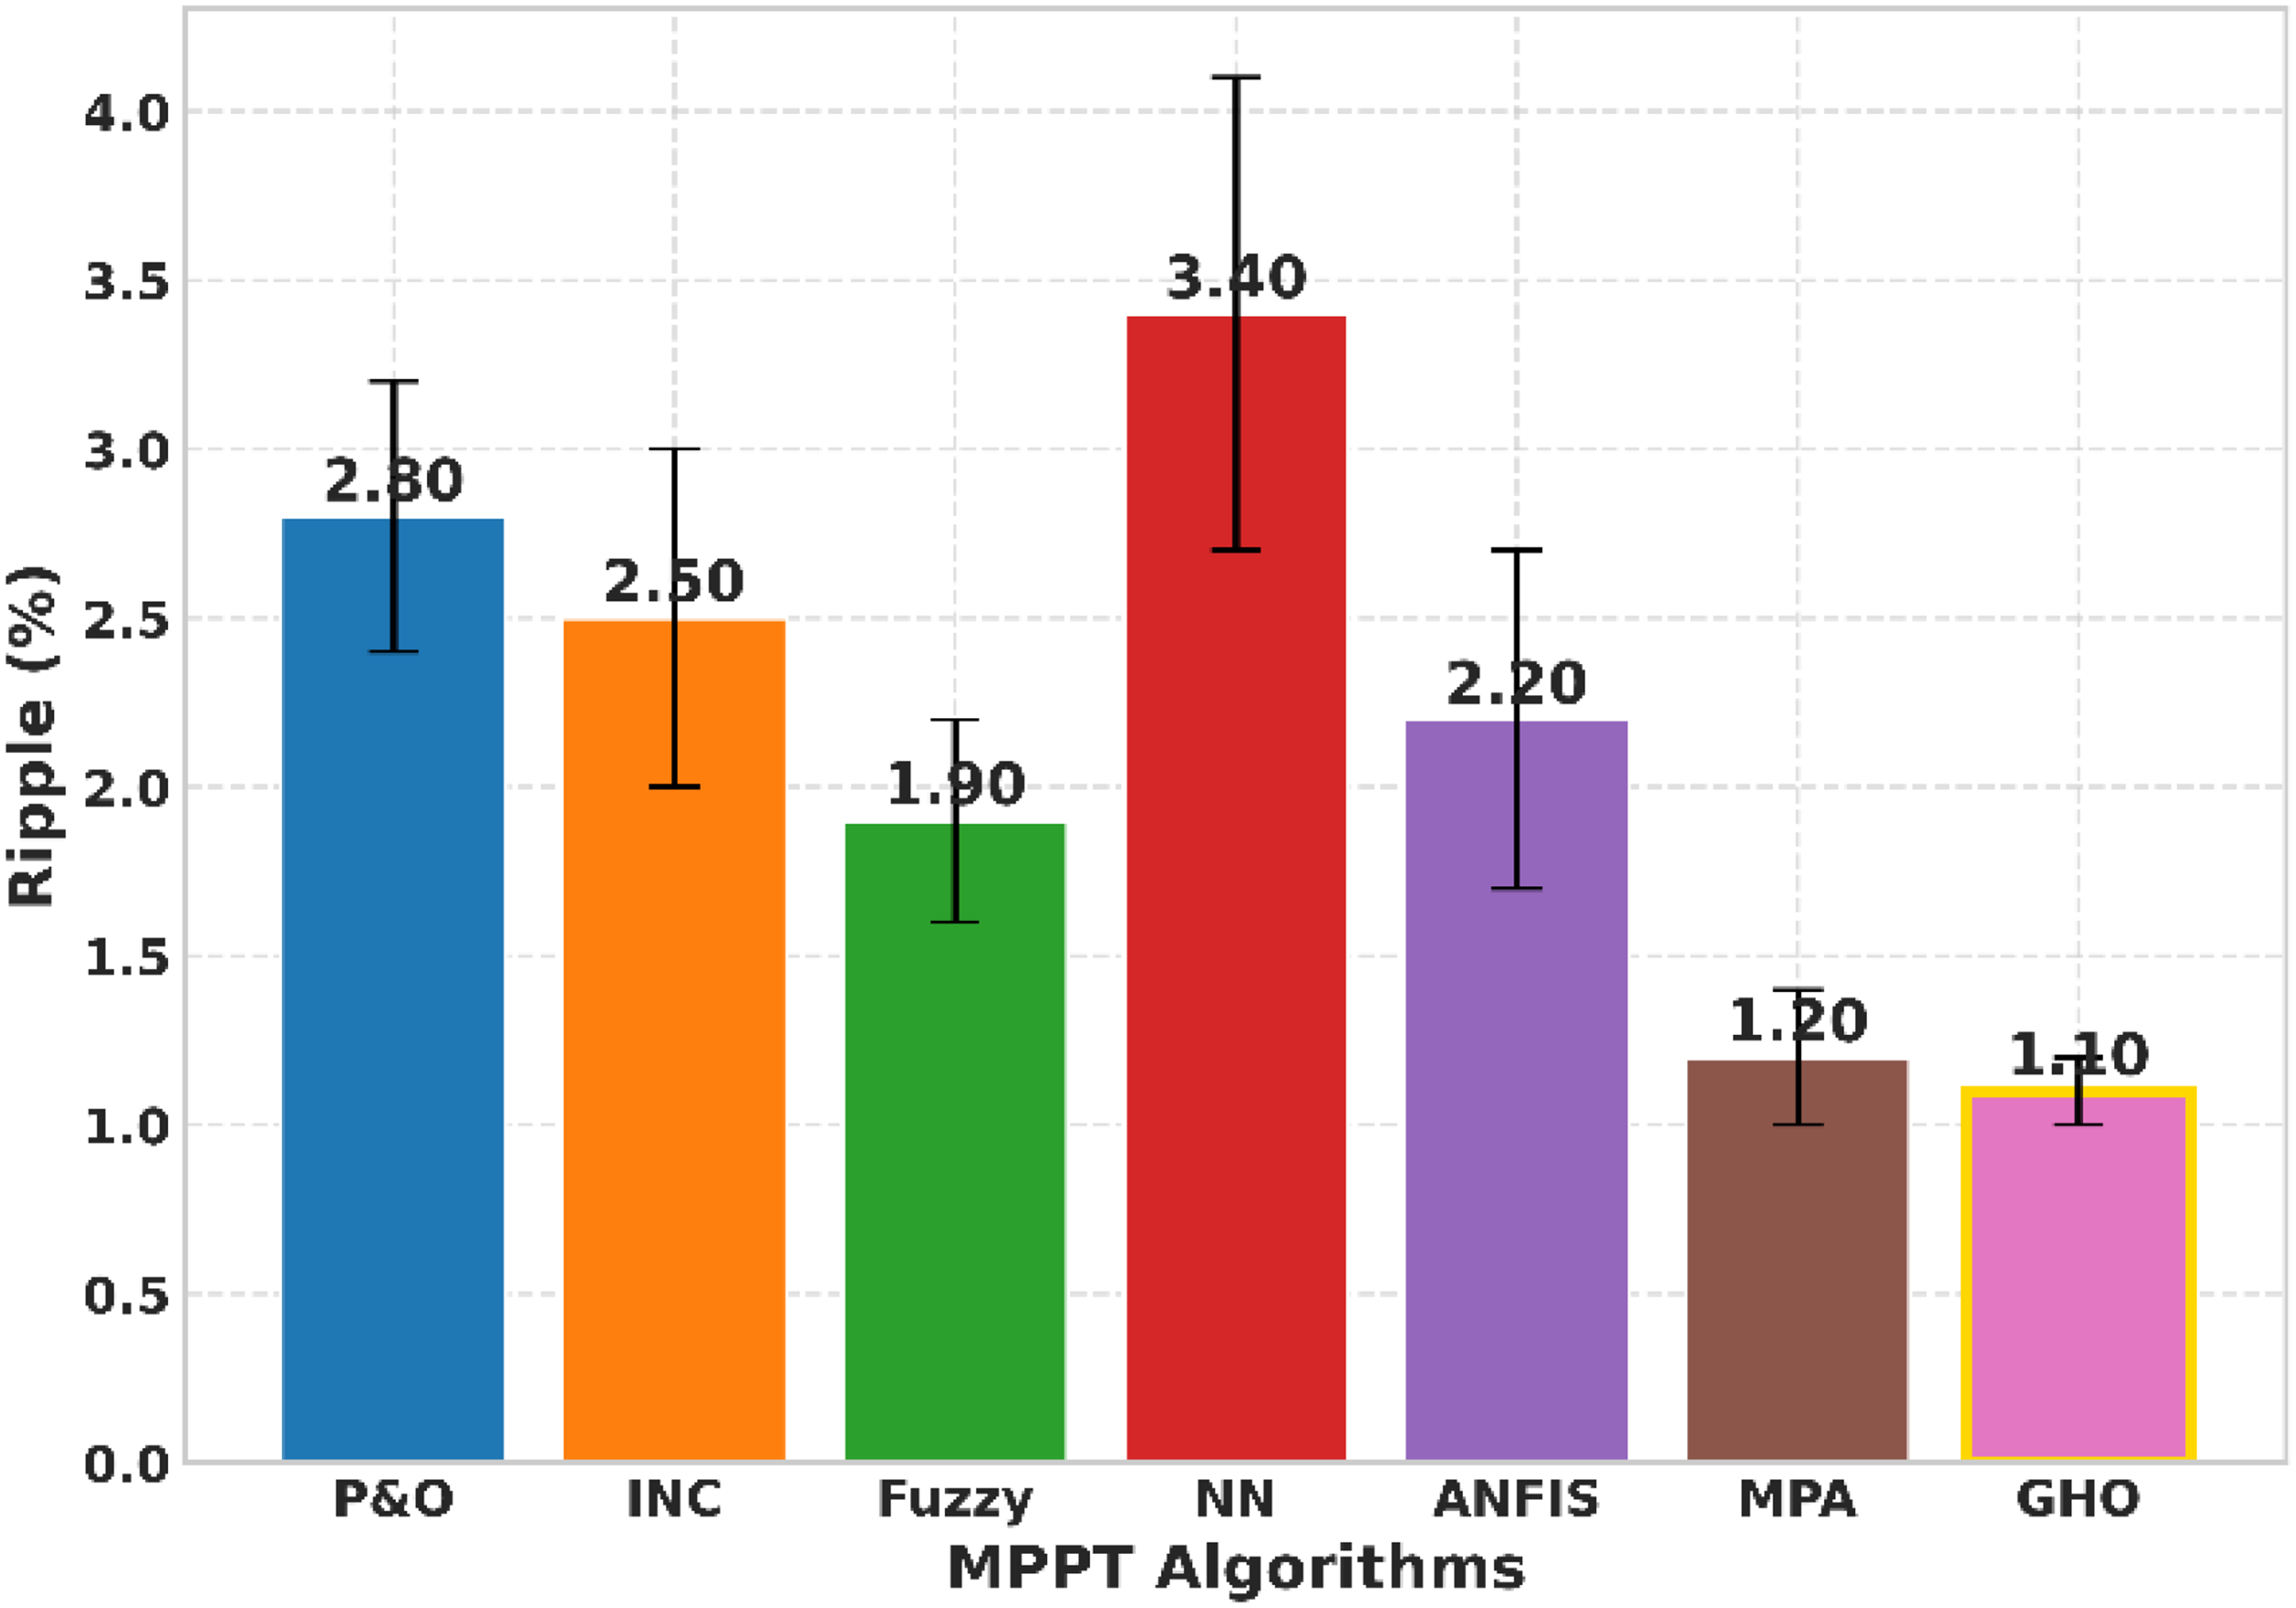
Comparative analysis of Maximum Power Point Tracking algorithms for output ripple.
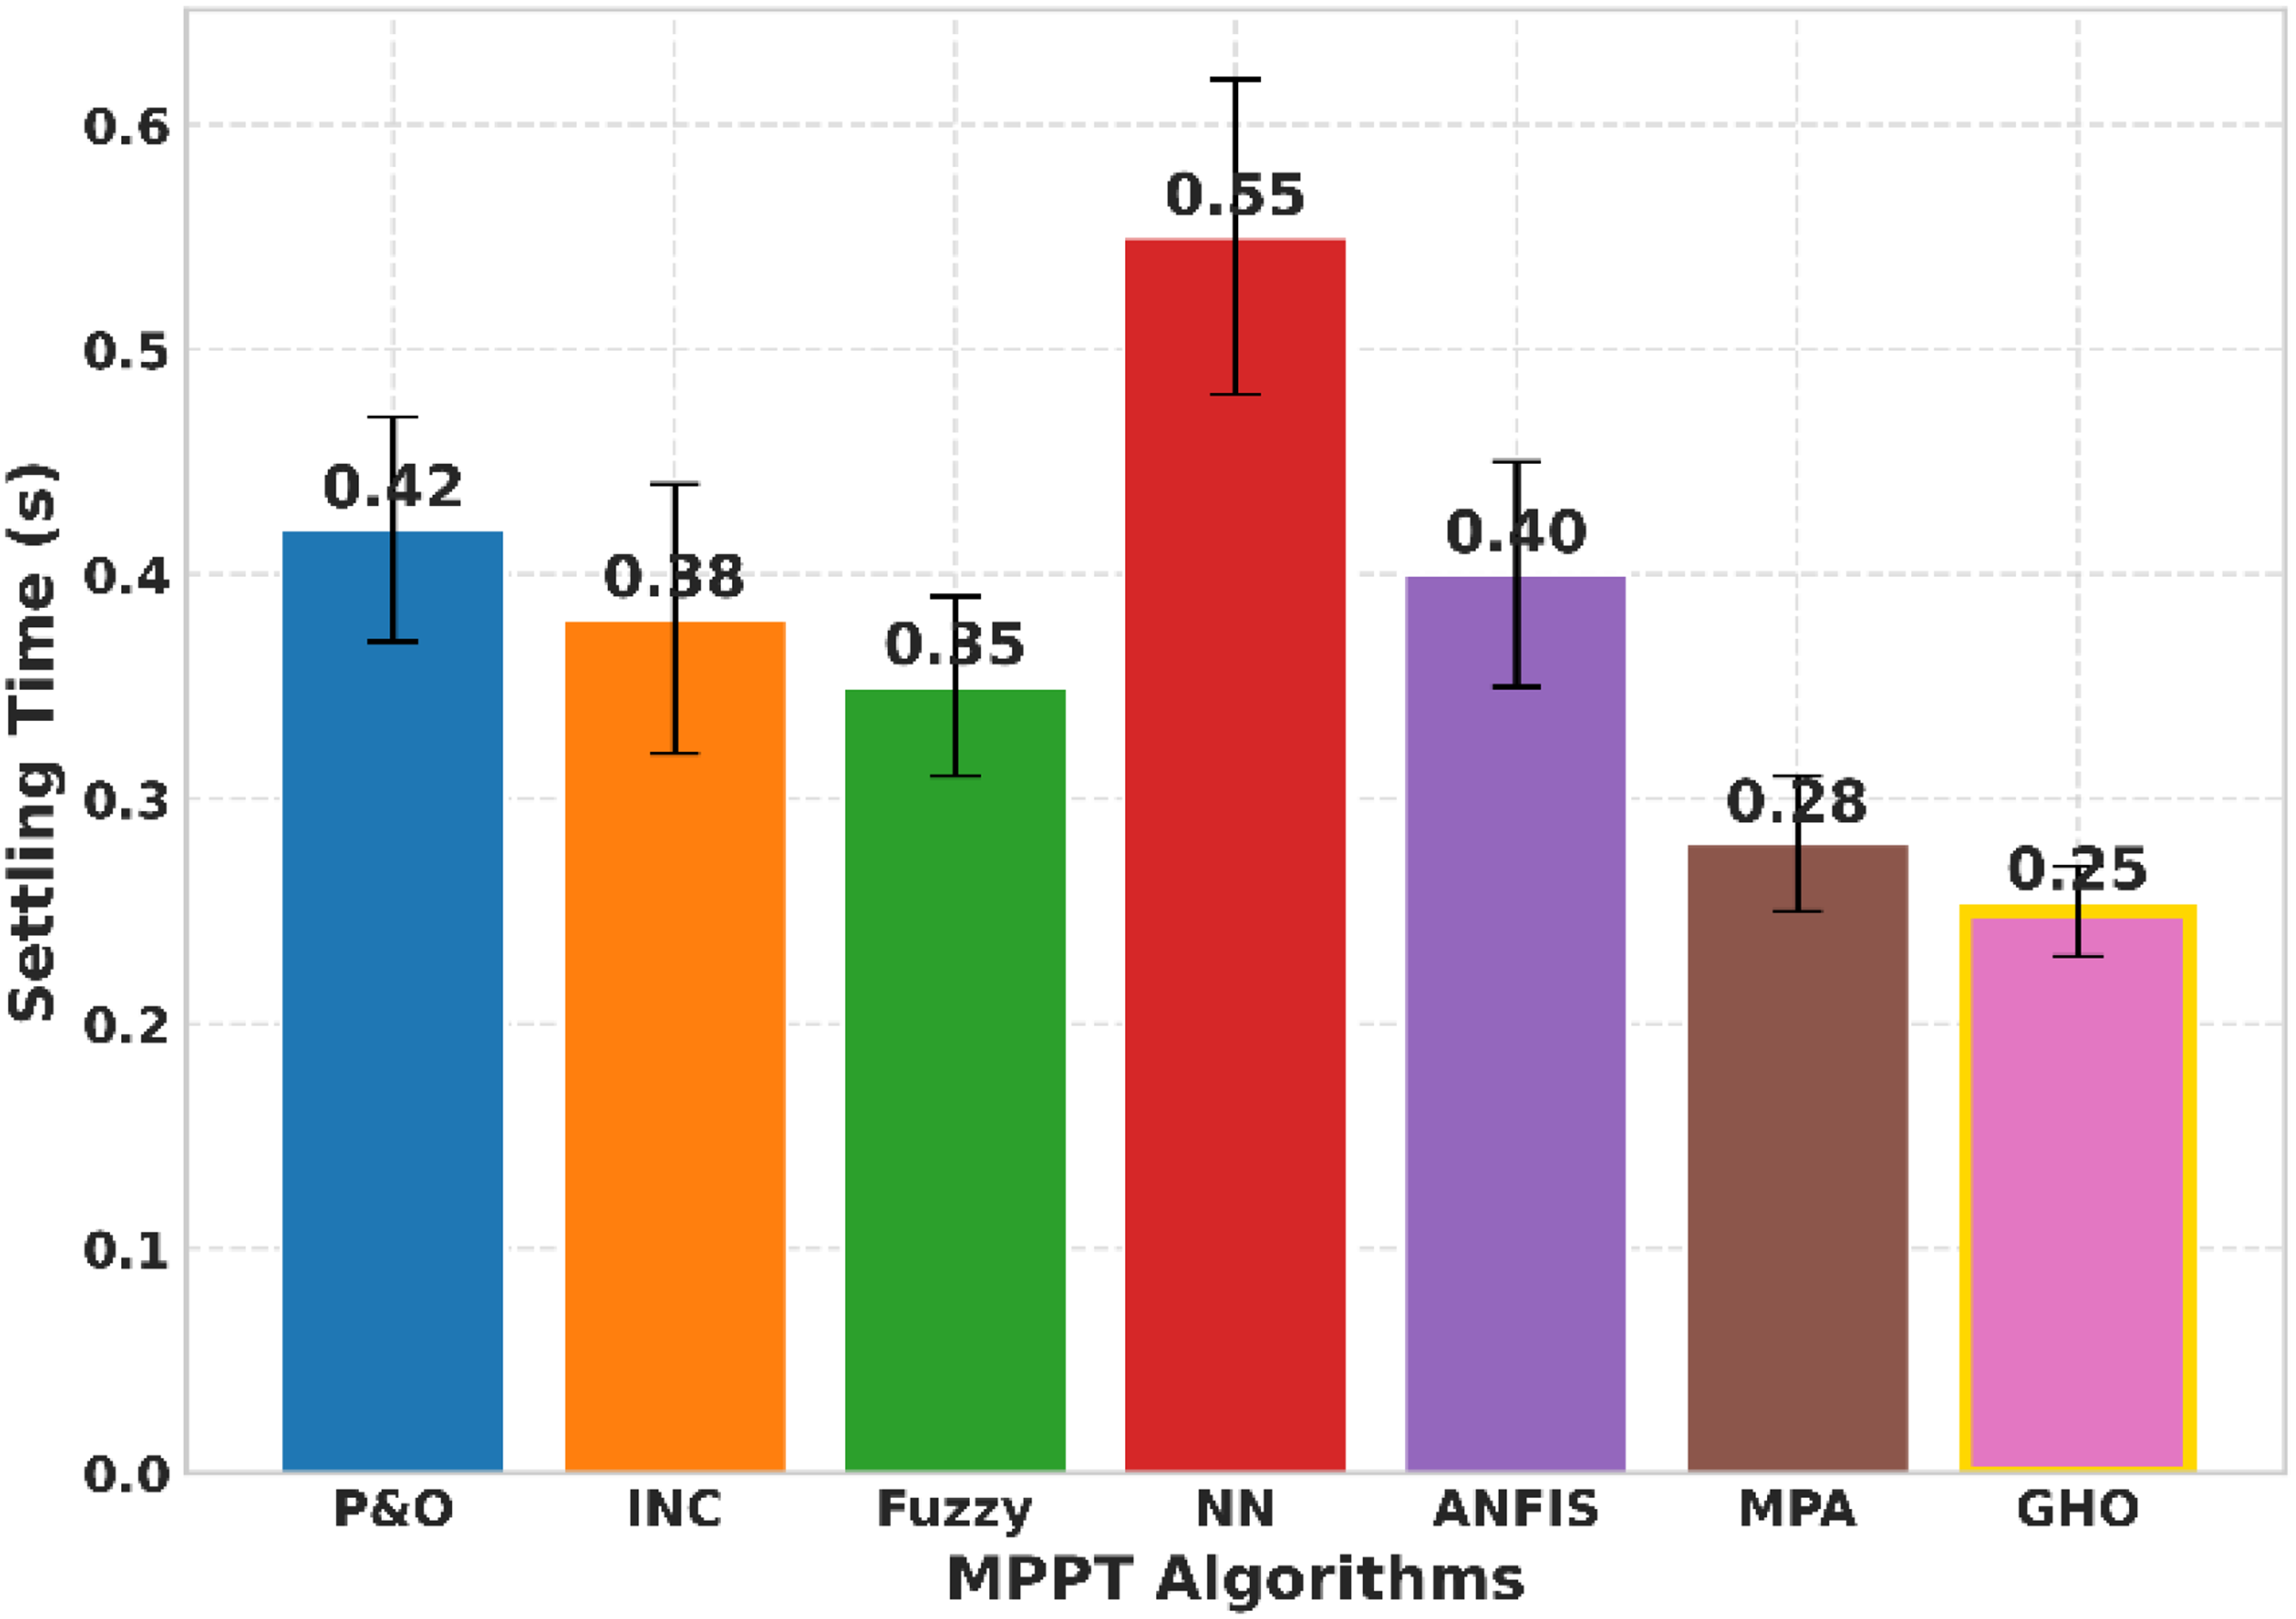
Settling time comparison of Maximum Power Point Tracking algorithms.
The proposed HGBC actually shows different efficiency levels when we change the duty cycle and output power, and this is definitely shown in Figure 14. As per the observations, the efficiency first increases with duty cycle and reaches maximum value of about 93.6% at best duty cycle of around 0.6. As per the analysis, efficiency drops slightly after this point regarding the increased conduction and switching losses at higher duty ratios. The efficiency actually improves slowly when the power output increases, and it definitely reaches its best point around 200 W before dropping a little at higher power levels. We are seeing that the converter works best only when it operates near its normal working conditions. As per testing results, the efficiency stays above 90% for different duty cycles and power levels, regarding the strong performance of this circuit design. The converter works well under different conditions, which further proves that it can be used in solar energy systems and is suitable for real-time use itself (Özden and Ertekin, 2026).
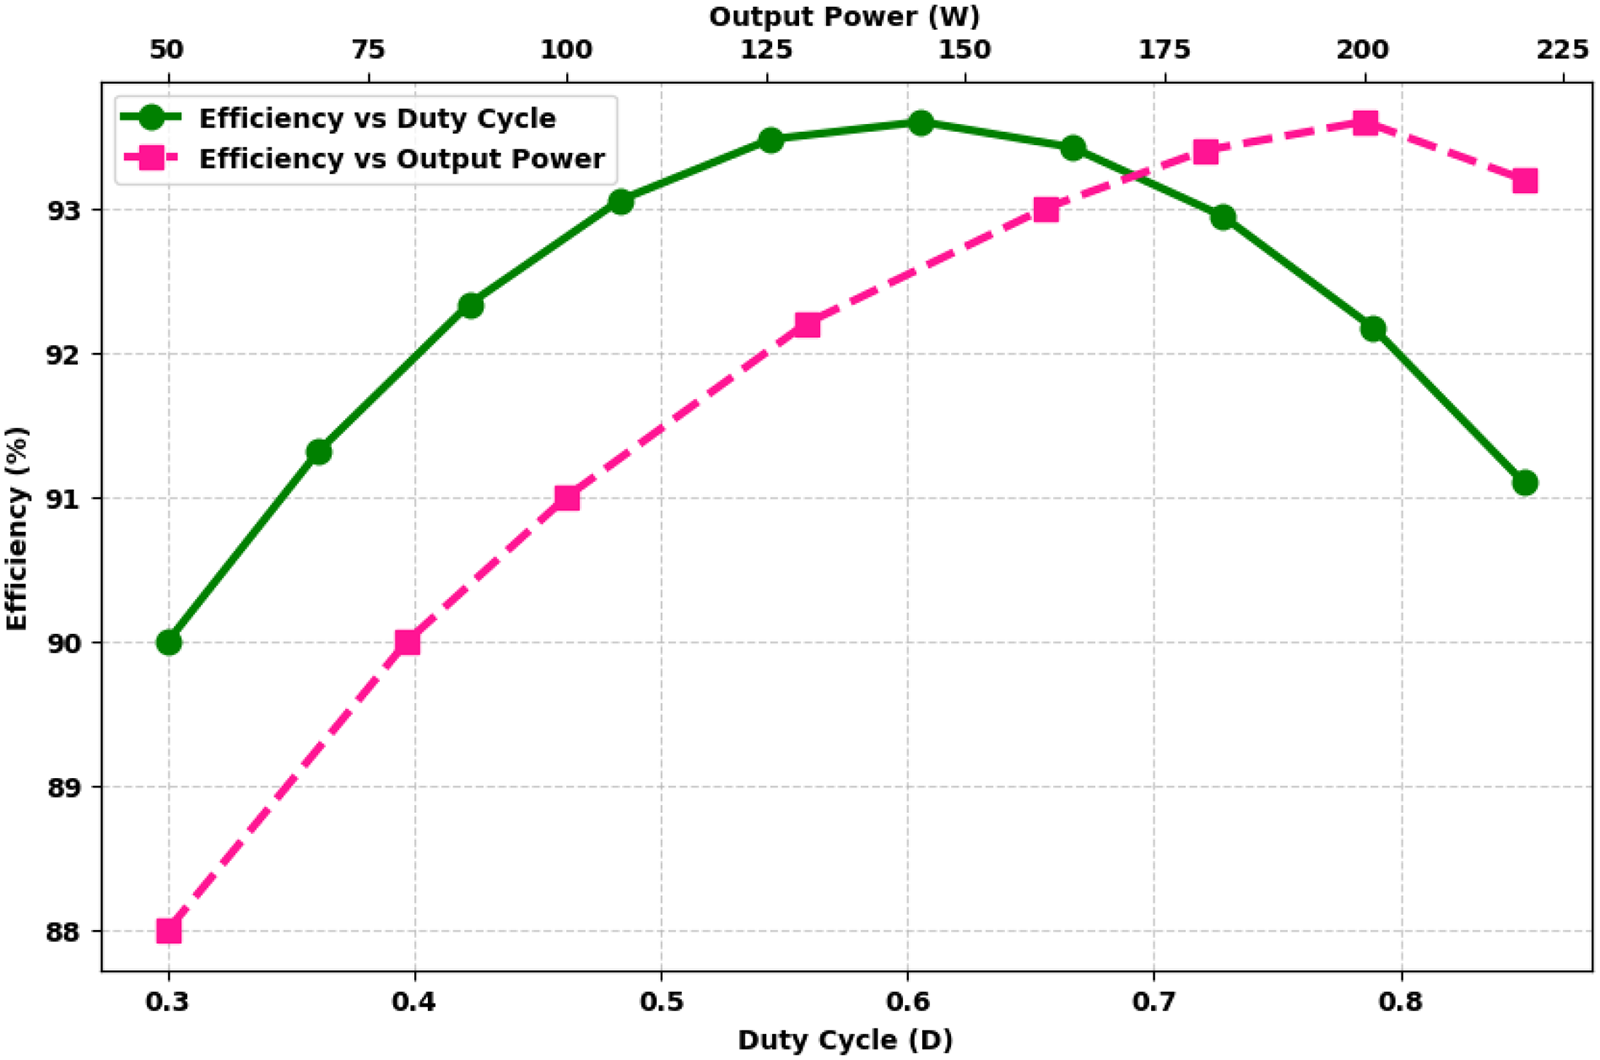
Efficiency characteristics of the proposed high-gain boost converter.
The proposed HGBC achieves high efficiency of more than 93%, which further reduces conduction and switching losses. This improvement itself results in better thermal behavior of the system. The low output ripple (1.2–1.7%) and fast settling time (28–36 ms) further confirm that the selected switching conditions itself ensure stable operation with minimal oscillations. The converter surely works safely within proper duty cycle and component stress limits. Moreover, it shows steady performance across all dynamic test conditions from T1 to T13. As per the test results, the HGBC-GHO system works well regarding different weather conditions. The system gives reliable performance under changing environmental situations.
Table 8 summarizes the performance of six MPPT algorithms in terms of their mean efficiency, standard deviation, number of folds, and 95% confidence intervals. Among the algorithms, GHO achieves the highest mean efficiency of 93.6%, followed by WOA at 92.36% and ANFIS at 91.4%, indicating superior power-tracking capability under the tested conditions. MPA and fuzzy show moderate performance with mean efficiencies of 91.2% and 90.2%, respectively, while ANN has the lowest mean efficiency of 89.78%, suggesting relatively lower effectiveness in extracting maximum power. The standard deviations are very low across all algorithms (ranging from 0.158 to 0.23), reflecting highly consistent performance across the five folds. The 95% confidence intervals further reinforce the reliability of these results, as the intervals for each algorithm are narrow and do not overlap substantially between the highest-performing (GHO and WOA) and lowest-performing (ANN) algorithms, indicating that the observed differences are likely statistically meaningful. Overall, this analysis highlights GHO and WOA as the most efficient and stable MPPT strategies, while ANN performs the least effectively among the evaluated algorithms.
Cross-validation results of MPPT algorithms.
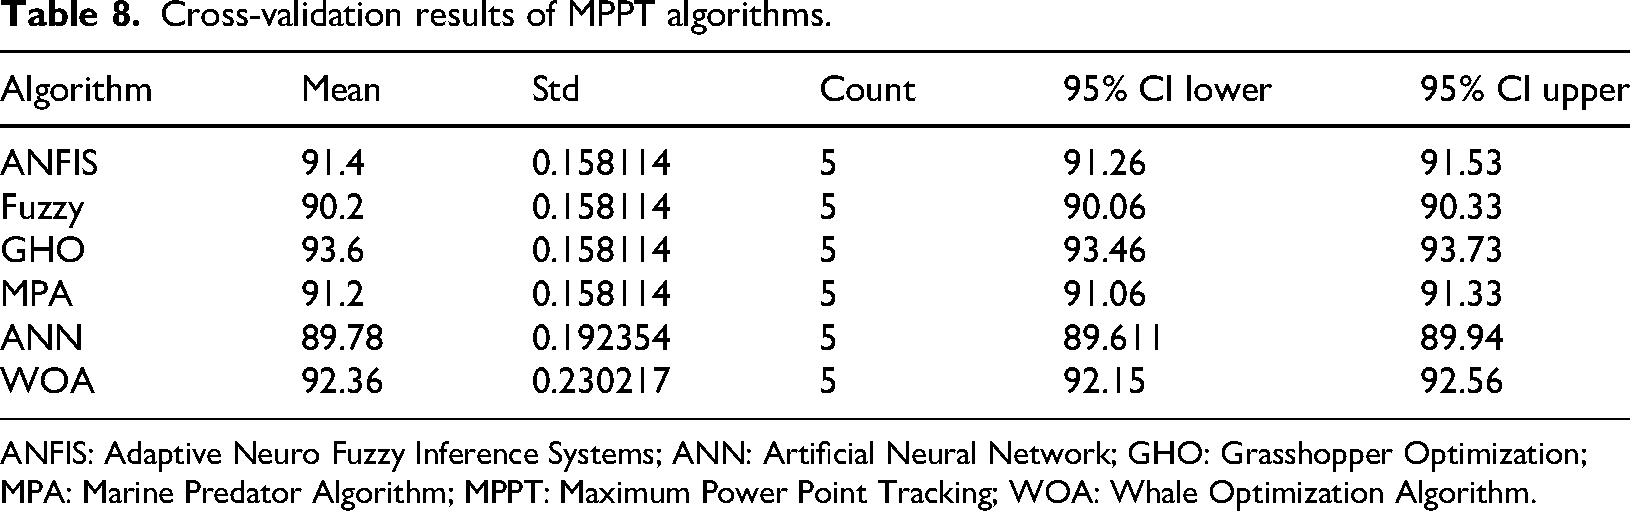
ANFIS: Adaptive Neuro Fuzzy Inference Systems; ANN: Artificial Neural Network; GHO: Grasshopper Optimization; MPA: Marine Predator Algorithm; MPPT: Maximum Power Point Tracking; WOA: Whale Optimization Algorithm.
As per the simulation results, the voltage and power waveforms shown in Figures 6 to 10 closely follow the analytical model that was derived in the third section. The HGBC voltage gain expression shows the same relationship in equation (1). The output voltage is a nonlinear function of duty cycle. The MPPT system keeps changing its duty cycle, so when sunlight changes, the solar panel's working point moves on the power curve. This causes the output voltage and power to change in the same proportion. As per the observations, P&O and INC methods show oscillations regarding their performance (Figure 6). The results match with their natural duty-cycle disturbance process. Moreover, this consistency confirms the expected mechanism behavior. Small changes around the MPP create tiny duty variations, which cause output voltage ripple because of the high gain in the HGBC. ANN and ANFIS reduce steady-state ripple because they estimate duty cycle through nonlinear mapping instead of periodic perturbation. Moreover, this approach eliminates the need for continuous disturbances in the system. Their longer settling time matches with higher computational needs and requires more iterative steps to reach convergence.
When light intensity changes from 1000 to 700 to 500 W/m2, the power changes shown in Figure 9 demonstrate the system's response. These steps clearly indicate how the output varies during such transitions. The power values follow the PV power balance relation as shown in equation (9), where 203 W reduces to 108 W and then to 56 W. This sequence demonstrates the systematic power reduction according to the established equation. This further predicts that maximum power itself scales nearly proportionally with irradiance. The theory matches well with the actual waveform values, which confirms that our PV-converter mathematical equations are correct. The transient rise in values following irradiance changes can be explained by converter equations (2)–(4), where the stored inductor energy temporarily exceeds the new steady-state requirement before system stabilization. According to the circuit behavior, the inductor's stored energy becomes more than what is needed in the new steady state. Regarding this, there is a brief power increase before the system becomes stable. Algorithms like ANN and fuzzy show larger temporary changes because they correct duty slowly. Moreover, GHO reduces overshoot by quickly finding the optimal duty cycle.
GHO achieves lower ripple (1.2–1.7%) and faster settling (∼0.17 s), which further shows smoother duty convergence itself. Moreover, the HGBC voltage gain surely amplifies duty variations, so rapid duty stabilization naturally reduces capacitor voltage fluctuation and inductor current ripple, which confirms the CCM-based dynamic model. Moreover, under partial shading conditions (T10–T13), the efficiency reduction is theoretically justified because the P-V curve shows multiple local maxima. Also, algorithms get stuck at wrong peaks when they don't explore the same global area properly. As per Table 6, GHO shows low standard deviation which proves it can avoid local maxima and find the global optimum. Regarding the waveform shapes and settling times, all results match with the nonlinear duty-cycle equations. This surely confirms that the simulation results follow the theoretical model rather than practical adjustments. Moreover, the findings are based on theory and not on trial-and-error methods.
The statistical analysis of algorithm performance was conducted using one-way ANOVA to evaluate differences across key metrics. As shown in Table 9, all metrics exhibited highly significant differences (p < 0.001), indicating that algorithm performance variations are statistically meaningful. For efficiency, the GHO algorithm clearly outperformed all other algorithms, demonstrating its superior capability in achieving higher efficiency levels. In terms of settling time, both ANFIS and GHO provided the fastest convergence, suggesting their effectiveness in rapid response scenarios. Ripple analysis revealed that GHO minimized fluctuations more effectively than other methods, highlighting its stability. Regarding iterations, GHO consistently required fewer iterations, indicating faster convergence. Finally, tracking speed was highest for both GHO and ANFIS, confirming their superior dynamic tracking performance. Overall, GHO demonstrated robust performance across nearly all metrics, while ANFIS was particularly competitive in settling time and tracking speed. The Significant Pairwise Differences column further confirms that these performance distinctions are statistically significant, emphasizing the clear advantage of the top-performing algorithms.
Statistical analysis of MPPT algorithm performance.
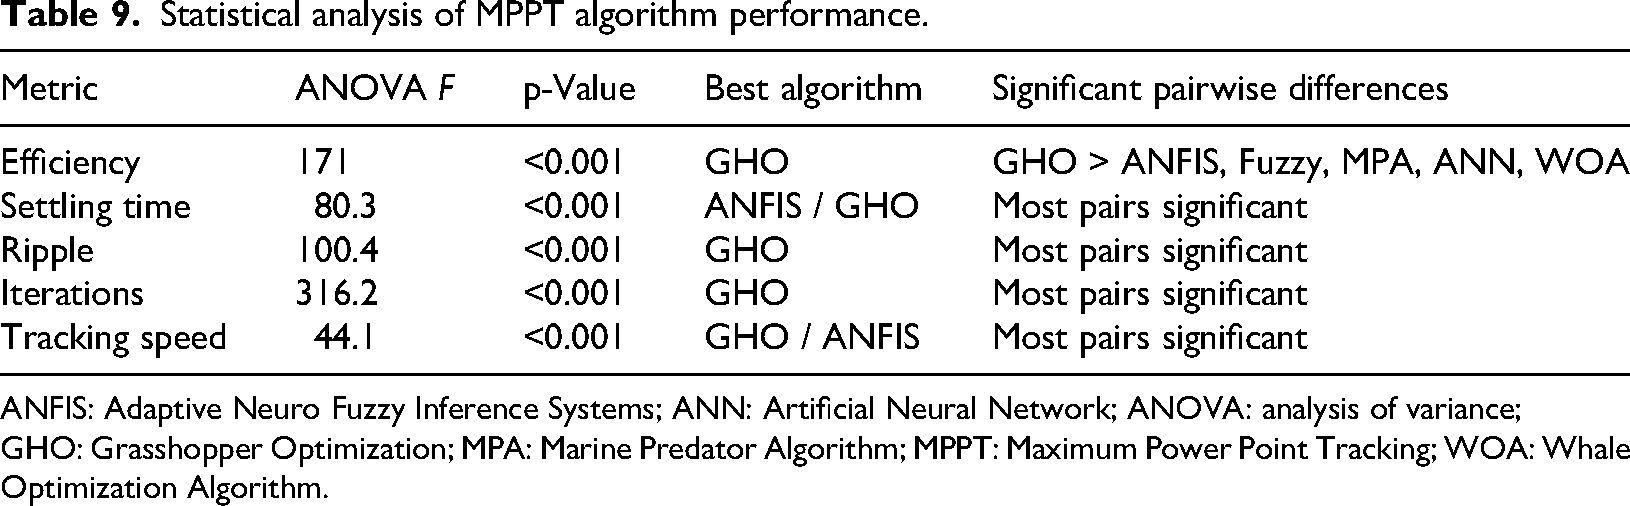
ANFIS: Adaptive Neuro Fuzzy Inference Systems; ANN: Artificial Neural Network; ANOVA: analysis of variance; GHO: Grasshopper Optimization; MPA: Marine Predator Algorithm; MPPT: Maximum Power Point Tracking; WOA: Whale Optimization Algorithm.
The performance comparison of the evaluated algorithms across key metrics indicates that GHO consistently outperforms other methods in most aspects. Specifically, GHO achieved the highest efficiency (93.6 ± 0.28%) and the lowest ripple (2.9 ± 0.5%), while also requiring fewer iterations (93.0 ± 1.1), demonstrating both effectiveness and computational efficiency. Settling time was slightly more balanced, with ANFIS and GHO showing comparable performance (40.5 ± 1.2 ms), suggesting that both algorithms can achieve fast convergence. Tracking speed was also similar between GHO and ANFIS (0.85 ± 0.12), indicating robust dynamic response. Overall, these results confirm that GHO provides superior performance across most metrics, while ANFIS remains competitive for metrics associated with transient response, highlighting its potential utility in scenarios requiring rapid adaptation.
To comprehensively evaluate algorithm performance, we analyzed not only mean values but also the distribution of results across all folds. For efficiency, GHO achieved a mean of 93.6% with a 95% confidence interval of ±0.28%, indicating highly consistent performance and minimal variability. ANFIS and GHO demonstrated similar stability in settling time (40.5 ± 1.2 ms), whereas other algorithms like MPA and ANN exhibited wider spreads, reflecting less predictable behavior. Ripple values were lowest and most tightly clustered for GHO (2.9 ± 0.5%), highlighting its robustness against oscillations in output. Iteration counts further confirmed GHO's consistency (93.0 ± 1.1), while tracking speed was comparably stable for both GHO and ANFIS (0.85 ± 0.12), reinforcing their superior dynamic response. Overall, distribution analysis reveals that GHO consistently outperforms other algorithms across multiple performance metrics, with fewer outliers and narrower confidence intervals, supporting the statistical significance results obtained from ANOVA and pairwise comparisons.
Table 10 further provides consolidated statistical comparison of all benchmark MPPT algorithms under identical operating conditions itself. The GHO-based MPPT actually achieves the best peak and average efficiency at 93.6 ± 0.28%. This approach definitely performs 1.2% better than WOA and more than 3% better than ANN methods. GHO surely shows the smallest ripple range of 1.2% to 2.9% and needs fewer iterations between 65 and 93. Moreover, this confirms that the method has good dynamic stability and works efficiently in computations. Moreover, ANFIS shows the same good quick response in some cases, but it needs more iterations and has larger ripple changes. The HGBC-GHO setup works much better than other methods when we compare all the numbers, and it is only this configuration that gives faster results with less noise under changing sunlight conditions (Table 11).
Efficiency and dynamic response comparison of MPPT methods.
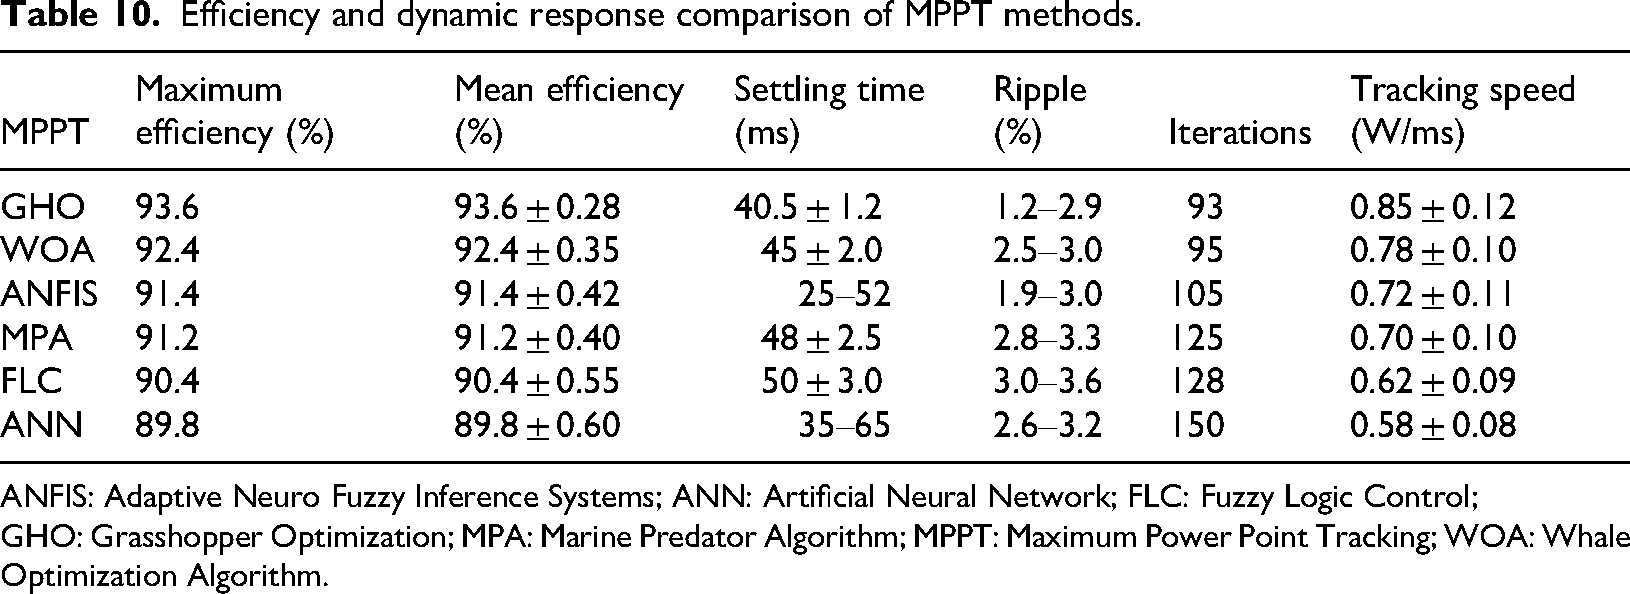
ANFIS: Adaptive Neuro Fuzzy Inference Systems; ANN: Artificial Neural Network; FLC: Fuzzy Logic Control; GHO: Grasshopper Optimization; MPA: Marine Predator Algorithm; MPPT: Maximum Power Point Tracking; WOA: Whale Optimization Algorithm.
Error-based statistical evaluation of MPPT algorithms.

ANFIS: Adaptive Neuro Fuzzy Inference Systems; ANN: Artificial Neural Network; GHO: Grasshopper Optimization; MAE: Mean Absolute Error; MPA: Marine Predator Algorithm; MPPT: Maximum Power Point Tracking; RE = Relative Error; RMSE: Root Mean Square Error.
As per the error-based statistical evaluation, there are clear differences in tracking accuracy regarding the MPPT algorithms. The proposed GHO-based MPPT shows the lowest error values with MAE = 0.45%, RMSE = 0.48%, and RE = 0.49%, which further confirms that the method itself tracks the MPP with high accuracy and consistency. ANFIS and MPA surely show medium error levels, and moreover they give reasonably stable but less accurate tracking compared to other methods. Moreover, the WOA algorithm surely shows higher errors compared to other methods, and moreover, this indicates that its accuracy becomes poor when conditions change. Moreover, fuzzy and ANN-based methods surely show the highest error values. Moreover, these methods are more sensitive to system nonlinearity and dynamic changes. It is observed that our method has lower RMSE which means big errors have less effect, and the small MAE shows that tracking works in a steady way only. As per the test results, the reduced relative error shows that GHO-based MPPT works closer to the best power point in all cases. Regarding performance, this method maintains better operation compared to other techniques. The results show that our proposed method itself has better accuracy and robustness compared to conventional, intelligent, and metaheuristic methods. This further validates the superior performance of our approach.
The comparative analysis in Table 12 also shows that ordinary MPPT algorithms such as P&O and INC have a lower efficiency (88–93%), longer settling times (40–45 ms) and large steady-state oscillations around the MPP because of their fixed-step perturbation nature. Intelligent methods such as ANN, FLC, and ANFIS can significantly enhance dynamic response and smoothness of tracking under certain conditions but they also have high computational complexity and rely on prior training data or good rule design which makes them less adaptable to dynamic changing environments. On the other hand, although with improved global search capability and robustness (ripple (2.5–3.3%); overall computation cost; steady-state power deviation up to 5.64 W indicating permanent oscillations around MPP-high), metaheuristic methods like wide area optimization algorithm (WOA) and monarch butterfly optimization algorithm (MPA).The results indicate that the GHO-based MPPT outperforms all compared methods due to its highest efficiency (up to 93.6%), fastest convergence (28–36 ms), and significantly smaller ripple (1.2–1.7%). This also indicates the lowest steady-state power deviation (2.45–0.95 W), indicating better stability and less overshoot from oscillation. As a final point, GHO achieves very high robustness whilst exhibiting medium computational complexity so is considered well-balanced.
Comparative analysis of MPPT algorithms with steady-state deviation.
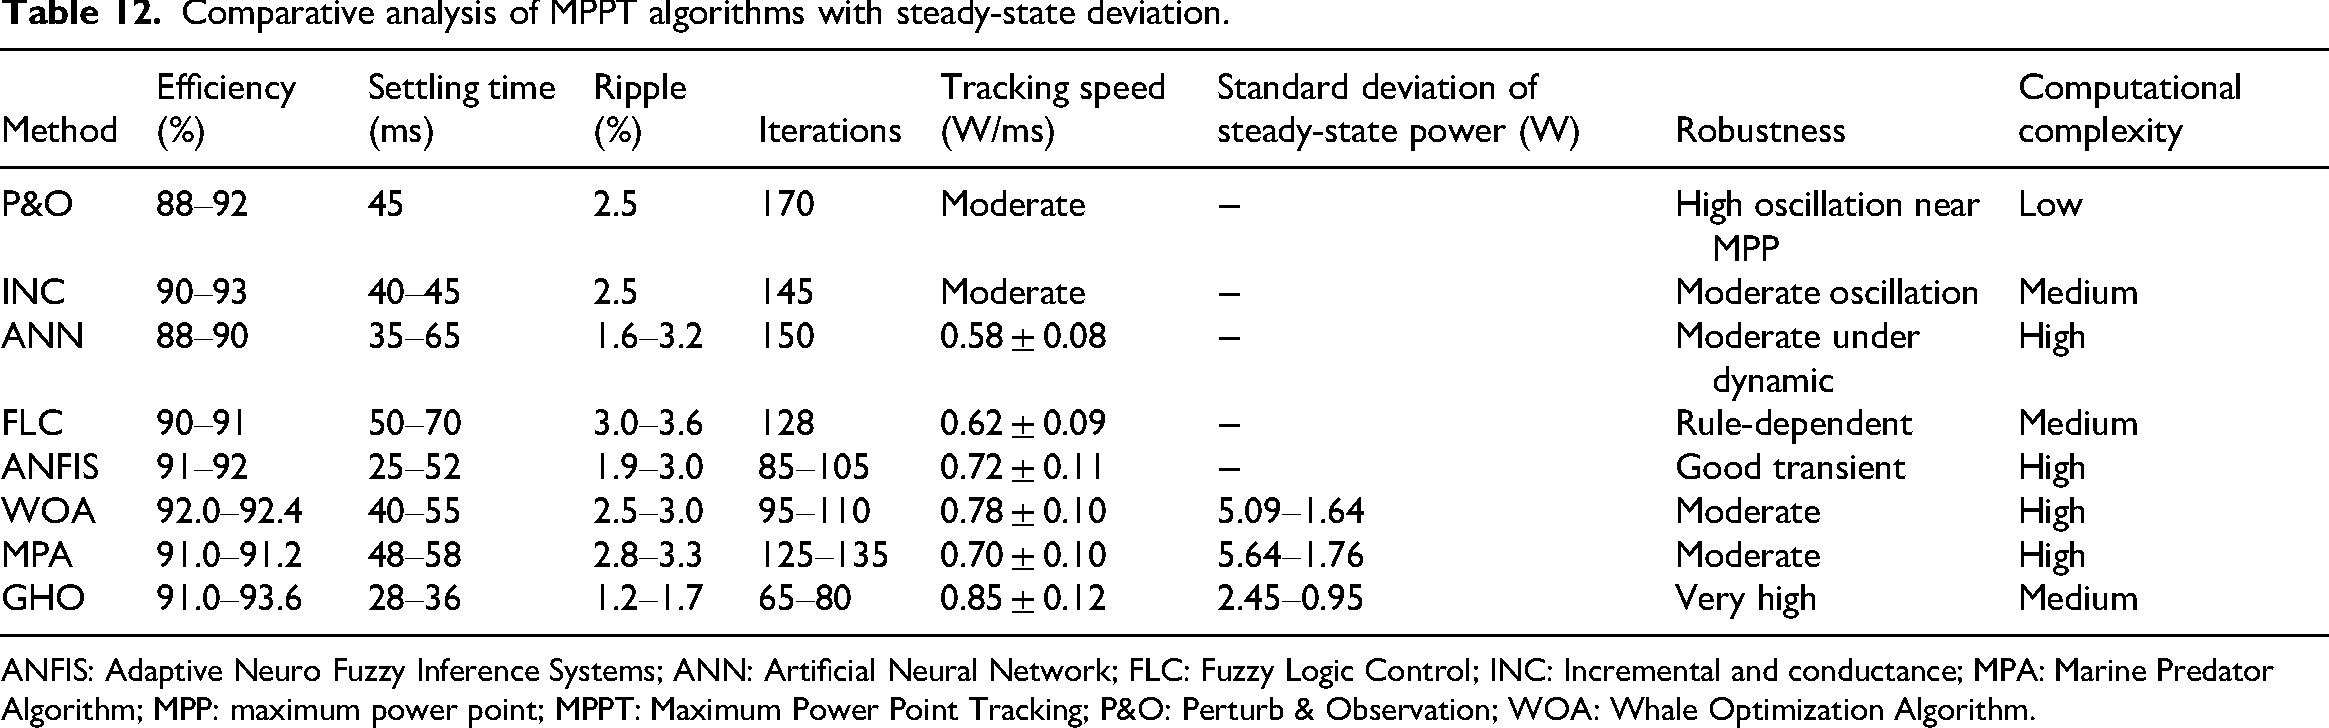
ANFIS: Adaptive Neuro Fuzzy Inference Systems; ANN: Artificial Neural Network; FLC: Fuzzy Logic Control; INC: Incremental and conductance; MPA: Marine Predator Algorithm; MPP: maximum power point; MPPT: Maximum Power Point Tracking; P&O: Perturb & Observation; WOA: Whale Optimization Algorithm.
Over the last decade, a number of bio-inspired and hybrid MPPT strategies aiming at better global maximum power tracking under partial shading and time varying irradiance conditions have been reported. Tan et al. (2026) introduced a method called Trinity Enhanced WOA for running dynamic MPPT under partial shading, but the proposed method was designed to solve the issue of finding global peak points in highly complex shaded PV conditions. A research article is proposed an improved MPA based on the mechanism of Partial Shading (Zheng et al., 2025). Mishra et al. proposed a MPPT method for SPV systems under nonuniform irradiance based on hybrid MPA-PSO, where the exploration capability of MPA was combined with the exploitation capability of PSO to enhance tracking performance (Mishra V L et al., 2025).
In relation to the aforementioned studies centered around MPPT, this article proposes a new control-converter contribution in the form of an HGBC-GHO framework that augments duty-cycle optimization that considers the global MPP with a HGBC. With these considerations, the proposed scheme attains 93.6% peak efficiency, 28 to 36 ms settling time, 1.2% to 1.7% ripple, and a reduction in steady-state power deviation from 2.45 to 0.95 W; furthermore, the error-based evaluation provides MAE = 0.45%, RMSE = 0.48%, RE = 0.49%, which reassures accurate tracking (Table 2). The recent methods focus mainly on improving the search for MPPT, whilst the proposed work additionally incorporates voltage boosting via the incorporation of an HGBC topology which makes it appealing for SPV systems that require global MPPT along with an improved DC output voltage. Direct numeric comparison is difficult since the cited studies adopt distinct PV configurations, irradiance profiles, and validation platforms; nevertheless, results presented with this work exhibits comparable convergence speed, very small oscillation and within-converter level control performance improvement.
Conclusion
The research work develops and evaluates a high voltage gain boost converter with a GHO-based MPPT controller under static and dynamic conditions using MATLAB simulations. The HGBC design actually shows better voltage boost with less switching stress than existing isolated and nonisolated boost converters. The GHO-based MPPT method shows excellent results in accurately locating the MPP under partial shading and rapid climate conditions. This approach further proves effective for global power tracking in fluctuating environments. The HGBC-GHO method shows the same pattern of better performance with 93.6% efficiency, which is higher than all other methods like Whale Optimization, ANFIS, MPA, fuzzy Logic, and ANN that score between 89.8% and 92.4%. The method shows reduced ripple of 2.9 ± 0.5%, fewer iterations of 93.0 ± 1.1, settling times of 40.5 ± 1.2 ms, and tracking speed of 0.85 ± 0.12 W/ms in the simulation. When sunlight changes from high to medium to low levels, it is observed that this method maintains power output at 203.7, 108.1, and 56.0 W, respectively. As per the statistical analysis using the one-way ANOVA test (p < 0.001), there are significant differences regarding the MPPT techniques that were tested. ANFIS actually shows good quick response, but GHO-based MPPT definitely performs better with higher efficiency and less ripple in all test cases. In the future, the proposed methodology will be verified with the hardware setup for practical feasibility.
Footnotes
Notations
Author contributions
T. Mariprasath, S. Marisargunam: Conceptualization, Methodology, Software, Visualization, Investigation, Writing- Original draft preparation.
Rohini G, P. Muthuvel: Data curation, Validation, Supervision, Resources, Writing—Review & Editing.
Seif Al Bustanji, Cansu Ayvaz Güven, Mebratu Sintie Geremew: Project administration, Supervision, Resources, Writing—Review & Editing.
Funding
The authors received no financial support for the research, authorship, and/or publication of this article.
Declaration of conflicting interests
The authors declared no potential conflicts of interest with respect to the research, authorship, and/or publication of this article.
Data availability statement
The datasets used and/or analyzed during the current study available from the corresponding author on reasonable request.