
Abstract
Global efforts to curb carbon emissions have produced a paradox: across the G7 economies, renewable energy has grown at 5.4% per annum and CO2 has declined at 2.0%, yet the aggregate Ecological Footprint (EF) has contracted only 1.1% per annum. This article argues that the aggregate masks two opposing channels. Using a G7 balanced panel (1975–2024; N = 7, T = 50; 350 country-year observations) from the Global Footprint Network and the Energy Institute Statistical Review, we decompose Total EF into Carbon EF and Land EF and estimate the ecological elasticities of GDP, fossil fuels, nuclear, and renewables using Common Correlated Effects fixed-effects, Method of Moments Quantile Regression, and Dumitrescu–Hurlin panel Granger causality tests. Three findings emerge. First, renewable energy significantly reduces Carbon EF (−0.308, p < .01) but has no detectable effect on Land EF (0.037, p = .506): the decarbonization benefit does not translate into land-use relief. Second, nuclear energy operates primarily through the land channel (Land EF elasticity 0.078 vs Carbon EF 0.028), reflecting the physical footprint of siting, fuel cycles, and exclusion zones. Third, GDP exerts a larger pressure on Land EF (0.423) than on Carbon EF (0.184). Dumitrescu–Hurlin tests confirm unidirectional causality from each driver to EF, with bidirectional feedback only for nuclear. The results support a “two channels, two instruments” policy logic: decarbonization tools alone cannot close the biocapacity gap, and land-channel instruments must complement carbon pricing.
Keywords
Introduction
The “clean” energy paradox
Carbon-centric metrics have dominated energy transition assessments, yet they exclude soil depletion, deforestation, and biodiversity loss (Razzaq et al., 2022; Wackernagel and Rees, 1996). The Ecological Footprint (EF) framework aggregates six biophysical categories into a unified measure in global hectares (Global Footprint Network, 2025). We decompose Total EF into Land EF (cropland, grazing, forest, fishing, built-up) and Carbon EF (biocapacity required to sequester fossil-CO2). As Table 1 documents, G7 renewable energy has grown at +5.4% (five-year CAGR) while CO2 declined at −2.0%, yet Total EF contracted at only −1.1% per annum–a triangulation that motivates decomposition.
G7 energy-ecological profile and growth rates (2024).
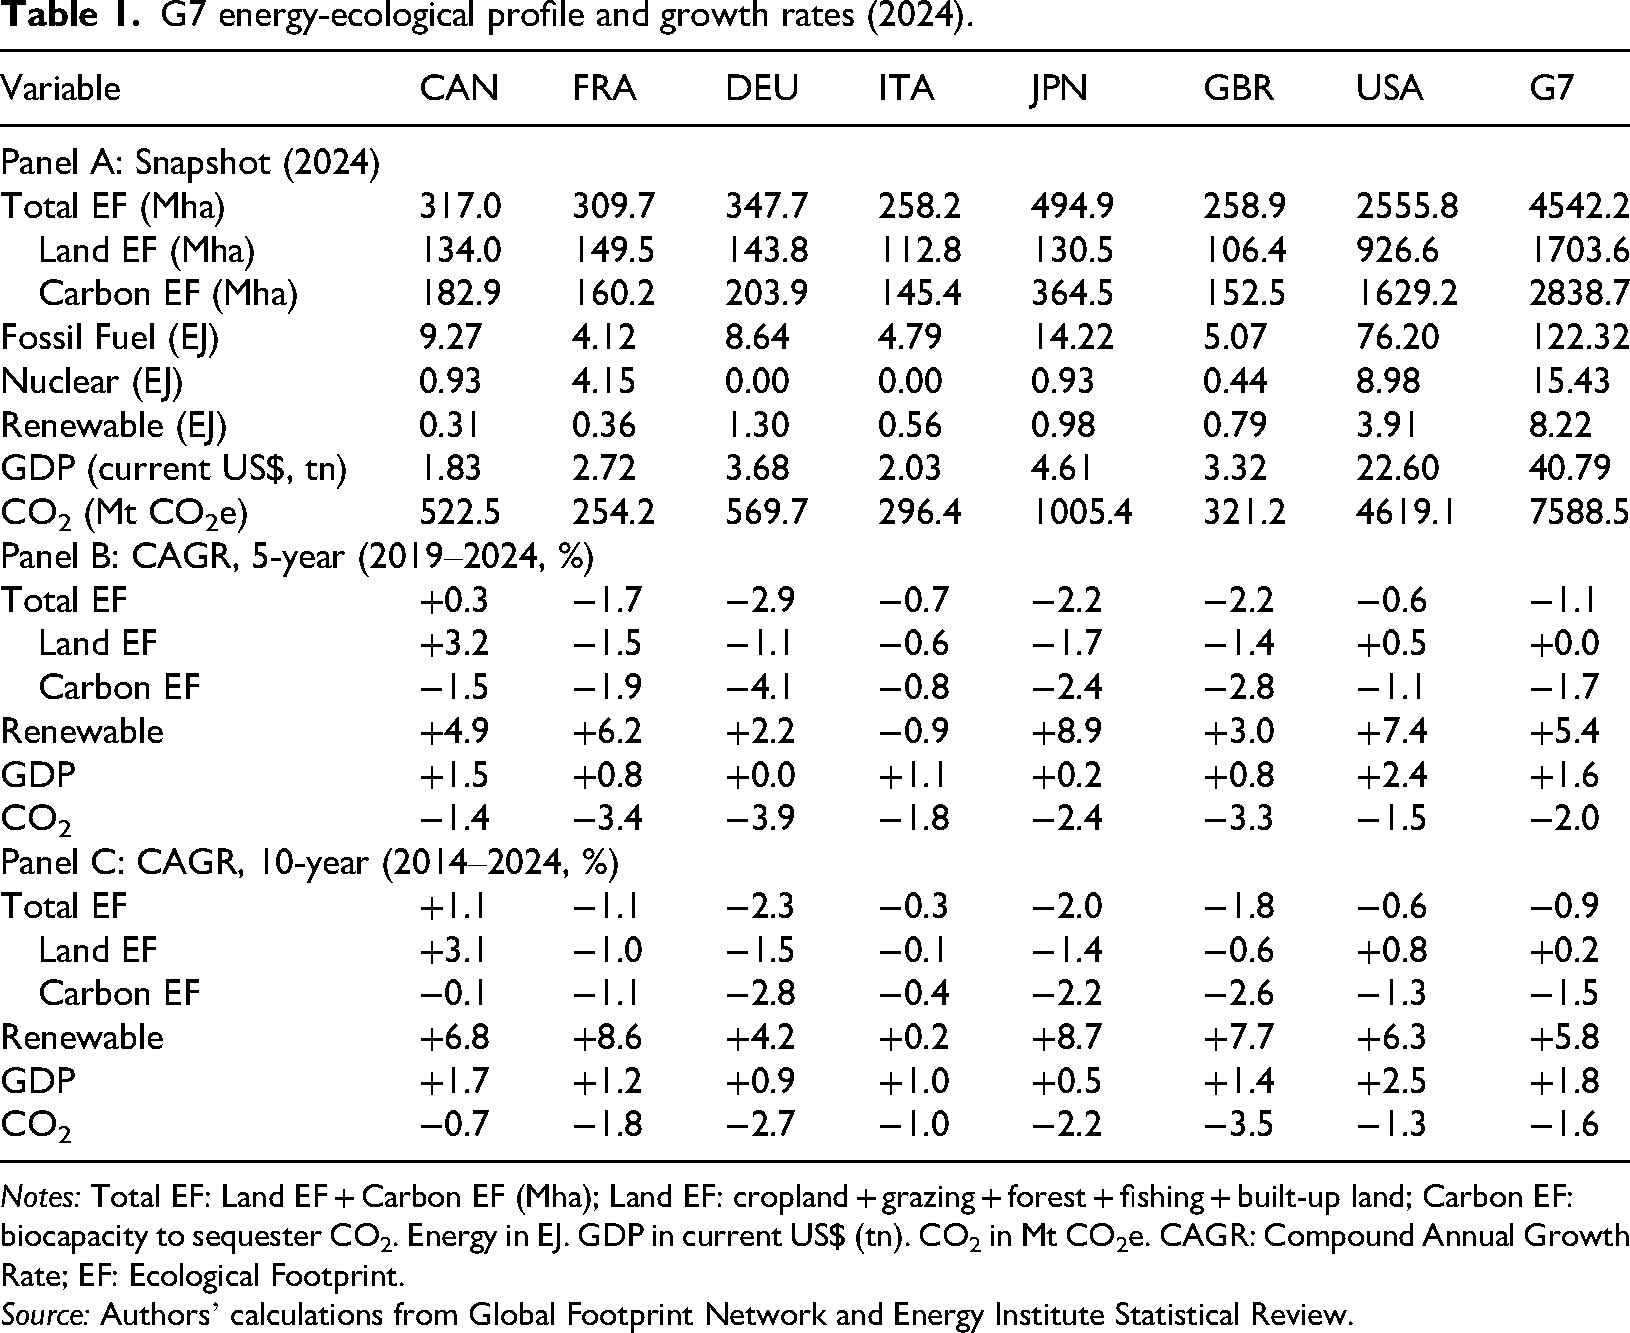
Notes: Total EF: Land EF + Carbon EF (Mha); Land EF: cropland + grazing + forest + fishing + built-up land; Carbon EF: biocapacity to sequester CO2. Energy in EJ. GDP in current US$ (tn). CO2 in Mt CO2e. CAGR: Compound Annual Growth Rate; EF: Ecological Footprint.
Source: Authors’ calculations from Global Footprint Network and Energy Institute Statistical Review.
The decomposition in Table 1 exposes why. Carbon EF has declined across all G7 nations (five-year CAGR: −0.8% in Italy to −4.1% in Germany), but Land EF moves in the opposite direction: Canada grew at +3.2% per annum, the USA at +0.5%, and the G7 aggregate is stagnant or rising (+0.0% to +0.2%). Carbon EF accounts for 52–74% of Total EF and correlates strongly with CO2 (r = 0.93–0.95 in Canada, Germany, USA), yet Total EF–CO2 correlations are systematically weaker (r = 0.78 in Canada, 0.65 in Japan, ≈0.00 in France; Supplemental Table S2). Carbon-channel gains are being offset by rising land pressure invisible to CO2-centric evaluation.
This asymmetry constitutes what we term the “clean energy paradox.” The prevailing fossil/nonfossil dichotomy assumes monotonic environmental benefits (Onwe et al., 2023), yet nonfossil sources exhibit nonlinear, context-dependent outcomes (Bandyopadhyay et al., 2022; Fotis and Polemis, 2018). The transition may be solving the atmospheric problem while creating new land pressures through solar farms, wind corridors, biomass, and nuclear exclusion zones. Prior studies (Atasever, 2025; Li et al., 2025; Maftoon et al., 2025; Miyan et al., 2025) model Total EF (TEF) as an undifferentiated aggregate: when they report renewable mitigation of TEF, it is unclear whether the effect operates through the carbon channel, the land channel, or both.
Research objectives
This study pursues four objectives. First, to decompose Total EF into Carbon and Land components and test whether energy mix variables affect each dimension differentially. Second, to quantify how nuclear energy affects ecological integrity through distinct channels, specifically whether its costs manifest primarily through land occupation rather than atmospheric emissions. Third, to map how energy–footprint elasticities evolve across the full distribution of ecological pressure, identifying whether GDP-driven land degradation intensifies at higher quantiles. Fourth, to derive normative policy implications by integrating the decomposition evidence with land-use planning considerations, assessing whether separate instruments are needed for separate ecological channels.
Empirical strategy
We employ a G7 balanced panel spanning 1975–2024 (N = 7, T = 50, Total Obs. = 350) from the Global Footprint Network and Energy Institute Statistical Review. Conventional mean-based fixed-effects estimators are structurally inadequate for this macro-panel, so we employ Method of Moments Quantile Regression (MMQR) (Machado and Santos Silva, 2019) augmented with Common Correlated Effects (CCE) (Pesaran, 2006). CCE controls for unobserved cross-sectional dependence (CSD) by augmenting with cross-sectional averages, which absorb systemic shocks (oil price movements, climate treaties, technology spillovers). MMQR captures distributional heterogeneity, revealing whether energy policies maintain efficacy across severities of ecological pressure. We complement this with Dumitrescu–Hurlin Granger causality tests for causal identification.
Contributions
Our contributions are threefold. First, we decompose Total EF into Carbon and Land Footprint as separate dependent variables, revealing that the nexus is two stories: renewable energy operates almost exclusively through the carbon channel, while GDP and nuclear energy exert primary pressure through the land channel. Second, we document the “spatial constraint” of energy transition: GDP's Land EF impact substantially exceeds its Carbon EF impact, and nuclear energy imposes significant land pressure despite near-zero CO2. Third, we demonstrate that energy policy must be integrated with land-use planning; without addressing the spatial footprint of energy infrastructure, carbon-channel gains will continue to be offset by rising land pressure. The remainder proceeds as follows. The literature review section reviews the literature; the methods section describes data and methodology; the results section reports results organized around the Carbon EF versus Land EF contrast; the discussion section discusses implications and concludes.
Literature review
The substitution effect and the clean energy paradox
Recent econometric literature pivots from carbon-only models toward holistic metrics like the TEF, correcting the analytical myopia that fails to capture biocapacity overshoot. Bandyopadhyay et al. (2022) deploy Quantile-on-Quantile Regression (QQR) to show that nuclear energy's ecological elasticities exhibit extreme distributional heterogeneity across France, Germany, and Canada, consistent with nuclear mitigation being nonlinear and context-dependent. Wang et al. (2020) use Dynamic Seemingly Unrelated Regression to confirm that biomass energy intended as a green substitute actually increases the G7's EF due to land-use conversion. This provides theoretical precedent for our hypothesis: the environmental costs of nonfossil energy transitions may not manifest in the atmosphere, but rather physically on the land.
Challenging the assumption of universal green dividends, Raghutla et al. (2022) provide empirical evidence that renewable energy consumption paradoxically increases the EF across higher quantiles of degradation in emerging economies, proving that clean energy deployment is not inherently benign. Further supporting this distributional heterogeneity within advanced economies, Onwe et al. (2023) highlight that environmental taxes and renewable infrastructure operate with varying ecological elasticities depending on a nation's existing biocapacity deficit severity. These findings collectively establish that the substitution of fossil fuels (FFs) with nonfossil alternatives does not yield monotonic ecological improvement, but rather generates asymmetric and context-dependent effects that conventional mean-based estimators fail to capture.
The scale and rebound effects
When exploring the intersection of technological advancement and environmental policy, empirical data strongly supports that the “scale effect” and “rebound effect” frequently offset green dividends. Using MMQR, Atasever (2025) finds that baseline primary nonrenewable energy consumption remains the most substantial driver of ecological deterioration in the G7, creating a massive scale effect that swallows linear renewable energy deployment at extreme deficit quantiles.
Advancing the rebound effect argument, Maftoon et al. (2025) use System GMM to reveal that total factor productivity and general green technology innovation can exacerbate biocapacity overshoot in the short run, as efficiency gains stimulate increased aggregate production and resource use. Aydin et al. (2023) similarly confirm a causal relationship from multifactor productivity and economic growth to environmental pollution, reinforcing the endogenous scale effect across the G7. In a complementary middle-income setting, Radulescu et al. (2024), applying the same MMQR adopted here, find that green technology innovation and resource productivity raise renewable-energy uptake most strongly at the upper quantiles, underscoring that the effect of technology on clean-energy uptake is distributional rather than uniform.
Furthermore, Ramzan et al. (2023) note that the expansion of information and communication technology triggers a significant scale effect that increases the EF across conditional quantiles in the world's greenest economies.
This is compounded by the findings of Zhou and Fan (2025), who demonstrate that in carbon emission (COE) models, standalone financial depth outweighs the benefits of green innovation and acts as a barrier to emission reduction rather than mitigating it. Xia and Liu (2024) add that while financial technology (Fintech) can promote clean energy deployment, it can also intensify resource depletion if capital flows into carbon-intensive and resource-rich sectors. Ultimately, Razzaq et al. (2022) prove that natural resource rent intensification exhibits highly heterogeneous impacts, worsening the footprint in extreme quantiles without strict governance.
The policy dimension reinforces this complexity. Kartal et al. (2025a), using QQR and Granger Causality in Quantiles, report that environmental policy stringency is “completely helpful” in mitigating the footprint in the United States but “fully inefficient” in Japan, demonstrating that monolithic stringency cannot be uniformly applied. Kartal et al. (2025b), using a Kernel-Based Regularized Least Squares model, differentiate market-based (MBP) from nonmarket-based policies (NMBP): MBP significantly enhances environmental load capacity in Canada, France, Japan, and the United States, while NMBP is helpful only in France and the United States. Collectively, the policy toolkit extends beyond decarbonization, yet the literature has not examined whether these effects operate through the carbon channel, the land channel, or both.
Cross-border trade leakage and globalization
Rigid environmental policies in developed regions frequently trigger cross-border trade leakage, externalizing the ecological deficit. Ahmed et al. (2022), using CUP-FM, find that while domestic regulations reduce local degradation, trade globalization escalates the G7's overall ecological pressure through high-footprint imports. Javed et al. (2024), via Panel Quantile Regression, show that trade openness has significant positive elasticity with the footprint across all conditional quantiles–trade transfers rather than eliminating degradation. Yağlıkara and Tekiner (2025) conversely find that broader globalization reduces the G7 footprint, illustrating methodological sensitivity between sociopolitical globalization and trade-based leakage. Alola et al. (2023), using the Augmented Mean Group estimator, show that economic-freedom components including freedom to trade internationally increase the footprint, accounting for CSD. Relatedly, Cutcu et al. (2023), applying the same family of cross-sectionally augmented Dickey–Fuller (CADF/CIPS) tests and Dumitrescu–Hurlin causality to the 10 economies with the highest Climate Risk Index, find one-way causality running specifically from transportation-sector energy consumption to climate risk, illustrating both the cross-sectional-dependence concern central to our identification strategy and the value of disaggregating energy use rather than treating it as a single aggregate.
This leakage mechanism has a direct implication for national-level TEF regressions. If carbon-intensive production is relocated rather than eliminated, the observed coefficient on renewable energy may understate the true mitigation effect domestically, while the aggregate G7 ecological deficit remains unchanged or worsens. The trade leakage channel therefore adds a spatial dimension to the measurement problem: not only does TEF conflate carbon and land effects within a country, but cross-border trade may redistribute these effects across countries in ways that national-level panel estimates cannot capture.
The decomposition gap
The foregoing review suggests a productive but structurally incomplete literature. The substitution effect and the clean energy paradox section shows that the substitution of FFs with nonfossil alternatives yields asymmetric and nonlinear ecological effects, with Wang et al. (2020) demonstrating that biomass energy increases the footprint through land-channel destruction and Bandyopadhyay et al. (2022) documenting extreme distributional heterogeneity in nuclear elasticities. The scale and rebound effects section indicates that scale and rebound effects systematically offset green dividends, with the policy response itself exhibiting severe cross-country heterogeneity (Kartal et al., 2025a). The cross-border trade leakage and globalization section adds a spatial dimension, showing that trade leakage externalizes ecological deficits across borders.
However, a common methodological feature unites all of these contributions: they model TEF as an undifferentiated aggregate. No study to date has decomposed TEF into its carbon and land components to examine whether energy policy affects both ecological dimensions or operates exclusively through the carbon channel. This decomposition gap produces three analytical consequences.
First, when the existing literature reports that renewable energy “mitigates TEF,” it remains unclear whether the effect reflects genuine multidimensional ecological improvement or solely a reduction in Carbon EF that happens to dominate the aggregate (constituting 52–74% across G7 nations). Second, the ambiguous findings on nuclear energy cannot be resolved without separating the carbon and land channels: an aggregate TEF coefficient may mask divergent impacts across the carbon and land dimensions that only become visible through decomposition. Third, policy recommendations drawn from TEF-based estimates may be misleading if they attribute ecological benefits to energy interventions that, in reality, leave land-based pressures entirely unaffected.
The present study addresses this gap directly. To our knowledge, it is the first to decompose the G7 EF into Carbon EF and Land EF as separate dependent variables and to examine the energy–environment nexus through both channels simultaneously, employing CCE-augmented fixed effects and MMQR. The research objectives that motivate this decomposition are formally stated in the research objectives section of the introduction.
Methods
Theoretical framework
This study adopts the Stochastic Impacts by Regression on Population, Affluence, and Technology (STIRPAT) framework originally proposed by Dietz and Rosa (1997). The STIRPAT model expresses environmental impact as a multiplicative function of population, affluence, and technology: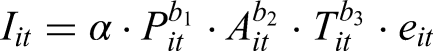
Linearizing via natural logarithms and incorporating the energy decomposition yields our augmented STIRPAT specification:
Data and variables
We construct a balanced panel of N = 7 G7 nations (Canada, France, Germany, Italy, Japan, United Kingdom, United States) over T = 50 years (1975–2024), yielding 350 country-year observations. EF data (Total EF, Carbon EF, and Land EF, in global hectares) are sourced from the Global Footprint Network. Energy variables (nuclear, renewable, and FFs consumption, in exajoules) are drawn from the Energy Institute Statistical Review of World Energy (Energy Institute, 2025). GDP in current US dollars is obtained from the World Bank World Development Indicators (World Bank, 2025).
Continuous positive variables (Total EF, Carbon EF, Land EF, GDP, FFs) enter in natural logarithms. Nuclear and renewable energy contain structural zeros (e.g. Italy and Germany report zero nuclear in recent years), rendering log undefined. Following Bellemare and Wichman (2020), we apply the IHS: asinh(x) = ln(x +
Variable definitions, transformations, and sources.
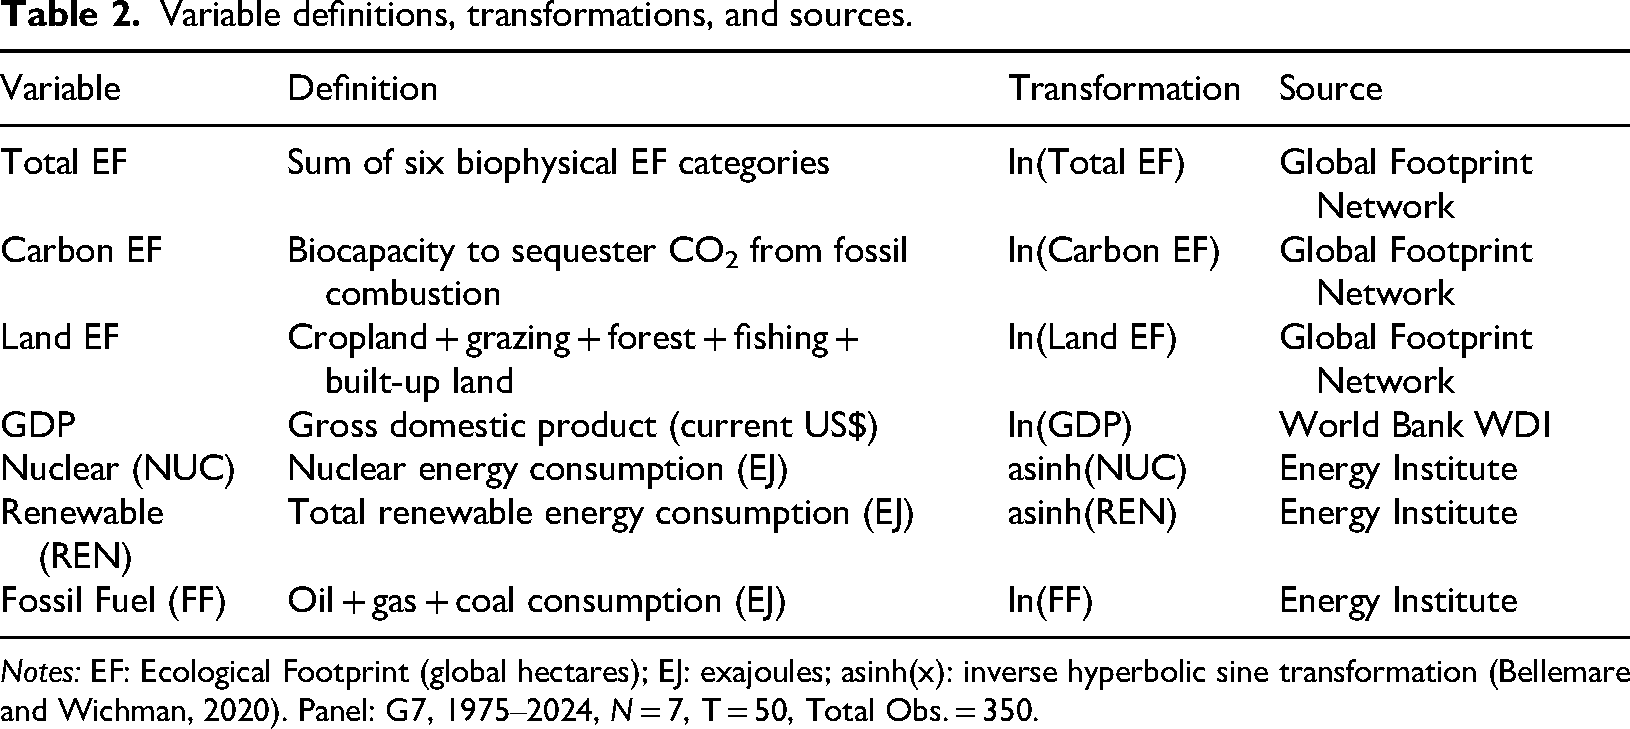
Notes: EF: Ecological Footprint (global hectares); EJ: exajoules; asinh(x): inverse hyperbolic sine transformation (Bellemare and Wichman, 2020). Panel: G7, 1975–2024, N = 7, T = 50, Total Obs. = 350.
Preestimation diagnostics
Table 3 summarizes the full empirical sequence, the role of each procedure, and the rationale for preferring it to conventional alternatives, given the CSD, parameter heterogeneity, and mixed integration orders that characterize the G7 panel. Each estimator is selected because the standard alternative relies on an assumption cross-sectional independence, slope homogeneity, or a single conditional mean that this dataset violates.
Empirical strategy: rationale for each test and estimator.

Notes: CSD: cross-sectional dependence; EF: ecological footprint; SE: standard errors; MMQR: Method of Moments Quantile Regression; CCE-FE: Common Correlated Effects Fixed Effects.
The sequence proceeds from diagnostics (Steps 1–3) to estimation (Steps 4–5) and causal inference (Step 6).
Three diagnostic procedures are conducted prior to the main estimation. First, we test for CSD using the Pesaran (2004) CD statistic. The G7 economies are highly integrated, jointly exposed to global oil price shocks, international climate agreements, and green technology spillovers. If CSD is detected, conventional panel estimators produce biased standard errors and spurious inference, necessitating the CCE augmentation strategy described in the baseline estimation: CCE-augmented fixed effects section.
Second, we determine the order of integration using the second-generation panel unit root tests of Pesaran (2007). Because the G7 series exhibit strong CSD (pre-estimation diagnostics section), first-generation tests such as Levin–Lin–Chu and Im–Pesaran–Shin, which assume cross-sectional independence, suffer severe size distortion and spuriously reject the unit-root null; we therefore rely on the CADF regression, which augments the country-level ADF specification with the cross-sectional averages of the lagged level and first differences to filter out the common factor. The panel statistic, CIPS, is the cross-sectional average of the seven country-level CADF statistics. We estimate the tests under both a constant and a constant-plus-trend specification and test all series in first differences, classifying each variable as I(0) or I(1). This second-generation procedure is the appropriate stationarity test for a panel of highly integrated economies and is the direct complement to the CCE estimator, which relies on the same cross-sectional-averaging logic to absorb common factors.
Third, we assess long-run equilibrium relationships using the Westerlund (2007) error-correction cointegration test, which accommodates both CSD and heterogeneous adjustment speeds across countries. Bootstrap-robust p-values (1000 replications) correct for the small cross-sectional dimension. Given the well-documented conservatism of bootstrap inference in small-N panels (N = 7), we do not condition our estimator choice on the cointegration outcome. Instead, we adopt an estimation framework whose consistency does not require long-run equilibrium.
This is a deliberate design choice. Kapetanios et al. (2011) demonstrate that the CCE estimator remains consistent whether the common factors are I(0) or I(1), because the cross-sectional averages used as factor proxies absorb nonstationary common components regardless of their integration order. The MMQR estimator, which builds on the within-group fixed-effects structure augmented with these same cross-sectional averages, inherits this robustness property. Our empirical strategy therefore relies on the CCE framework's inherent robustness to nonstationary unobserved factors rather than imposing a cointegration requirement that small-N bootstrap tests cannot reliably adjudicate.
Panel unit root testing
Because the CD tests (preestimation diagnostics section) confirm strong CSD, first-generation panel unit root tests (Levin–Lin–Chu, Im–Pesaran–Shin) are inappropriate: they assume cross-sectional independence and, when that assumption fails, suffer severe size distortion and spurious rejection of the unit-root null. We therefore employ the second-generation tests of Pesaran (2007). For each country we estimate the CADF regression, which augments the standard ADF specification with the cross-sectional averages of the lagged level and differences to filter out the common factor. The panel statistic, CIPS, is the simple average of the seven country-level CADF statistics. Tests are run with a constant and with a constant-plus-trend; lag length is selected to whiten residuals. Variables are classified I(0) or I(1) at levels, and all are tested in first differences. This is the appropriate stationarity test for a panel of highly integrated G7 economies, and it is the direct complement to the CCE estimator, which relies on the same cross-sectional-averaging logic to absorb common factors.
Baseline estimation: CCE-augmented fixed effects
Our baseline estimator is the CCE Fixed Effects (CCE-FE) model developed by Pesaran (2006). The CCE approach augments the standard within-group regression with cross-sectional averages of the dependent and independent variables, which serve as proxies for the unobserved common factors generating CSD. The augmented specification takes the form:
A final note on asymptotic properties. The CCE estimator of Pesaran (2006) is consistent as both N and T grow large, whereas this panel has N = 7 and T = 50. Monte Carlo evidence (Kapetanios et al., 2011) indicates that CCE performs well under long-T with heterogeneous slopes, though small-N inference remains sensitive to individual-country influence. We therefore complement the main fixed-effects estimates with Driscoll–Kraay standard errors, the CCE-augmented MMQR specification (core analysis: CCE-augmented MMQR section), the Dumitrescu–Hurlin panel Granger tests (causal identification: Dumitrescu–Hurlin panel Granger causality section), and leave-one-country-out robustness checks (Supplemental Table S8). The reported coefficients should be read as conditional associations robust to plausible departures from the large-N ideal, rather than estimates whose asymptotic properties are guaranteed by the N = 7 G7 panel.
Core analysis: CCE-augmented MMQR
While the CCE-FE estimator provides consistent mean-based estimates, environmental impacts often vary across the distribution of ecological degradation. To capture this distributional heterogeneity, we implement the MMQR proposed by Machado and Santos Silva (2019). The MMQR model decomposes the conditional quantile function into location and scale components:
We augment the MMQR specification with cross-sectional averages following the CCE logic described in the baseline estimation: CCE-augmented fixed effects section, ensuring that the quantile estimates are purged of common unobserved factors. Standard errors are obtained via country-level cluster bootstrap (1000 replications), resampling entire country time series to preserve the within-country dependence structure. The model is estimated at five quantiles (τ = 0.10, 0.25, 0.50, 0.75, 0.90), spanning from low-footprint observations (relative ecological stability) to high-footprint observations (severe biocapacity overshoot).
Causal identification: Dumitrescu–Hurlin panel Granger causality
To assess the direction of causality between energy variables and EF, we employ the Dumitrescu and Hurlin (2012) heterogeneous panel Granger causality test. This test allows the causal coefficients to differ across countries, accommodating the cross-country heterogeneity documented in the literature review. Unidirectional causality from energy to EF supports the identifying assumption that energy mix composition drives ecological outcomes; bidirectional causality signals a feedback loop requiring cautious interpretation of the estimated coefficients. We test all pairwise directions between each energy variable (NUC, REN, FF, GDP) and each dependent variable (Total EF, Carbon EF, Land EF) at lag order one.
Results
Descriptive statistics
Table 4 presents the descriptive statistics for the G7 balanced panel spanning 1975–2024 (N = 350). The EF variables display considerable cross-country dispersion: total EF averages 19.994 in log-GHA (SD = 0.749), with the carbon component (19.522) contributing a larger share than the land component (18.987). The nuclear energy variable transformed via the IHS to accommodate Italy's 37-year nuclear moratorium and Germany's 2023 phase-out ranges from 0 to 2.925, while combined renewables span 0.014 to 2.266. All Jarque–Bera statistics reject normality at the 1% level, confirming substantial cross-country heterogeneity and supporting the use of quantile methods alongside conditional-mean estimators. Pairwise correlations among all model variables are reported in Supplemental Table S1.
Descriptive statistics.
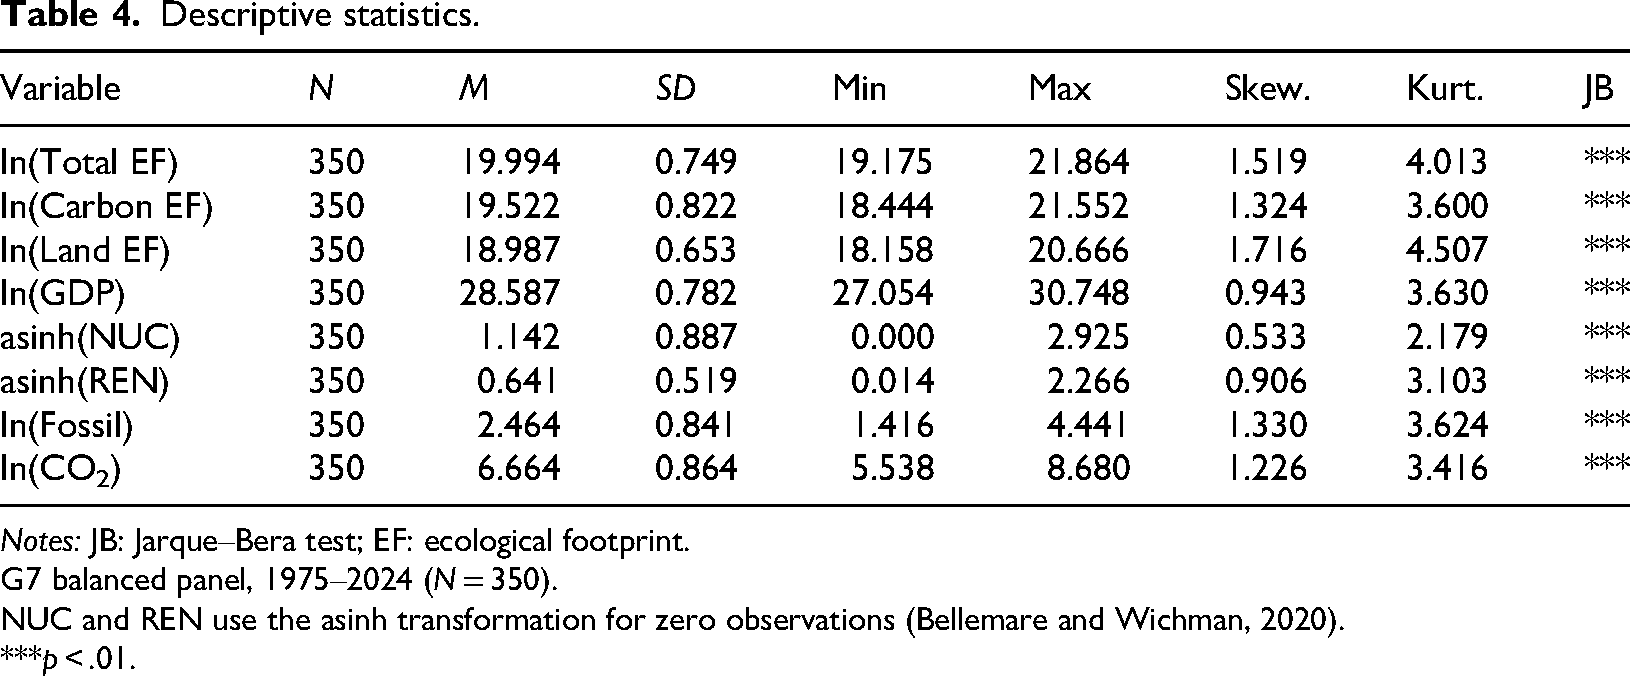
Notes: JB: Jarque–Bera test; EF: ecological footprint.
G7 balanced panel, 1975–2024 (N = 350).
NUC and REN use the asinh transformation for zero observations (Bellemare and Wichman, 2020).
***p < .01.
Preestimation diagnostics
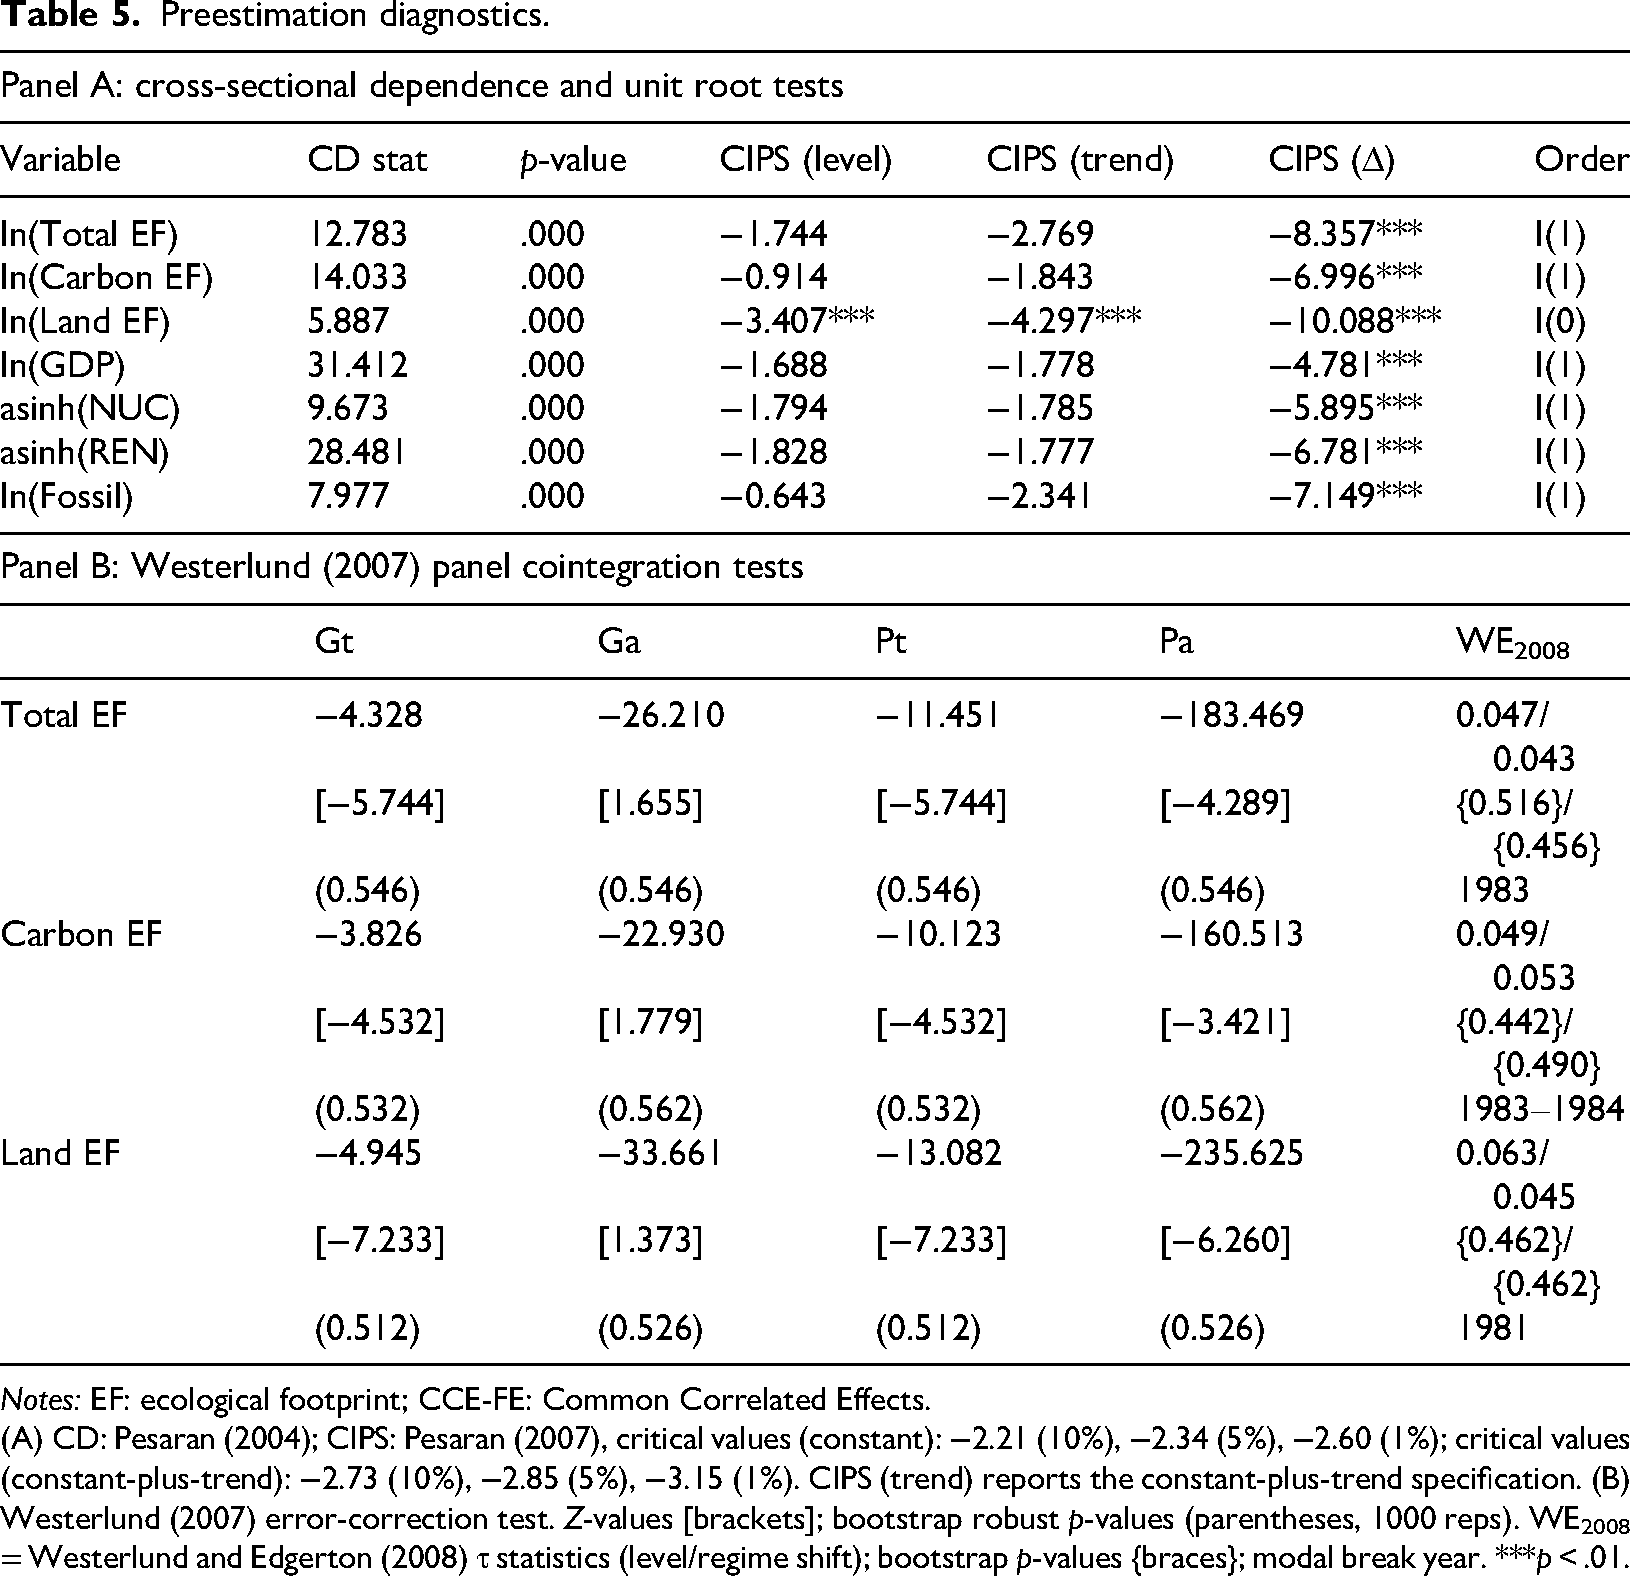
Table 5 consolidates three diagnostic procedures prerequisite to the main estimation. Panel A reports the Pesaran (2004) CD statistics (testing for CSD) and the Pesaran (2007) CIPS unit root tests. The CD statistics reject cross-sectional independence at the 1% level for all variables, establishing the empirical rationale for CCE augmentation in all subsequent estimations. The CIPS tests classify the majority of variables including Total EF, Carbon EF, GDP, nuclear, renewables, and FFs as I(1), with first differences uniformly stationary at the 1% level. Only Land EF appears I(0), a mixed integration pattern consistent with the panel cointegration framework employed below. These integration orders are robust to the inclusion of a deterministic trend: under the constant-plus-trend CIPS specification (Table 5), Land EF again rejects the unit-root null at the 1% level while all remaining series fail to reject, confirming the I(0)/I(1) classification reported above.
Preestimation diagnostics.
Notes: EF: ecological footprint; CCE-FE: Common Correlated Effects.
(A) CD: Pesaran (2004); CIPS: Pesaran (2007), critical values (constant): −2.21 (10%), −2.34 (5%), −2.60 (1%); critical values (constant-plus-trend): −2.73 (10%), −2.85 (5%), −3.15 (1%). CIPS (trend) reports the constant-plus-trend specification. (B) Westerlund (2007) error-correction test. Z-values [brackets]; bootstrap robust p-values (parentheses, 1000 reps). WE2008 = Westerlund and Edgerton (2008) τ statistics (level/regime shift); bootstrap p-values {braces}; modal break year. ***p < .01.
Panel B presents the Westerlund (2007) error-correction cointegration tests. The asymptotic Z-statistics for the group-mean (Gt) and panel (Pt) statistics are significant at the 1% level across all three dependent variables, with Gt values ranging from −4.328 (Total EF) to −4.945 (Land EF). The group-mean Ga statistic fails to reject for all three specifications a common outcome in heterogeneous panels. Bootstrap-robust p-values (.512–.562) fail to reject the no-cointegration null; this divergence between asymptotic and bootstrap inference is a well-documented artifact of small-N panels (Persyn and Westerlund, 2008; Westerlund, 2007). The Westerlund and Edgerton (2008) tests, which accommodate structural breaks, report small τ statistics with estimated break dates clustering around 1981–1984 coinciding with the second oil crisis and expansion of French and Japanese nuclear capacity. We therefore characterize the cointegration evidence as suggestive but insufficiently powered at N = 7. As established in the preestimation diagnostics section, the CCE augmentation strategy does not condition on cointegration for consistency.
CCE-augmented fixed-effects results
Table 6 reports the CCE-augmented fixed-effects estimates. Variance inflation factors for all regressors remain below the conventional multicollinearity threshold (Supplemental Table S4). GDP exerts a positive and significant effect across all three specifications, with the largest elasticity for Land EF (0.423, p < .01), followed by Total EF (0.245) and Carbon EF (0.184). The monotonically increasing GDP–Land EF gradient is consistent with the ecological economics proposition that economic expansion exerts disproportionate pressure on biocapacity-based footprint components, particularly through industrial land conversion and urban sprawl.
CCE-augmented fixed-effects results.
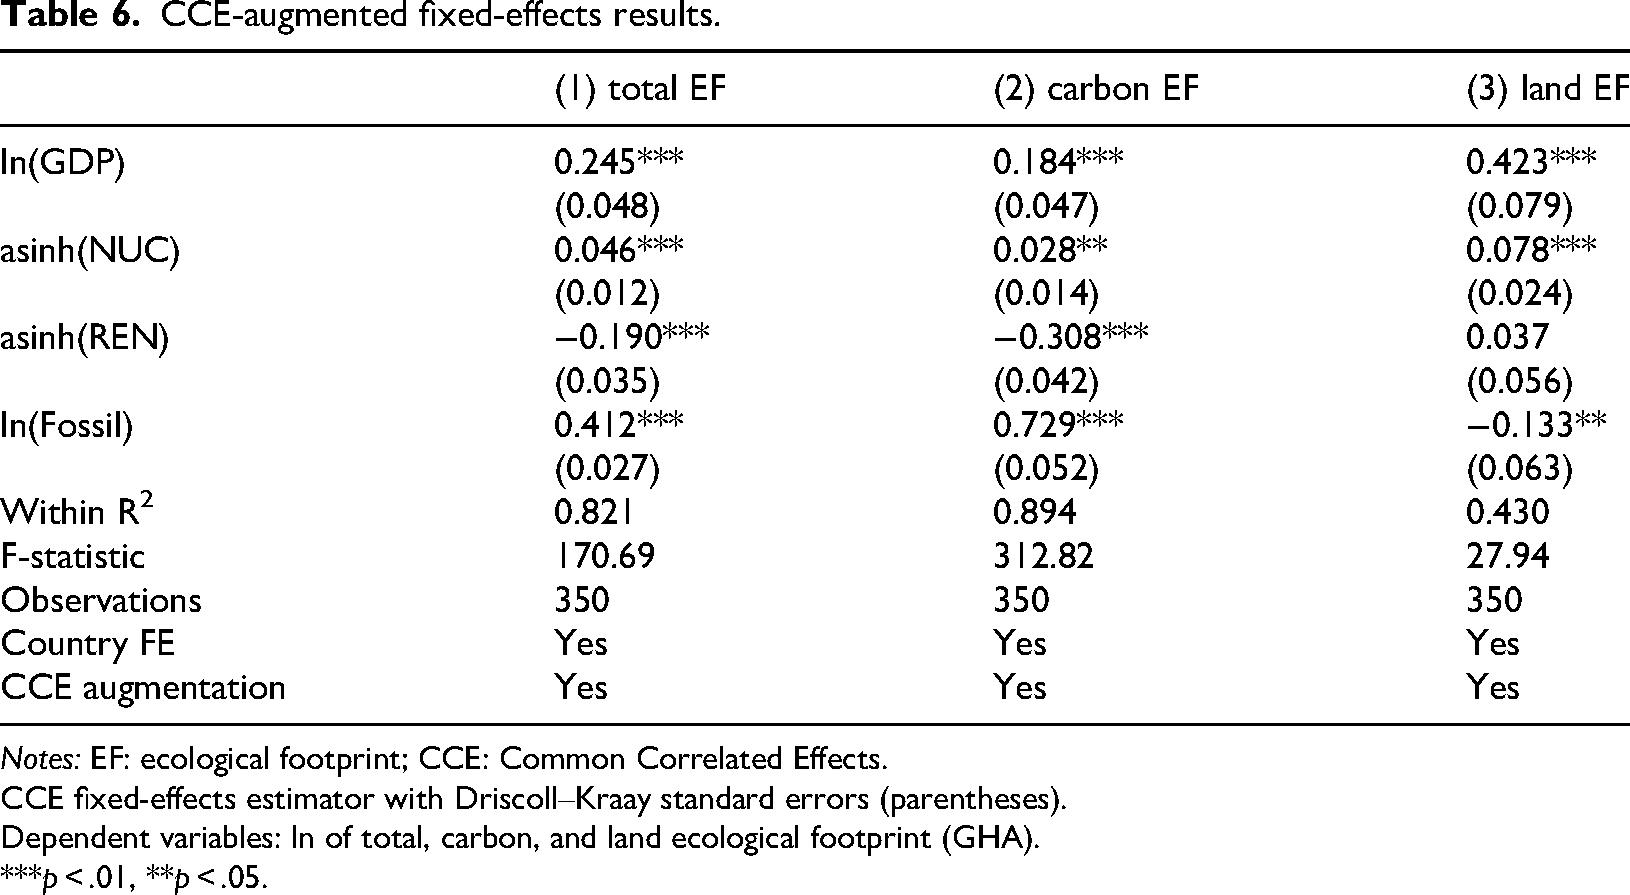
Notes: EF: ecological footprint; CCE: Common Correlated Effects.
CCE fixed-effects estimator with Driscoll–Kraay standard errors (parentheses).
Dependent variables: ln of total, carbon, and land ecological footprint (GHA).
***p < .01, **p < .05.
Nuclear energy enters with a positive and significant coefficient in all three models: 0.046 for Total EF (p < .01), 0.028 for Carbon EF (p < .05), and 0.078 for Land EF (p < .01). The nuclear–Land EF elasticity is nearly three times the nuclear–Carbon EF elasticity, indicating that nuclear power's EF operates primarily through the land-occupation channel–reactor exclusion zones, cooling infrastructure, and spent-fuel storage–rather than through atmospheric carbon emissions. A direct test of this mechanism via subcomponent analysis (Supplemental Table S9) further decomposes the land channel.
Renewable energy delivers a significant mean reduction in Total EF (−0.190, p < .01) and Carbon EF (−0.308, p < .01), but an insignificant Land EF coefficient (0.037, p = .506). The Carbon EF effect is 62% larger than the Total EF effect, confirming that renewables primarily displace fossil carbon rather than alleviating land-use pressure: the land-occupation costs of solar arrays and wind farms approximately offset their fossil-displacement benefits on the biocapacity margin. Permutation tests (Supplemental Table S6) confirm that NUC and REN coefficients differ significantly from placebo for Total EF and Carbon EF (p = .000), while the REN–Land EF placebo test fails to reject (p = .902). FFs exert the largest Carbon EF elasticity (0.729, p < .01) and a substantial Total EF effect (0.412, p < .01); the negative Land EF coefficient (−0.133, p < .05) reflects a compositional artifact of EF aggregation. Within R2 ranges from 0.430 (Land EF) to 0.894 (Carbon EF). The lower Land EF R2 admits two non-exclusive interpretations: the G7 energy mix is not the principal Land EF driver, leaving variation to land-side determinants outside the specification urbanization, agricultural value-added, forest cover, cropland intensification (Nathaniel, 2021; Obekpa et al., 2025) or classical omitted-variable bias. Disentangling these awaits future work with richer land-use panels; interim Land EF estimates should be read as conditional on the present specification and corroborated by cointegration and Granger evidence (Tables 5 and 7).
Dumitrescu–Hurlin panel Granger causality tests.
Notes: EF: ecological footprint.
Dumitrescu and Hurlin (2012) heterogeneous panel Granger causality test (lag = 1).
Z-bar statistics reported.
***p < .01, **p < .05.
MMQR distributional analysis
Table 8 presents the CCE-augmented MMQR results across five quantiles (τ = 0.10, 0.25, 0.50, 0.75, 0.90) of the conditional EF distribution. Three distributional patterns merit emphasis.
CCE-augmented MMQR results.
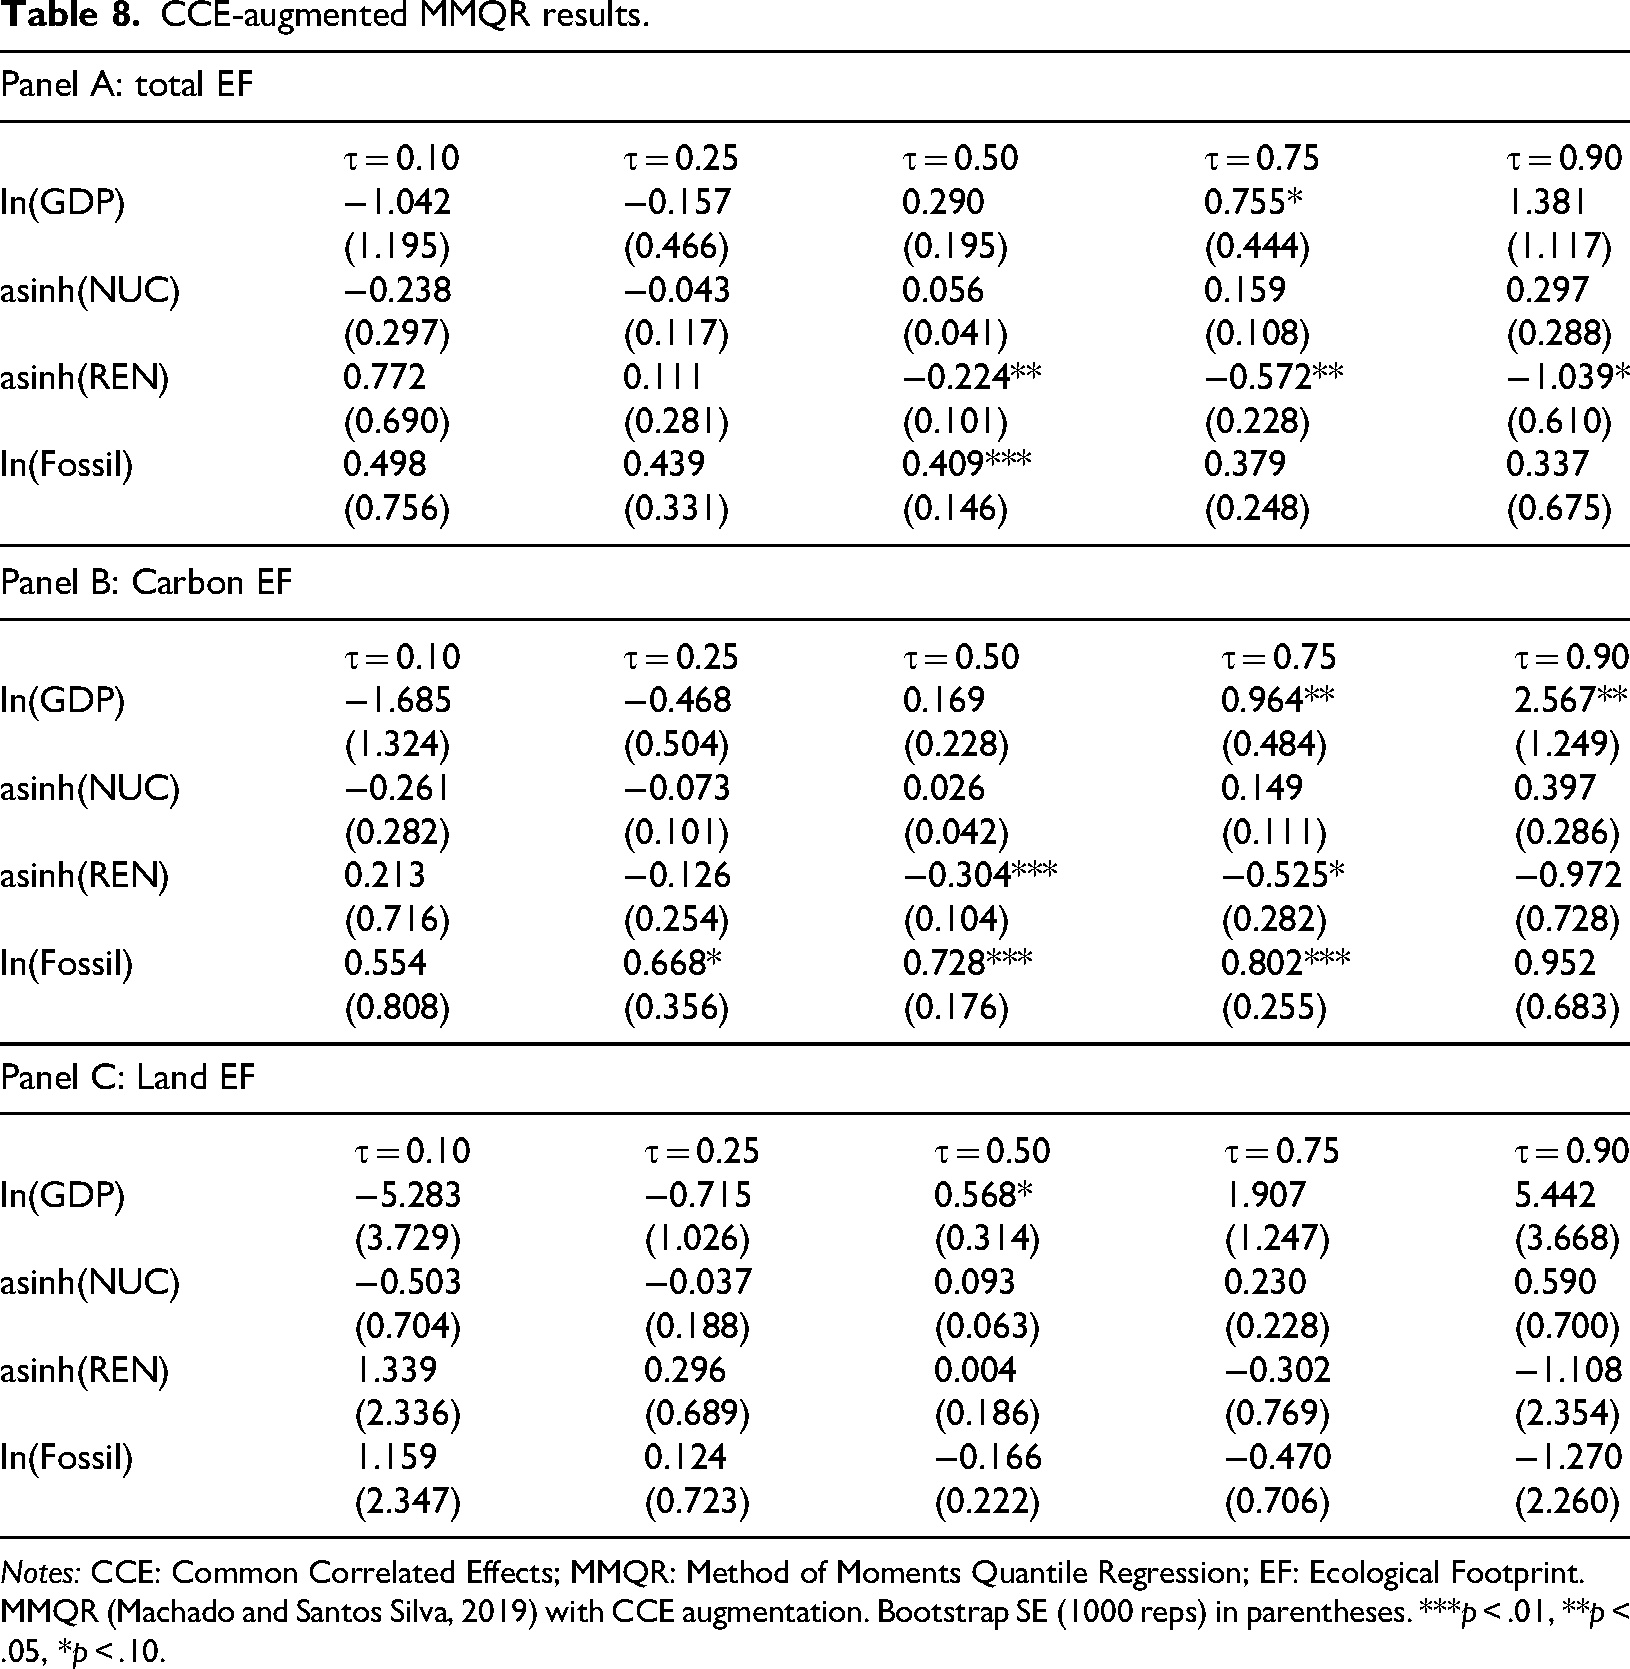
Notes: CCE: Common Correlated Effects; MMQR: Method of Moments Quantile Regression; EF: Ecological Footprint.
MMQR (Machado and Santos Silva, 2019) with CCE augmentation. Bootstrap SE (1000 reps) in parentheses. ***p < .01, **p < .05, *p < .10.
First, the nuclear energy coefficient traces a monotonically increasing path from negative values at the lower tail to positive values at the upper tail across all three dependent variables, yet no individual quantile coefficient achieves conventional statistical significance. For Carbon EF, the nuclear elasticity rises from −0.261 at τ = 0.10 to 0.397 at τ = 0.90, a gradient of 0.658 that falls short of significance due to the wide bootstrap confidence intervals inherent in a seven-country panel. This pattern visible in Figure 1 suggests that nuclear energy's footprint effect intensifies among high-footprint observations but cannot be distinguished from zero at any individual quantile with the precision afforded by N = 7.
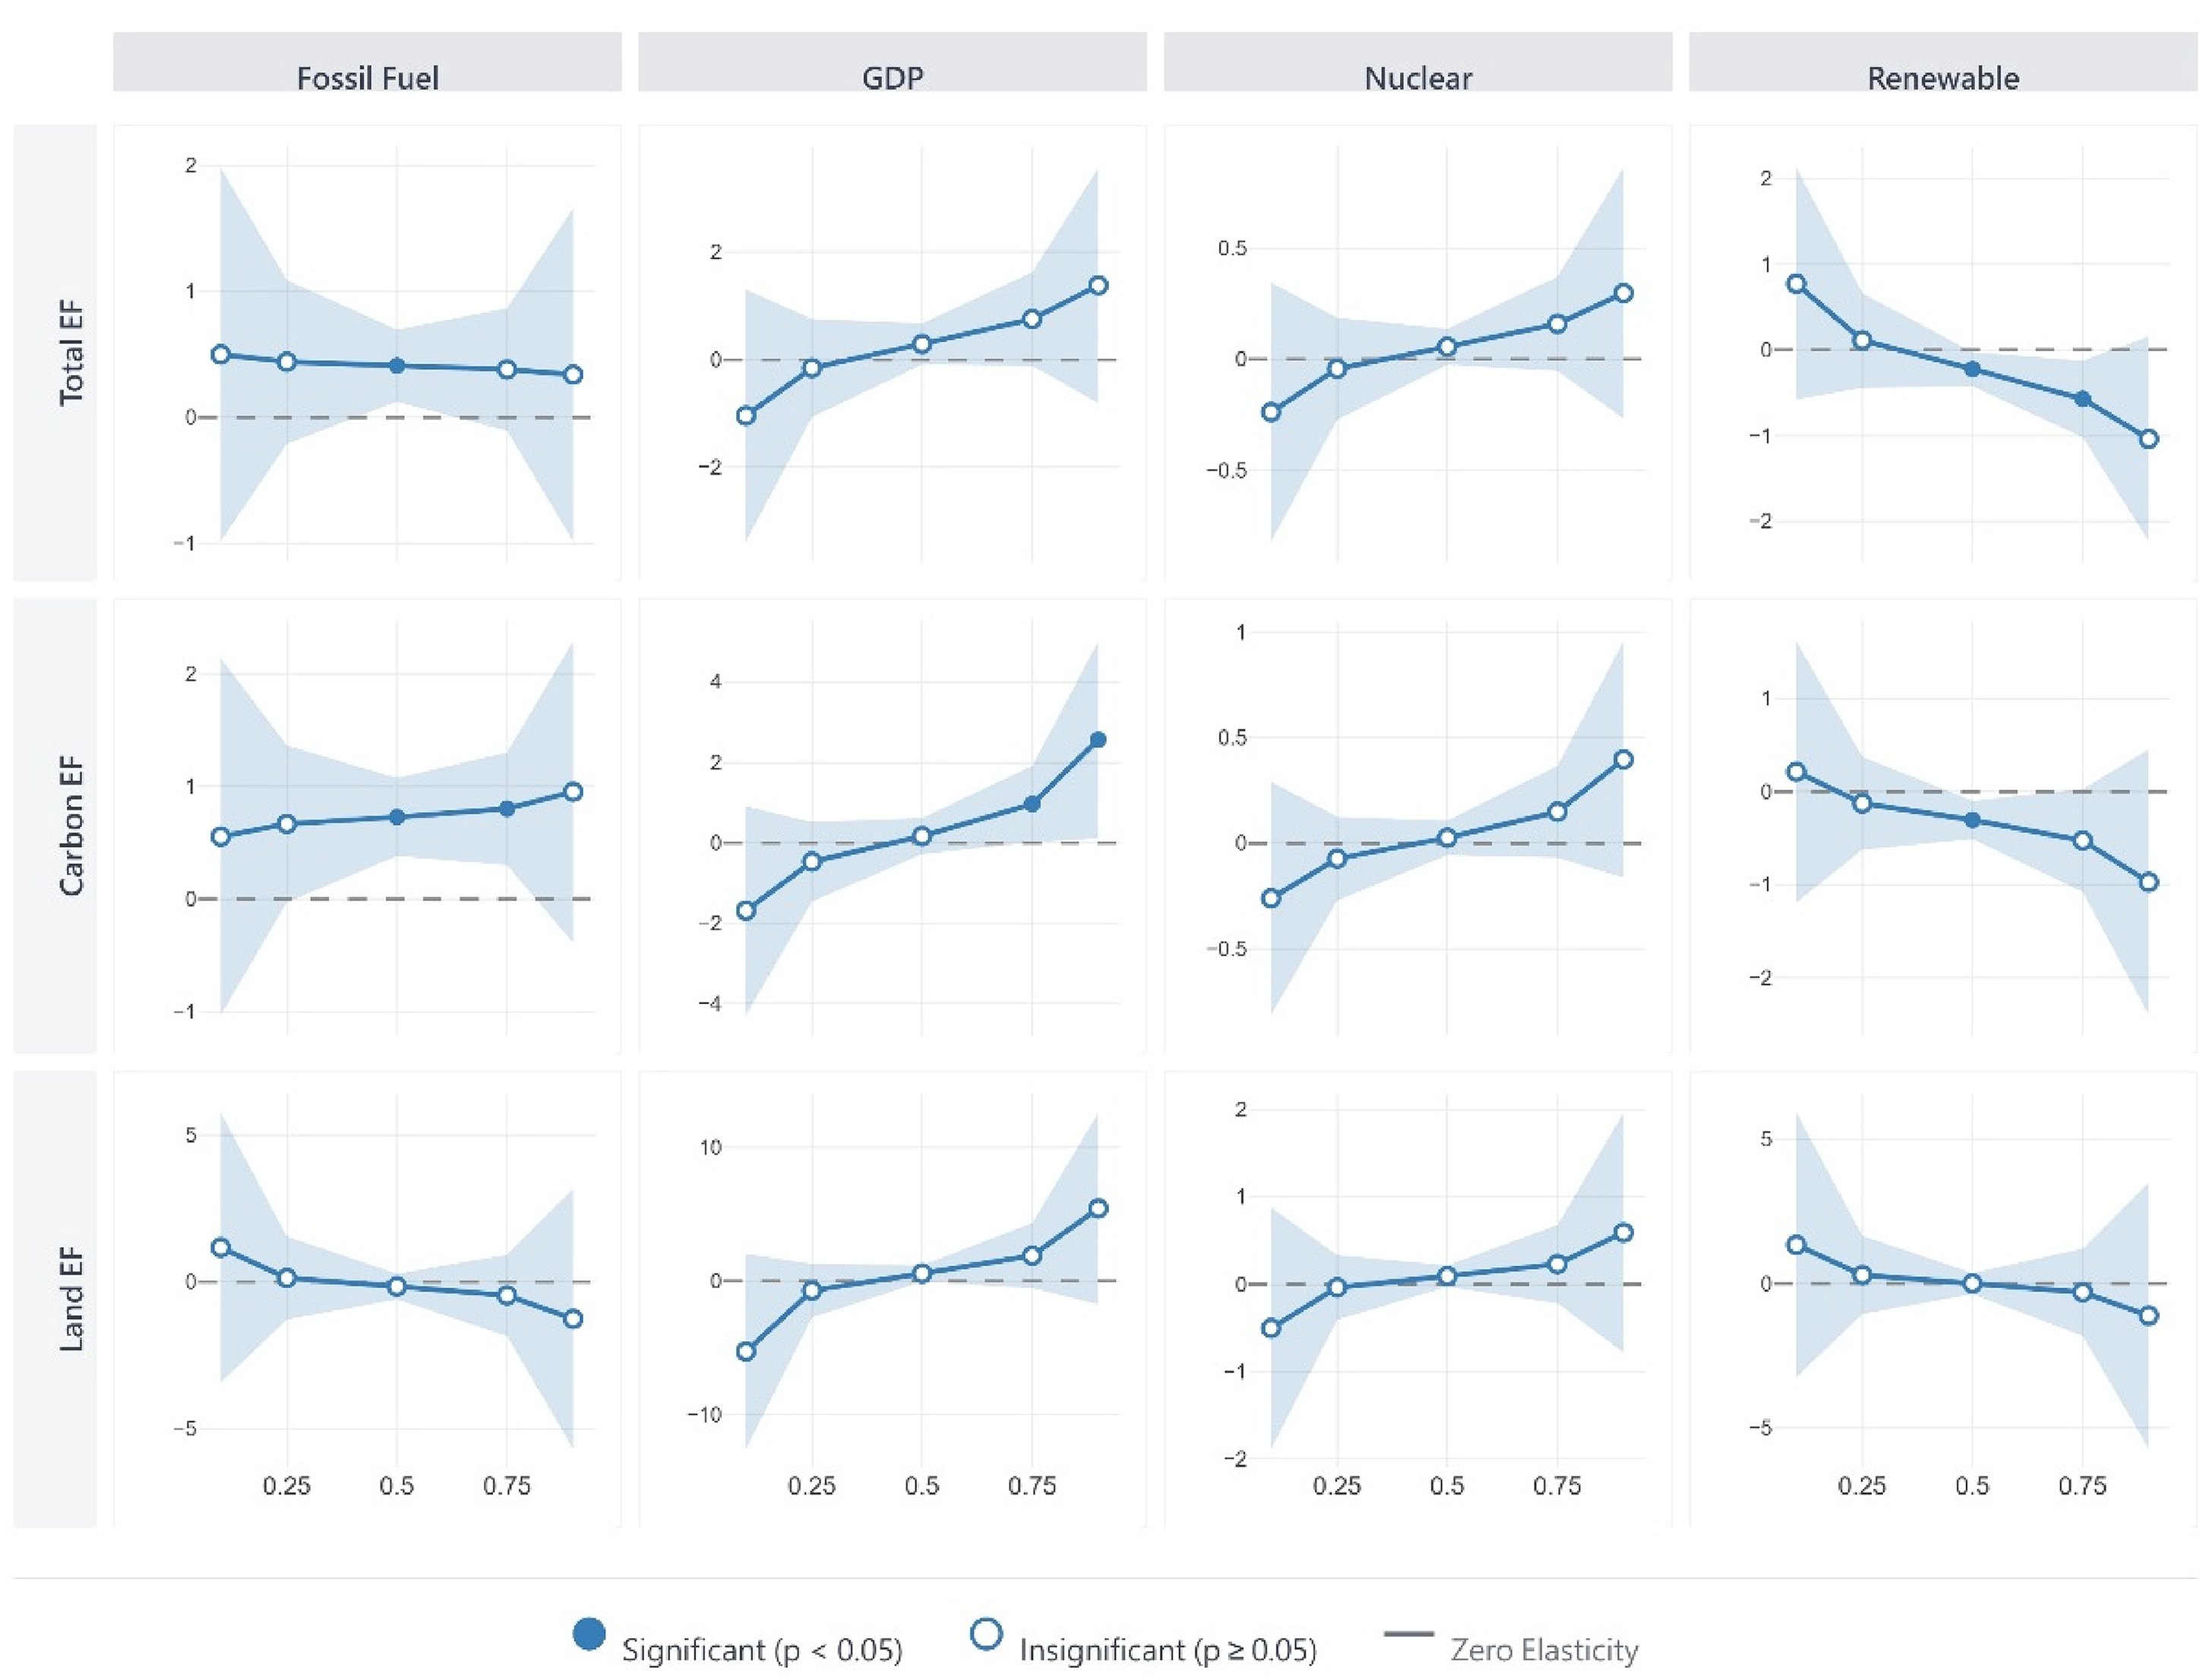
CCE-MMQR coefficient paths across quantiles of the ecological footprint distribution. The 3 × 4 matrix maps the conditional elasticities of Total, Carbon, and Land EFs against four energy-economic drivers. Filled markers indicate significance at the 5% level; shaded bands represent 95% bootstrap confidence intervals.
Second, the renewable coefficient exhibits a mirror-image distributional pattern that achieves statistical significance in the middle quantiles. For Carbon EF, the renewable elasticity moves from 0.213 (insignificant) at τ = 0.10 to −0.304 (p < .01) at the median and −0.525 (p = .062) at τ = 0.75, a monotonic strengthening of the footprint-reducing effect. For Total EF, significance emerges at τ = 0.50 (−0.224, p < .05) and τ = 0.75 (−0.572, p < .05). Figure 1 reveals a divergent scissors pattern for Carbon EF above the median: renewable elasticities trend increasingly negative while nuclear elasticities trend increasingly positive. Widening confidence intervals at the extremes reflect the reduced effective sample size at the tails of a small-N panel. Leave-one-country-out analysis (Supplemental Table S8) confirms the stability of the core result: the REN → Carbon EF coefficient at τ = 0.50 remains significant in 6 of 7 leave-outs with zero sign reversals.
Third, FF elasticities display contrasting distributional behavior across footprint components. For Carbon EF, the fossil coefficient escalates from 0.554 at τ = 0.10 to 0.952 at τ = 0.90, with significance concentrated at the median (0.728, p < .01) and 75th percentile (0.802, p < .01). For Land EF, the fossil coefficient reverses sign from 1.159 at τ = 0.10 to −1.270 at τ = 0.90, though no quantile achieves significance underscoring the difficulty of identifying stable land-use effects in a panel dominated by carbon dynamics.
Causal direction
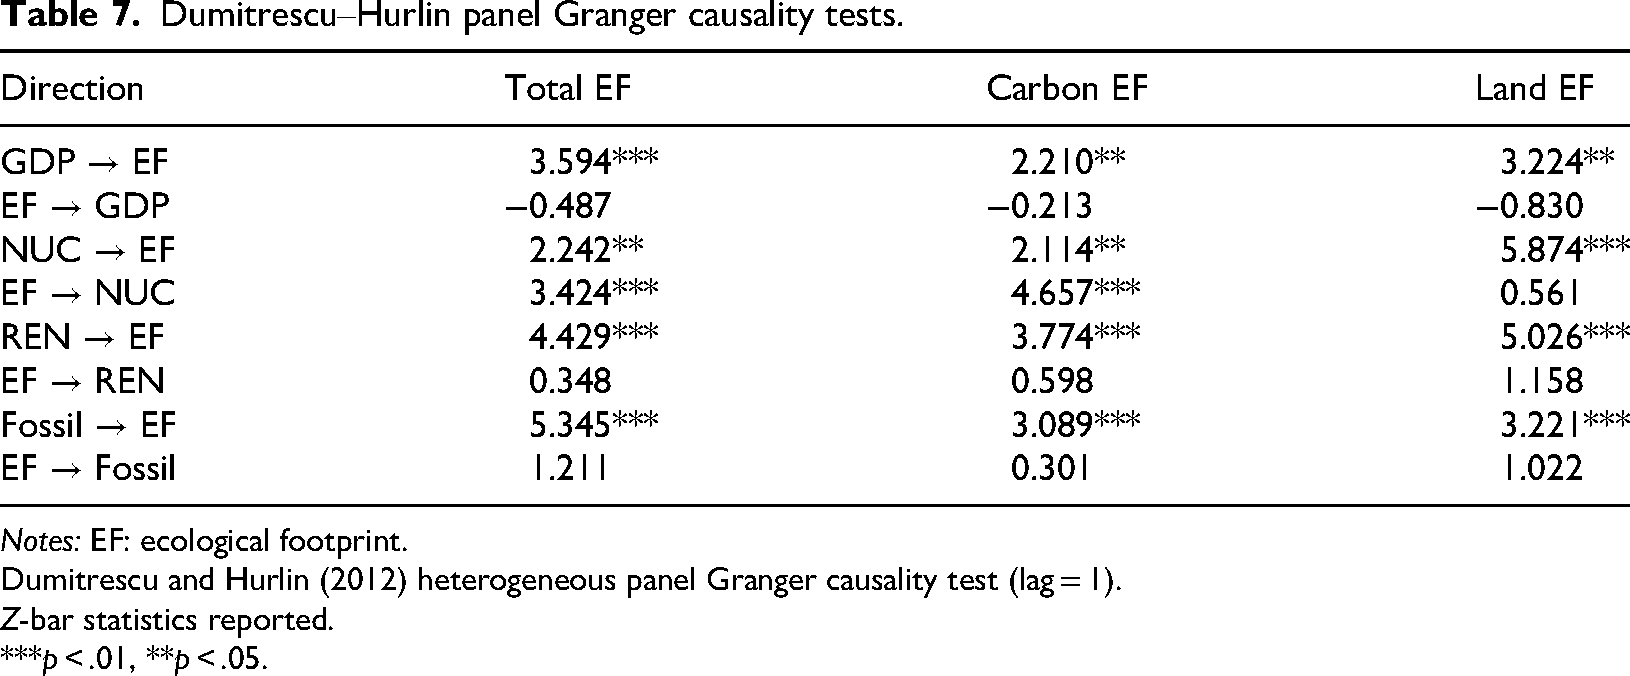
Table 7 reports the Dumitrescu and Hurlin (2012) heterogeneous panel Granger causality tests. All four energy-mix variables Granger-cause EF at the 1–5% level across all three dependent variables, supporting the identifying assumption that energy-mix composition drives ecological outcomes. No significant reverse causality runs from EF to GDP, renewables, or FFs. Renewable energy displays the strongest unidirectional causality toward EF, with Z-bar statistics of 4.429 (Total EF), 3.774 (Carbon EF), and 5.026 (Land EF), all significant at the 1% level.
The sole exception to the unidirectional pattern is nuclear energy, which exhibits significant bidirectional causality: EF → NUC registers Z-bar values of 3.424 (Total EF, p < .01) and 4.657 (Carbon EF, p < .01), while the reverse NUC → EF is also significant. This feedback is consistent with a reactive policy channel whereby countries facing mounting ecological pressure expand nuclear capacity as a perceived decarbonization instrument. The bidirectional pattern does not invalidate the CCE-FE estimates which rely on within-country variation and cross-sectional average augmentation for identification but it cautions against strong causal claims for the nuclear coefficient specifically. As a sensitivity check, Lewbel (2012) heteroscedasticity-based IV estimation (Supplemental Table S7) yields qualitatively consistent coefficient signs for Total EF and Carbon EF, though the Sargan test rejects across specifications, indicating the internal instruments may not satisfy the exclusion restriction. The IV results should therefore be read as directional corroboration rather than a definitive endogeneity correction.
Country-level vector error-correction analysis (Supplemental Table S5) shows that only 8 of 84 bivariate pairs (9.5%) exhibit Johansen cointegration at the 5% level, concentrated in Land EF–GDP relationships for Canada, France, Germany, and the United States. This sparsity is consistent with the panel-level bootstrap p-values reported in Table 5 and reinforces our emphasis on cross-sectional heterogeneity captured by the MMQR rather than long-run equilibrium convergence. Where cointegration is detected, the error-correction speeds are rapid (−0.33 to −0.93 for Canada), suggesting that deviations from the long-run equilibrium correct within one to three years.
Discussion
Two stories, not one: Interpreting the carbon–land decomposition
The central finding of this study is that the G7 energy–EF nexus is not a single story but two. The CCE-FE results (Table 6) reveal that renewable energy significantly reduces Carbon EF (−0.308, p < .01) but exerts no statistically distinguishable effect on Land EF (0.037, p = .506). This asymmetry confirms that the ecological benefits attributed to renewable deployment in the existing literature (Atasever, 2025; Maftoon et al., 2025; Raghutla et al., 2022) are almost exclusively a carbon-channel phenomenon. When prior studies report that renewable energy “mitigates TEF,” our decomposition clarifies that this mitigation reflects the displacement of fossil carbon rather than any measurable relief of land-based biocapacity pressure. This land-neutrality is best understood by disaggregating the renewable category. For most of the sample period the G7 “renewable” aggregate is dominated by hydropower and biomass rather than by solar and wind, and these components act on land in opposing directions: biomass and large hydro consume cropland, forest, and inundated land directly and thus expand the land footprint, whereas the spatial footprint of solar and wind, though real, is partly offset by their displacement of land-intensive fuel cycles. The near-zero net elasticity therefore masks an internal composition in which carbon-reducing and land-consuming components coexist.
The GDP results reinforce this two-story interpretation. Economic growth exerts its largest ecological elasticity through the land channel (0.423, p < .01), more than double the carbon-channel effect (0.184, p < .01). This finding aligns with the ecological economics proposition that economic expansion drives industrial land conversion, urban sprawl, and agricultural intensification (Nathaniel, 2021; Obekpa et al., 2025), pressures that decarbonization policies alone cannot address. The implication is direct: G7 nations that rely exclusively on energy transition to improve their ecological balance sheet leave the land-channel pressures unaddressed. Mechanistically, this asymmetry follows directly from the STIRPAT affluence (A) term: in mature G7 economies, rising income raises ecological impact less through additional energy combustion, which is already decoupling through the technique effect, than through the scale effect of affluent consumption on physical land, namely built-up area expansion, infrastructure, and land-intensive dietary and material demand. The land channel therefore captures precisely the component of affluence that the energy transition leaves untouched.
Nuclear energy presents an instructive case for the decomposition framework. The CCE-FE estimates provide suggestive evidence that nuclear power's EF operates primarily through the land-occupation channel, with the Land EF elasticity (0.078, p < .01) nearly three times the Carbon EF elasticity (0.028, p < .05). The MMQR analysis, however, shows that no individual quantile coefficient for nuclear achieves conventional significance (Table 8), indicating that this land-channel mechanism, while present on average, lacks statistical precision across the conditional distribution given the small cross-sectional dimension (N = 7). The monotonically increasing quantile path, from negative values at τ = 0.10 to positive values at τ = 0.90, is consistent with a land-occupation interpretation, but wide bootstrap confidence intervals counsel caution. These results suggest, rather than confirm, that inconsistent signs for nuclear energy in prior TEF studies may arise from mixing a modest carbon-channel effect with a larger but imprecisely estimated land-channel mechanism. This pattern must be read against the heterogeneity of G7 nuclear policy: France draws roughly three-quarters of its electricity from nuclear power, Germany legislated a complete phase-out (Atomausstieg) completed in 2023, and Japan idled and only partially restarted its fleet after the 2011 Fukushima accident. Pooling these divergent regimes implies that the positive nuclear coefficient reflects the land-occupation demands of plant siting, exclusion zones, and the fuel cycle in the nuclear-intensive members rather than a uniform G7 effect, and it rationalizes why the quantile estimates (Supplemental Table S9) turn positive only in the upper, high-footprint tail.
The MMQR distributional analysis (Table 8) adds a further dimension. Renewable energy's Carbon EF mitigation strengthens monotonically from the median (−0.304, p < .01) to the 75th percentile (−0.525, p = .062), indicating that the displacement effect is most pronounced among high-footprint observations. This pattern is consistent with Miyan et al. (2025), who report stronger mitigating elasticities at higher quantiles in D-8 nations. Conversely, no renewable coefficient achieves significance for Land EF at any quantile, confirming that the carbon-only nature of renewable mitigation is not an artifact of mean estimation but persists across the entire conditional distribution.
The FF results complete the picture. Fossil consumption exerts the largest Carbon EF elasticity (0.729, p < .01), escalating from 0.554 at τ = 0.10 to 0.952 at τ = 0.90 in the MMQR specification. The negative Land EF coefficient (−0.133, p < .05) reflects compositional mechanics: as fossil combustion expands the carbon component's share, the relative weight of land-based categories in the aggregate diminishes. This accounting effect underscores why aggregated TEF regressions can produce misleading inferences. The declining carbon share of Total EF across decades from 0.710 to 0.615 in Germany and 0.698 to 0.652 in the United States (Supplemental Table S3) provides direct evidence of this compositional shift.
The Granger causality tests (Table 7) confirm unidirectional causation from all four energy variables to EF, with one exception: nuclear energy exhibits significant bidirectional causality, consistent with a reactive policy channel in which countries facing mounting ecological pressure expand nuclear capacity as a perceived decarbonization instrument. This feedback loop reinforces the need for the CCE augmentation strategy employed in this study, which absorbs common unobserved factors that could otherwise bias the nuclear coefficient.
The bidirectional Granger result warrants discussion of its mechanism and limits. Two nonexclusive channels can rationalize a reverse link from EF to nuclear capacity: a political-economy channel in which governments facing elevated ecological pressure expand nuclear deployment as a perceived decarbonization lever (Bandyopadhyay et al., 2022), and an infrastructure-lead channel in which anticipated footprint growth motivates the long-lead-time investment cycles characteristic of nuclear construction. Both imply that the observed nuclear–EF association partly reflects policy response rather than one-directional forcing. CCE augmentation absorbs unobserved common factors but does not resolve within-country simultaneity; an instrumental-variable strategy exploiting exogenous shocks (post-Fukushima phase-outs, long-dated construction permits) would be required for strictly causal interpretation. The 0.078 Land EF elasticity is therefore best read as a robust conditional association whose causal interpretation awaits further identification work. The reverse linkage is consistent with reactive nuclear policy, in which deteriorating environmental conditions prompt governments to retain or expand nuclear capacity, as in France's post-oil-shock program and, in the opposite direction, the German retrenchment.
Policy implications: Separate instruments for separate channels
The decomposition results carry a direct implication for environmental policy design in the G7: because the carbon and land channels respond to different drivers, they require separate policy instruments. A unified “green transition” strategy built around renewable deployment and fossil phase-out addresses only one half of the ecological ledger.
Carbon-channel policy
For the carbon channel, the evidence supports accelerating current G7 energy transition strategies. Renewable energy delivers a robust −0.308 elasticity on Carbon EF, and this effect intensifies at higher quantiles of ecological pressure (Table 8), suggesting that the marginal carbon-displacement benefit of renewables is greatest precisely where it is most needed. FF reduction remains the highest-leverage intervention, given the 0.729 Carbon EF elasticity and its escalation across the distribution. The policy priority for the carbon channel is therefore clear: accelerate renewable substitution for FFs through carbon pricing, feed-in tariffs, and renewable portfolio standards.
However, the distributional evidence introduces an important nuance. The renewable coefficient is insignificant at the lower quantiles (τ = 0.10, 0.25) of Carbon EF, suggesting that in low-footprint contexts, additional renewable deployment yields diminishing ecological returns. This finding resonates with Kartal et al. (2025a), who document that environmental policy stringency is “completely helpful” in the United States but “fully inefficient” in Japan, and with Atasever (2025), who finds that renewable mitigation is frequently offset by the scale effect of NREC at extreme quantiles. Policymakers should therefore calibrate renewable investment to the country's position on the footprint distribution, rather than applying uniform deployment targets across the G7.
Land-channel policy
For the land channel, the findings reveal a policy vacuum. No energy variable in this study significantly reduces Land EF. Renewable energy is land-neutral (0.037, n.s.), and nuclear energy is land-positive (0.078, p < .01), meaning that the entire G7 energy transition toolkit as currently constituted leaves land-based ecological pressure unaddressed. GDP, the strongest land-channel driver (0.423, p < .01), operates through urbanization, industrial land conversion, and agricultural intensification, channels that energy policy does not target.
This finding echoes Wang et al. (2020), who demonstrate that biomass energy increases the EF through land capacity destruction, and Nathaniel (2021), who links G7 biocapacity degradation to human capital and urbanization dynamics. The policy implication is that G7 nations require a dedicated set of economic instruments for the land channel, operating alongside, not subsumed within, their carbon-focused energy transition strategies. Framed in terms of environmental economics, the land-channel policy vacuum identified in this study represents a classic market failure: the biocapacity costs of energy infrastructure are externalized because no price signal penalizes land occupation the way carbon pricing penalizes atmospheric emissions.
The decomposition evidence supports a concrete portfolio of land-channel instruments for G7 policymakers, each targeting a driver that carbon-focused instruments leave unpriced. We group them into pricing instruments, deployment-side instruments, and a governance instrument, and recommend their phased adoption alongside not within existing carbon strategies. First, a Pigouvian-style land-occupation charge levied on energy infrastructure in proportion to biocapacity displaced per unit of installed capacity could internalize the land-channel externalities implied by the significant nuclear–Land EF elasticity (0.078) and GDP–Land EF gradient (0.423), neither of which is priced by existing carbon instruments. We recommend benchmarking the charge to biocapacity displaced per megawatt of installed capacity and phasing it in as a credit against existing carbon levies, so that the same project is not taxed twice for the same externality.
Second, a biocapacity shadow price incorporated into levelized cost of energy (LCOE) assessments could reflect the land-channel externality that current technology comparisons omit. The contrast between the insignificant renewable–Land EF coefficient (0.037, n.s.) and the significant nuclear–Land EF coefficient (0.078, p < .01) suggests that a land-adjusted ranking of generation technologies may differ from the conventional carbon-adjusted ranking, we therefore recommend that G7 procurement and capacity-auction frameworks embed a biocapacity shadow price directly in their LCOE comparisons, so that land-cheap options such as rooftop and brownfield solar are systematically favored over land-intensive ones such as greenfield biomass and large hydro.
Third, the results motivate research on whether a market-based mechanism for the land EF could operate alongside carbon emissions trading. Because no energy variable in this study reduces Land EF, the existing carbon market does not price biocapacity. We therefore recommend piloting a tradable land-footprint quota denominated in global hectares, initially ring-fenced to the energy-infrastructure sector where measurement is most tractable, to establish the missing price signal on biocapacity. The “two channels, two instruments” logic is thus operational rather than merely diagnostic: the carbon channel is served by carbon pricing and renewable standards, the land channel by the land-based instruments set out here.
Beyond pricing, three deployment-side instruments can be implemented immediately within existing G7 planning systems. First, binding spatial siting standards should steer solar and wind capacity onto already-disturbed land rooftops, brownfields, car parks, and degraded or contaminated sites and away from cropland, forest, and intact habitat, converting the land footprint of renewables from an unmanaged externality into an enforceable permitting criterion. Second, agrivoltaic and degraded-land mandates, under which a defined share of new ground-mounted solar must either colocate with agricultural production or occupy marginal land, would permit renewable expansion without subtracting from biocapacity, directly offsetting the land-positive components (biomass, large hydro) identified in the two stories, not one: interpreting the carbon–land decomposition section. Third, sustainability criteria on biomass feedstock restricting eligible bioenergy to genuine residues and waste rather than purpose-grown energy crops would curb the cropland and forest conversion that drives the positive biomass–Land EF relationship documented by Wang et al. (2020).
Finally, these instruments require a measurement architecture to function. We recommend that G7 national energy and climate transition plans add a land-footprint accounting line alongside their existing carbon-budget reporting, denominated in global hectares and disaggregated by generation technology. Without such a line the land channel remains invisible to the very plans that govern the energy transition, and the biocapacity costs documented here continue to be externalized. Pairing a carbon ledger with a land ledger operationalizes the central message of this study: the G7 is winning the carbon battle but losing the land war, and only a policy framework that scores both can secure genuine ecological sustainability.
Limitations and future directions
Several limitations bound the interpretation of these findings and suggest directions for future research.
First, the Westerlund (2007) bootstrap-robust cointegration tests do not reject the no-cointegration null for any of the three specifications (Table 5), and only 8 of 84 country-level bivariate pairs (9.5%) exhibit Johansen cointegration. We treat this not as a deficiency of the analysis but as a feature of the data that our estimation strategy is explicitly designed to accommodate. Because Kapetanios et al. (2011) establish that the CCE estimator remains consistent whether the common factors are I(0) or I(1), the CCE-FE and MMQR results are interpreted throughout as conditional elasticities that are robust to the multifactor error structure, rather than as parameters of a cointegrating long-run equilibrium. The absence of a stable cointegrating vector is therefore consistent with, and poses no threat to, our identification strategy. It does bound the temporal scope of the claims: the estimates characterize the conditional energy–footprint relationship over the sample period rather than a permanent equilibrium, and future work using longer spans or higher-frequency data could test whether the carbon–land asymmetry is a durable structural feature.
Second, the sample is limited to seven G7 nations over 1975–2024 (N = 350). While the long temporal span provides substantial within-country variation, the small cross-sectional dimension (N = 7) constrains the precision of quantile estimates at the distributional tails and limits the generalizability of the findings to non-OECD contexts. The wide bootstrap confidence intervals at τ = 0.10 and τ = 0.90 in the MMQR specification (Table 8) reflect this constraint directly. Extending the decomposition framework to G20, OECD, or emerging-economy panels would test whether the carbon–land asymmetry is a structural feature of advanced economies or a more general phenomenon.
Third, the EF data aggregates five land-use subcomponents (cropland, grazing land, forest land, fishing ground, built-up land) into a single Land EF measure. This aggregation is necessary for tractable panel estimation, but it may mask heterogeneous responses across subcomponents. The preliminary subcomponent analysis (Supplemental Table S9) indicates that the nuclear land-channel effect is concentrated in specific subcategories; future research should exploit the full six-way decomposition to identify precisely which biocapacity categories are most sensitive to each energy source.
Fourth, the bidirectional Granger causality between nuclear energy and EF (Table 7) introduces the possibility of simultaneity bias that the CCE-FE strategy may not fully resolve. Although the CCE augmentation absorbs common unobserved factors, an instrumental-variable approach exploiting exogenous policy shocks (e.g. post-Fukushima phase-out decisions) would strengthen the causal identification of the nuclear–Land EF relationship.
Fifth, this study does not model the spatial spillover effects of energy transition. Alola et al. (2023) demonstrate that trade dynamics create ecological leakage, whereby domestic environmental gains may be offset by imported degradation embedded in traded goods. Incorporating spatial econometric techniques or trade-adjusted footprint measures would provide a more complete account of how G7 energy transition redistributes, rather than eliminates, ecological pressure across borders.
Conclusions
This study decomposes the G7 EF into its carbon and land components and employs CCE-augmented fixed effects and MMQR to examine whether the energy–environment nexus operates through a single channel or through two distinct ecological dimensions. The pattern is clear: two dimensions, two stories. Renewable energy delivers substantial carbon-channel mitigation (−0.308, p < .01) but leaves land-based ecological pressure entirely unaffected. GDP degrades the environment primarily through the land channel (0.423 vs 0.184). Nuclear energy imposes a land-occupation cost (0.078, p < .01) nearly three times its carbon-channel effect.
These findings challenge the prevailing assumption in both the empirical literature and the policy discourse that energy transition yields monotonic environmental improvement. The G7 is winning the carbon battle but losing the land war, and the current policy toolkit, built around renewable deployment and fossil phase-out, is structurally incapable of addressing the land-based half of the ecological ledger. Until policymakers design separate instruments for the carbon and land channels, the “clean” energy paradox documented in this study will persist.
Supplemental Material
sj-docx-1-eea-10.1177_01445987261464226 - Supplemental material for Decomposing the “clean” energy paradox: Carbon versus land ecological footprints in G7 nations
Supplemental material, sj-docx-1-eea-10.1177_01445987261464226 for Decomposing the “clean” energy paradox: Carbon versus land ecological footprints in G7 nations by Chun-Chih Chen and Hsiao-Tien Pao in Energy Exploration & Exploitation
Footnotes
Ethics approval
Not applicable. This study analyses publicly available country-level panel data and does not involve human participants, human tissue, or animal subjects.
Consent to participate and consent for publication
Not applicable (no human participants were involved in this study).
Authors’ contributions
Chun-Chih Chen: conceptualization, methodology, formal analysis, data curation, software, writing—original draft, writing—review and editing, and visualization; Hsiao-Tien Pao: conceptualization, methodology, supervision, validation, and writing—review and editing. Both authors read and approved the final manuscript.
Funding
This work was supported by the National Science and Technology Council, Taiwan (Grant No. NSTC 114-2410-H-025-040).
Declaration of conflicting interests
The authors declared no potential conflicts of interest with respect to the research, authorship, and/or publication of this article.
Data availability statement
The datasets analysed in this study are available from publicly accessible sources: the EF and biocapacity data from the Global Footprint Network (https://data.footprintnetwork.org), primary energy consumption data by fuel from the Energy Institute Statistical Review of World Energy (https://www.energyinst.org/statistical-review), and real GDP (constant US$) from the World Bank World Development Indicators (![]() ). Derived analytical panels, replication code, and MMQR/CCE-FE estimation scripts are available from the corresponding author on reasonable request.
). Derived analytical panels, replication code, and MMQR/CCE-FE estimation scripts are available from the corresponding author on reasonable request.
Code availability
Declaration of generative AI and AI-assisted technologies in the manuscript preparation process
During the preparation of this work, the authors used Claude (Anthropic) in order to assist with manuscript structure refinement and language editing. After using this tool/service, the authors reviewed and edited the content as needed and take full responsibility for the content of the published article.
Supplemental material
Supplemental material for this article is available online.
References
Supplementary Material
Please find the following supplemental material available below.
For Open Access articles published under a Creative Commons License, all supplemental material carries the same license as the article it is associated with.
For non-Open Access articles published, all supplemental material carries a non-exclusive license, and permission requests for re-use of supplemental material or any part of supplemental material shall be sent directly to the copyright owner as specified in the copyright notice associated with the article.