



Abstract
Student evaluations of quantitative methods courses in political science often reveal they are characterised by aversion, alienation and anxiety. As a solution to this problem, this paper describes a pedagogic research project with the aim of embedding quantitative methods by stealth into the first-year undergraduate curriculum. This paper describes the development and evaluation of new teaching and learning materials using active learning pedagogies. The learning activities were designed to develop introductory-level quantitative skills and create a positive first impression of quantitative methods by clearly communicating their value and relevance. The paper demonstrates how the study of psephology – electoral and polling data – can be used to embed quantitative methods within the substantive political science curriculum. This involved devising effective ways of not only teaching psephology but also recreating the experiences of ‘being a psephologist’ as a learning experience in a way that develops quantitative skills and embeds quantitative methods. This study illustrates how quantitative methods can be successfully embedded into the substantive curriculum and explores a range of relevant debates for pedagogical practice and curriculum design.
Keywords
Context
The attention paid towards quantitative methods (QMs) has significantly increased in recent years (MacInnes, 2014). A wide range of reports, research and initiatives identify the need to address the dearth of numeric skills and the unpopularity of methods courses on UK social science degrees (British Academy, 2016; Nuffield Foundation, 2013). Student evaluations of QMs courses often reveal they are characterised by aversion, alienation and anxiety. To inform a way forward, MacInnes (2010) was commissioned by the UK Economic Social and Research Council (ESRC) to produce a series of proposals to improve the teaching of quantitative research methods at the undergraduate level, arguing that: While most QM teaching is done within departments, and thus takes place within a specific disciplinary environment, it is not ‘embedded’ elsewhere in the curriculum. The lack of reinforcement of QM by the use of appropriate quantitative evidence in substantive courses, together with the limited curriculum time for methods courses gives students a strong message that QM is not of great relevance to the subjects they study. In some departments the low priority given to QM is reflected in the low status associated with teaching it, so that some teaching may be unimaginative. (MacInnes, 2010: 4)
Throughout 2013–2014, the UK Higher Education Academy Social Sciences cluster focused on a series of strategic priorities, including teaching research methods. The academy invited project ideas that could communicate to students, in imaginative ways, not only how they can use QMs, but why they might want to do so. This paper details a funded project aligned to the communicating QMs strand of the strategy priority.
The project
Within the research methods teaching debate, we can see a shift in attention over the past 15 years from the postgraduate level to the undergraduate level. Previously, postgraduate provision dominated the debate, usually regarding the development of research skills at both the doctoral and postdoctoral career stage. An example of this is the review by Sir Gareth Roberts (Roberts, 2002) regarding the employability and development of PhD researchers, which informed government funding decisions in this area.
However, since the early 2000s there has been a growing realisation of the need to address the research skills problem at an earlier stage. It was argued that students would benefit from receiving a more positive experience of, and better grounding in, research methods at the undergraduate level. From this comes the rationale to focus on introductory-level skills, reconsider the curriculum at the preparatory level and consider the first impression learners form of QMs. This involves considering the first encounters and experiences of QMs a student receives, rather than thinking about how methods can be used to support a piece of postgraduate research. There is a need to explain to learners the fundamental rationale for data analysis and to ‘break the ice’ where quantitative analysis is involved.
Responding to this need, a project was developed focusing exclusively on the first-year undergraduate curriculum with the objective of developing introductory-level skills and creating a positive first impression of QMs. The project aimed to communicate the value of quantitative analysis to first-year undergraduates through showing the potential of these methods in an imaginative and innovative way using active learning pedagogies. It sought to stimulate some initial interest and highlight why students should use QMs in the future.
The project was based on the assumption that many students have little prior understanding of data analysis and need to be introduced to these themes gradually. This is because, with the exception of economics students, only around 10% of social science undergraduates studied mathematics at A Level (MacInnes, 2014). The most recent experience many undergraduates have of maths and statistics is GCSE-level study. Moreover, an Organisation for Economic Co-operation and Development report on skills in England found one in 10 university students has low basic numeracy and recommends universities pay greater attention in their teaching to numeracy development (Kuczera et al., 2016: 49).
At the first-year undergraduate level, there is, therefore, a need to develop basic quantitative skills. The inspiration for the project came from teaching experiences where some learners were finding reading tables and graphs very challenging. This has also been found in research; for example, Lem at al. (2013) explain how the interpretation of graphs such as histograms and box plots is not always easy for students.
To embed QMs into the first-year curriculum, the project undertook activity in two areas. Firstly, it explored how psephology can be used in learning resources to embed quantitative skills and methods. Psephology is the analysis of voting and opinion poll data. This constitutes the substantiate subject knowledge within which the quantitative skills development could be embedded by ‘stealth’. Secondly, it involved exploring how active learning pedagogies could be used in the development of teaching materials to provide students with some ‘hands on learning’.
This project was, therefore, situated at the intersection of three themes: a study of psephology; embedding QMs into the curriculum; and developing teaching approaches using active learning pedagogies.
The intended impact of the project was to enhance student learning in four areas. Firstly, to enable learners to be better consumers of published research and appreciate the full range of academic literature, including understanding the role of data analysis as it appears in publications involving QMs. Many political science graduates may never produce their own research, but being an effective consumer of research is an important generic transferable skill. Secondly, to help students be more confident and competent in reading tables, maps, graphs and charts through improved understanding of analysis and representation. Thirdly, to improve student perceptions of QMs and overcome the aversion, alienation and anxiety by demonstrating how they are a useful and relevant part of their studies. Fourthly, to improve student awareness of the data sources that exist, the organisations that collect it and how quantitative evidence is used in decision-making both within political parties and government (and indirectly the graduate careers requiring quantitative skills).
Wagner et al. (2011), based on their extensive survey of the literature in teaching research methods across the social sciences, identified themes in need of substantial theoretical and empirical treatment. These included, firstly, a discussion of the role and desirable characteristics of a research methods teacher, and secondly an analysis of the challenges of teaching and learning specific aspects of research methods (Wagner et al., 2011: 82). This paper also seeks to address these two themes and contribute to the research methods teaching debate.
Methods teaching in political science
Despite the low esteem of QMs, US academics Andersen and Harsell (2005) explain why they are an important feature of the political science curriculum: A critical part of a good liberal arts education consists of analytical and quantitative skills. Being able to read and evaluate claims made on the basis of statistical evidence and being able to use quantitative data to answer questions and draw conclusions are skills that will benefit students in their careers, in future studies, and as citizens in an increasingly data-saturated world. (Andersen and Harsell, 2005: 17)
Several studies identify the lack of quantitative courses offered to political science students, while others observe the questionable or lamentable quality of such provision where it is offered (Hill, 2002; Parker, 2010; Schwartz-Shea, 2003; Thies and Hogan, 2005). Many of the challenges facing the social sciences outlined above are widely reported in the political science community. For example, several studies on undergraduate methods highlight the problem of ‘statistical anxiety’, which leads to an inability to acquire quantitative skills (Adriaensen et al., 2014; Lewis-Beck, 2001). Another criticism is how students often feel alienated by the lack of clear connections between methods and the subject knowledge they encounter in the rest of their degree. For example, Ryan et al. (2014) argue that student dissatisfaction with undergraduate research methods courses in politics is common and suggest methods teaching suffers from an unhealthy disassociation between research in theory and research in practice.
Solutions to overcome the problems have also been presented in the political science literature. Adeney and Carey (2009: 198) identify that ‘the most effective way to teach research methods is to ensure that the course is not a stand-alone one, but is integrated into the ethos of the department’. Furthermore, Leston-Bandeira (2013) advocates a discipline-embedded research-oriented approach where students have a sense of ownership in their learning process to ensure student engagement. To provide greater connectivity between research in theory and research in practice, Page (2015) deployed ‘an apprenticeship approach’ to teaching political science methods by engaging students in a research project. The proposed benefits of integrated approaches such as this include developing students as researchers and problems solvers and fostering a ‘research culture’ in the undergraduate curriculum (Garde-Hansen and Calvert, 2007).
Active learning pedagogies
As a teaching method, the project adopted active learning pedagogies, which are informed by ‘constructivist learning theory’ where learners ‘construct’ knowledge through their own activities. Leston-Bandeira (2012) identifies that there is no one definition of active learning; however, put simply, ‘active learning is learning by doing; it is not simply about just doing an activity though it requires a process of thought in the way the activity is conducted and applied by the learner’ (Leston-Bandeira, 2012: 54). Active learning pedagogies place the student at the centre of the learning process where they are ‘active’ – as opposed to ‘passive’ – learners. This contrasts with ‘didactic’ forms of learning, such as listening to and watching formal lectures (Carr et al., 2015).
Student engagement, experience and reflection characterise active learning, which may develop academic skills such as analysis, synthesis and evaluation. Active learning can be incorporated into classes to foster interaction and encourage self-directed learning. Studies such as Wolff et al. (2015: 85) find this to be effective in ‘delivering core knowledge, contextualizing content, and explaining difficult concepts, leading to increased learning’. Furthermore, Graffam (2007: 38) argues ‘active learning pedagogies change the nature of learning, while simultaneously improving knowledge gain and recall abilities. Students find the work more interesting and thereby put more effort into it.’
Active learning pedagogies are often justified by the much cited Learning Pyramid (Figure 1). This suggests active learning leads to greater learner knowledge retention compared to more passive styles of delivery, such as lectures. However, the Learning Pyramid is a diagrammatic simplification based on a disputed assertion; its critics contend it is a widely cited yet unsubstantiated myth. The claim that certain teaching methods are associated with a corresponding hierarchy of student retention has been questioned by research (see Lalley and Miller, 2007; Letrud and Hernes, 2016; Masters 2013, for example).

The Learning Pyramid.
The contested debate regarding the effectiveness of different teaching methods reminds us that a case can be made for both didactic and active pedagogies. Considering this, in this volume Gunn (2017) argues rather than arbitrarily favouring one over the other, teachers should make an informed choice based on their specific context. This may entail using a combination of both didactic and active pedagogies. This involves the teacher exercising professional judgement to select the most suitable pedagogies from the full range of instructional methods available to them.
Active learning pedagogies are not a panacea and they need not replace more didactic forms of teaching. However, they do have a role in complementing more established didactic modes of delivery and can provide a solution to specific teaching problems. Active learning is not always appropriate or effective; it needs to be delivered in a way that actually improves learning. Although active learning is student-centred, is must be remembered there is a large role for the instructor. Two useful tools for teachers of active learning are scaffolding and teaching objects.
In a study of active learning, Schmidt et al. (2011) explain how ‘tutors also play active roles in the scaffolding of student learning by providing a framework that students can use to construct knowledge on their own’ (Schmidt et al., 2011: 797). This ‘scaffolding’ can be either ‘soft’ or ‘hard’. Soft scaffolds include tutor interventions and actions that support specific learner needs as they arise. In contrast, hard scaffolds are usually developed in advance, based on expected learner difficulties associated with a task, including cognitive tools, such as instructions or worksheets (Schmidt et al., 2011: 797).
Cooperstein and Kocevar-Weidinger (2004) provide an example of scaffolding, drawing on Vygotsky’s (1978) work on supportive frameworks, to ensure requisite learning. This involves imposing a directive structure to guide students through a series of small steps, which carefully fit together, to the appropriate discoveries. However, an important consideration is striking the right balance between teacher direction and learner discovery. For example, Rotgans and Schmidt (2011) developed a form of scaffolding to provide students, on the one hand, a structure for their learning, and on the other, the confidence so they can master a topic on their own.
When developing the scaffolding to house active learning, teaching objects are also a useful tool to consider. Alford and Brock (2014) define a teaching object as follows: Anything that is set up to constitute or prompt the subject matter of an interactive teaching session.…What makes them objects is that they have been chosen and unveiled, and are discussed with students, with particular teaching purposes, concepts, and processes in mind. (Alford and Brock, 2014: 145)
In the context of political science, there is a small quantity of literature concerning active learning pedagogies. The project reviewed this literature to identify and benchmark established best practice. One example, Damron and Mott (2005), uses developments in interactive classroom voting technology to promote student engagement. This study argues improved engagement yields benefits including ownership of the material, the development of higher level cognitive skills and increased retention.
In 2005, Gershkoff concluded that while many subfields of political science ‘have implemented pedagogical innovations such as seminar-style discussion, simulations, and even learning communities, QMs courses seem to be the last hold-out for the traditional lecture format’ (Gershkoff, 2005: 299). However, over the past decade some progress has been made. An example of active learning pedagogies being used in research methods teaching is provided by Howard and Brady (2015), who find it highly applicable across a variety of different methods courses. Following the ‘critical turn in the social sciences’, Howard and Brady argue that constructivist learning theory: …is of particular value for teaching introductory social-scientific methodology courses in contexts where students are coming to the course material with a strong degree of scepticism about empirical research. A constructivist approach to teaching methods helps address the concerns of critically inclined students while also catering for the preferences of students interested in traditional methodologies. It foregrounds students’ existing anxieties and assumptions about learning social research methods, and empowers them to choose the methodological approaches that fit their academic needs and intellectual priorities. (Howard and Brady, 2015: 512)
Berry and Robinson (2012) also provide an example where constructivist pedagogical principles have guided the development of teaching activities. This study from the USA uses exit polls (surveys of a small percentage of voters taken after they leave their voting place) and survey research as a form of experiential learning, which is similar to active learning. The authors conclude that the ‘class exit poll can be an innovative way to excite students about research methods and about election dynamics’ (Berry and Robinson, 2012: 505). Their study builds upon Lelieveldt and Rossen (2009), who describe exit polls as a ‘perfect teaching tool’, as they help students connect theory, methodology and the substantive curriculum. Although these approaches differ from this project – as they focus on team working with peers, survey design and collecting data – they illustrate how polling data is highly suitable as a teaching tool.
Psephology
Psephology is a branch of political science that considers the statistical analysis of elections and polls. The term psephology was coined by Oxford academic RB McCallum, who wanted a word to describe the study of elections, which was a kind of political study about which he felt not enough was known. Psephology comes from the Greek word psephos, a pebble, which was the mode in which the ancient Athenians cast their vote (McCallum, 1954: 508). Those who practice psephology are called psephologists and they handle a range of data, including breakdowns of historical voting data, public opinion polls and campaign spending data.
The project undertook a comprehensive mapping of the various sources of voting and opinion poll data available that can be harnessed as a teaching resource. As this project was based in the UK, the teaching materials developed were about British politics, focusing on elections for the Westminster Parliament. A significant source of data is the British Election Study (BES) series, which is funded by the ESRC. It has been conducted at every General Election since 1964 and constitutes the longest academic series of nationally representative probability sample surveys. The study has existed for over 50 years, although has gone under various different names: Political Change in Britain (1963–1970); the BES (1974–1983); the British General Election Study (BGES) (1983–1997); and finally the BES (2001 onwards) again. Its main goal is to describe and to explain why people vote, why they vote as they do, what affects the outcome and the consequences for democracy in Britain. Besides the main election surveys, other datasets have also been produced that explore the changing determinants of electoral behaviour in Britain.
The largest commercial polling companies in the UK undertaking political analysis are ICM, YouGov, ComRes, Ipsos MORI and Populus. A key strength of polling data is the topical nature of the information, which relates to contemporary events. Reputable polling companies adhere to the guidelines of the British Polling Council (BPC) (http://www.britishpollingcouncil.org/).
Some of the work pollsters do is confidential to the client who funded it; however, a great deal is freely available. The BPC protocols mean that once the results of a poll are in the public domain, polling companies publish the details of the survey on their own website within two working days. This information includes a full description of the sampling procedures; computer tables showing the exact questions asked in the order they were asked; all response codes and the weighted and unweighted bases for all demographics and other data that has been published; and a description of the weighting procedures employed, including weighted and unweighted figures for all variables (demographic or otherwise) used to weight the data, whether or not such breakdowns appear in any analysis of subsamples.
The BPC’s standards of disclosure advance the understanding of how polls are conducted and how to interpret the results. The high level of transparency and integrity guiding the British polling industry means that a range of high-quality data is openly accessible for teachers and students on polling companies’ websites. Some of the websites also provide historic data, ideal for investigating changes over time or comparing the current government with previous ones. For example, Ipsos MORI maintains a freely available archive of opinion polls and public attitude research from 1970 onwards. This contains data on a wide range of social and political trends, including the monarchy, Europe, party leaders, the constitution and campaign effectiveness.
To obtain BES data, the British Election Studies Information System (BESIS) (http://www.besis.org) provides a facility for online analysis and download of BES data, including mapping of election results by constituency. Registration is required to use the system, and once registered, users may undertake a range of analysis, including recoding, merging and subsetting of data and basic statistical testing.
Another source of information is NatCen’s British Social Attitudes Survey (http://www.natcen.ac.uk). Each year, the survey asks over 3000 people what it is like to live in Britain and what they think about how Britain is governed. Since 1983 it has measured and tracked changes in social, political and moral attitudes. Examples include views towards public trust in government and taxation levels and spending priorities. A new website of results is developed every year and a large range of data is available across the full three decades.
The UK Data Service (http://ukdataservice.ac.uk/) provides access to the BES and the British Social Attitudes Survey. The UK Data Service is a comprehensive resource funded by the ESRC providing a single searchable access point to high-quality social and economic data (UK Data Service, 2014). The service is freely available to UK Higher Education institutions, although registration is required. The UK Data Service is developing further teaching resources and these can be accessed via http://ukdataservice.ac.uk/use-data/teaching.aspx. NESSTAR is the online data exploration portal in the UK Data Service. This is particularly useful for the British Social Attitudes Survey as it contains the data in a highly accessible and user-friendly format. For example, it is possible to select and download a subset of British Social Attitudes Survey data tailored to the specific issue being explored. NESSTAR enables those without any knowledge of statistical packages to undertake simple analysis online.
Developing learning materials
The next step for the project involved devising new learning materials. The objective of enhancing student learning – in the four areas identified above – provided the specification to which the learning materials were configured. The activities were designed to be ‘student-centred’ and were informed by the literature on active learning. However, to provide sufficient steering, the activities also included ‘scaffolding’ and made use of ‘teaching objects’.
The project aimed ‘to develop a pedagogy for psephology’. This involved devising effective ways of not only teaching psephology but also recreating the experiences of ‘being a psephologist’ as a learning experience to develop quantitative skills and to embed the QMs into the substantive curriculum. Psephology provides a good opportunity for hands on data handling on the part of the learners and an opportunity to develop active learning activities on the part of teachers. It is ideal for developing quantitative skills because of the large quantity of up-to-date ‘real world’ data that can be directly embedded into the curriculum. Many of the studies psephologists undertake provide a real world context for data analysis and links to debates within the wider discipline. For example, a study of voter behaviour leads directly to discussion on the performance of various parties.
Content was sourced from both polling and electoral datasets, as introduced above, alongside a selection of published research articles. A series of questions and activities were devised with a strong and succinct connection to subject knowledge. The activities were ‘QMs by stealth’, as the analysis of data was surreptitiously submerged in discussion based on subject knowledge. For this reason, ethical issues were considered and full ethics committee approval was obtained. While some forms of what we describe as active learning have always been present in political science teaching, the project looked beyond mere class debates to consider the whole learning process and the role of more interactive, collaborative and student-centred approaches.
The range of potential activities is vast and varied. Polling data is wide ranging, including voting outcomes, perceptions of party leadership and the views of voters on a range of issues. Much of this data can be broken down by variables such as class, age, gender and geography. There is a need, therefore, for some selection. Critical issues when developing the learning materials are firstly how extensive and secondly how advanced they should be. How these two issues should be addressed depends on the specific context where the activities would be used.
Considering the first point, there are many interesting aspects to psephology that can produce several different teaching resources of differing size. For example, how polling companies operate is interesting in its own right, as it illustrates how research is done in a private sector setting. Moreover, a study of polling company methodology contains many valuable lessons for potential researchers, such as the methods of collection (face to face, internet, telephone), ensuring polls are demographically and politically representative, and the tendency of some voters not to reveal a party preference they perceive to be unpopular or unfashionable, which is overcome by the ‘spiral of silence’ weighting. Alternatively, the teaching material may merely focus on the outputs of the data collected by the polling company. The datasets can be selected to match the concept and theories in the subject knowledge to investigate in practice.
The second point considers the level of skills and the depth of statistical analysis to be developed. When selecting items for inclusion and developing questions for learning materials, we need to be clear and consistently guided by the goal of which skills are to be developed and which QMs are to be introduced. For example, there are different skills in understanding the outputs of quantitative analysis and being able to undertake the same analysis yourself. There are also a range of techniques that need to be introduced incrementally. For example, the most effective presentation of data, histograms, box plots and geographical mapping are more straightforward than means, standard deviations and decision-making using hypothesis tests. More advanced skills include being able to identify the results of a simple and multiple regression and fully understand what they mean.
Some prototype learning materials were developed based on the UK 2010 General Election and piloted with students. The activities include mainly interpreting data but also data handling, analysis and presentation. Students would gain some hands on experience of ‘being psephologists’, which is part of the process of them using QMs by stealth. The learning activities developed comprised three types, which are set out below. These three sets of activities illustrate the different routes students can take when learning QMs. The first type of activity was based on data the tutor had selected, analysed and presented where the student had to identify the main features and interpret the trends. A series of questions were devised for students to answer using the data presented. These learning materials provided the ‘hard scaffolding’ to guide the learning. The literature on how to teach statistics (Gelman and Nolan, 2002, for example) can provide suggestions on how to design the exercises. As in the example below, basic quantitative skills can be taught by stealth, hidden in a study of different electoral systems. Table 1 shows the estimated number of seats there would be under proportional representation (PR Seats). Students can compare how this varies to actual numbers of seats under first past the post (FPTP Seats). Another example was assessing historical trends, such as voter turnout over time as presented in graphs and tables with rows and columns. The activities sought to develop the skills of understanding data presented in a wide range of visual formats. For example, data by parliamentary constituencies can be displayed on maps. Another type of activity involves students seeking out their own trends and finding interesting facts by undertaking some of their own analysis. These types of activities, which are a form of active learning, can enable students to follow their own curiosity. Students may look at the percentage swings from one party to another between elections, or investigate the diverse factors that influence vote choice. Questions to investigate such as these can be triggered by the use of a teaching object. For example, a newspaper clipping or a news video clip may provide political context and identify a series of current debates that can be investigated in data. Data can be sourced directly from polling company’s websites or the BES and the British Social Attitudes Survey. To make this slightly more user-friendly, students can be provided with clean and tidy datasets; although ‘real’ research data may not be complete and produce clear results, this is not so much of an issue as this is an entry-level teaching resource. With the data students can investigate if theory can be found in practice. For example, an investigation of how trends in actual electoral data match up to theories in the literature, that is, voting can be accounted for by expressive/social class or instrumental/rational actor explanations. This can be partly driven by student curiosity as they try to find how powerful certain variables (for instance age, gender, socioeconomic status) are in explaining voting behaviour at a particular election. Students can then make a judgement based on what they have found and write a statement based on the data. Students can also be provided with the opportunity to use relevant statistical exercises. For instance, psephology readily lends itself to discriminant function analysis. This is used to determine which variables discriminate between two or more naturally occurring groups. Using discriminant function analysis, students can discern the issues voters use to select their candidates and identify which variable(s) are the best predictors of subsequent voter choices. Analysis such as this enables students to clearly see the purpose of statistics. Another aim of the project was to enable students to understand data analysis as it appears in published peer reviewed articles. This involves students looking at a journal article and then reading and interpreting the quantitative analysis as it appears in this format. The tutor can select the articles to be studied and then, as a form of soft scaffolding, intervene to answer questions as they arise. Students get to see examples of how data has been used and presented in existing British politics research. Learning activities such as this are a useful way of introducing students to more advanced statistical analysis for the first time. As this is teaching material, journal articles can be selected on how they explain their method and present their data, rather than their conclusion or contribution to knowledge. For example, consider the following: Denver’s (2010) article ‘How Britain voted’ contains an analysis of the 2010 election containing a wide range of graphs and tables. The article can develop basic skills, such as reading percentage changes in a table and looking at line graphs through to more advanced analysis using bivariate correlations. Clarke et al.’s (2011) ‘Valence politics and electoral choice in Britain’ provides an example of research on data gathered in the Campaign Internet Panel Survey that was conducted as part of the 2010 BES. It provides an illustration of the potential of BES data alongside developing skills of reading the data presented in the article. Johns and Shephard (2011) provide an example of when there are no clear pointers from theory or previous empirical research, hypothesis testing can be used. The paper works through a series of hypotheses to investigate if photographs of politicians can influence electoral preferences. The research uses YouGov’s 150,000 panel members as the sample and therefore is an excellent example of academic research involving a commercial polling company. A study by Arzheimer and Evans (2012) uses constituency data taken from the British General Election of 2010 and the British Election Survey, together with geographical data from Ordnance Survey and Royal Mail. The study uses a conditional logit model to investigate if candidates living closer to a voter have a greater probability of receiving that individual’s support.
United Kingdom General Election Results 2010.
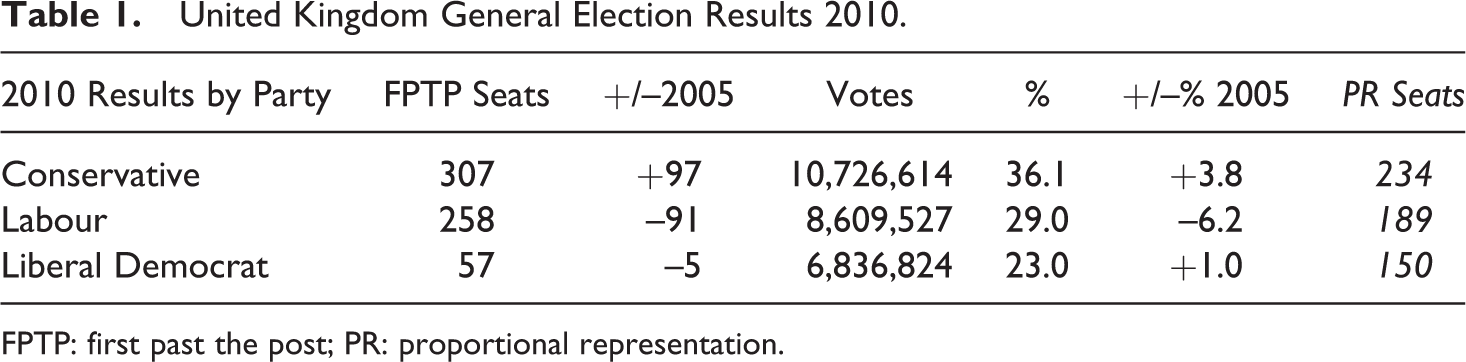
FPTP: first past the post; PR: proportional representation.
Curriculum design
As identified above, this project investigates not why to embed but how to embed QMs. With this in mind, the findings of the project lead us to recommend a holistic model of the learning and teaching experience, as displayed in Figure 2. This can be used in one component of a module/course. The project started from the assumption that teaching election data entirely by traditional lectures has many limitations and is not the optimum method. Merely reading out lists of data to students in a lecture theatre is not very effective. The project therefore advocates a model of learning where active learning pedagogies sit alongside, complementing not replacing, didactic teaching methods. Figure 2 explains how the component parts of the teaching learning experience ‘fit together’. It identifies the role of the active learning pedagogies that are used for data analysis. In the diagram, a traditional lecture comes first to provide students with the theories and concepts. This is supplemented by private reading time. The psephology activities can then be used for the seminar/tutorial based on active learning pedagogies.
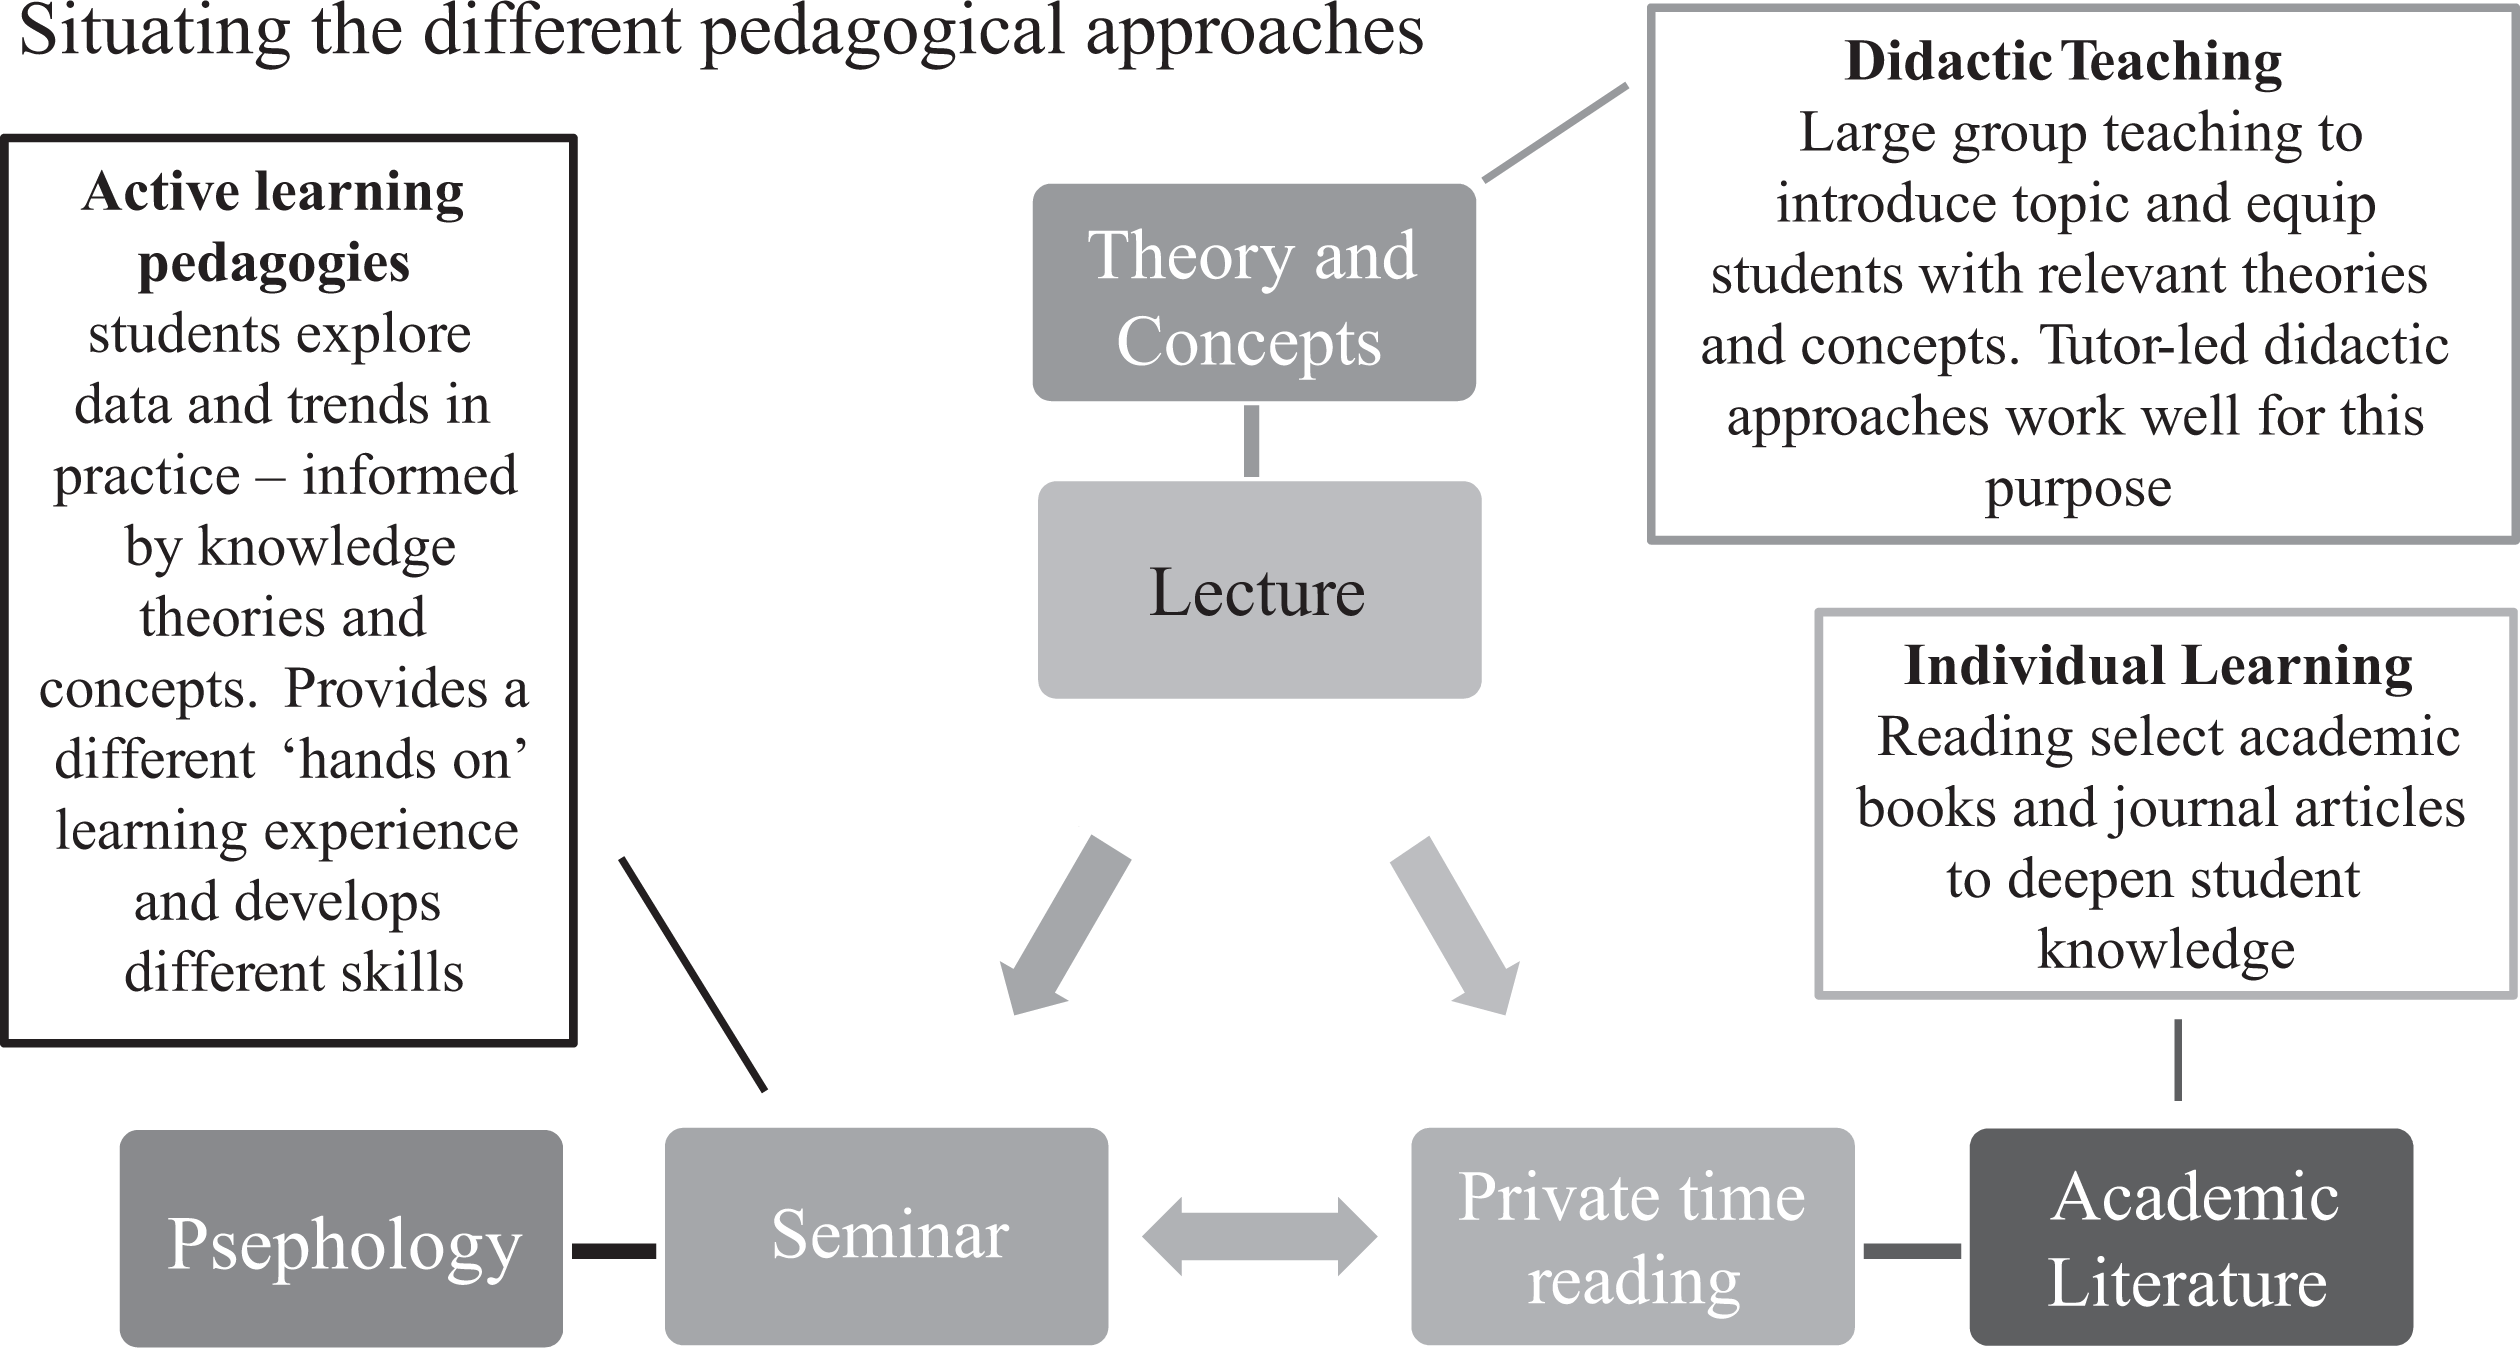
The whole learning and teaching experience.
It is worth noting that academic studies in mathematics and statistics education indicate introducing active learning activities (such as simulations and practical work) before, rather than after instruction (the lectures or reading) results in better learning outcomes (Westermann and Rummel, 2012). This is where the active learning prior to instruction can prepare students to benefit from a deeper understanding during subsequent instruction (Kester et al., 2004; Likourezos and Kalyuga, 2014). This raises an interesting question regarding the sequence students undertake the three activities in Figure 2. This project has worked on the assumption that the lecture comes first; therefore, students have been introduced to the theories and concepts before the practical data analysis activities. However, an alternative sequence is possible. The use of active learning before didactic teaching could be explored more thoroughly by replicating the ‘instructional design’ research undertaken in the sciences in the social sciences.
In addition to embedding QMs into a component of the first-year curriculum, there is the separate issue of progression across each year of the degree. This project – concerned with embedding QMs by stealth with subject knowledge for first-year undergraduates – is dealing with the first of what should be several steps. Good practice in quality assurance undergraduate programme design would see the QMs agenda incrementally unfold throughout a programme of study, where there is accumulation and progression building on the previous knowledge and skills. This requires thinking holistically about the design of learning experience across the entire degree programme (Gunn, 2017). To make this process clearer, Tariq et al. (2004) developed a tool for auditing key skills and career/employability skills within individual modules and mapping these skills across a degree programme. The auditing and mapping tool could offer support to help identify skills development and progression across several stages, resulting in a more evolutionary approach to embedding QMs.
Evaluation of the learning materials
Pilot activities were undertaken, including a dialogue with students to gain their views and feedback. This produced a number of interesting findings, some of which were anticipated and others more unexpected. The primary purpose of this paper is to explain the development of new learning materials and the ideas that informed them. The section that follows is merely a concise summary of an indicative initial evaluation of student views. What students valued most about the session varied; the three main themes are as follows.
Firstly, students responded very positively to the activities being related to contemporary events and were therefore perceived as being relevant and interesting. Students valued the opportunity to do something that they saw as being grounded in present day reality. They were also able to see data that had not yet appeared in text books because of the time delay in academic publishing. Whereas there is a time lag in journals and books, polling data is ‘instant data’, enabling some taught content to follow current changing political phenomena. The following quote extracts encapsulates these views: The data was based on recent events and the last general election. So it was about the current parliament. Some of the data in the reading isn’t really relevant as it’s so old. The analysis of current events made it more useful. Looking at the election data was interesting as it was a change from the usual seminars and lectures. …it’s interactive…provide the data and we can find the trends. …it’s not like sitting in the library or lecture theatre, we actually get to do something practical. …being able do something real and able to apply the theories into real life. I’m now better at understanding articles with data tables in as I’m more familiar with them. I can now see why British politics articles have statistics in them. I know where the polling and election data comes from.
There are also three main observations from the tutor, as a reflective teacher, which were as follows. Firstly, the activities were successful at being ‘self-sustaining’; for instance, where the data raised further questions that the students sought to answer. The activities fostered a spirit of enquiry and investigation as students found trends in data they were not aware of. Secondly, in the class the tutor was merely guiding the process not delivering knowledge, although some explanation and support were required as a form of soft scaffolding. Thirdly, at the start of the one of the sessions students went into self-imposed exam conditions. After a period of time this silence was gradually broken. This observation raises the interesting question of how the active learning activities are used as individual or group work. All three types of activities identified above work well as collaborative activities where students can discuss and debate in pairs or small groups.
The indicative results presented here corroborate other studies in the literature. However, only limited conclusions can be drawn from this snapshot, based on a small sample size that identifies the need for further work. More thorough evaluations of learning experiences could identify the extent to which students have developed quantitative skills, have become more independent learners and discerning consumers of research, while having more positive attitudes towards QMs. Student evaluation is particularly important, as it can inform further refinement of the learning activities. This can include adjusting the organisation and scale of the scaffolding and achieving the most effective balance between teacher-centred and student-centred approaches.
There are also two other issues arising from the study to consider. The first concerns the focus on first-year undergraduates and introductory-level skills. This raises a series of questions, such as how can we inspire students and communicate the value of QMs in an accessible and non-threatening way whilst maintaining a level of substance. This relates to a series of connected questions, including ascertaining students’ prior knowledge, the identification of student needs and how these can be met, and what level to pitch the content at. There needs to be some consideration of the diverse range of prior skills in the student cohort being taught. There is also the challenge of getting the students started and then finding a way of moving students beyond the basics.
The second critical issue is the mode of delivery. Are the activities best delivered in a computer lab or classroom setting? The project intended to provide suitable ‘real world’ teaching ideas for lectures/seminars and/or computer laboratory-style classes. There are relative merits to both formats. In a classroom setting activities can be printed off and then completed in a computer-free seminar room. Students can annotate the materials using traditional pen and paper. This classroom approach is obviously more restricted in terms of the analysis students can undertake and is therefore more suited to learning to read the outputs of existing quantitative analysis rather than being able to undertake their own analysis.
Computer laboratory-style classes offer more opportunity for data analysis; however, there are several drawbacks to consider. The use of statistical software packages (such as Excel, SPSS or STATA) in a computer lab fundamentally alters the learning experience, as attention immediately shifts from the data and its context towards the specifics of the software. A large amount of time can be consumed locating the different functions across the toolbars, tabs, ribbons and dropdown menus on the software, which can be a distraction. The activities can therefore become about using SPSS and not about the substantive content. A key challenge is maintaining the emphasis on what is being taught, and not supplanting the primary purpose of the activity with learning the software. Finally, how the software can be used depends upon the level of prior experience and competency students have with it.
However, software presents many interesting possibilities. There are more complex and specialist packages that assume prior knowledge and require more time for students to familiarise themselves with how they work. For example, spatial software, more frequently used by geographers such as QGIS, can be used to create maps. QGIS is a free and open source desktop geographic information systems application that provides data viewing, editing and analysis capabilities enabling mapping with many layers using different map projections of geographical data across the UK.
Conclusion
This paper describes a pedagogic research project that can be summarised as having the following five distinctive characteristics. Firstly, it introduces the idea of embedding QMs by stealth, through their complete submersion within the substantive curriculum, as a solution to some of the problems that afflict research methods education. Secondly, it focuses on the introductory-level skills of first-year undergraduates, which are regarded as the first step in a longer trajectory of learning. Thirdly, it highlights the need communicate the value and relevance of QMs, rather than simply assuming students will identify with them. Fourthly, the project shows how to simultaneously use a symbiotic combination of active and didactic pedagogies when devising new learning experiences. Fifthly, the project develops a ‘pedagogy for psephology’, which includes simulating the experiences of ‘being a psephologist’ as a learning experience in a way that develops quantitative skills.
In a discussion of these five features, this paper has contributed to the growing body of scholarship on pedagogic research for research methods instruction in the social sciences. Some of the issues raised in this paper are highly specific to the project developed for political science students; for example, the use of election and polling data. Although this study was about British politics, the UK data and the associated debates could easily be substituted for the national politics of the country being studied. Moreover, many of the other issues raised potentially have wider applicability across the social sciences, namely the following: the rationale for focusing on introductory-level skills; the idea of embedding by stealth; and the integration of didactic and active pedagogies supported by teaching objects and scaffolding.
This paper has explored some of the challenges of teaching specific aspects of research methods, within the disciplinary context of political science. A particular challenge is how to effectively embed QMs. The idea of embedding by stealth provides a workable teaching strategy, although it would only be suitable in some contexts. Through the discussion of the development of new learning materials, and the ideas that informed them, this paper also identified the role and desirable characteristics of a research methods teacher. An important attribute is the ability to know the student audience, to be aware of the full range of possible pedagogical approaches, and then select the most appropriate teaching strategy for that context.
Footnotes
Declaration of conflicting interests
The author declared no potential conflicts of interest with respect to the research, authorship and/or publication of this article.
Funding
The author disclosed receipt of the following financial support for the research, authorship and/or publication of this article: This work was supported by the Higher Education Academy [Grant Number GEN1001].