
Abstract
More than four decades of research on instructional pacing has yielded varying and, in some cases, conflicting findings. The purpose of this meta-analysis was to synthesize single-case research design (SCRD) studies on instructional pacing to determine the relative benefits of brisker or slower pacing. Participants were children and youth with and without disabilities in educational settings, excluding higher education. Tau-U, a non-parametric statistic for analyzing data in SCRD studies, was used to determine effect size estimates. The article extraction yielded 13 instructional pacing studies meeting contemporary standards for high quality SCRD research. Eleven of the 13 studies reported small to large magnitude effects when two or more pacing parameters were compared, suggesting that instructional pacing is a robust instructional variable. Brisker instructional pacing with brief inter-trial interval (ITI) produced small increases in correct responding and medium to large reductions in challenging behavior compared with extended ITI. Slower instructional pacing with extended wait-time produced small increases in correct responding, but also produced small increases in challenging behavior compared with brief wait-time. Neither brief ITI nor extended wait-time meets recently established thresholds for evidence-based practice, highlighting the need for further instructional pacing research.
Keywords
Instructional pacing has been a topic of research, discussion, and debate in education and special education for more than four decades (Carnine, 1976; Heward, 1994, 2003; Rowe, 1974; Roxburgh & Carbone, 2013; Tobin, 1980). Based on B. F. Skinner’s (1938) concept of the three-term contingency, Heward (1994) defines instructional pacing as the degree to which the teacher manipulates temporal dimensions of the learning trial, including two key variables: wait-time and inter-trial interval (ITI). Wait-time is the duration between the antecedent instructional stimulus and student response; ITI is the duration between teacher feedback and the next antecedent instructional stimulus. Manipulation of these two variables, it is argued, has significant effects on student participation and performance (Heward, 2003; Rowe, 1986).
Seminal instructional pacing studies by Rowe (1974) and Carnine (1976) were touchstones for subsequent research on the topic as investigators sought to determine optimal parameters for pacing given various student populations and curricular areas (e.g., Carnine, 1976; Heward, 1994, 2003; Rowe, 1974; Roxburgh & Carbone, 2013; Tobin, 1980). Rowe examined the effect of 1-s and 3-s wait-time on response length and frequency of appropriate responses of elementary students during science instruction, reporting that slower pacing with 3-s wait-time produced greater response lengths and higher frequencies of appropriate responses than faster pacing with 1-s wait-time. In contrast, Carnine (1976), who compared 0-s ITI with 5-s ITI, found that faster pacing with 0-s ITI increased correct responding and participation and decreased off-task behavior of two low-achieving first-grade students during reading instruction.
Although a fair amount of research has been done following Rowe’s and Carnine’s seminal studies (e.g., Englert, 1984; Sterling, Robinson, & Skinner, 1997; Tincani, Ernsbarger, Harrison, & Heward, 2005; Tobin, 1987), little consensus exists on optimal parameters of instructional pacing for classroom settings. However, two prominent views have emerged: one in favor of slower instructional pacing following Rowe’s (1974) work, and another in favor of brisker instructional pacing following Carnine’s (1976) work. Proponents of slower instructional pacing suggest that a slower pace allows for higher-level responses by providing adequate time to process before responding (e.g., Klingner, Vaughn, & Boardman, 2015; Rowe, 1974; Stahl, 1994; Tobin, 1980; Zepeda, 2014). In one example, Rowe (1986) evaluated audio recordings of high school biology classes and elementary science classes. All but three of the recordings had a consistent wait-time of 1-s, on average; the other three recordings had a wait-time of 3- to 5-s, on average. Rowe observed longer student responses, more questions from students, a wider variety of students participating, more student-initiated comments, and fewer instances of failure to respond with longer, 3- to 5-s wait-times.
In contrast, some suggest that a brisker pace of instruction may improve academic and behavioral performance. Grobe and Pettibone (1975) found a positive correlation between college instructors’ talk rate and students’ attentive behavior. Duell (1994) found significantly more correct student responses to higher-level questions during college lectures with 3-s wait-time compared with 6-s wait-time.
Similarly, Heward (2003) asserts that students with disabilities or other learning problems are actually harmed by slower paced instruction, which, he contends, leads to lowered academic expectations and poorer instructional performance. His contention is supported by some research showing that students with disabilities or other learning problems who receive instruction with brief ITI have higher levels of participation and accuracy and lower levels of challenging behavior (e.g., Carnine, 1976; Koegel, Dunlap, & Dyer, 1980) and other research showing that students with disabilities benefit from increased rates of opportunity to respond (OTR; Hall, Delquadri, Greewood, & Thurston, 1982), which can be afforded through fast-paced teaching (e.g., Tincani et al., 2005).
Carbone, Morgenstern, Kolberg, and Zecchin-Tirri (2010) suggest that fast-paced instruction with brief ITI serves as an abolishing operation for escape-maintained challenging behavior of children with autism, thereby increasing their participation and correct responding. However, other research suggests that students with disabilities who are impulsive responders benefit from slower instructional pacing afforded by longer wait-times, which provide them with more opportunity to attend to instructional stimuli (Klingner et al., 2015; Rowe, 1974; Stahl, 1994; Tobin, 1980; Zepeda, 2014). Similarly, Tobin (1987) suggests that when new and/or complex information is being taught, a slower pace with longer pauses provides needed processing time, both for the teacher in formulating the next thought and for the student to retain the new information.
Students with disabilities and related learning problems benefit most from educational practices that are based in sound empirical evidence (Odom et al., 2005). The majority of studies on instructional pacing focusing on students with disabilities and learning difficulties have used single-case research designs (SCRD), yet it is unknown whether these studies conform to contemporary standards of high quality SCRD research (Horner et al., 2005; Kratochwill et al., 2013) and, consequently, whether sound conclusions can be drawn from the existing research literature. To date, there has been no systematic review of pacing research to evaluate quality of SCRD studies, to highlight salient findings, and to confirm (or disconfirm) differing perspectives on the benefits of instructional pacing as evidence-based practice.
Meta-analysis is the process of statistically combining results of separate research studies to answer specific research questions (e.g., Is Intervention X more effective than Intervention Y?; Kavale & Glass, 1981). In research areas where individual studies have yielded varied and conflicting results, meta-analyses can be particularly useful in determining aggregated effects of an intervention across a larger pool of participants. Recent advances in statistical analysis have led to development of non-parametric statistical tests that enable researchers to determine effect size estimates from SCRD data (Parker & Vannest, 2009; Parker, Vannest, Davis, & Sauber, 2011). In turn, these non-parametric tests can be used to perform meta-analysis of interventions that have been evaluated with series of SCRD studies, including analyses of the effects of moderating variables on intervention outcomes (Roth, Gillis, & DiGennaro Reed, 2014; Walker & Snell, 2013; Whalon, Conroy, Martinez, & Werch, 2015). Given varied findings from the pacing literature, the purpose of this meta-analysis is to quantitatively summarize SCRD research on instructional pacing. Specifically, the following research questions are addressed:
Procedures
The meta-analysis was comprised of three steps, an article extraction and preliminary review, a quality assessment and article summary, and an effect size estimation. First, relevant databases were searched using terms to yield peer-reviewed research articles on instructional pacing in educational settings. The resulting articles were reviewed to determine whether they met inclusion criteria and, if so, each received a quality assessment to determine whether the study met contemporary standards for high-quality SCRD research. Articles meeting at least adequate standards for high-quality SCRD research were summarized and then subjected to effect size estimations using Tau-U, a non-parametric statistic appropriate for estimating effect size in SCRD studies (Parker et al., 2011).
Article Extraction and Preliminary Review
As the overall purpose of the study was to examine research on instructional pacing, articles had to meet the following criteria to be included in the review. First, to ensure that all reviewed studies had been subjected to peer review, each study had to be an article published in a refereed journal, as opposed to an unpublished dissertation, thesis, book chapter, or other publication. Second, each study had to actively manipulate a clearly defined pacing variable, such as wait-time, ITI, or rate of instructional stimulus presentation, as an independent variable. Studies that simultaneously manipulated a pacing variable with one or more different intervention variables (e.g., reinforcement) were excluded from review as the differential effects of pacing could not be assessed. Third, each study had to provide quantitative, graphical data from two or more phases, each depicting a different parameter of pacing (e.g., brief vs. extended ITI or brief vs. extended wait-time), to permit differential evaluation of responding in each phase. Studies that manipulated pacing as an intervention, but did not provide a comparison condition to permit differential evaluation of two or more pacing parameters, were excluded from the review. Fourth, each study had to include at least one educationally relevant dependent variable such as correct responding, on-task behavior, or challenging behavior. Finally, each study had to be conducted with students in a classroom or other educational setting, such as during one-to-one or group instruction; studies investigating pacing in basic laboratory settings, or college or university settings, were excluded as this was not the focus of the review.
To identify studies that met inclusion criteria, in October 2015, the first and second authors independently conducted searches of the following databases: PsycINFO, ERIC, Academic Search Premier, and Web of Science, Social Sciences Citation Index. Given that much of the pacing research literature is older (i.e., published before 1990), the entire time span of each database was included in the search. PsycINFO, for example, covers articles dating back to the 1800s, prior to the development of SCRD, and the oldest article extracted in the current review (Carnine) was published in 1976 (below). Each database was searched separately using the following terms (in quotations): instructional pacing, teacher pacing, response opportunities, ITI, and wait-time. In addition, ancestral searches of each of the resulting articles were scanned for additional articles that met the inclusion criteria. Finally, each article was entered into the Google Scholar database, and articles that cited each article were scanned to determine whether they met inclusion criteria.
Quality Assessment and Article Summary
Following extraction, a quality assessment was conducted to determine whether each extracted study met contemporary standards for high-quality SCRD research. The assessment was based on widely disseminated standards for high-quality SCRD research (Horner et al., 2005; Kratochwill et al., 2013) and was adapted from an assessment used in a previously published SCRD meta-analysis (Flippin, Reszka, & Watson, 2010). The questions displayed in Figure 1 were used in the checklist to conduct the quality assessment. Each item of the checklist was scored as a 0 = inadequate/unknown, 1 = partial/adequate, 2 = adequate, or not applicable (NA) if the item was not included in the article. For example, studies that did not include a baseline condition were given NA for Items 13 and 14 on the checklist. Items that were not applicable were not considered in the score. Each article could earn a total of 34 possible points. Quality indicator scores were calculated for each article as points earned divided by total possible points × 100. Scores of 90% or higher were coded as strong quality of evidence (S), scores of 75% to 89% were coded as adequate quality of evidence (A), and scores below 75% were coded as inadequate quality of evidence (Flippin et al., 2010). Articles that attained a score of less than 75% were excluded from the review. In addition, given the importance of experimental control and replication of intervention effects in high-quality SCRD research (Horner et al., 2005), all studies included in the review had to score at least a 2 for Question 16, showing at least three demonstrations of experimental control, and at least a 1 for Question 17, indicating at least one replication of treatment effect across participants, settings, or materials.
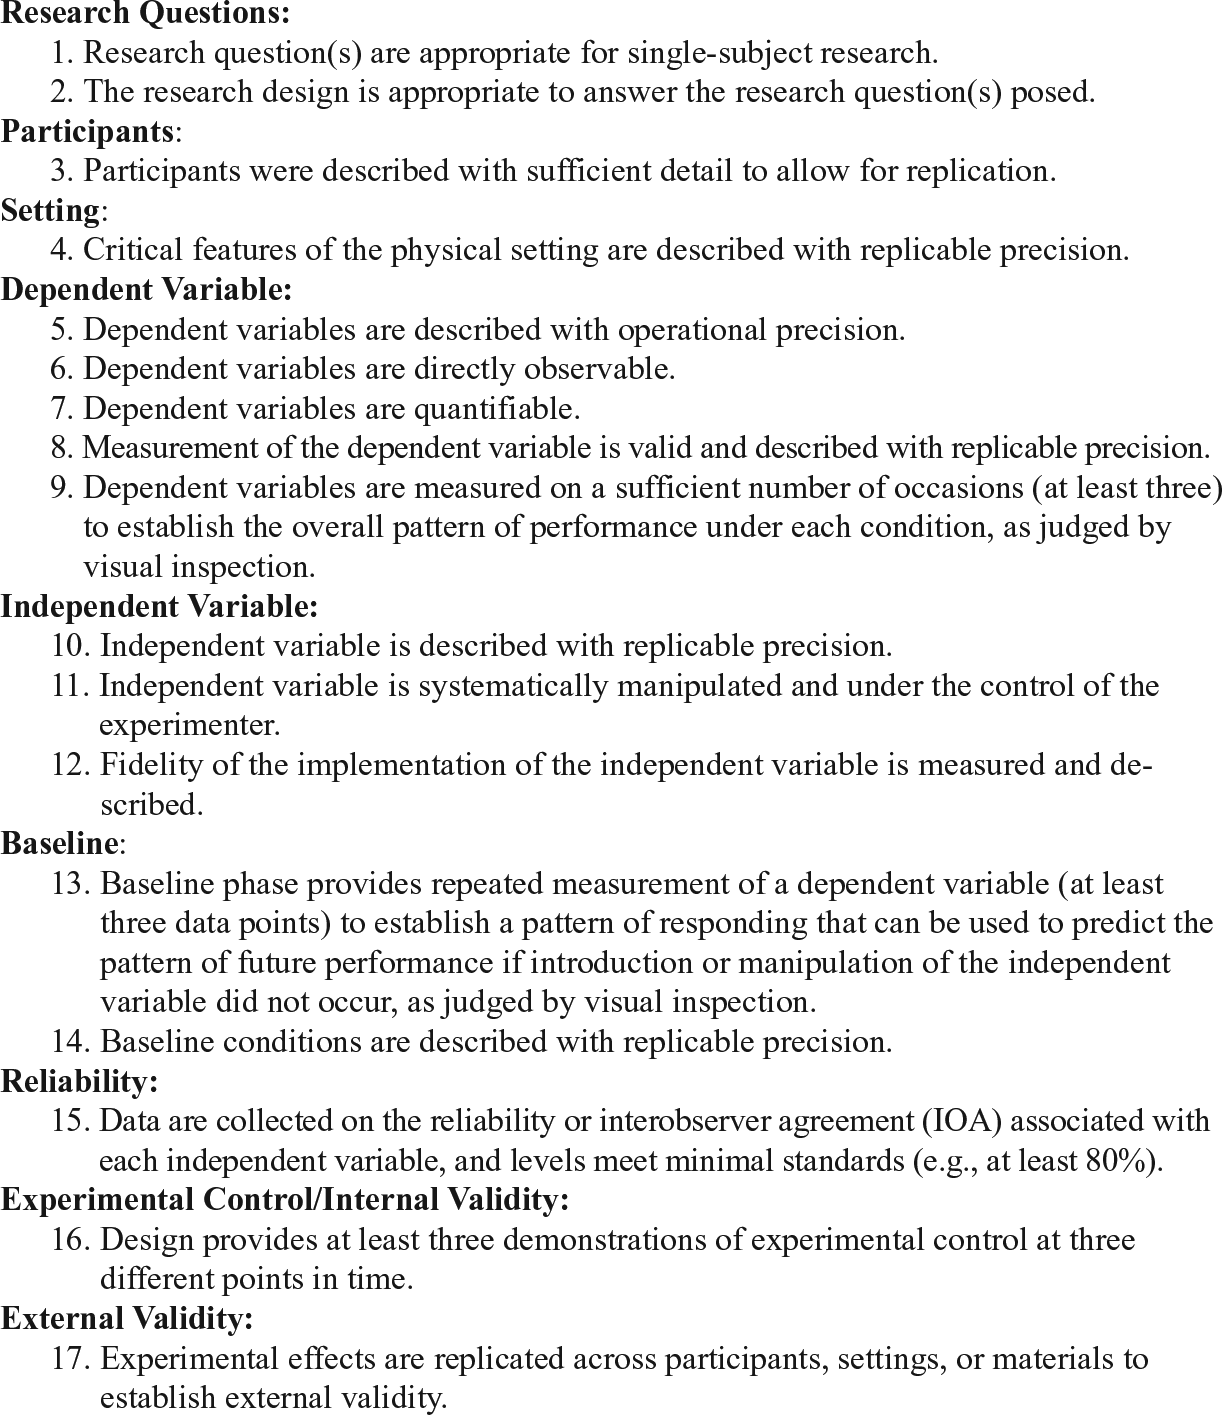
Items used in the SCRD study quality assessment.
The first author, who held a PhD in special education and had extensive experience conducting and supervising SCRD research, and the second author, who held a master’s degree in applied behavior analysis and was a board certified behavior analyst, were the coders. Initially, coders met to review operational definitions for each of the 17 items on the checklist. Following initial review, each coder separately scored two randomly selected articles, and then the coders met again to review their scores, to discuss and resolve any sources of disagreement, and to re-score their checklists accordingly. Then, each coder separately completed checklists for the remaining 13 extracted articles (15 in total). Interobserver agreement (IOA) for the checklists was calculated by the point-by-point agreement method, with Agreements / Agreements + Disagreements + 100. IOA was 100%. Each article was then reviewed to determine the authors and year of publication, the number and type of participants, the independent variables, dependent variables, design, and reported results.
Effect Size Estimation
Data conversion
To determine effect size estimates, the graphs of extracted articles were initially scanned and digitized by the first and second authors using Plot Digitizer (Huwaldt & Steinhorst, 2014), a software program that converts data points from printed graphs into raw numerical data that can be inputted into spreadsheet software and used for meta-analyses (e.g., Butler et al., 2013). PDF files of each graph were converted to digital imaging files, individual data points were identified, minimum and maximum values were assigned to the x and y axes, and data points were converted by selecting individual marker points with the cursor. Given this information, Plot Digitizer outputted a list of values for all data points on the graph. These data points were then regraphed using Microsoft Excel and compared with the original graphs to verify accuracy. To establish IOA, data points from graphs of 31% of randomly selected articles were separately coded by the first and second authors. IOA was calculated as point-by-point agreement for each data point with Agreements / Agreements + Disagreements × 100. IOA averaged 96.9% (range, 94.4%-100%).
Tau-U
Tau-U (Parker et al., 2011) was used to estimate effect size for each of the extracted studies. Tau-U is a non-overlap statistic similar to non-overlap of all pairs (NAP; Parker & Vannest, 2009); NAP has been used to determine effect size in meta-analyses of SCRD research (Roth et al., 2014; Walker & Snell, 2013); both Tau-U and NAP were used in one recent meta-analysis (Whalon et al., 2015). Tau-U and NAP calculate effect size as a proportion of each data point in Phase A and each data point in Phase B that show no overlap. Tau-U is calculated as the percent of non-overlapping data minus the percent of overlapping data (Parker et al., 2011), whereas NAP is calculated as the number of comparison pairs showing no overlap, divided by the total number of comparisons (Parker & Vannest, 2009). Both methods yield effect size estimates with confidence intervals (CIs) and are appropriate for data sets in which data points within phases are autocorrelated, serially dependent, and otherwise fail to meet assumptions of normality, as is typical of SCRD data sets. NAP shows greater precision in comparison with other widely used SCRD effect size metrics such as percentage of non-overlapping data (PND) and percentage of all non-overlapping data (PAND; Parker & Vannest, 2009). Tau-U was selected for this meta-analysis because this similar method allows for control of positive trend in baseline, which NAP does not (Parker et al., 2011). Although Tau-U has been used in at least one recent meta-analysis (Whalon et al., 2015), these authors did not specify specific cut points to evaluate large, moderate, and small treatment effect sizes across studies. Therefore, conservative cut points to evaluate effect sizes were based on those used in recent meta-analyses using NAP (Roth et al., 2014; Walker & Snell, 2013) and were 93 to 100 for large effect, 66 to 92 for moderate effect, and 0 to 65 for small effect.
Phase contrasts and weighted Tau-U coefficients
Effect size estimates were derived using a web-based calculator for determining Tau-U (http://www.singlecaseresearch.org/calculators/tau-u; Vannest, Parker, & Gonen, 2011). First, data sets for A and B phases were entered into the calculator. In studies using reversal and multiple baseline designs (MBD), the A phase was baseline and the B phase was intervention. A phases were corrected for baseline trend when detected (Parker et al., 2011). In studies using alternating treatments designs (ATD), A and B phases were entered according to the direction of reported effect. For example, Tincani and Crozier (2008) reported that brief wait-time increased participants’ responses per minute and correct responses, and decreased their challenging behavior, in comparison with extended wait-time. Therefore, extended wait-time was entered as the A phase and brief wait-time was entered as the B phase. Most studies compared effects of two pacing parameters except for one study that compared three durations of ITI, 1 s, 5 s, and 10 s (Roxburgh & Carbone, 2013). For this study, three phase contrasts were entered for each possible combination of variables, 1 s versus 10 s, 5 s versus 10 s, and 1 s versus 5 s. For the weighted effect size analysis across studies shown in Table 4, wait-times of 1 s and 5 s were compared for this study as these durations were most similar to those compared in other ITI studies.
Overall, studies included a range of independent and dependent variables and most studies reported more than one dependent variable, and thus, it was not possible to derive a single, omnibus effect size estimate for the studies. Instead, data for A and B phases of each study’s dependent variables were entered into the calculator, contrasted, and then averaged using the calculator’s weighting function to determine a weighted effect size for each dependent variable in each study (see Tables 1, 2, and 3, far right column). For example, using an ABABAB design, Carnine (1976) compared two durations of wait-time on two students’ off-task behavior, correct responding, and participation. Therefore, data from each A and B phase were contrasted and then averaged to yield separate effect size estimates for off-task, correct responding, and participation across the two participants.
Studies Manipulating ITI Only.

Note. ITI = inter-trial interval; QIS = Quality Indicator Score; CI = confidence interval.
p < .05. **p < .01. ***p < .001.
Studies Manipulating Wait-Time Only.
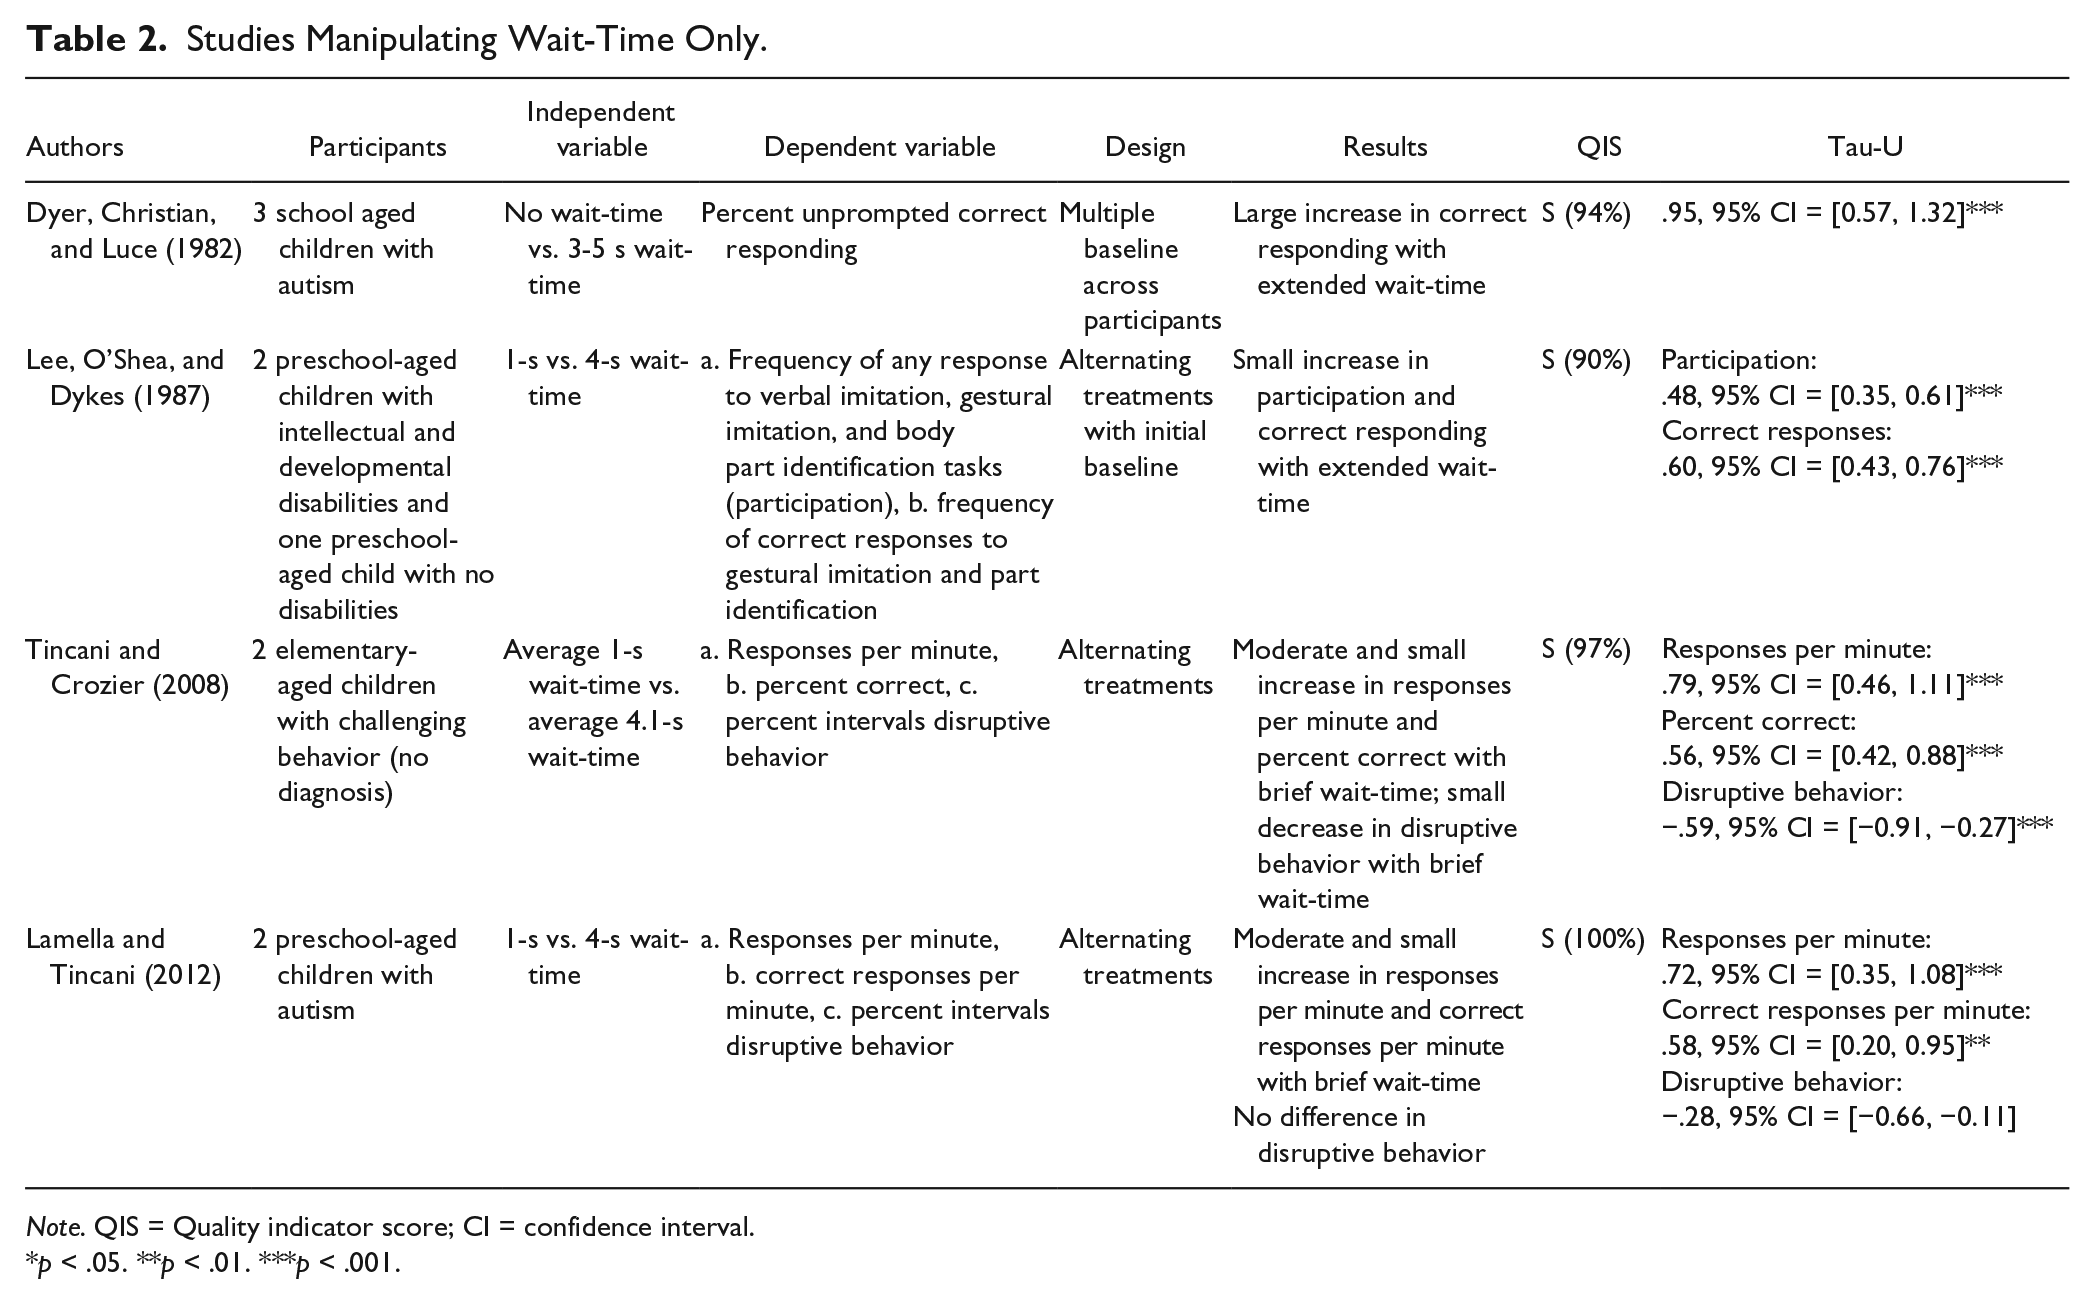
Note. QIS = Quality indicator score; CI = confidence interval.
p < .05. **p < .01. ***p < .001.
Studies Manipulating Combinations of Pacing Parameters or Alternative Pacing Parameters.
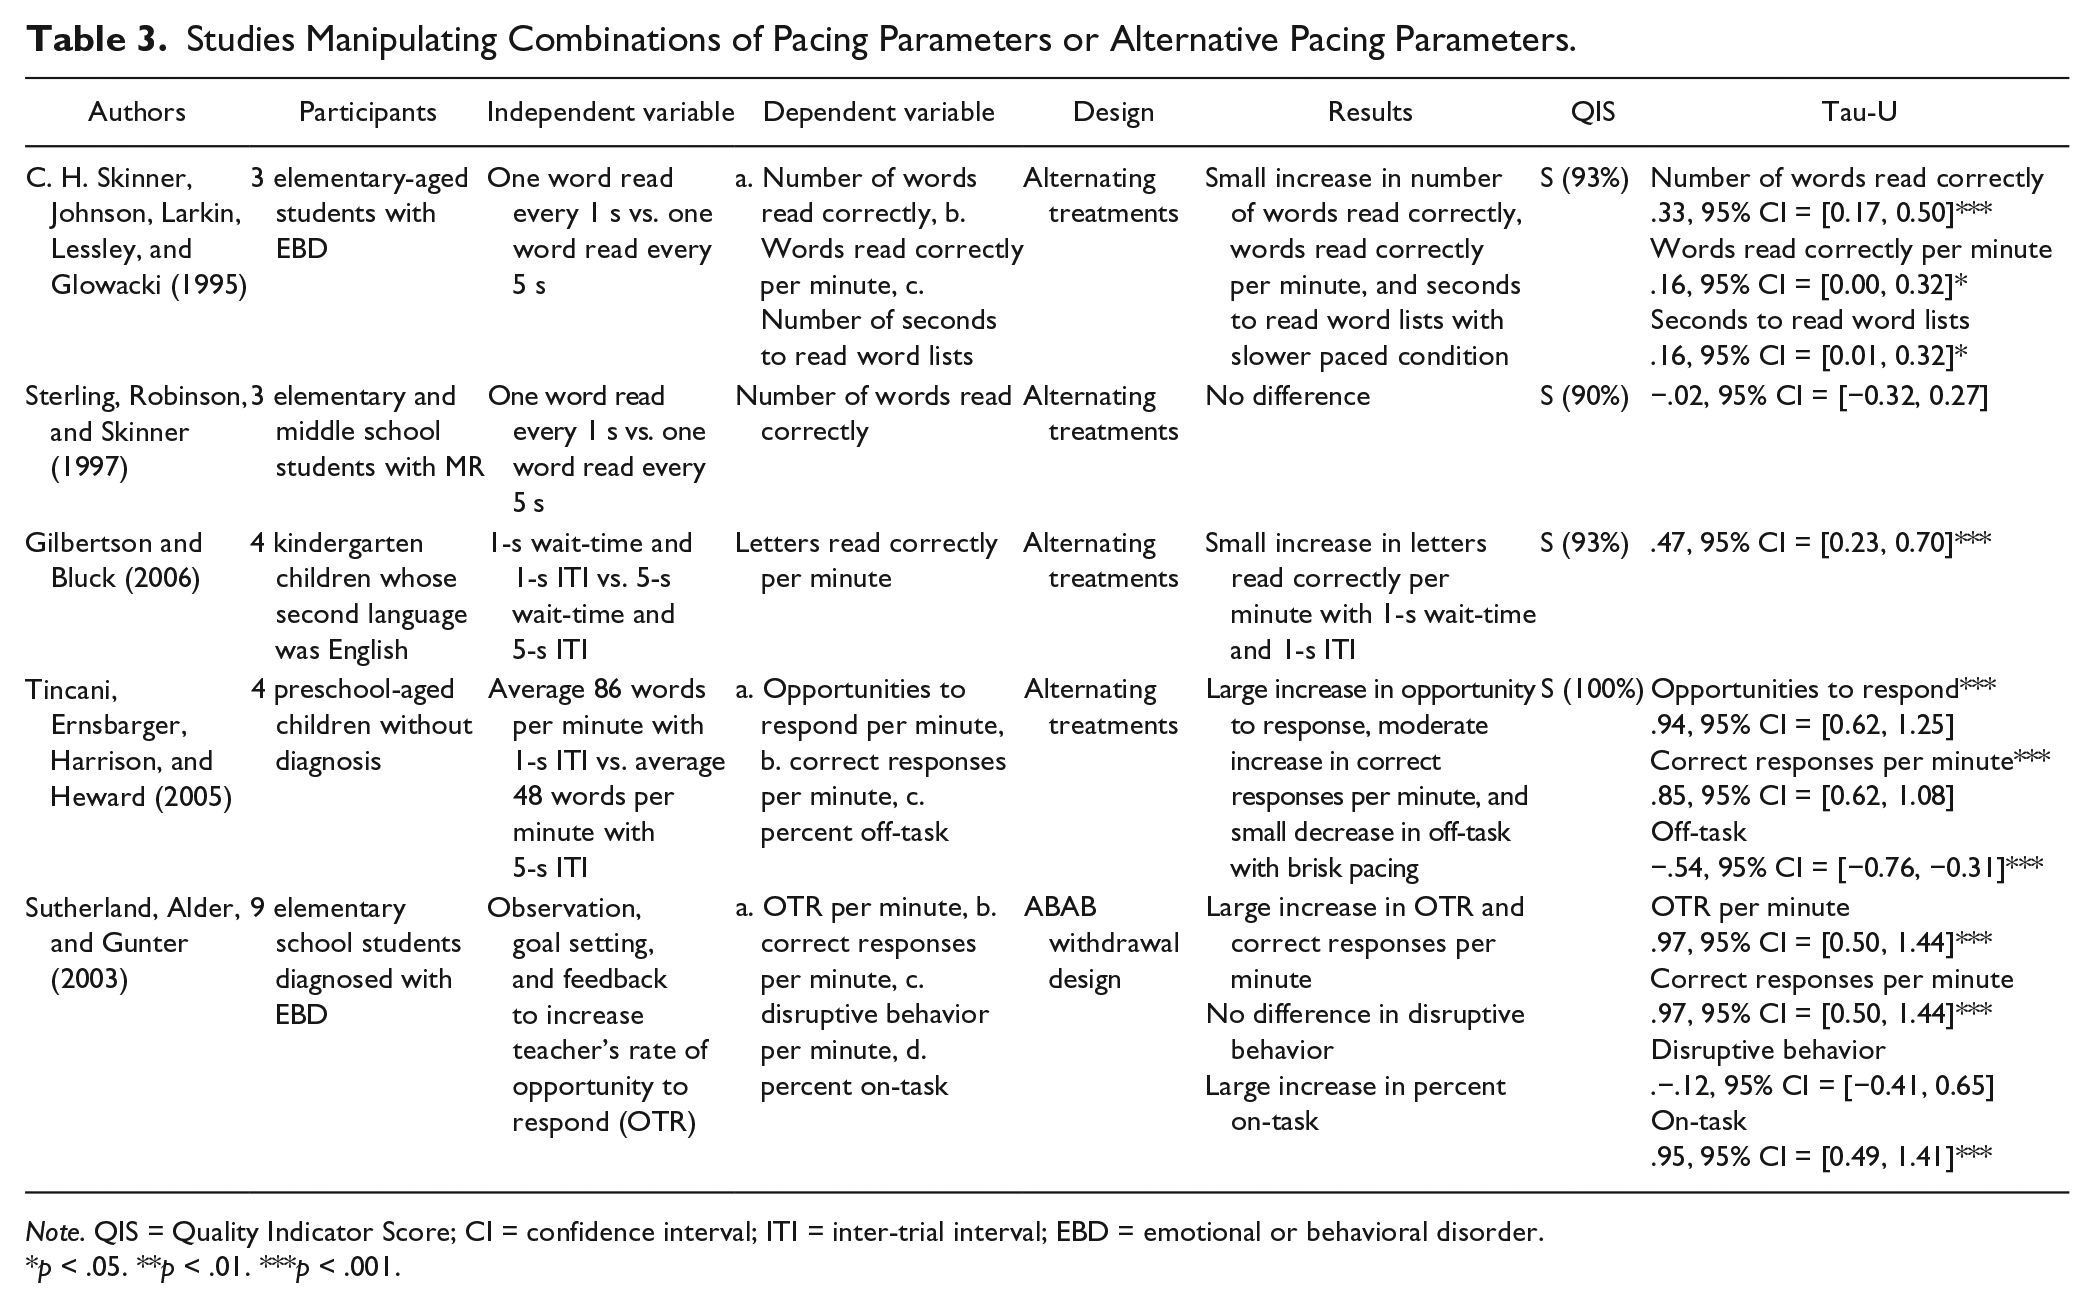
Note. QIS = Quality Indicator Score; CI = confidence interval; ITI = inter-trial interval; EBD = emotional or behavioral disorder.
p < .05. **p < .01. ***p < .001.
Finally, following the quality assessment and article summary, it was determined that articles fell into three categories, those investigating (a) ITI only, (b) wait-time only, and (c) other pacing variables including combinations of variables (e.g., ITI combined with wait-time; see Table 3). Therefore, to determine the overall effect for each pacing parameter on two common dependent variables found in most studies, correct responding and challenging behavior, weighted effect size estimates for correct responding and challenging behavior were determined for studies manipulating ITI alone, studies manipulating ITI combined with studies manipulating ITI and another pacing variable, studies manipulating wait-time alone, and studies manipulating wait-time combined with studies manipulating wait-time and another pacing variable (Table 4).
Weighted Tau-U Across Studies for Brief ITI Alone, Brief ITI Combined With Other Brief Pacing Variable, Extended Wait-Time Alone, and Extended Wait-Time Combined With Other Extended Pacing Variable.
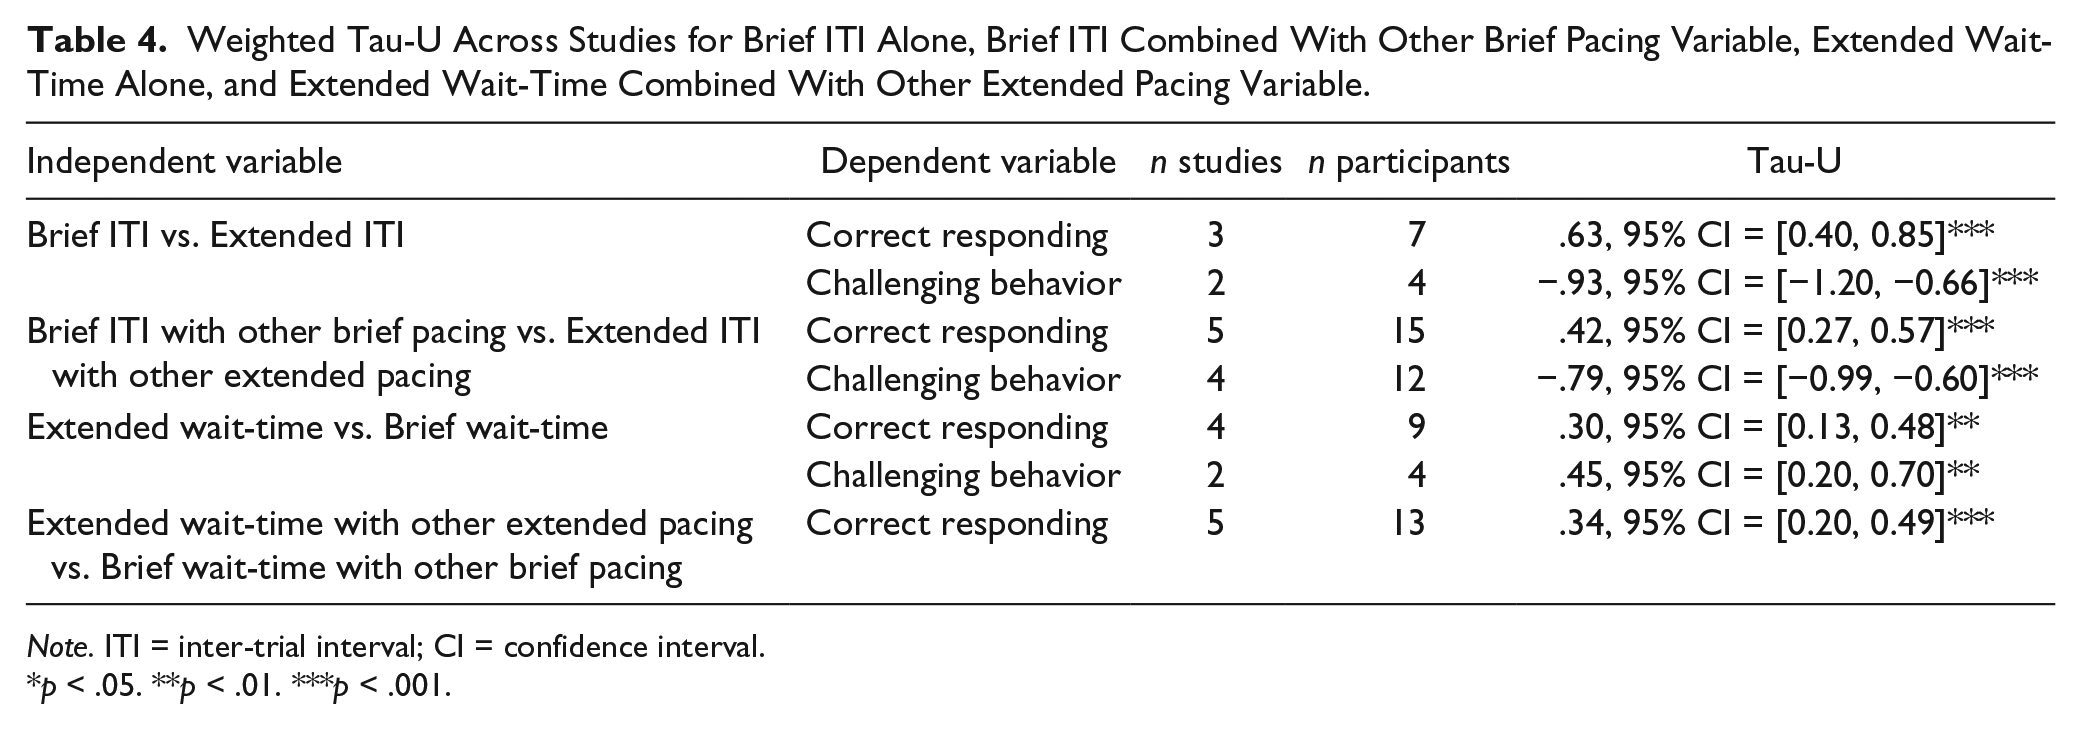
Note. ITI = inter-trial interval; CI = confidence interval.
p < .05. **p < .01. ***p < .001.
Results
Article Extraction and Preliminary Review
Searches of PsycINFO, ERIC, Academic Search Premier, and Web of Science, Social Sciences Citation Index databases yielded the following number of results by term: “instructional pacing” (PsycINFO, 15; ERIC, 22; Academic Search Premier, 4; Web of Science, 4), “response opportunities” (PsycINFO, 28; ERIC, 35; Academic Search Premier, 17; Web of Science, 12), “teacher pacing” (PsycINFO, 7; ERIC, 8; Academic Search Premier, 4; Web of Science, 0), “wait time” (PsycINFO, 243; ERIC, 191; Academic Search Premier, 652; Web of Science, 335), and “intertrial interval” (PsycINFO, 1,889; ERIC, 35; Academic Search Premier, 264; Web of Science, 380). The resulting articles were reviewed to exclude those that did not meet the study’s inclusion criteria, ancestral searches were conducted to identify additional articles, and articles were entered into the Google Scholar database to identify additional articles not found in database and ancestral searches. The search strategy yielded 18 studies that preliminarily met inclusion criteria. After further review, three of the 18 studies were excluded because they failed to meet all inclusion criteria. The remaining 15 articles were subjected to the quality assessment.
Quality Assessment and Article Summary
Results of the quality assessment and article summary are displayed in Tables 1, 2, and 3. Of the 15 articles identified in the article extraction and preliminary review, 13 articles attained Quality Indicator Scores (QIS) of at least 90%, providing strong evidence of quality; two articles attained QIS of less than 75%, or less than adequate quality, and therefore were excluded from further review. Table 1 summarizes articles that manipulated ITI only (n = 4), Table 2 summarizes articles that manipulated wait-time only (n = 4), and Table 3 summarizes articles that manipulated combinations of pacing parameters or alternative pacing parameters (n = 5).
Participants
There were a total of 43 participants in the 13 studies. Fifteen had a primary classification of emotional or behavioral disorder (EBD), 10 had a primary classification of autism, five had a primary classification of intellectual or developmental disability, and 13 were not identified as having a disability. Of the 13 children without identified disabilities, four were described as English Language Learners (ELLs). Of the ITI only studies, there were 10 participants (three with EBD, three with autism, and two with no diagnosis). Of the wait-time only studies, there were also 10 participants (five with autism, two with intellectual or developmental disability, and three with no diagnosis). Of the studies manipulating combinations of pacing parameters or alternative pacing parameters, there were 23 participants (12 with EBD, none with autism, three with intellectual or developmental disability, and eight with no diagnosis).
Independent variables
ITI
Of the four studies manipulating ITI, three compared two durations of ITI and the fourth compared three durations of ITI. Of the three studies comparing two durations of ITI, each compared a duration of 4 s or less with a duration of 5 s or more. The fourth study compared ITI durations of 1 s, 5 s, and 10 s.
Wait-time
Of the four studies manipulating wait-time only, each compared a wait-time duration of 1 s or less with a wait-time of 3 s or more.
Combinations of pacing parameters or alternative pacing parameters
Of the five studies manipulating combinations of pacing parameters or alternative pacing parameters, two compared different rates of antecedent stimulus presentation (one word read every 1 s vs. one word read every 5 s), two compared combinations of brief and extended pacing parameters (e.g., brief ITI and brief wait-time vs. extended ITI and extended wait-time), and one compared differing rates of teacher OTR on student behavior.
Dependent variables
Overall, 12 studies evaluated effects of pacing on correct responding, six studies evaluated effects of pacing on challenging behavior, five studies evaluated the effects of pacing on participation, and five studies evaluated effects of pacing on other dependent variables.
ITI
Of the studies manipulating ITI only, three measured correct responding, two measured challenging behavior, two measured participation, and three measured other dependent variables (i.e., seconds per task, number of words mastered, frequency of instructional demands).
Wait-time
Of the studies manipulating wait-time only, four measured correct responding, two measured challenging behavior, three measured participation, and none measured other dependent variables.
Combinations of pacing parameters or alternative pacing parameters
Of the studies manipulating combinations of pacing parameters or alternative pacing parameters, five measured correct responding, two measured challenging behavior, none measured participation, and two measured other dependent variables (e.g., OTR, on-task).
Design
Overall, six studies used MBD, five studies used ATD or a variation thereof (i.e., alternating treatments with initial baseline), and two studies used reversal designs (RD).
Effect Size Estimation
As reflected in the far right column of Tables 1, 2, and 3, different interventions and different dependent variables yielded varying effect sizes across the studies. However, of the 13 studies, 11 yielded at least a small effect when one pacing parameter was compared with another, six yielded at least a moderate effect when one pacing parameter was compared with another, and five yielded a large effect when one pacing parameter was compared with another. For a majority of the 13 studies, changes in instructional pacing yielded small to large magnitude changes in student responding.
ITI
As shown in Table 1, in three of the four studies that manipulated ITI only, brief ITI yielded small to moderate increases in student correct responding and, when measured, brief ITI yielded moderate to large decreases in student problem behavior. In two studies (Carnine, 1976; Roxburgh & Carbone, 2013), brief ITI also produced moderate to large increases in student participation. In one study (C. H. Skinner, Smith, & McLean, 1994), brief ITI produced no change in student responding.
Wait-time
As shown in Table 2, two of the studies that manipulated wait-time only showed small to moderate increases in correct responding and participation with extended wait-time (Dyer, Christian, & Luce, 1982; Lee, O’Shea, & Dykes, 1987); however, the two other studies showed small to moderate increases in correct responding and participation with brief wait-time (Lamella & Tincani, 2012; Tincani & Crozier, 2008). One study by Tincani and Crozier (2008) also showed small decreases in challenging behavior with brief wait-time.
Combinations of pacing parameters or alternative pacing parameters
As shown in Table 3, studies manipulating combinations of pacing parameters or alternative pacing parameters yielded varying results. However, three studies favored brisker pacing (Gilbertson & Bluck, 2006; Sutherland, Alder, & Gunter, 2003; Tincani, Ernsbarger, Harrison, & Heward, 2005), one study marginally favored slower pacing (C. H. Skinner, Johnson, Larkin, Lessley, & Glowacki, 1995), and one study produced equivocal results with respect to pacing (Sterling et al., 1997).
Weighted Tau-U across studies
To provide an effect size analysis of the studies’ most commonly reported independent variable comparisons (brief ITI vs. extended ITI and extended wait-time vs. brief wait-time) with the studies’ most commonly reported dependent variables (correct responding and challenging behavior), Table 4 depicts weighted Tau-U coefficients across the studies for these independent–dependent variable combinations. Overall, brief ITI yielded small increases in student correct responding (Tau-U = .63, 95% confidence interval [CI] = [0.40, 0.85], p < .001) and large decreases in student challenging behavior (Tau-U = −.93, 95% CI = [−1.20, −0.66], p < .001). When interventions that used brief ITI alone and brief ITI combined with another brief pacing variable (i.e., brief wait-time, rapid teacher talk rate) were compared with interventions that used extended ITI alone and extended ITI combined with another extended pacing variable (i.e., extended wait-time, slower teacher talk rate), effects on student participation and challenging behavior somewhat decreased, but small and medium effect sizes remained (Tau-U = .42, 95% CI = [0.27, 0.57], ps < .001 and −.79, 95% CI = [−0.99, −0.60], p < .001, respectively).
When extended wait-time and brief wait-time were compared, extended wait-time yielded small increases in correct responding (Tau-U = .30, 95% CI = [0.13, 0.48], p < .01); however, for a smaller subset of participants for whom challenging behavior was also measured, extended wait-time produced small increases in their challenging behavior (Tau-U = 45, 95% CI = [0.20, 0.70], p < .01). Finally, when extended wait-time and extended wait-time combined with another extended pacing variable (i.e., extended ITI) were compared with brief wait-time and brief wait-time combined with another brief pacing variable (i.e., brief ITI), small positive effects on correct responding were still evident, if somewhat diminished (Tau-U = .34, 95% CI = [0.20, 0.49], p < .001). No comparisons were available on extended wait-time with extended wait-time combined with another extended pacing variable and brief wait-time with brief wait-time combined with another brief pacing variable on challenging behavior.
Discussion
The purpose of this meta-analysis was to quantitatively synthesize research on instructional pacing to determine (a) the extent to which manipulating instructional pacing variables produces measurable changes in student performance and (b) the extent to which brisker or slower instructional pacing leads to measurable improvements in student performance.
Instructional Pacing as an Alterable Variable
With respect to the first research question, for 11 of the 13 studies, alterations in instructional pacing yielded small to large magnitude changes in dependent variables. This finding suggests that instructional pacing is a robust alterable variable that, when systematically manipulated, can substantially affect student performance.
Only two studies in the review (C. H. Skinner et al., 1994; Sterling et al., 1997) failed to yield any differential responding between brisk and slow conditions; however, these studies measured only one dependent variable, reading. Other studies evaluated effects pacing on multiple dependent variables, including challenging behavior and participation and correct responding in other skill domains. Participants’ reading performance in these two studies may not have been sensitive to differences in pacing relative to different dependent variables that were not measured, or effects of pacing may have been overshadowed by other aspects of intervention that were equal across conditions (e.g., instructional stimuli, task difficulty, prompting, feedback). Moreover, each dependent variable in the two studies was measured during probe sessions that occurred separately from intervention sessions. In contrast, most studies evaluated effects of pacing on within-session dependent variables (e.g., frequency of correct responding during instruction; Lee et al., 1987); therefore, any effects of pacing in these two studies may have not been sufficiently strong for detection during the probe sessions.
Benefits of Brisker Instructional Pacing
As reflected in Table 4, brief ITI yielded small increases in correct responding, and moderate to large decreases in challenging behavior. Effect sizes were larger when brief ITI was evaluated as a stand-alone intervention (top row of Table 4) than when brief ITI was evaluated with interventions that included other brief pacing components (second to top row of Table 4). Nevertheless, the data show consistent benefits for brief ITI on correct responding and challenging behavior across the studies.
Apparent benefits of brief ITI should be interpreted with the following considerations. First, although most studies reported increases in correct responding with brief ITI, some studies used accuracy measures, as in percentage of correct responses (Carnine, 1976; Koegel et al., 1980; Roxburgh & Carbone, 2013), whereas others used rate measures that do not necessary reflect response accuracy (i.e., rate of correct responses per minute; Gilbertson & Bluck, 2006; Tincani et al., 2005). Given that brief ITI also increased rates of OTR (e.g., Carnine, 1976), it is not clear whether increases in correct responding are a function of increased response accuracy, a by-product of increased OTR, or both. Second, although brief ITI produced moderate to large decreases in challenging behavior, including off-task and disruptive behavior, this benefit extends only to learners who display some consistent level of challenging behavior during instruction. For these students, brief ITI may enhance their rate of correct responding by reducing their challenging behavior, which, in turn, can increase their attention to instructional stimuli and overall participation.
Kratochwill et al. (2013) proposed the 5-3-20 threshold for identifying evidence-based practice with high-quality SCRD studies, with a minimum of five studies, conducted by a minimum of three research groups, with a minimum of 20 participants/cases showing experimental control. Although neither brisk nor slow instructional pacing meets these evidence criteria, Table 4 suggests that brief ITI can be considered a promising instructional practice (five studies, five separate research groups, 15 participants/cases).
Benefits of Slower Instructional Pacing
As reflected in the bottom two rows of Table 4, overall, extended wait-time produced small increases in correct responding; the magnitude of improvement slightly increased when extended wait-time was combined with another extended pacing variable. Two studies showed that extended wait-time increased participation and correct responding for impulsive responders (Dyer et al., 1982; Lee et al., 1987), whereas two other studies showed that brief wait-time increased participation and accuracy for children with challenging behavior (Lamella & Tincani, 2012; Tincani & Crozier, 2008). Collectively, results of the wait-time studies suggest that benefits of brief or extended wait-time may vary according to student characteristics, specifically, students who respond impulsively may benefit from extended wait-time as a way to increase their attentiveness to instructional stimuli, whereas students with challenging behavior may benefit from brief wait-time, which lessens their opportunities/motivation to engage in challenging behavior thereby increasing their attention to instructional stimuli and OTR (Carbone et al., 2010).
Limitations
There are several limitations of this meta-analysis that should be considered in interpreting the results. First, although the article extraction and preliminary review yielded 13 high-quality SCRD studies on instructional pacing, the research also reflects a variety of student characteristics (i.e., EBD, autism, intellectual and developmental disability, ELL, no disability) and instructional arrangements and curricular topics (e.g., discrete trial teaching, basic language learning, reading instruction). Given variation in findings across some studies, it seems likely that student and instructional characteristics mediate benefits of brisk and slow instructional pacing. For example, three studies evaluated instructional pacing in the context of direct instruction curricula, for which brisk instructional pacing is recommended (Marchand-Martella, Slocum, & Martella, 2004). However, given the relatively small number of studies, combined with varying participant characteristics and curricular arrangements, it was not possible to conduct an analysis of the effects of such moderating variables on student outcomes, as has been done in other meta-analyses of SCRD research (e.g., Ganz, Davis, Lund, Goodwyn, & Simpson, 2012).
Although the majority of studies manipulated ITI and wait-time alone or in combination with other pacing variables, three studies manipulated different pacing variables (C. H. Skinner et al., 1995; Sterling et al., 1997; Sutherland et al., 2003) and thus were not included in the weighted effect size analysis shown in Table 4. Although it is difficult to draw any firm conclusions from these studies, results of Sutherland et al. (2003) highlight the potential benefit of using feedback and goal setting to increase teachers’ rate of OTR, which, in turn, can have positive benefits on rate of correct responding and on-task behavior. Relatedly, other pacing variables such as feedback delay are also likely to influence student responding (Heward, 1994); however, studies extracted in this meta-analysis focused primarily on ITI and wait-time to the exclusion of other potentially relevant pacing variables.
It should be acknowledged that this meta-analysis did not include group design studies on instructional pacing. The majority of instructional pacing studies to date have been SCRD studies, and although group design studies do exist, they have tended to use descriptive or quasi-experimental designs that do not completely control for threats to internal validity (Rowe, 1974; Tobin, 1980, 1987). In contrast, studies in the current review had to demonstrate at least adequate experimental control with minimal threats to internal validity (see Tables 1, 2, and 3). Nonetheless, if available, the inclusion of highly rigorous group design studies could bolster conclusions regarding the relative effectiveness of instructional pacing variables on student outcomes.
Finally, because the meta-analysis included only peer-reviewed research studies, the potential influence of the file drawer effect (Rosenthal, 1979) should be acknowledged. That is, studies that failed to demonstrate benefits of brisker or slower instructional pacing (and thus to establish experimental control) were less likely to be published and thus would have necessarily been excluded from the review.
Future Research
Results of this meta-analysis highlight several important areas for future instructional pacing research. First, given promising results for studies examining effects of brief ITI on correct responding and challenging behavior, additional replications are needed to establish brief ITI as an evidence-based practice with these outcome variables. As presence of challenging behavior may function as a mediating variable for benefits of brief ITI, future studies should seek to incorporate brief and extended ITI into function-based behavior interventions for students with and without challenging behavior (Hagan-Burke, Gilmour, Gerow, & Crowder, 2015). Similarly, given that benefits of brief and extended wait-time may be mediated, in part, by student factors such as presence of challenging behavior and response impulsivity, future replications should examine effects of brief or extended wait-time for students with and without these characteristics. Future pacing research should also systematically examine other factors that may meditate effectiveness of brisk or slower instructional pacing, including the complexity of antecedent instructional stimuli, complexity of required responses, academic subject area variations, and curricular variations. Importantly, future studies should seek to isolate effects of instructional pacing from different instructional variables (e.g., reinforcement) and ensure that there are at least two comparison conditions in which two or more parameters of instructional pacing are isolated as independent variables.
Footnotes
Declaration of Conflicting Interests
The author(s) declared no potential conflicts of interest with respect to the research, authorship, and/or publication of this article.
Funding
The author(s) received no financial support for the research, authorship, and/or publication of this article.