



Abstract
This simultaneous replication single-case design study investigated a vocabulary and main idea intervention with an aspect of text choice provided to students with autism spectrum disorder (ASD). Five middle school students with ASD participated in two instructional groups taught by school-based personnel. Results were initially mixed. These results were followed by upward and stable trends, indicating a functional relationship between the independent and dependent variables. Social validity measures indicated that students appreciated the opportunity to make choices on text selection.
Longitudinal studies comparing reading performance across disability categories report that students with autism spectrum disorder (ASD) are progressing at slower rates than students with learning disabilities (Wei, Blackorby, & Schiller, 2011). Adding to the complexity of addressing the intervention needs of students with ASD is the heterogeneity of performance in reading and language (McIntyre et al., 2017). Many students with ASD also have difficulties with pragmatic language and verbal ability, which can affect their social skills (Kelly, O’Malley, & Antonijevic, 2018).
A particularly vulnerable group of students with ASD is adolescents with reading problems. Adolescents are required to read more complex expository text than younger children, and this added demand often causes greater difficulty with understanding text (Kamil et al., 2008). Interventions that improve students’ ability to learn from and understand expository text align with requirements outlined in recent policy initiatives for literacy and content area instruction (e.g., Common Core State Standards [www.corestandards.org], Every Student Succeeds Act [www.ed.gov/essa]).
Most school districts use a form of multitiered systems of support, in which students who demonstrate academic or behavioral difficulties are provided increasingly intensive tiers of intervention, typically resulting in additional small-group instruction. The addition of small-group instruction to increase intensity may be a viable mechanism for supporting these policy initiative requirements while also addressing the remediation of reading problems for adolescents with ASD. To situate this investigation within the current base of literature, we review the most recent findings from reader profile studies and reading intervention studies for students with ASD, particularly studies with adolescents with ASD.
Reader Profile Studies of ASD
In a seminal study that continues to be widely cited, Frith and Snowling (1983) reported that students with ASD performed worse than control students on a test of reading comprehension, despite the fact that the groups were well matched on word reading measures. In a similar investigation, Minshew, Goldstein, Taylor, and Siegel (1994) reported lower levels of reading comprehension for students with ASD compared with IQ-matched control students. The findings from these early studies were confirmed in later studies suggesting that many students with ASD read words accurately but have low levels of reading comprehension (Goldberg, 1987; N. O’Connor & Hermelin, 1994; Patti & Lupinetti, 1993; Whitehouse & Harris, 1984).
More recent studies examining the reader profiles of students with ASD generally support that these students demonstrate high decoding and low comprehension profiles; however, these studies also report higher levels of heterogeneity in students’ performance on word reading and comprehension measures than in previous studies (McIntyre et al., 2017; Nation, Clarke, White, & Williams, 2006). Nation et al. reported standard scores in the average range (M = 96.56) with a large standard deviation (SD = 23.37, range 55-145) for word reading accuracy. Similarly, McIntyre et al. reported average standard scores for phoneme decoding efficiency (M = 94.89, SD = 14.81, range 58-127) and sight word efficiency (M = 93.29, SD = 14.75, range 57-136), both with large standard deviations. The reading comprehension scores from both of these studies indicated performance outside of the average range with large standard deviations. On a standardized measure of reading comprehension, Nation et al. reported standard scores below the average range with a large standard deviation (M = 82.34, SD = 14.82, range 69-121). McIntyre et al. reported a similar pattern of low comprehension and large standard deviation on the Gray Oral Reading Test (M = 7.37, SD = 2.61, range 1-13) scaled scores. The wide range of scores on reading and cognitive processes measures exemplifies the neurodiversity of students with ASD.
Reading Intervention Research and ASD
El Zein, Solis, Vaughn, and McCulley (2014) conducted a synthesis of studies of reading comprehension interventions published between 1980 and 2012 with vocabulary or reading comprehension as the treatment focus. Findings revealed many practices that are often associated with improved outcomes for students with learning disabilities (Scammacca, Roberts, Vaughn, & Stuebing, 2015). Four studies (Åsberg & Sandberg, 2010; Stringfield, Luscre, & Gast, 2011; Van Riper, 2010; Whalon & Hanline, 2008) used reading comprehension strategy instruction addressing (a) question generation, (b) graphic organizers, or (c) making predictions. Two studies used anaphoric cueing instruction (Campbell, 2010; I. M. O’Connor & Klein, 2004), three studies implemented explicit instruction (Flores & Ganz, 2007; Ganz & Flores, 2009; Knight, 2010), and three examined student grouping (Kamps, Barbetta, Leonard, & Delquadri, 1994; Kamps, Leonard, Potucek, & Garrison-Harrell, 1995; Kamps, Locke, Delquadri, & Hall, 1989).
Reading Intervention for Adolescents With ASD
Only four studies identified in the El Zein et al. (2014) synthesis targeted adolescent participants (Åsberg & Sandberg, 2010; Knight, 2010; I. M. O’Connor & Klein, 2004; Van Riper, 2010). O’Connor and Klein found statistically significant differences in favor of anaphoric cueing treatment compared with prereading treatment and cloze completion treatment. Asberg and Sandberg investigated a question–answer relationship intervention through modeling strategies and opportunities for independent practice. The other two studies included instructional components such as vocabulary instruction, visual supports, main idea summarization strategies, discussion, and questioning (Knight, 2010; Van Riper, 2010). Common across all the studies was the use of modeling, scaffolding, and independent practice as a mechanism for the instruction.
We reviewed literature published after 2012 that focused on reading comprehension interventions for students with ASD. This review yielded seven additional studies (Carnahan & Williamson, 2013; El Zein et al., 2014; El Zein, Solis, Lang, & Kim, 2016; Reutebuch, El Zein, Kim, Weinberg, & Vaughn, 2015; Roux, Dion, Barrette, Dupéré, & Fuchs, 2015; Solis, El Zein, Vaughn, McCulley, & Falcomata, 2015; Williamson, Carnahan, Birri, & Swoboda, 2015). Only three of these studies provided reading interventions to adolescents with ASD (Carnahan & Williamson, 2013; Reutebuch, El Zein, Kim, 2015; Williamson et al., 2015).
The multiple-baseline single-case design study by Williamson et al. (2015) included three high school students with ASD. Teachers used character-mapping interventions to teach students to identify narrative story elements related to characters. Results showed improvements in the percentage of correct answers between baseline and intervention phases with an immediacy of a positive effect.
Carnahan and Williamson (2013) conducted a single-case reversal design study for three middle school students with ASD. Intervention components included Venn diagrams and controlled compare-contrast text patterns. Results showed improvements in percentage correct on comprehension questions of science concepts.
Reutebuch, El Zein, Kim, et al. (2015) adapted collaborative strategic reading (Boardman et al., 2016; Klingner, Vaughn, & Schumm, 1998; Vaughn et al., 2011), which has shown efficacy for students with learning disability through large-scale randomized controlled trial studies. Collaborative strategic reading consists of previewing text, determining main ideas, clarifying unknown words, and generating questions. Based on feedback from focus groups (Kucharczyk et al., 2015), collaborative strategic reading was adapted to include more behavioral interventions, self-monitoring prompts, visual supports to aid in determining main ideas, and a peer-mediated learning model with neurotypical reading partners. Results indicated increases in reading scores on curriculum-based measures (CBMs) and the number of social interactions with decreases in episodes of challenging behavior.
Many features of the interventions of these three recent investigations (Carnahan & Williamson, 2013; Reutebuch, El Zein, Kim, et al., 2015; Williamson et al., 2015) align with findings of group-design intervention studies of students with ASD (I. M. O’Connor & Klein, 2004; Roux et al., 2015). Common across all of the intervention studies are the instructional practices of modeling of cognitive processes, discussion of key concepts, and guided and independent practice (El Zein et al., 2014). This small yet growing body of literature supports the notion that students with ASD who have difficulty understanding expository text benefit from interventions that include visual supports, vocabulary instruction, main idea summarization strategies, discussion, and questioning (Åsberg & Sandberg, 2010; Carnahan & Williamson, 2013; El Zein, Gevarter, et al., 2016; El Zein, Solis, et al., 2016; Flores & Ganz, 2007; Ganz & Flores, 2009; Knight, 2010; Reutebuch, El Zein, Kim, et al., 2015; Roux et al., 2015; Solis et al., 2015; Stringfield et al., 2011; Van Riper, 2010; Whalon & Hanline, 2008).
Choice Component to Increase Social Validity
In this current investigation, we added a component of choice for the participants as a means of potentially increasing the social validity of the intervention. A systematic review of studies that included choice-making components with students with ASD located eight studies (Reutebuch, El Zein, & Roberts, 2015). The researchers reported improvements in work completion, behavior (increase in on-task, decrease in challenging behavior), affect, and interest. We viewed the addition of this component as an opportunity to practice decision making within a structured instructional setting that may improve the social validity of the intervention.
Rationale and Research Questions
The aim of this study was to investigate the effects of a multicomponent vocabulary and reading intervention embedded with a choice component on the vocabulary and reading comprehension outcomes of adolescents with ASD. Instruction addressed word meaning and how to identify main ideas and answer literal questions about important details in text. We set out to answer the following research questions: Is the multicomponent intervention associated with improved student outcomes on vocabulary CBMs? Is the multicomponent intervention associated with improved student outcomes on reading comprehension CBMs? Does the addition of a choice component improve the social validity of the intervention?
Method
We used a simultaneous replication single-case design across two groups to evaluate the effects of the intervention on reading comprehension and vocabulary outcomes (Ducharme, Atkinson, & Poulton, 2000; Kelly, 1980) This multiple-baseline design allows for empirical examination of dependent measures that do not reverse upon removal of the intervention, such as vocabulary and reading comprehension (Tawney & Gast, 1984). Furthermore, this design parallels the common practice of teachers providing small-group reading instruction as part of multitiered systems of support approach.
Setting
The school district is in the southwestern United States. The racial and ethnic population of students in the district at the time of the study was 21% Caucasian, 4.8% Black or African American, 72.2% Hispanic/Latino, 1% two or more races, 0.8% Asian, and 0.1% Native American. The study took place at one middle school serving approximately 1,000 students in Grades 6 through 8, which according to the state accountability rating “met standard” in the year of the study. The school had a special education enrollment of 14.5%, with approximately 74% of students identified as economically disadvantaged.
Intervention sessions were conducted in a private conference room with no other students present. Sessions were held during students’ regularly scheduled 43-min daily tutorial period. Some weeks had fewer than five sessions due to absences or scheduling conflicts for events such as assemblies or special schedules.
Participants
Parental consent, school staff member consent, and student assent were obtained for all participants as approved by the university’s institutional review board requirements.
Interventionists
Two female teachers employed by the school district and who taught in a self-contained or dedicated setting served as the interventionists. Both held bachelor’s degrees in education and were certified in special education. The teacher for Group 1 was in the middle of her first year of teaching after 2.5 years working as a special education paraprofessional, and the teacher for Group 2 had 2 years of teaching experience as a special education teacher.
Students
All students were native English-speaking male students receiving special education services under the disability category of ASD. Case managers completed the Gilliam Childhood Autism Rating Scale, Third Edition (GARS-3; Gilliam, 2013), which provided additional data supporting the school-based ASD eligibility. The first participant, Kevin (age 14), was Black or African American and in eighth grade. The second participant, Eric (age 14), was White and in eighth grade. The third participant, Dominic (age 13), was Hispanic/Latino and in sixth grade. The fourth participant, John (age 14), was White and in eighth grade. The fifth participant, Brian (age 14), was Black or African American and in eighth grade (Table 1).
Participant Demographics.
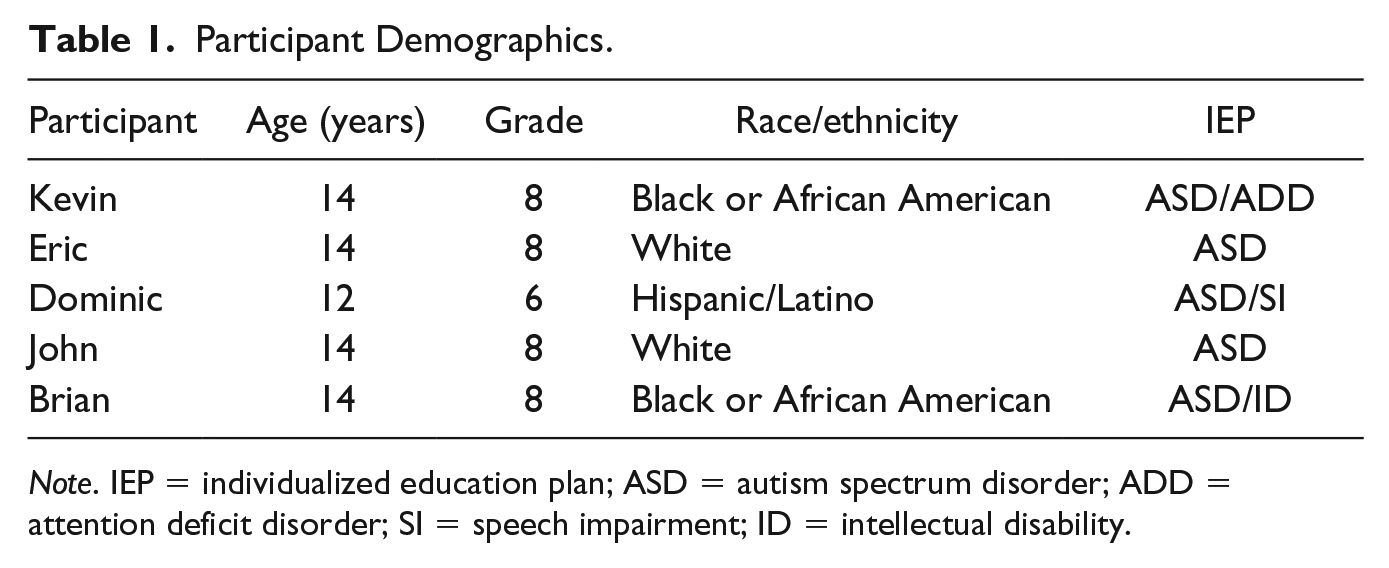
Note. IEP = individualized education plan; ASD = autism spectrum disorder; ADD = attention deficit disorder; SI = speech impairment; ID = intellectual disability.
Measures
Descriptive measures
The following standardized measures were administered to students prior to baseline data collection: the Letter Word Identification, Passage Comprehension, and Reading Fluency subtests of the Woodcock–Johnson III Tests of Reading Achievement (WJ-III; Woodcock, McGrew, & Mather, 2001); the Reading Sentences subtest of the Clinical Evaluation of Language Fundamentals, Fifth Edition (CELF-5; Semel, Wiig, & Secord, 2013); the Kaufman Brief Intelligence Test, Second Edition (KBIT-2; Kaufman & Kaufman, 2004); and the GARS-3 (Gilliam, 2013).
WJ-III subtests
The Letter Word Identification, Passage Comprehension, and Reading Fluency subtests of the WJ-III were used as a descriptive measure of reading comprehension. Internal consistency reliability range from .91 to .93, and alternate form reliability is reported as .80 to 87. Concurrent validity correlations for the GM-RT range from .72 to .87 (Morsy, Kieffer, & Snow, 2010).
CELF-5
We administered the Reading Sentences subtest of the CELF-5, which has been used previously to determine language impairment in students with ASD (Conti-Ramsden, Botting, & Faragher, 2001; Riches, Loucas, Charman, Simonoff, & Baird, 2010). The Reading Sentences subtest was used as a descriptive measure of language ability. Internal consistency reliabilities range from .94 to .96. Concurrent validities range from .75 to .95 (Coret & McCrimmon, 2015)
KBIT-2
The KBIT-2 was used as a descriptive measure of cognitive and verbal ability and was examined as a moderating variable. Composite internal reliabilities range from .89 to .96. Validity studies yielded moderate to high correlations with both construct and concurrent validity studies (Kaufman & Kaufman, 2004).
GARS-3
The GARS-3 is standardized assessment of social interaction and communication for individuals suspected of having ASD. Internal consistency reliability coefficients for the subscales exceed .85 and the Autism Indexes exceed 0.93. Binary classification studies indicate that the GARS-3 accurately discriminates individuals with ASD from individuals without autism (e.g., sensitivity = .97, specificity = .97; Gilliam, 2013).
Participant social validity measure
A researcher-developed measure of social validity was administered to students following the conclusion of the study. The measure consisted of six forced-choice questions with a 4-point Likert-type scale, along with one closed-choice and one open-ended question. Participants self-reported feelings of satisfaction by expressing the degree of agreement with statements such as “I really enjoy working with a group of students during reading sessions” and “The reading sessions really help me.” Also included were a closed-ended question about whether participants preferred reading text that they selected or text selected for them and an open-ended question about their favorite part of the reading lessons.
Teacher focus group protocol
A researcher-developed focus group interview protocol guided the interventionists through 13 questions to gauge their perceptions of the materials, professional development, coaching, instructional routines, group dynamics, choice and no-choice options, effect on students’ reading comprehension, and benefits. A final question allowed sharing of any other insights or feedback not covered.
CBMs
The CBM protocol used for baseline and intervention phases assessed students’ vocabulary and comprehension of the text. The untimed protocol consisted of three prompts to assess students’ knowledge of a targeted vocabulary word (What does [the word] mean? What is another word for [the word]? Write your own sentence using [the word]) and four prompts for comprehension, including one literal comprehension question and three prompts to guide students through determining the main idea of the section (Circle the most important “who” or “what” in this section. Underline the most important information about the “who” or “what.” Combine your answers to write what the section is mostly about. Your sentence should be around 10 words.). Each prompt was scored on a rubric of incorrect (0 points), partially correct (1 point), or fully correct (2 points). More detail regarding scoring procedures is provided in the “Interobserver Agreement” section below.
Instructional Materials
Reading passages
For use as daily reading passages, articles were adapted from Newsela (https://newsela.com). Newsela is a highly generalizable tool for educators, as it is an ongoing source of readings written in the journalistic style to support learning based on current events. The research team chose to source text from Newsela to support students’ science and social studies content learning across multiple grade levels.
In the News section of the website, articles are divided into nine categories: War and Peace, Kids, Money, Science, Law, Health, Arts, Sports, and Opinion. We prioritized categories that most aligned with content standards and eliminated categories that were not as well aligned (e.g., the Arts category dealt primarily with popular culture). Two members of the research team searched for articles published on Newsela from January 1, 2017, to January 31, 2018, in the Kids, Money, Science, Law, and Health categories. Articles that were of high interest to middle school students were selected; articles that focused on controversial topics such as particular political figures, religion, or violent events were excluded.
Each article is available in five Lexile levels. The Lexile Framework is a widely used approach for matching students with ability-appropriate texts (Lennon & Burdick, 2014). Based on student pretest data, we selected articles in the lowest Lexile level available (380-600) for Group 1 and the 740-940 Lexile range for Group 2. The research team adapted the articles so that each text contained three sections of approximately 100 to 130 words each. This adaptation allowed modeling of the skills during the first section of text, guided practice during the second section, and independent practice and collection of CBM data during the final section.
Assignment of articles
After text preparation was finalized, the articles were randomized within each category (i.e., Kids, Money, Science, Law, and Health). For each intervention session, one student selected the article to be read from three of the five categories, which were randomly preselected and presented for the student’s choice day.
Assignment of choice days
Using a random number generator in an Excel spreadsheet, students were randomly assigned to one choice day during each 4-day cycle. This procedure ensured that each student across both groups had a choice day for 25% of the sessions. Days that were not assigned to a particular student’s choice were deemed “no-choice days,” in which the researchers assigned the reading passage in advance.
Procedures
Student selection criteria and grouping
Inclusion criteria for the study included the following: (a) school-based diagnosis of ASD and (b) indication of reading problems, as documented by the school district through not passing the state reading test or reading goals included in the child’s individualized education plan. Exclusion criteria included visual or hearing impairments or being an English learner. Students were also administered the GARS-3 to provide further context regarding ASD symptom severity. According to the GARS-3 autism index score, all students were rated as “very likely” to have ASD.
For descriptive purposes and to assist with materials development and instructional grouping, the participants were administered the following standardized measures: the Letter Word Identification, Passage Comprehension, and Reading Fluency subtests of the WJ-III; the Reading Sentences subtest of the CELF-5; and the KBIT-2.
Students’ instructional groupings were determined in part based on similar independent reading ability, as determined by prescreening reading measures (e.g., WJ-III Letter Word Identification and Reading Fluency subtests) and with both case managers and interventionists’ input. The WJ-III Passage Comprehension scores varied widely and, if used, would have resulted in groupings that school personnel warned against due to academic concerns. Therefore, Group 1 consisted of Dominic, Eric, and Kevin due to similar learning profiles, and Brian and John composed Group 2. In addition, Brian and John received the following accommodations during classroom instruction: oral administration of tasks and transcribing of responses. These accommodations were provided during instruction and during the daily instructional CBM. No additional students from outside of the research participants received the small-group instruction (Table 2).
Descriptive Measures.

Note. KBIT = Kaufman Brief Intelligence Test; GARS-3 = Gilliam Autism Rating Scale, Third Edition; WJ-III LWID = Woodcock–Johnson III Letter Word Identification; PC = passage comprehension; RF = reading fluency; CELF-5-RS = Clinical Evaluation of Language Fundamentals, Fifth Edition, Reading Sentences Subtest.
Reported as standard scores.
Reported as raw scores.
Interventionist training
The research team trained interventionists during two 90-min sessions after school hours at the campus. The first session consisted of an overview of the study design, research questions, data collection, and project logistics. The second session detailed the specific instructional routines—explicit vocabulary instruction, literal comprehension questions, and main idea summarization strategy. Training included one of the researchers modeling an intervention lesson with the teachers role-playing as students.
Instructional coaching support
In addition to the initial training, the research team provided in-person daily coaching and observation during the baseline and intervention phases. Coaching was intensive at first, with the researchers modeling lesson components while the teachers observed. The researchers gradually released supports as teachers gained proficiency and confidence with the strategies and procedures. Interventionists were able to independently implement each lesson after approximately 10 intervention sessions, with the researcher briefly interjecting to provide assistance or support as requested by the interventionist.
Baseline
In the baseline phase, each student read a passage and responded to questions about the passage in the same setting as where the intervention took place. The interventionist guided students through reading the first two sections of text. After reading the third section, students completed the CBM prompts independently. The CBMs during baseline and intervention were administered on an individual basis in adherence with each child’s accommodations as outlined by their individualized education plan. Group 1 students all had an accommodation of oral administration upon request but no writing assistance. As a result, the teacher read prompts aloud to students upon request. Accommodations for students in Group 2 (John and Brian) included oral administration of the task in its entirety and scribing. John and Brian completed the CBM administration one-on-one with either the teacher or the researcher by having the prompts read aloud and the students’ responses recorded verbatim.
Intervention
Each group met with their teacher approximately 5 days per week for 20 to 30 min of instruction and 5 to 10 min for CBM administration. The intervention phase(s) included 40 lessons for Group 1 and 37 lessons for Group 2. After consulting with the interventionists, the researchers separated the intervention into two phases for Group 1 only to refocus both the teachers and the student participants, who demonstrated some ambiguity in working through CBM questions. Students demonstrated understanding of content but did not always provide answers that corresponded with the question. For example, when asked “What is another word for cargo?” a student responded with “It’s like the stuff that big trucks take to a store.” The student provided an example for this prompt rather than a synonym.
After Intervention Phase 1 (IP1; Lessons 1-7), there was a break in intervention sessions. During this time, a researcher modeled for the interventionists and the students with a practice CBM. The researcher guided the teachers on how to appropriately prompt students to use the text to respond to comprehension questions. Furthermore, he directed Group 1 on how to accurately respond to the various questions asked. When Group 1 convened for the next session, the intervention continued as Intervention Phase 2 (IP2; Lessons 8-40).
The number of intervention sessions varied across participants due to student absences and scheduling conflicts. Group 1 (Dominic, Eric, and Kevin) received a total of 40 intervention sessions. Dominic attended 28 of the sessions, Eric attended 30 sessions, and Kevin attended 39 sessions. Eric withdrew from the study after Treatment Session 30 due to stress. Group 2 (John and Brian) received a total of 37 intervention sessions. Brian attended 36 of the sessions, and John attended 30 sessions. Intervention instruction used the following four-step process:
Step 1. On the choice day, student selected from three passage options.
Step 2. The teacher presented a visual aid for a vocabulary word from the passage. Researchers selected the words due to their relevance to the topic. The visual aid consisted of the target word, a student-friendly definition, an image depicting the target word, related words and synonyms for the target word, an example of the target word used in the context of the text, and two discussion questions to elicit students’ use of the target word. The interventionist introduced the student-friendly definition and directed the students to focus on how the image illustrated the target word. The interventionist then explained the related words (e.g., Other words for “tedious” are “dull” and “boring”) and read the sentence. The discussion questions facilitated student discussion of the definition, provided an opportunity for verbal discourse, and reinforced the meaning of the word. Students provided additional examples of the target word in context, such as through a personal anecdote (e.g., I felt
Step 3. The students read the first section of text with interventionist support, either in the form of teacher-modeled reading or cloze reading. The interventionist then modeled answering a literal question, called a “right there” question. “Right there” questions can be answered directly from the text, where the information is plainly stated. The interventionist modeled answering a literal question (e.g., What pizza topping has been banned in Iceland?) and directed students to look for the paragraph that contained specific words in the question, such as pizza and Iceland. The teacher explained that the answer is pineapple and that the text restates the question (Pineapple has been banned by Iceland as a pizza topping).
Next, students were taught a three-step main idea summarization strategy. First, students were taught how to identify the most important “who” or “what” of the passage. The interventionist explained that each passage has a subject that the passage provides information about (All of the sections talk about pineapple pizza). Second, the students identified the most important information about the “who” or “what.” The interventionist modeled how to determine the most important information by underlining and connecting repeated details. (The fourth paragraph discusses pineapple as a topping, and the fifth and sixth paragraphs mention not selling pineapple. Together, this tells me that the most important details are about not selling pineapple on pizza.) In the third step, the students were instructed to find the main idea of the passage by combining the most important “who” or “what” and most important details into one statement. The teacher modeled this sentence construction. (I can start my statement with “pineapple pizza” because it is the most important “who” or “what.” I know that the most important information is that pineapple pizza is banned. I can write “Pineapple pizza has been banned in Iceland because the president doesn’t like it.”)
Step 4. The group continued reading the second section of text in the same manner as the first section. Then the interventionist provided guided practice in answering a literal question and the three steps to find the main idea. The interventionist posed the question and provided time for students to think about and record their responses. The interventionist facilitated discussion by having students explain their strategy for completing each prompt. The teacher provided affirmative and corrective feedback as needed. After instruction, students completed the CBM.
Interobserver Agreement
In the preceding school year, we conducted a brief pilot study using a similar dependent measure. For that study, we calculated interobserver agreement by randomly selecting 30% of the data points within each phase, as recommended by Kratochwill et al. (2010). The interobserver agreement score for the pilot study was 77%, which is below the typically acceptable minimum standard of 80%.
To address this issue in the current investigation, we conducted interobserver agreement of dependent measures daily for 100% of the baseline and intervention sessions by having two researchers independently score and compare their interscore agreement. Prior to starting interobserver agreement data collection, the two researchers, who also served as instructional coaches, developed and refined the rubric for determining accuracy of student responses. In a training meeting with senior members of the research team, example student responses were scored and discrepancies were discussed to establish acceptable definitions of no credit (0 points), partial credit (1 point), or full credit (2 points). Any discrepancies in scores were resolved and agreement obtained through discussion between scorers. All of the CBMs were independently scored by two researchers. Item-by-item and total measure scores were calculated on an ongoing basis by taking the total number of agreements divided by the total number of agreements and disagreements and multiplied by 100. The mean agreement across observers was 82.4% for item-by-item analysis and 87.4% for total measure score.
Fidelity of Implementation
All intervention and assessment activities were audio recorded. A random sample of 30% of the audio-recorded sessions from each group’s intervention phase was used to determine fidelity of implementation. The two researchers who served as the instructional coaches used an implementation validity checklist that identified the core instructional steps of the intervention to determine the percentage of completed instruction. A point-by-point method was used and interrater reliability was established through a gold standard code sheet (Gwet, 2014). Interrater reliability of 100% was achieved before coding of audio recordings. The overall adherence to treatment across both teachers was 98.5% for the sessions coded (see Table 3).
Implementation Fidelity.

Implementation validity checklist percent correct.
Scale from 1 to 5.
Data Analysis
Results were interpreted by conducting visual analysis (Horner et al., 2005; Kratochwill et al., 2010). With the simultaneous replication design, the unit of analysis and decision making takes place at the group level. We also performed analysis at the individual level to discern differences in treatment response with the teachers following the same protocol to appropriately answer the research questions. Data were analyzed using visual inspection for the two groups and for each participant based on the (a) level, (b) trend, (c) variability, (d) overlap, (e) immediacy of effect, and (f) consistency of data patterns across similar phases (Kratochwill et al., 2010).
Social Validity
Student questionnaire
Two researchers independently reviewed completed questionnaires. One researcher compiled the data into a table. Both researchers reviewed student responses and came to 100% agreement on the accuracy of the reported findings.
Teacher focus group interview
A multistep approach was used to conduct a preliminary informal examination of the data set. The 48-min interview was audio recorded and transcribed for review by two researchers who were not involved in the interview or daily coaching of interventionists. Interventionists were provided with the transcripts and reviewed them for accuracy. Each team member individually read the transcripts and met to compare notes and to discuss anything that confirmed or refuted research findings or was particularly insightful. A third research team member independently reviewed the transcripts and perspectives captured for accuracy. All three team members were in 100% agreement on the accuracy of the interventionists’ feedback documented.
Results
Group Performance
Figure 1 displays total scores averaged for Group 1 (top panel) and Group 2 (bottom panel) on the reading comprehension measure. For Group 1, performance during baseline (M = 2.4) was variable with two relatively low scores initially and an increased score during the third session. Thus, an upward trend was observed at the end of the baseline condition. During the intervention phase, a slight increase in scores was observed (M = 4.12) immediately. However, a high amount of overlap was observed between the scores in baseline and intervention. Specifically, the highest score observed in baseline fell in the general range of scores observed during intervention, although the two lowest scores in baseline were below the lowest score observed during intervention. No discernible difference in performance between IP1 (M = 4.12) and IP2 (M = 4.58) was observed. Due to behavior concerns expressed by the school-based personnel and the researcher providing support, we were able to implement only two sessions during baseline for Dominic in Group 1.

Group total scores on reading comprehension during baseline and intervention and choice and no-choice conditions.
For Group 2, performance during baseline (M = 2.0) was relatively high initially with a downward trend during the course of the condition. When the intervention phase was implemented (M = 4), Group 2’s performance increased immediately and reversed the downward trend observed during baseline. An upward trend in performance was observed in the intervention condition initially before stabilizing, with some exceptions (e.g., Sessions 14-19) for the remainder of the phase.
Figure 2 displays total scores averaged for Group 1 (top panel) and Group 2 (bottom panel) on the vocabulary measure. For Group 1, performance during baseline (M = 2.75) was relatively stable but ended on an increased data point. When the intervention condition was implemented, the group’s performance increased immediately and was relatively stable during the course of the condition. Little overlap was present in the data between the intervention and baseline phases. Group 1’s performance was slightly higher during IP2 (M = 4.51) than during IP1 (M = 3.38).
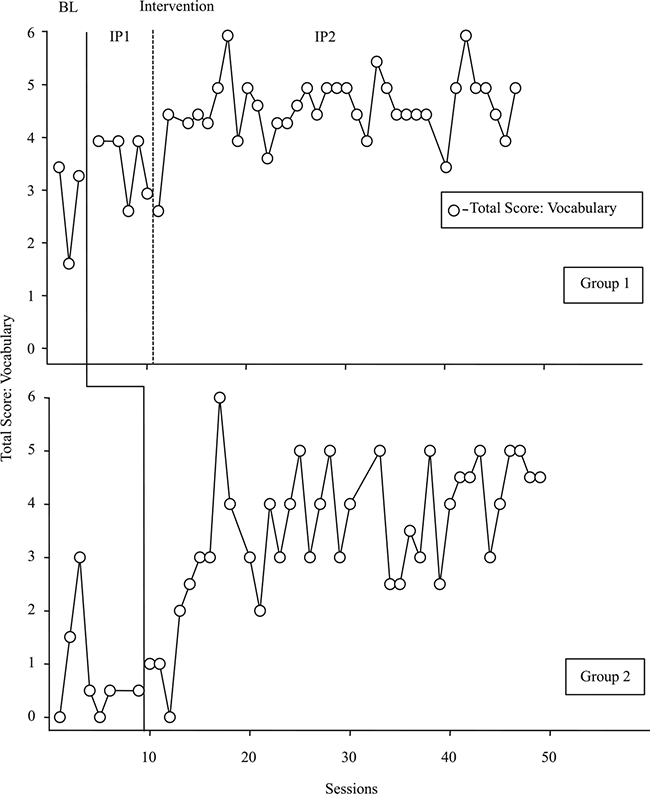
Group total scores on vocabulary during baseline and intervention and choice and no-choice conditions.
Group 2’s performance was relatively low during baseline (M = 2.48), and stable scores were observed during the final four sessions of the condition following an initial upward trend. When the intervention condition was implemented, Group 2’s performance immediately increased, relative stability was eventually observed at a higher level relative to baseline, and little overlap was present in the data between the intervention (M = 3.55) and baseline phase.
Individual Performance
See Tables 4 and 5 for summaries of individual mean performance within each phase on the comprehension CBM and vocabulary CBM. The descriptions below summarize the within-phase performance on CBMs, taking into account level changes, stability of performance, trends, and average within-phase performance comparisons.
Comprehension Mean Scores and Ranges for Accuracy of Students Responding to Reading Curriculum-Based Measure.

Note. M = mean; R = range; N/A = nonapplicable.
Vocabulary Mean Scores and Ranges for Accuracy of Students Responding to Vocabulary Curriculum-Based Measure.
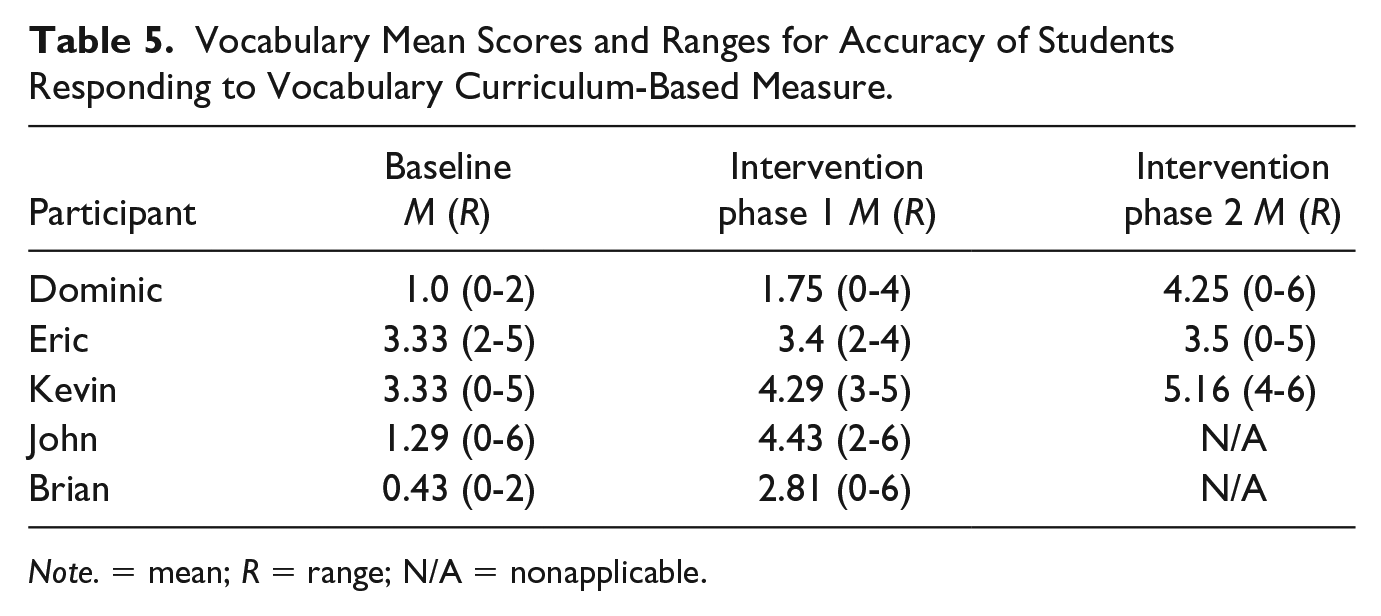
Note. = mean; R = range; N/A = nonapplicable.
Dominic
The top panel of Figure 3 displays Dominic’s comprehension scores during the baseline and intervention phases (IP1 and IP2) and the choice and no-choice conditions. Dominic’s average performance during baseline was relatively low (M = 3.5) and stable. Dominic’s performance remained low when the intervention phase was implemented. During IP1, Dominic’s performance remained relatively low (M = 3.6) with some variability (range 2-5). During IP2, Dominic’s performance continued to be relatively low during the first three sessions (M = 3.0). Starting with the fourth session, there was a marked increase in performance followed by a variable pattern of scores (range 2-8) with an overall downward trend during the next 10 sessions. For the remainder of the intervention, Dominic’s performance remained variable with a slightly upward trend (M = 4.04). A relatively high amount of overlap was present in the data between the intervention and baseline phases. No differences were observed in Dominic’s performance between the choice and no-choice conditions.
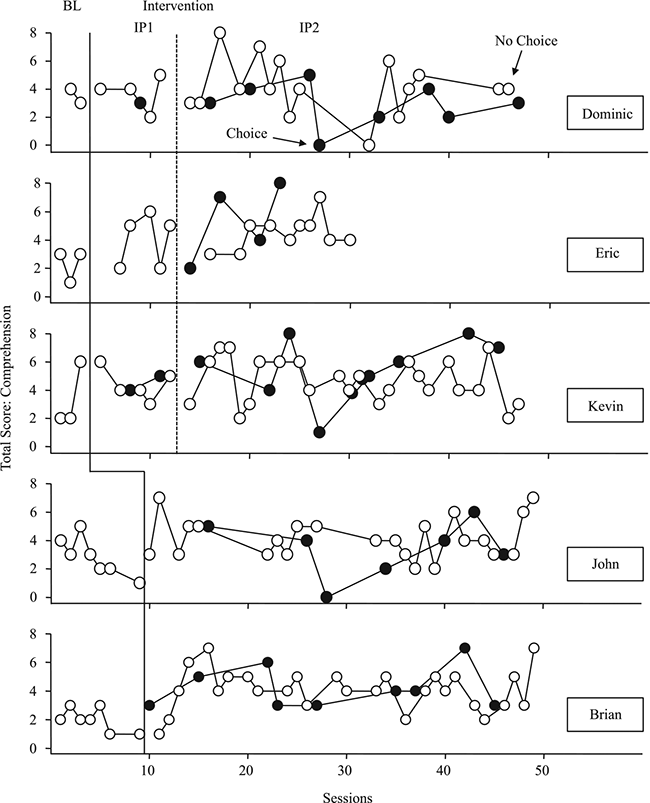
Total scores on reading comprehension during baseline and intervention and choice and no-choice conditions for all participants.
The top panel of Figure 4 displays Dominic’s vocabulary scores during the baseline and intervention phases and the choice and no-choice conditions. Dominic’s performance was low (M = 1.0, range 0-2) during the baseline phase. Dominic’s performance increased immediately during IP1 and eventually stabilized, with the exception of the final session of the phase (M = 1.75). Dominic’s performance increased when IP2 was implemented (with the exception of the first session of IP2). Dominic’s performance continued to be high and relatively stable for the remainder of IP2 (with the exception of Session 40). Dominic’s mean score (M = 4.25) during IP2 was higher than baseline and IP1. Little overlap was present in the data between the intervention and baseline phases, with some exceptions. No differences were observed in performance between the choice and no-choice conditions.
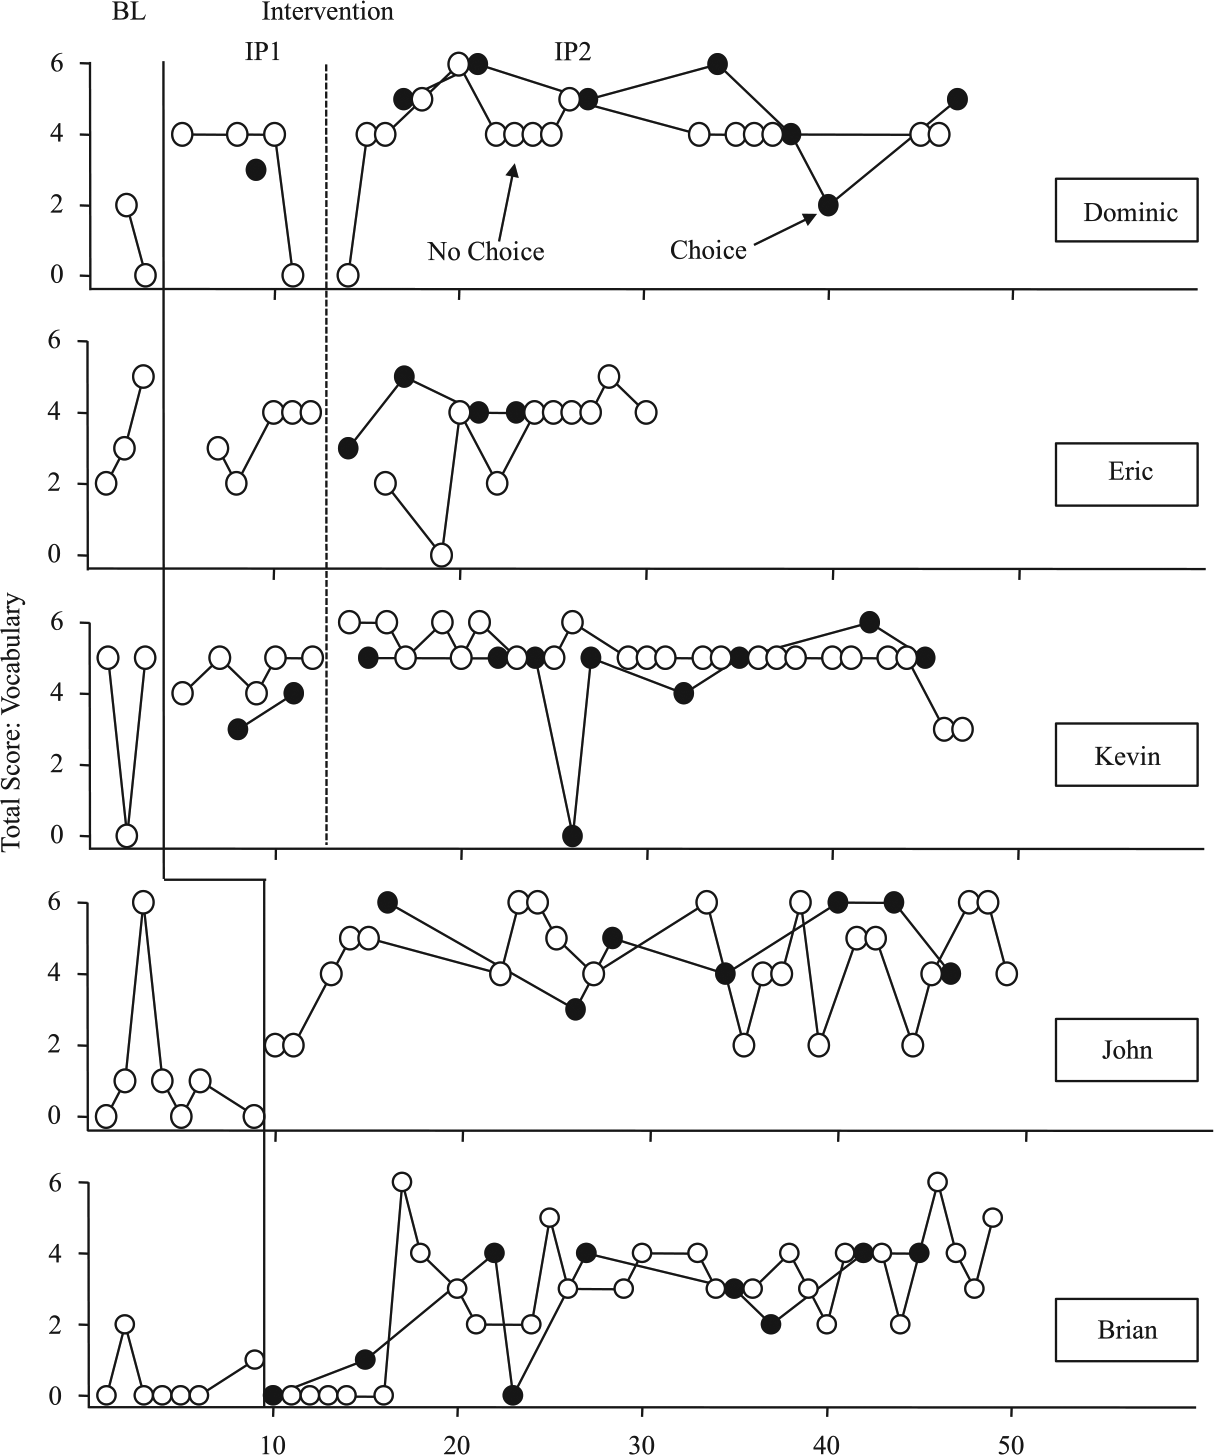
Total scores on vocabulary during baseline and intervention and choice and no-choice conditions for all participants.
Eric
The second panel of Figure 3 displays Eric’s comprehension scores during the baseline and intervention phases and the choice and no-choice conditions. Eric’s performance was relatively low during baseline (M = 2.33). During IP1, Eric’s performance increased to levels above baseline (M = 3.6, range 2-6). During IP2, Eric’s performance continued to have some variability (M = 4.71, range 2-8) but at levels above those in baseline. Little overlap was present in the data between the intervention and baseline phases, with some exceptions. No differences were observed in performance between the choice and no-choice conditions.
The second panel of Figure 4 displays Eric’s vocabulary scores during the baseline and intervention phases and the choice and no-choice conditions. Eric’s performance had an upward trend at a moderate level (M = 3.33). In IP1 (M = 3.4), Eric’s performance was lower during the first two sessions followed by higher and stable scores for the remainder of IP1 (M = 3.4). During Sessions 14 through 17 of IP2, his performance was variable; however, his performance was high and stable for the remainder of the intervention phase (M = 3.5), with some exceptions. Initially, Eric’s performance was higher in the choice condition than in the no-choice condition; however, no differentiation in scores across the two conditions was observed by the end of the intervention phase. Eric chose to drop out of the study after Session 30 because of stress attributed to group dynamics with another student.
Kevin
The third panel of Figure 3 displays Kevin’s comprehension scores during baseline and intervention and the choice and no-choice conditions. During baseline, Kevin’s performance was low during the first two sessions and then higher during the third session. His baseline performance was relatively variable (range 2-6) and at a moderate level (M = 3.33). During IP1, Kevin’s performance was above the initial baseline scores (M = 4.57) with some overlap with the final data point of baseline. During IP2, Kevin’s performance was higher (M = 4.91) relative to IP1 and baseline; however, a high amount of overlap was present in the data between IP1 and IP2. Throughout IP2, Kevin’s performance was variable (range 1-8). No differences were observed in Kevin’s performance between the choice and no-choice conditions.
The third panel of Figure 4 displays Kevin’s vocabulary scores during the baseline and intervention phases and the choice and no-choice conditions. Variability was observed during baseline (M = 3.33) followed by high and consistent scores during IP1 (M = 4.29). A high amount of overlap was present in the data between the IP1 condition and baseline. When IP2 (M = 5.16) was implemented, scores remained higher and stable relative to baseline for the remainder of the intervention phase, with the exception of Session 26. No differences were observed in Kevin’s performance between the choice and no-choice conditions.
John
The fourth panel of Figure 3 displays John’s comprehension scores during the baseline and intervention phases and the choice and no-choice conditions. During baseline, John’s performance was low, and a decreasing trend was observed throughout the phase (M = 2.86). When the intervention was implemented, John’s performance increased immediately and reversed the downward trend observed during baseline. John’s performance continued to be at levels generally above baseline with some variability throughout intervention (range 0-8); John’s performance was higher overall during the intervention phase (M = 4.0) relative to baseline. A relatively high amount of overlap was present in the data between the intervention and baseline phases. No differences were observed in John’s performance between the choice and no-choice conditions.
The fourth panel of Figure 4 displays John’s vocabulary scores during the baseline and intervention phases and the choice and no-choice conditions. With the exception of the third session, John’s performance was low during baseline (M = 1.29). When the intervention was implemented, an immediate increase in John’s performance was observed followed by an upward trend for the next six data points. John’s performance continued to be at levels generally above baseline levels with some variability throughout intervention (M = 4.43). Little overlap was present in the data between the intervention and baseline phases. No differences were observed in John’s performance between the choice and no-choice conditions.
Brian
The bottom panel of Figure 3 displays Brian’s comprehension scores during the baseline and intervention phases and the choice and no-choice conditions. During baseline, Brian’s performance was low (M = 2.00) and variable (range 1-5); a downward trend was also evident in the data during the baseline phase. When the intervention was implemented, an immediate effect was observed in Brian’s performance followed by a decrease in scores and then an upward trend for four sessions. Throughout the remainder of the intervention (M = 4.11), Brian’s performance was variable (range 2-7) but higher than his baseline performance, with the exception of Session 28. Although some overlap was present with regard to initial data points in intervention when compared with baseline, no overlap was present in the majority of data during the intervention phase relative to baseline. No differences were observed in Brian’s scores between the choice and no-choice conditions.
The bottom panel of Figure 4 displays Brian’s vocabulary scores during the baseline and intervention phases and the choice and no-choice conditions. Brian’s performance was very low during baseline (M = 0.43) with very little variability (range 0-2). Brian’s performance remained low when the intervention was implemented. In fact, his performance decreased and remained flat for five sessions. Brian’s performance was variable (range 0-6) for the next eight sessions, followed by more stable scores (M = 2.81) that increased during two of his last four sessions. Overall, Brian’s performance during intervention was consistently higher than during baseline and had very little overlap, with some exceptions, including the initial part of the intervention. No differences were observed in Brian’s scores between the choice and no-choice conditions.
Social Validity
Students
Four participants—John, Brian, Dominic, and Kevin—completed the social validity questionnaire. Respondents’ views regarding the intervention were mixed when asked to indicate the extent to which they “enjoyed it.” Two of the four indicated enjoying it “a little,” another indicated enjoying it “a lot,” and the other remained neutral. Three respondents found the reading sessions helpful to them, and one participant, Kevin, indicated being neutral on that topic.
All four responding participants indicated that they preferred the texts that they chose. Two participants stated that they did not enjoy the “no-choice” texts at all. Students’ views of working in a group setting varied. The students in Group 2 equally enjoyed working individually with the teacher and with their peer, whereas students in Group 1 preferred working with the teacher rather than in a group.
The open-ended question format did not garner information specific to individual intervention components as hoped. Although Kevin confirmed that having a choice in text was his favorite part of the lessons, John indicated that his favorite part was writing on paper. Both Dominic and Brian’s responses were off topic and seemingly unrelated to the question.
Teachers
Both interventionists participated in a 48-min interview with a research team member following the completion of the intervention. The interview was audio recorded and transcribed for analysis. Each respondent revealed that the experience with the study was positive. They disclosed that the lessons and coaching helped them to improve their instructional practices. The materials, professional development, instructional routines, and the research team were highly praised. Although the interviewees liked the instructional routines, they did note that for some students in Group 1, the routine became monotonous.
Although the teachers noted that participants appeared “enthused” regarding their choice of text, they did not observe differences in performance on these texts compared with performance on preselected texts. Furthermore, one teacher noted that particular interests in text topics seemed to make more of a difference than who selected the text.
Regarding grouping, respondents felt that the students they worked with may have been more focused in a one-on-one instructional setting. The teachers attributed personality conflicts as negatively affecting students in Group 1.
The teachers also identified that additional directives would improve the instructional materials. They cited the vocabulary and main idea routines as being the most beneficial to their students and indicated that they would continue to use the instructional strategies when given the opportunity to again provide reading instruction.
Discussion
This study investigated the vocabulary and comprehension outcomes of adolescents with ASD when provided a group-delivered intervention that included a component of student text choice. Some students with ASD who struggle with reading for meaning may need more rich content discussions, explicit vocabulary instruction, and good language models (McIntyre et al., 2017; Reutebuch et al., 2019). Lessons were explicitly designed to allow participants to express their understanding of text orally and in writing.
Findings suggest that the treatment was associated with improved student outcomes on reading comprehension and vocabulary CBMs. Grand means for both groups increased from baseline to the intervention phases. The Group 1 grand mean in comprehension during baseline was 3.05. The grand mean increased to 4.06 in IP1 and to 4.55 in IP2. Group 1’s grand mean in vocabulary during baseline was 2.55. The grand mean was 3.16 in IP1 and 3.88 in IP2. Group 2’s grand mean in comprehension was 2.43 during baseline and 6.06 during intervention. The vocabulary grand mean for this group was 0.86 in baseline with an increase to 3.62 in intervention.
Group 1’s scores improved 1.01 from baseline to IP1 in comprehension accuracy of responding. A 1.50 increase in comprehension accuracy of responding is noted from baseline to IP2. In vocabulary accuracy of responding, Group 1 made gains of 0.61 from baseline to IP1 and of 1.33 from baseline to IP2. Results confirmed the perceptions of the interventionists that greater increases in accuracy of responding occurred for Group 2. For this group, the increase in accuracy of responses from baseline to intervention was 3.63 for comprehension and 2.76 for vocabulary.
It is important to recognize that there was variation in students’ responses from day to day, which may be expected with this population. Some of these students demonstrated behavior difficulties that interfered with their learning and performance. In addition, comorbidity with three of the five participants (i.e., intellectual disability, speech impairment, attention deficit disorder) may have affected our findings, as one might expect variable performance from adolescents with co-occurring disorders. Variability was also apparent across student’s pretest measures, some which school staff disagreed with that led to group assignments which proved to be less than ideal for some participants. Adding to the variability in students’ responses is the inherit challenge of measuring vocabulary and comprehension across study designs (e.g., Keenan, Betjemann, & Olson, 2008), including single-case designs.
Students reported enjoying the component allowing them to choose what they read. However, no differences were discerned between scores in the choice and no-choice conditions. Eric initially demonstrated higher scores in the choice condition, but no differentiation in scores was evident by the end of IP2. Although choice of text has been associated with increased task engagement, correct responding, and overall productivity (Reutebuch, El Zein, & Roberts, 2015), lack of interest in and preference for a topic may have been bigger contributors to participants’ performance than choice alone. Although students were enthusiastic about their choice day, it did not consistently translate to improved performance.
Limitations of this study include the small sample size and small number of baseline data points collected to establish experimental control, the length of the intervention, and the confounding nature of text choice and text interest. Although we acknowledge having a small sample size, the number of participants does meet the established quality indicators for single-case design (Kratochwill et al., 2010). More sessions may have garnered additional gains; however, the school year came to an end. Furthermore, our interobserver agreement means at the item level and for total measures fell under the “gold standard” of 90%. Other constraints were beyond our control (e.g., changes in school schedules, participant absences, assignment of small conference room for both treatment groups) but are part of the reality of working in school settings.
A further limitation was exposed during the interviews with teachers regarding the difference between the choice and no-choice conditions and the content of the readings. Teachers stated that it appeared the topic of the text and the students’ interest in the topic may have influenced their motivation and performance more so than being given a choice of text. We did not systematically manipulate the content of the text throughout the intervention. Therefore, this is a potential confounding variable that influenced the comparison between the two conditions.
Although growth from the intervention is modest, it does have implications for instruction. Our findings support use of a multicomponent reading comprehension intervention that includes vocabulary instruction at the word level and text-based discussion of content that is scaffolded to allow for gradual release toward independent use by students. We think these findings are highly relevant, as they provide initial guidance for how to instruct students with ASD in reading comprehension. School personnel should consider using data to determine appropriate instructional materials aligned with students in addition to providing professional development of teachers followed by instructional coaching with performance feedback. Providing teachers with instructional practices that are associated with even modest improvement for students with ASD may provide needed direction on how to teach these students (Accardo & Finnegan, 2017), as well as confirmation that reading comprehension instruction is a critical step in enhancing these students’ learning opportunities and academic outcomes.
Footnotes
Declaration of Conflicting Interests
The author(s) declared no potential conflicts of interest with respect to the research, authorship, and/or publication of this article.
Funding
The author(s) disclosed receipt of the following financial support for the research, authorship, and/or publication of this article: This research was supported by the Institute of Education Sciences, U.S. Department of Education, through Grant R324A160299 to the University of California, Riverside. The opinions expressed are those of the authors and do not represent the views of the Institute or the U.S. Department of Education.
