
Abstract
Previous researchers have found brief versions of preference assessments correspond to outcomes of longer preference assessments, and that varying levels of problem behavior occur in different preference assessments. Researchers conducted two studies to examine 1-, 2-, and 5-min duration outcomes of the free-operant preference assessment and evaluated the correspondence between the shorter and longer session durations and to identify frequency of problem behavior at each duration. Researchers also assessed relative reinforcing efficacy of the highest preferred stimulus from the shortest duration sessions. Moderate to high correlations were found between the 1- and 2-min sessions and 1- and 5-min sessions across six of eight participants diagnosed with autism spectrum disorder in Study 1 and two of three participants in Study 2. Furthermore, all highest preference stimuli identified in the shortest duration assessment served as reinforcers. Researchers found problem behavior generally occurred more in longer duration sessions.
Keywords
Introduction
A variety of stimulus preference assessments (SPAs) are used to systematically identify stimuli that may function as potential reinforcers for use in behavioral assessments and interventions for individuals with developmental disabilities. Common SPAs include single stimulus (SS; Pace et al., 1985), paired stimulus (PS; Fisher et al., 1992), and multiple stimulus without replacement (MSWO; DeLeon & Iwata, 1996).
As the name implies, SS assessment procedure dictates the presentation of each stimulus singly to an individual (Pace et al., 1985). The stimuli selected or approached the most is considered highly preferred; however, false positive results may surface for some individuals who select most or all the presented stimuli in the assessment (Roane et al., 1998). During the PS assessment, stimuli are presented in pairs until each stimulus has been presented with another stimulus at least once (Fisher et al., 1992). Although the results offer an advantage in yielding a potential hierarchy of most-to-least preferred items, the long duration of the assessment is a major limitation (Roane et al., 1998). Like PS assessments, MSWO assessments frequently yield a hierarchy of the individual’s preferences. During the MSWO assessment, all stimuli are presented collectively at each trial and the individual can select his/her preferred stimulus (DeLeon & Iwata, 1996). When a selection is made, that stimulus is removed from the array before beginning the next trial. Removal of the stimulus produces a clear preference hierarchy; thus, providing data on relative preference for all stimuli. However, removal of the stimuli might evoke problem behavior when the preferred stimuli is removed (Roane et al., 1998; Tung et al., 2017).
Roane et al. (1998) presented a brief free-operant (FO) preference assessment to address the limitations of MSWO and other SPAs. Specifically, the FO assessment was conducted by allowing participants 5-min access to stimuli. Participants were free to interact with any number of stimuli or none during the session. Using a 10-s partial-interval recording system, observers scored the percentage of intervals a participant interacted with and manipulated each stimulus. These assessments were conducted one time per day for between 3 and 5 days for 17 participants (i.e., maximum of five assessments conducted, minimum of three assessments conducted per participant). The results indicated that the FO assessment increased the efficiency of the preference assessment process due to its short duration, limited the impact of restricting items, as well as decreased the influence of the therapist’s behavior by eliminating the trial-by-trial presentation of stimuli (cf., MSWO, PS). The researchers also compared the preference outcomes of FO assessment to PS assessment. Both assessments resulted in similar preferences for a particular stimulus across 47% of participants. Overall, the FO assessment was found to be more time efficient than the PS assessment.
Despite advantages of the FO assessment, a survey by Graff and Karsten (2012) reported 81% of Board-Certified Behavior Analysts (BCBAs) reported lack of time to complete SPAs as the most significant barrier to conducting preference assessments. Therefore, ways to decrease duration of preference assessment might alleviate this barrier or influence BCBAs perceptions on difficulty of conducting a preference assessment to increase likelihood they are conducted. It seems further examinations of modifications to preference assessments should be conducted.
Behavior analysts have attempted to make preference assessments more efficient. For example, to improve the efficiency of the MSWO assessment, Carr et al. (2000) decreased the number of presentation arrays from five to three. Their findings revealed that the 3-session (brief) MSWO could yield stable preferences and predict reinforcing efficacy of stimuli. A limitation of Carr et al. was that they did not directly compare outcomes of 3-session and 5-session MSWO assessments. Richman et al. (2016) addressed this limitation by systematically examining the degree of correlation between 5-session MSWOs and 1-, 2-, 3-, and 4-session MSWOs. They found 3-session MSWOs were significantly and positively correlated to 5-session MSWOs and concluded that 3-sessions could be used for more efficient preference assessment practices, for example, in busy clinical settings. Although they did not report the total time for the 3-session assessments, they did report reducing number from 5- to 3-sessions saved approximately 5 min on average per assessment. Time savings for the MSWO has been found; however, this type of examination of efficiency has yet to be done for free operant preference assessment.
In examining more efficient preference assessments, it is useful to consider at what point is it no longer useful to continue conducting rounds of selection-based sessions or extending the time of duration-based sessions. For FO assessments, within-session patterns of responding have been analyzed to identify at which point of the session is most predictive of relative preference. Rapp et al. (2010) examined within-session patterns of responding for nine children ages 5- to 11-years old following conducting 30-min FO preference assessments to examine if the item first selected in the assessment predicted the top-ranked item across the FO preference assessments. They found that the item first-engaged with identified the top-ranked item during 55% of the sessions, whereas response allocation after the first 5 min of the session identified the top-ranked item during 62% of sessions. That is, the first-engaged item was not indicative of preference rankings when assessing over an extended period. Therefore, duration of assessment may impact outcome of preference rankings. To increase efficiency of FO preference assessments shorter durations of assessments should be examined.
One benefit of decreasing preference assessment session duration may be a decreased risk of problem behavior. Roane et al. (1998) pointed out that the presentation of choices might be similar to the presentation of demands. Therefore, if an individual’s problem behavior is sensitive to negative reinforcement, the individual may more be likely to emit problem behavior. Although a benefit of the FO preference assessment is choices or demands are not present, parallels can easily be drawn to other conditions evoking problem behavior for individuals whose problem behavior is sensitive to negative reinforcement. For example, longer FO preference assessments which would demand the participant stay in the room for assessment up to 30 min at a time (e.g., Rapp et al., 2010). In general, conducting longer durations of preference assessments might lead to evoking more instances of problem behavior by exposing the individual to demands inherent in the assessment or withdrawal of items being assessed. This can pose risks to clients and clinicians, especially if the problem behavior is severe.
Preference assessment format may also evoke problem behavior for participants whose problem behavior is maintained by social positive reinforcement. Tung et al. (2017) examined the effects of preference assessment type on severe problem behavior maintained specifically by access to tangibles. Consistent with previous research (i.e., Kang et al. 2010, 2011; Verriden & Roscoe, 2016), Tung et al. found the lowest levels of problem behavior were observed during and after the FO preference assessment. A novel contribution of Tung et al. was the use of the shorter, 2-min FO sessions, which produced similar results in regards to stimulus selections and preference relative to the PS and MSWO assessments. However, Tung et al. only examined 2-min sessions and did not examine problem behavior and correspondence across other FO durations. Thus, various durations of FO assessment should be examined because each minute spent in assessment may expose participants and clients to a higher risk of engaging in problem behavior. Additionally, Tung et al. did not examine reinforcing efficacy of the items identified as preferred in the 2-min sessions. Therefore, further examination is necessary.
To examine the effects of administration time on FO preference assessment outcomes, and the amount of problem behavior that is evoked by social positive or negative reinforcement, more modifications should be examined. Thus, the purpose of the current study is to (a) determine levels of correspondence between stimulus rankings across different durations of FO preference assessments versus longer durations, (b) examine levels of problem behavior across different durations of the FO preference assessment, and (c) test the reinforcing efficacy of the highest preference stimulus identified from the shortest duration of FO preference assessment.
Method
Study 1
Participants and Setting
Eight participants diagnosed with autism spectrum disorder (ASD) participated in this study. All individuals participated in a preference assessment and subsequent reinforcer assessment. Participants receiving outpatient services in either an early intensive behavioral intervention program or severe behavior clinic were recruited for participation. Keith was an 11-year-old male who engaged in problem behavior such as aggression, self-injurious behavior (SIB), and disruptions. Linda was a 12-year-old female who engaged in SIB. Greg was a five-year-old male who engaged in aggression. Oliver was a three-year-old male who engaged aggression. José was a three-year-old male who engaged in aggression. Rafael was a 15-year-old male who engaged in SIB. John was a 4-year old male who engaged in inappropriate vocalizations (e.g., crying, screaming, etc.). Theo was a 6-year old male who engaged in screaming, crying, and flopping. All assessments took place in a session room (3 m × 4 m) which included a one-way mirror and was furnished with a table, chairs, and toys.
Response Measurement and Interobserver Agreement
In the preference assessment, 10-s partial interval data were collected on item engagement and frequency data were collected on problem behavior. Item engagement was defined as the participant making physical contact with the item (e.g., holding the item) or attending to the item with eye gaze (e.g., watching an iPad). Problem behavior was defined individually for each participant and is displayed in Table 1.
Participant Problem Behavior Information.
Note. SIB = Self-Injurious Behavior, cm = centimeter.
In the reinforcer assessment, 10-s partial-interval data were collected on time allocation in designated areas of the room. Time was scored in the test area if the participant was standing on the side of the room with the high-preference item. Time was scored in the control area if the participant was standing on the side of the room with no item.
In both assessments, a second observer collected data during 33% of all sessions and interobserver agreement (IOA) was calculated. To calculate IOA for engagement in the preference assessment and time allocation in the reinforcer assessment, we divided each session into 10-s intervals and scored an agreement for each interval in which the two data collectors scored that the behavior (i.e., engagement or time allocation in test or control) had occurred. IOA was calculated by dividing agreements by agreements plus disagreements and multiplying by 100. Researchers then averaged data across all sessions for the assessments. To calculate IOA for frequency of problem behavior in the preference assessment, we divided each session into 10-s intervals and scored an agreement for each interval in which the two data collectors measured the same number of responses (i.e., exact agreement within the interval). We then summed the number of agreement intervals and divided the sum by the total number of intervals. Finally, we converted each quotient into a percentage. Mean IOA for all participants’ preference assessment, problem behavior, and time allocation in the reinforcer assessment can be found in Table 2.
Interobserver Agreement for Preference Assessment, Problem Behavior, and Time Allocation.

Examination of Preference Assessment Durations
Prior to the FO preference assessment, researchers interviewed clinicians to identify six stimuli to be included in the assessment (Roane et al., 1998). At the beginning of the session, stimuli were placed in a room with the participant. The therapist vocally prompted the participant to sample each item before the start of the session by saying, “Here is the (item). You can play with it if you want.” The participant was provided with access to each item for approximately 30 s. If the participant did not comply with putting an item down independently, the therapist used hand-over-hand prompting for the participant to put the item down. After the participant sampled all items, the session began and the participant had free access to all the items. Researchers evaluated three session durations: 1 min, 2 min, and 5 min. Sessions were conducted consecutively starting with 1-min duration sessions and progressing to 5-min duration sessions with a minimum of a 30-s break in between each session. Researchers conducted this sequence of sessions three times; therefore, each session duration was conducted three times (i.e., 1 min, break, 1 min, break, 1 min, break, 2 min, break, 2 min, break, 2 min, break, 5 min, break, 5 min, break, 5 min, break). Access to items was blocked or denied in between sessions. Researchers were present in the room during all sessions and did not deliver any social consequences for problem behavior during the assessments. Researchers then averaged the percentage of time allocation for each stimulus across the three session durations. Researchers then ranked the stimuli based on highest percentage of time allocation for each session duration. If there was a tie, we determined rank by summing the remaining ranks together and dividing by the number of items tied as has been done in previous research (Verriden & Roscoe, 2016). Researchers then calculated Spearman rank-order correlations for 1-min and 2-min sessions, and 1-min and 5-min sessions. We defined correspondence as a coefficient equal to or above the critical r value of .60 (Cicchetti & Sparrow, 1981; Salkind, 2013). This was also due to previous researchers’ work on conducting multiple preference assessment administrations over time who used this critical value (e.g., Hanley et al, 2006).
Evaluation of Reinforcing Efficacy
To examine the reinforcing efficacy of the preferred items, researchers conducted a concurrent operants reinforcer assessment similar to the procedures described by Roane et al. (1998). The room was divided into equal halves indicated by a line of tape placed on the ground. Each side of the room had one table. The high preference item from the 1-min FO preference assessment was placed on the table on one side of the room (test) and the other table was empty (control). The participants were exposed to both sides for 10 s and given the instruction, “You can play where you want, or you don’t have to.” If the participant attempted to take the item across the tape to the other side of the room, the therapist removed the item from the participant and placed it back on the table. No verbal directions were given. To counterbalance item position, the highest preference item was rotated between sides following the end of each session. All sessions were 5 min.
Results and Discussion
Preference Assessment and Problem Behavior
Table 3 displays the results of the Spearman’s correlation coefficients for Study 1, determination of correlation between the 1- and 2-min session assessments for the correlation of item preference ranking between stimuli used in the preference assessment. For six of eight participants strong correlation was found between 1-and 2-min sessions. For five of eight participants strong correlation was found between 1- and 5-min sessions. Overall, researchers observed if correspondence based on correlation was found between the 1- and 2-min sessions, then there would also be a correspondence found between the 1- and 5-min sessions. This occurred for 5 of 6 participants. This suggests that most participants’ preference was stable across increasing durations. Participants for whom correspondence was not found in the comparison of 1- to 2-min sessions, also did not display correspondence in the 1 to 5-min sessions suggesting stability of preference across increasing session durations was low.
Spearman’s Rho for Preference Assessments by Rank Order for Study 1.

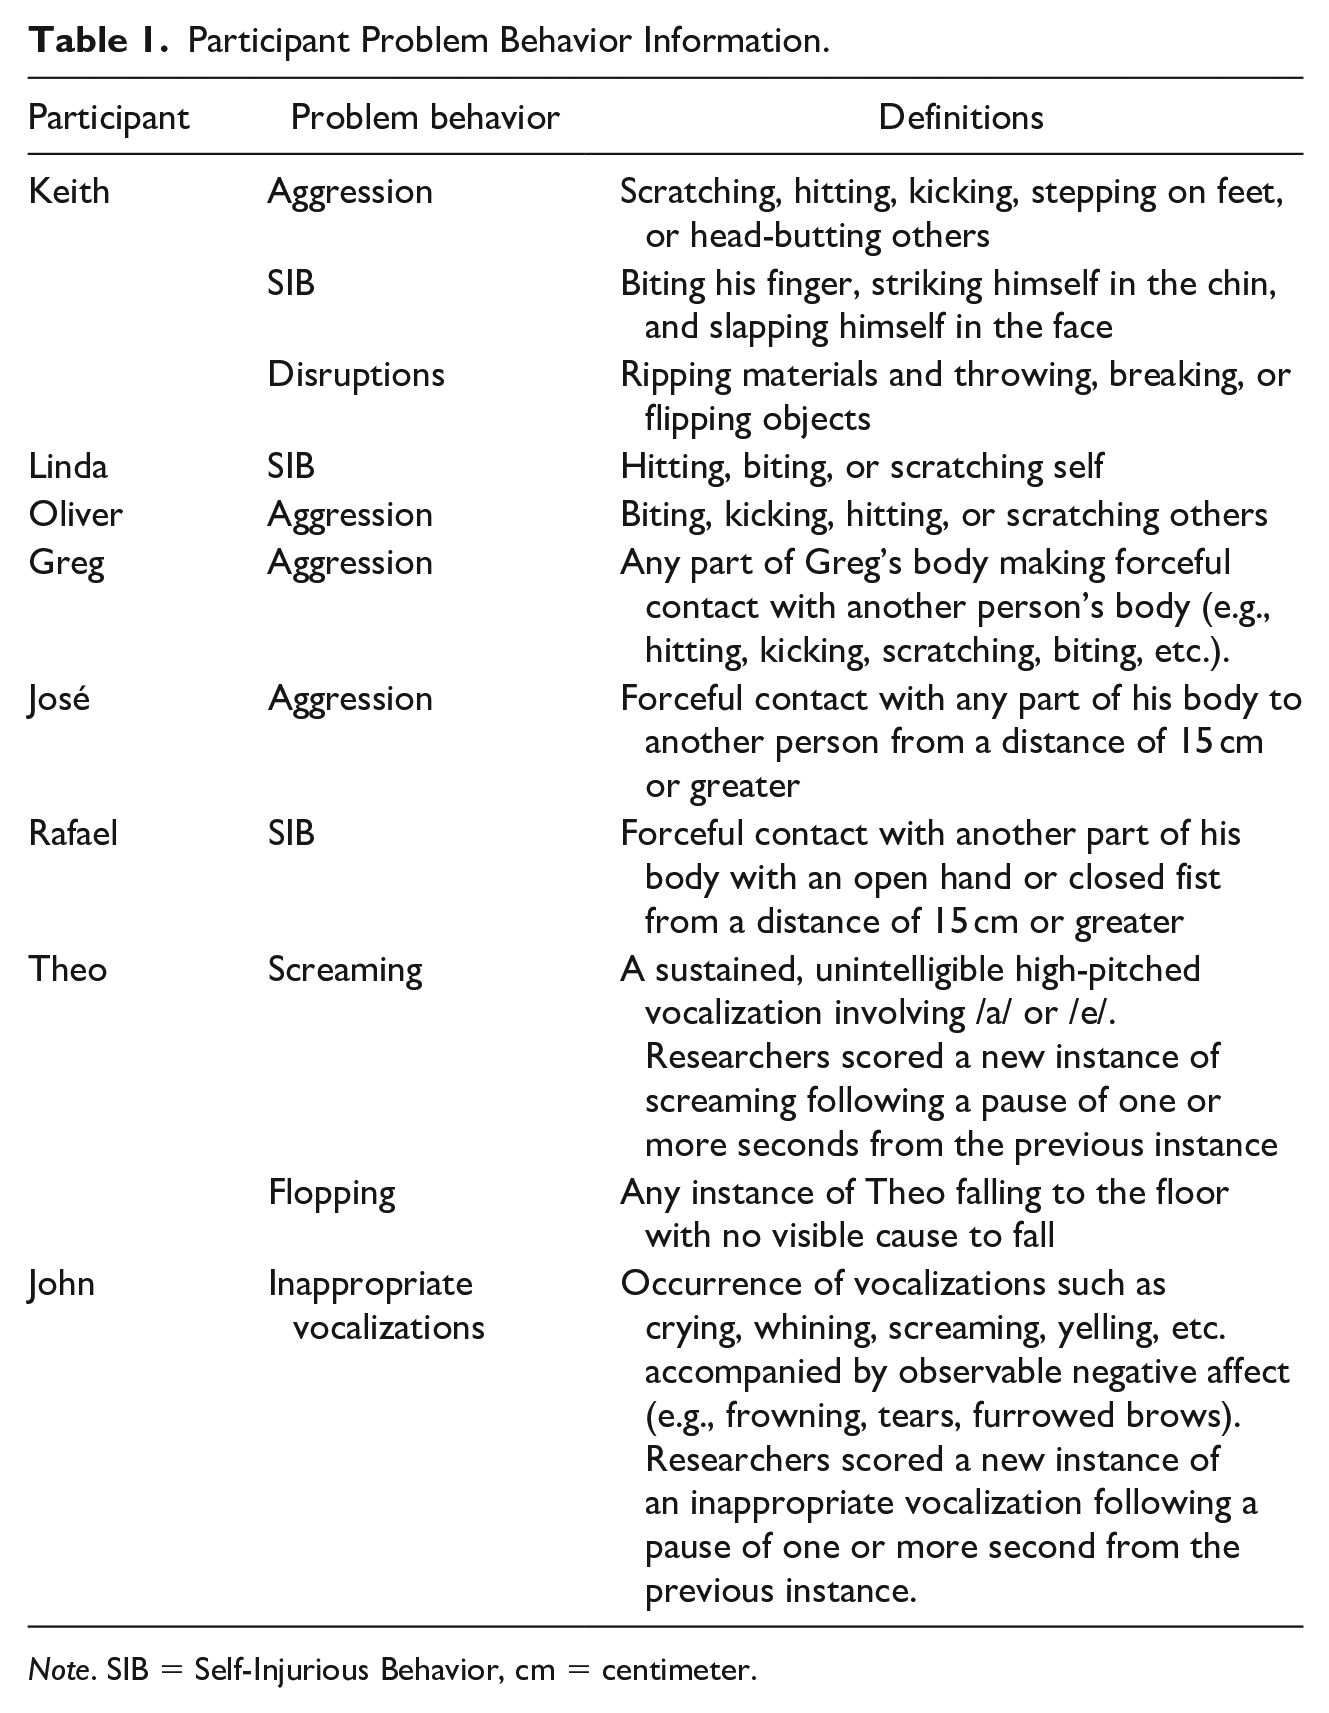
Figure 1, top panel, depicts the outcomes of the FO preference assessment and frequency of problem behavior in each duration of the FO for Keith. He had the highest levels of engagement with Playdoh across all durations of the FO preference assessments with a mean of 100%, 14%, and 88% of intervals with item engagement across the 1-, 2-, and 5-min sessions, respectively. Keith emitted the least amount of problem behavior in the 1-min sessions. Problem behavior occurred at a mean frequency of 0.33, 9, and 6 across the 1-, 2-, and 5-min sessions, respectively.
FO preference assessment outcomes and individual and mean frequencies of problem behavior across sessions for Keith and Linda.
Figure 1, bottom panel, depicts the outcomes of the FO preference assessment and frequency of problem behavior in each duration of the FO for Linda. She had the highest levels of engagement with the iPhone across the 1- and 5-min FO preference assessments with a mean of 33% and 67% of intervals with item engagement, respectively. She had the highest level of engagement with the iPad in the 2-min FO preference assessment with a mean of 36% followed by the iPhone with a mean of 33% of intervals with item engagement. She displayed no problem behavior in the 2-min FO preference assessments, followed by a mean frequency of 1 and 3 in the 1- and 5-min sessions, respectively. She also emitted the least amount of problem behavior in the 2-min sessions.
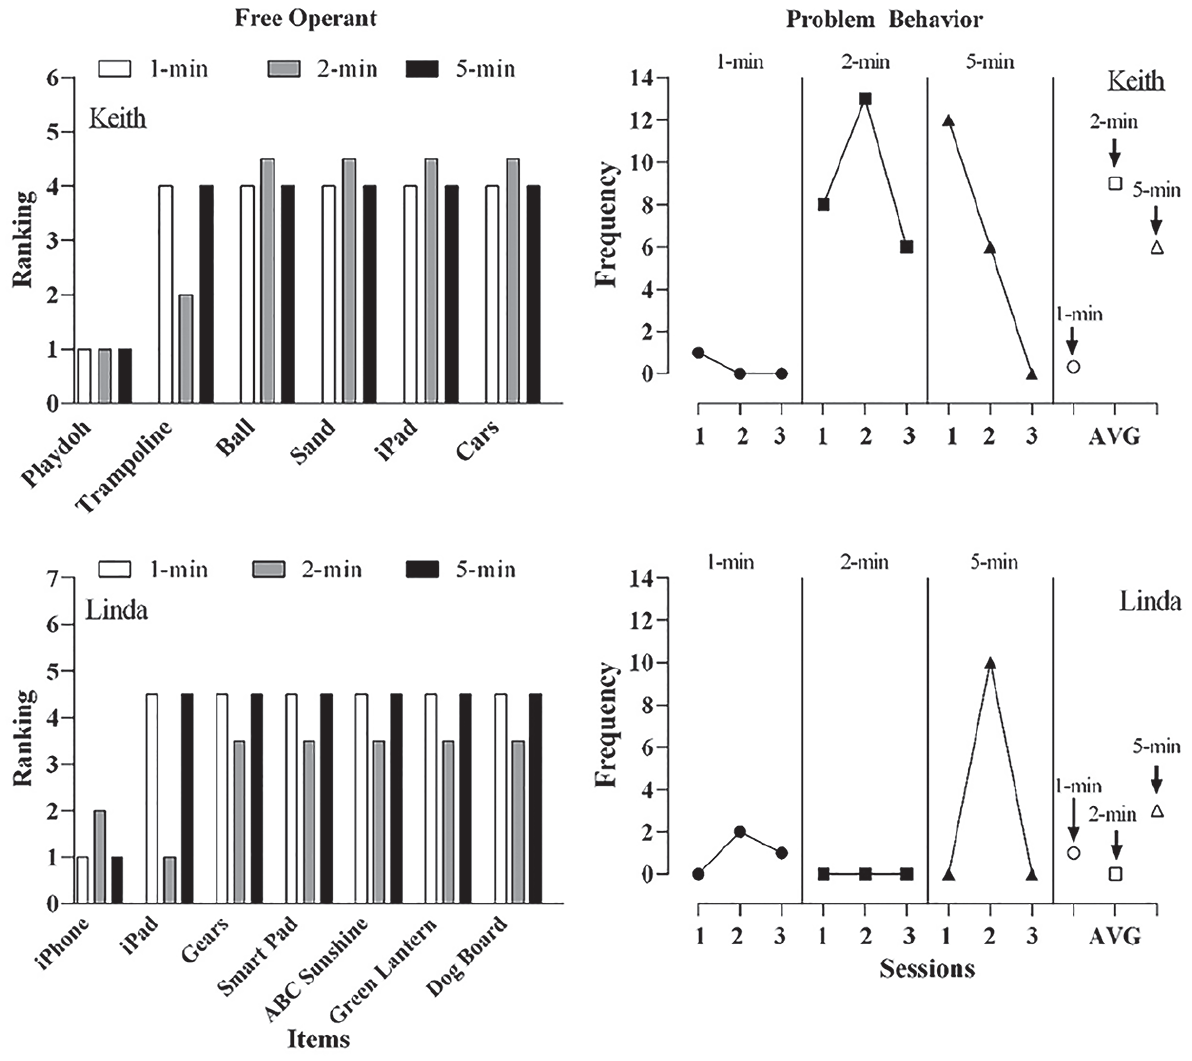
Figure 2, top panel, shows the outcomes of the FO preference assessment for Oliver and frequency of problem behavior in each duration of the FO. He had the highest levels of engagement with the iPad across all durations of the FO preference assessment with a mean of 65%, 50%, and 55% of intervals with item engagement across the 1-, 2-, and 5-min sessions, respectively. He emitted no problem behavior in the 1-, 2-, and 5-min sessions.
FO preference assessment outcomes and individual and mean frequencies of problem behavior across sessions for Oliver and Greg.
Figure 2, bottom panel, shows the outcomes of the FO preference assessment and frequency of problem behavior in each duration of the FO for Greg. He had the highest levels of engagement with the dinosaur toy across all durations of the FO preference assessments with a mean of 83%, 54%, and 59% of intervals with item engagement across the 1-, 2-, and 5-min sessions, respectively. He displayed no problem behavior in the 2-min sessions. Problem behavior occurred at a mean frequency of 0.67 and 0.33 across the 1- and 5-min sessions, respectively.
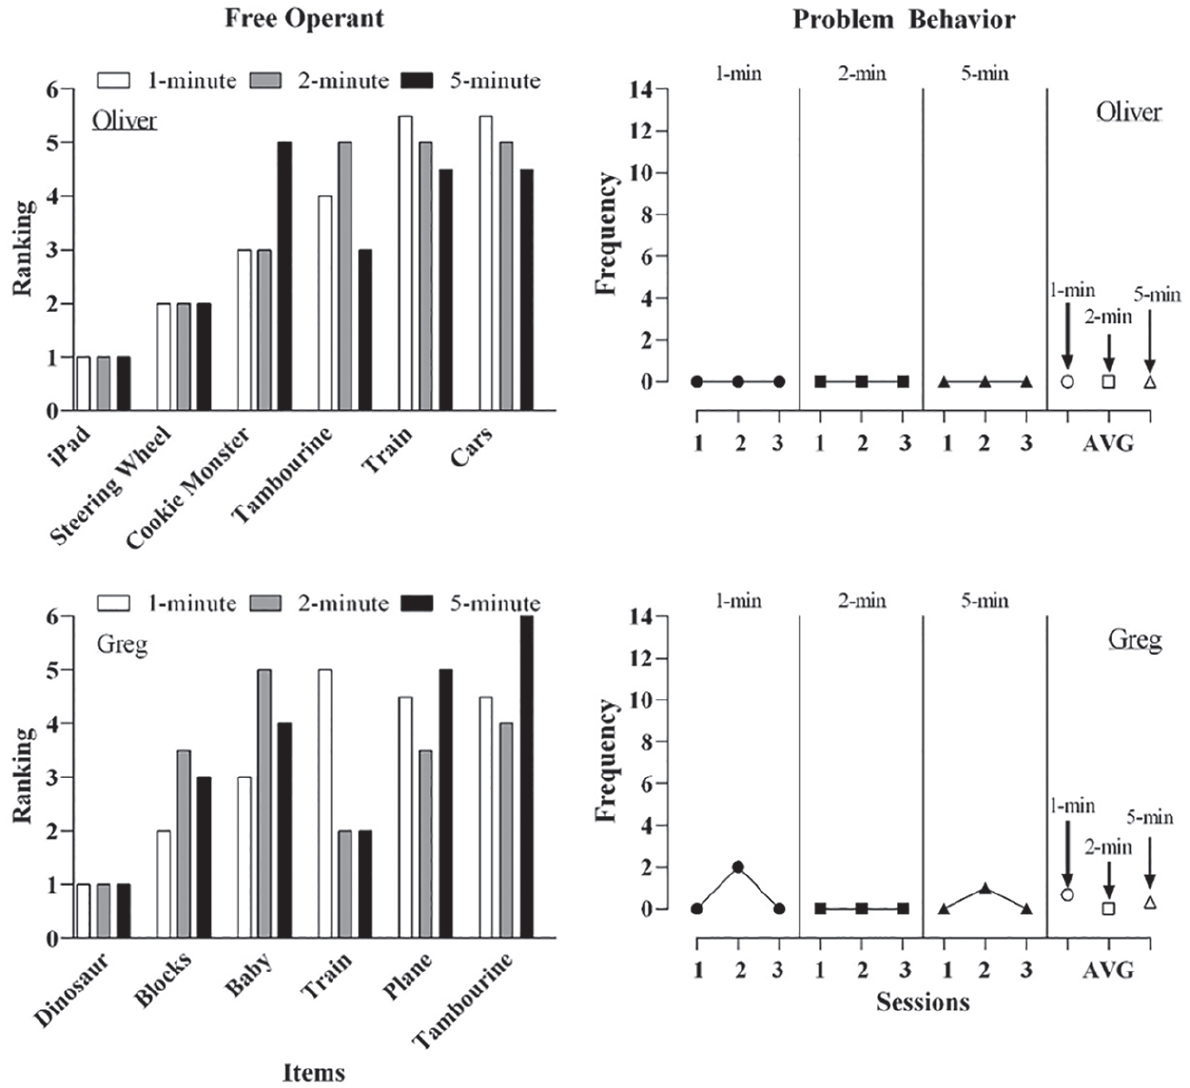
Figure 3, top panel, shows the outcomes of the FO preference assessment and frequency of problem behavior in each duration of the FO for José. He had the highest levels of engagement with playdoh across the 1- and 2-min sessions of the FO preference assessments with a mean of 44% and 39% of intervals with item engagement, respectively. He had the highest levels of engagement with the tambourine in the 5-min session with a mean of 31% of intervals with item engagement. He emitted no problem behavior in the FO preference assessments.
FO preference assessment outcomes and individual and mean frequencies of problem behavior across sessions for José and Rafael.
Figure 3, bottom panel, shows the outcomes of the FO preference assessment and frequency of problem behavior in each duration of the FO for Rafael. He had the highest levels of engagement with iPad across all durations of the FO preference assessments with 100% of intervals with item engagement across the 1-, 2-, and 5-min sessions. He emitted no problem behavior in the FO preference assessments.
Figure 4, top panel, shows the outcomes of the FO preference assessment and frequency of problem behavior in each duration of the FO for Theo. He had the highest levels of engagement with the people toy across the 1- and 2-min sessions of the FO preference assessments with a mean of 89% and 47% of intervals with item engagement across the 1-, 2-, sessions, respectively. However, in the 5-min sessions he engagement was allocated exclusively to the White Board. He emitted no problem behavior in the FO preference assessments.

FO preference assessment outcomes and individual and mean frequencies of problem behavior across sessions for Theo and John.
Figure 4, bottom panel, shows the outcomes of the FO preference assessment and frequency of problem behavior in each duration of the FO for John. He had the highest levels of engagement with Links across all durations of the FO preference assessments with a mean of 100% of intervals with item engagement across the 1-, 2-, and 5-min sessions. He emitted no problem behavior in the FO preference assessments.
Problem behavior was emitted by three of eight participants during the preference assessment. For these three participants, researchers saw more total combined instances of problem behavior in the 5-min sessions relative to the 1-min and 2-min sessions.
Reinforcer Assessment
Figure 5 displays the results of the reinforcer assessment for all participants. Differentiation was observed between the high-preference item and the control for all participants suggesting the items identified as highest-preference in the 1-min duration sessions functioned as reinforcers for all participants. Keith’s average percent of time allocation for the high-preference item (Playdoh) was 96% (range, 87–100%). The average percent of time allocation for the control was 8% (range, 0% to 13%). Linda’s average percent of time allocation for the high-preference item (iPhone) was 80% (range, 0–100%). The average percent of time allocation for the control was 20% (range, 0–100%). Linda allocated her time to the iPhone for 100% of the session for four of five sessions. During the second session, she allocated 0% of her time to the high-preference item. Oliver’s average percent of time allocation for the high-preference item (iPad) was 82% (range, 2–100%). The average percent of time allocation for the control was 16% with a range of 0% to 97%. Greg’s average percent of time allocation for the high-preference item (dinosaur toy) was 96% (range, 87–100%). The average percent of time allocation for the control was 4% (range, 0–13%). José’s average percent of time allocation for the high-preference item (Playdoh) was 86% (range, 53–100%). The average percent of time allocation for the control was 40% (range, 7–77%). Rafael’s average percent of time allocation for the high-preference item (iPad) was 99% (range, 97–100%). The average percent of time allocation for the control was 30% (range, 10–63%). Theo’s average percent of time allocation for the high-preference item (people) was 92% (range, 77–100%). The average percent of time allocation for the control was 15% (range, 0–37%). John’s average percent of time allocation for the high-preference item (Links) was 73% (range, 0–100%). The average percent of time allocation for the control was 27% (range, 0–100%).

Reinforcer assessments for all participants in Study 1.
It is worthwhile to point out that some of the participants (i.e., Linda session 2, Oliver session 2, and John session 1) allocated 100% of their time to the control option in early reinforcer assessment sessions. This may have been due to insufficient exposure to the contingencies since they were early sessions. It may also have been due to habituation with preferred stimuli.
Study 2
To further investigate outcomes from differing durations of FO preference assessment, researchers conducted a second study. A potential limitation of Study 1 was that habituation to stimuli may have occurred due to session order. Indeed, the effect of pre-session exposure to stimuli being assessed may affect subsequent preference assessments (Chappell, et al., 2009; Gottschalk et al., 2000; McAdam et al., 2005). Additionally, more frequent removal of toys in consecutive 1-min sessions may have evoked more problem behavior relative to the less frequent removal of toys across 5-min sessions. Furthermore, different durations sessions were run consecutively (i.e., 1-min to 2-min to 5-min) with only a 30 s break separating sessions. This may have increased the establishing operation for escape as a reinforcer for sessions that came later in the sequence. In Study 2, researchers quasi-randomized and counterbalanced the session order for three participants across 1-, 2-, and 5-min sessions to control for sequence effects across session durations. That is, randomization of the three session durations occurred with the limitation that two of the same duration sessions could not occur consecutively, and all three durations had to occur before a second presentation of the same duration occurred.
Participants and Setting
Three participants that participated in Study 1 also participated in this study (Rafael, Theo, and John). Participants were selected based upon willingness to participate and clinic scheduling availability. All individuals first participated in a preference assessment. If participants’ preferences did not match the outcomes of Study 1 (i.e., Theo), then another reinforcer assessment was conducted to determine reinforcing efficacy of the highest preference item in the shortest duration. We also compared relative reinforcing efficacy of the previously identified highest preference item to determine if the item would still serve as a reinforcer for clinical purposes. All assessments took place in a session room (3 m × 4 m) which included a one-way mirror and was furnished with a table, chairs, and toys.
Response Measurement and Interobserver Agreement
Procedures were similar to Study 1 for the preference assessment, reinforcer assessment, and the collection of IOA. The only exception was different durations of FO preference assessment sessions were pseudo-randomized and counterbalanced. In both assessments, a second observer collected data during 33% of all sessions and partial-interval agreement was calculated by dividing agreements by agreements plus disagreements and multiplying by 100. Researchers then averaged data across all sessions for both assessments.
IOA for Rafael’s item engagement in the preference assessment was 99% (range, 99–100%) and frequency of problem behavior was 100%. IOA for John’s item engagement in the preference assessment was 98% (range, 84–100%) and frequency of problem behavior was 100%. IOA for Theo’s item engagement in the preference assessment was 96% (range, 81–100%), frequency of problem behavior was 100%, and time allocation was 92% (range, 81–99%). Theo’s mean IOA for percent of time allocation for the high-preference item from Study 1 (people) was 90% (range, 82–99%). The mean IOA for percent of time allocation for the high-preference item from Study 2 (magnet letters) was 95% (range, 90–99%). The mean IOA for percent of time allocation for control 92% (range, 87–96%).
Results
Table 4 displays results of Spearman’s correlation coefficients for Study 2 and determination of correlation between the 1- and 2-min sessions and 1- and 5-min assessments for the correlation of item preference ranking between stimuli used in the preference assessment. For all three participants, we found a strong correlation between 1- and 2-min sessions. For two of three participants, we found a strong correlation between 1- and 5-min sessions.
Spearman’s Rho for Preference Assessments by Rank Order for Study 2.

Figure 6 displays the results from the preference assessment and frequency of problem behavior during the assessment for Rafael, Theo, and John. The top panel, shows the outcomes of the FO preference assessment and frequency of problem behavior in each duration of the FO for Rafael. He had the highest levels of engagement with iPad across all durations of the FO preference assessments with 67%, 67%, and 73% of intervals with item engagement across the 1-, 2-, and 5-min sessions, respectively. He emitted 3 instances problem behavior in the second 5-min duration session of FO preference assessments. On average, he emitted 0, 0, and 1 instances of problem behavior across the 1-, 2-, and 5-min sessions, respectively. The middle panel shows the outcomes of the FO preference assessment and frequency of problem behavior in each duration of the FO for Theo. He had the highest levels of engagement with the Magnet Letters across the 1-min sessions of the FO preference assessments with a mean of 56% intervals with item engagement. He emitted no problem behavior in the FO preference assessments. The bottom panel, shows the outcomes of the FO preference assessment and frequency of problem behavior in each duration of the FO for John. He had the highest levels of engagement with Links across all durations of the FO preference assessments with a mean of 100% of intervals with item engagement across all session durations. He emitted one instance of problem behavior in the 5-min sessions of FO preference assessment. On average he emitted 0, 0, and .33 instances of problem behavior across the 1-, 2-, and 5-min sessions, respectively
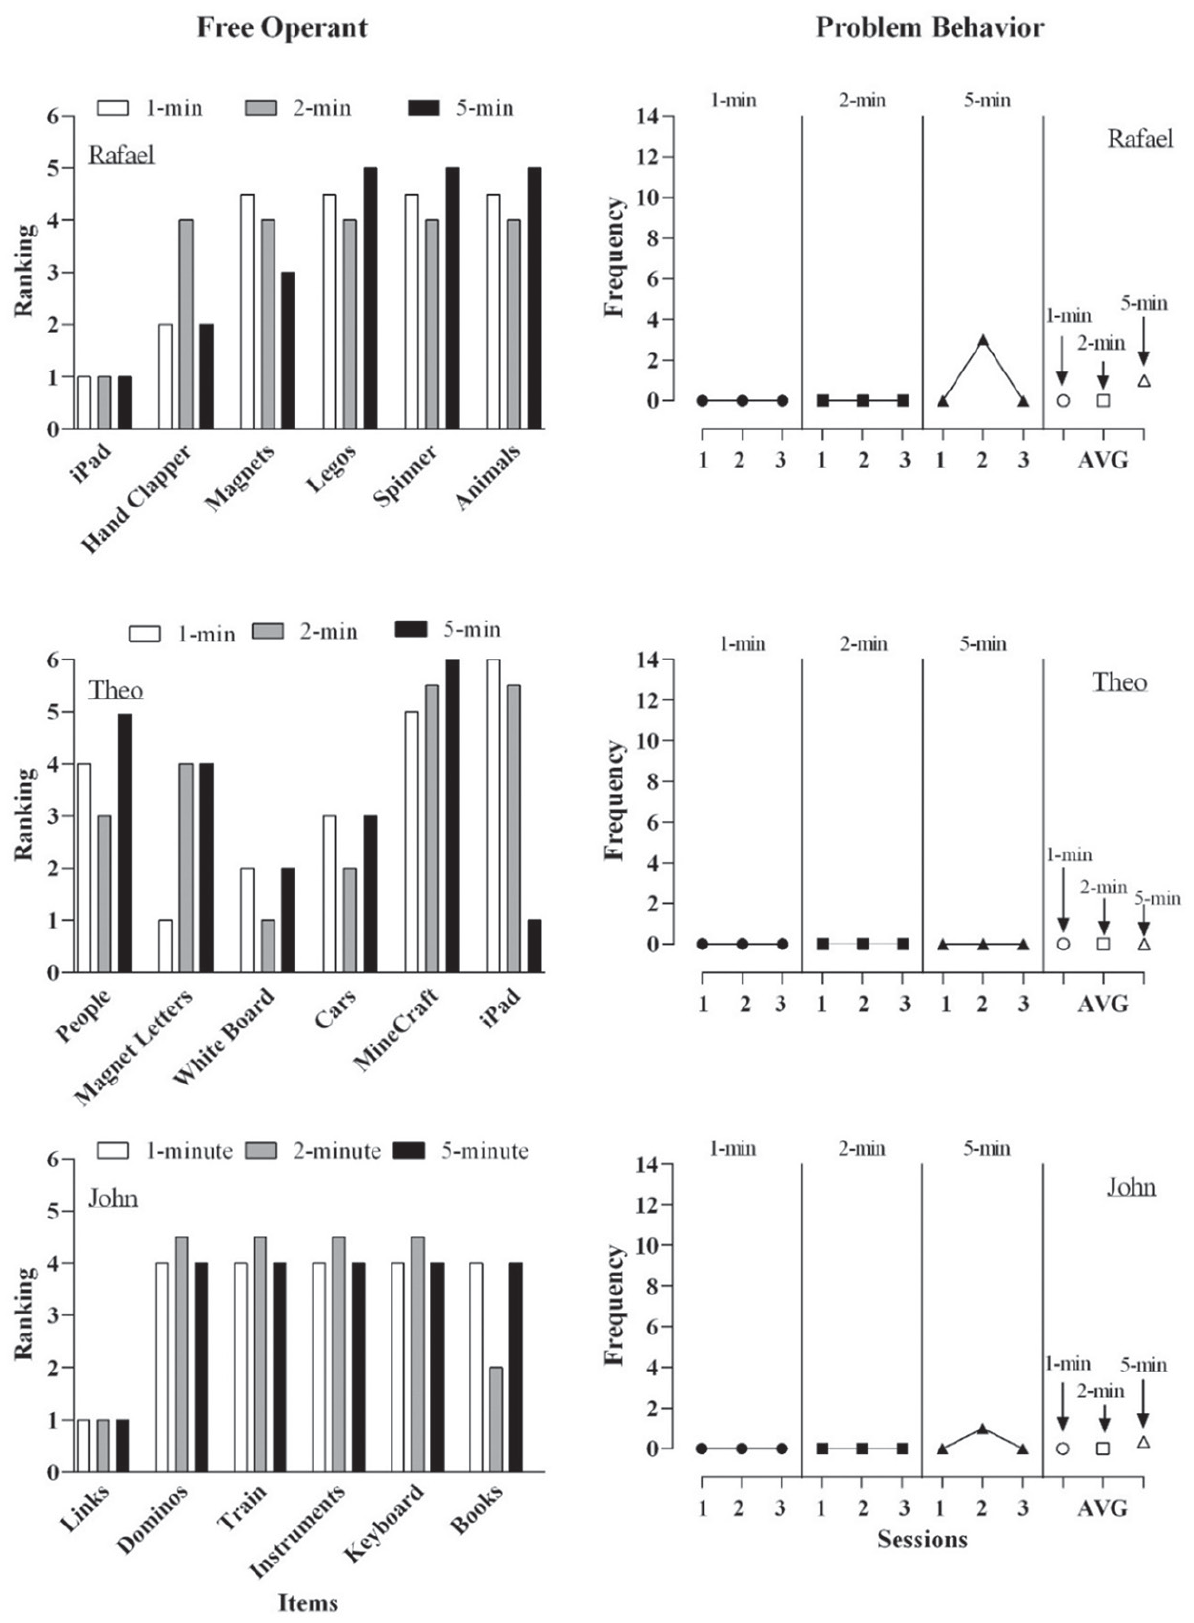
FO preference assessment outcomes and individual and mean frequencies of problem behavior across sessions for all participants in Study 2. Note: Order of sessions is not chronological as in Study 1.
Figure 7 displays the results of the reinforcer assessment for Theo. Theo’s average percent of time allocation for the high-preference item from Study 2 (Magnet letters) was 87% (range, 53–100%). Theo’s average percent of time allocation for the high-preference item from Study 1 (Toy People) was 24% (range, 0–67%). The average percent of time allocation for the control was 22% (range, 0–67%).

Study 2 reinforcer assessment for Theo.
General Discussion
We found an acceptable strength of correlation (i.e., at or above .60) of the FO preference assessment 1-min duration sessions to the 2- and 5-min duration sessions for six of eight and five of eight participants, respectively. Furthermore, we found a strong correlation for all but one participant in one comparison (i.e., 1- to 5-min) when counterbalancing different duration assessments. Additionally, the brief 1-min duration sessions predicted reinforcing efficacy of the highest preference stimuli for all participants. Researchers also found problem behavior occurred more on average in longer sessions when session order was counterbalanced. These data suggest that using a brief 1-min FO preference assessment may be a more efficient method of determining individual preferences and identifying potential reinforcing stimuli.
Karsten et al. (2011) proposed a model to systematically advance from one method of stimulus preference assessment (SPA) to another. The objective was that the guidelines would serve as a starting point for professionals who are unsure whether SPAs are feasible in their setting and for those who will add SPAs to their practices for the first time. The research-based guidelines are meant to encourage practitioners that SPAs can be conducted quickly and successfully for a wide range of individuals and that combining SPA-derived reinforcers with evidence-based teaching can enhance learning. The brief FO preference assessment could offer an additional efficient model for conducting SPAs. For example, if a time-limited teacher is working with a student that engages in high-frequency, high-intensity problem behavior and a functional analysis (FA) has not yet been conducted, the teacher might conduct a brief FO preference assessment to identify a reinforcer for immediate use in the student’s educational programming.
Conducting brief FO preference assessments at 1-min and 2 min intervals has multiple advantages. One advantage is that 1-min and 2-min access may be more indicative of what might occur in a skill building environment such as early intensive behavioral intervention (EIBI). Previous researchers have established that relative preference for a stimulus may be determined by the duration for which that stimulus is available (Steinhilber & Johnson, 2007). Therefore, if access to a preferred stimulus might only be available for up to 1-min (e.g., in discrete trial teaching where multiple trials and reinforcer administrations are occurring), then 1-min assessments of duration may be useful. 1 It has also been suggested that stimuli and preference assessments should be selected to increase ecological fit, or how well a stimulus fits into the environment in which it will be used (DeLeon et al., 2014). This would imply using stimuli that are effective as reinforcers at shorter durations, or stimuli that may be able to be assessed in sessions of short duration. Additionally, conducting multiple 1-min brief FO preference assessment sessions with time in between each session may control for effects of habituation to stimuli in both assessment and educational programming.
In examining ecological fit for a brief FO preference assessment, it is worth noting early intervention for children with ASD procedures commonly consist of multiple trials of task demands each followed by brief access to reinforcer. This has been referred to as distributed, disfluent, or discontinuous arrangement of reinforcers (DeLeon et al., 2014, Fienup et al., 2011; Ward-Horner et al., 2014). Research on which is more effective, continuous or discontinuous reinforcers has mixed conclusions and likely depends on the characteristics of the individuals being assessed. For example, Ward-Horner et al. (2017) found that two 4- and 5-year-old children with ASD initially preferred a discontinuous arrangement with shorter access to reinforcers, but preference was switched when magnitude and quality manipulations were made. Ward-Horner et al. suggested the initial preference may have been due to the children being younger and more impulsive. Therefore, shorter assessment and access periods maybe more effective in an early intervention context.
Another advantage to the shorter assessment may be the further reduced risk of problem behavior. Although, a benefit of the FO preference assessment is reduced likelihood of evoking problem behavior, multiple 5-min sessions are frequently conducted resulting in approximately 15 to 20 min of exposure to a putative establishing operation (EO). Whereas, a shorter assessment of multiple 1-min sessions would result in 3 to 5 min of exposure to an EO. It is worth mentioning that we did not see a high occurrence of problem behavior; however, we felt the severity of problem behavior (e.g., aggression) was socially significant. We observed fewer instances of problem behavior on average during the shorter sessions for two of three participants when session order was counterbalanced. However, we saw more instances problem behavior in the shorter sessions when we ran consecutive sessions of the same duration (i.e., 1 min). Future research is needed in order to identify the variables that resulted in higher levels of problem behavior in the 1-min and 2-min sessions for some participants. For example, the order in which the sessions were conducted in Study 1 was chronologically-based starting with repeated shorter durations (i.e., 1-min sessions) and increasing to longer (i.e., 5-min sessions); therefore, EOs may be have remained in place across multiple sessions increasing likelihood problem behavior occurred in later sessions (i.e., 5-min sessions). In Study 2, however, we found problem behavior only occurred in the 5-min duration sessions and occurred less overall on average when compared to Study 1. Future research should examine temporal spacing of duration- and selection-based preference assessments to account for EOs that may evoke problem behavior.
Tung et al. (2017) measured problem behavior during and after preference assessment sessions and found that all participants in the study engaged in problem behavior following some or all the FO preference assessment sessions. In Study 1, sessions were conducted consecutively resulting in the removal of items between sessions which could have impacted the results. It is possible that researchers observed a carryover effect of problem behavior due to the removal of tangibles following a short duration of access, resulting in higher levels of problem behavior for some participants during the 1-min preference assessment sessions. A limitation of the current research is that problem behavior was only measured during the preference assessment sessions, data were not collected on problem behavior between trials for all participants so conclusions cannot be drawn on this point. Future studies should consider including collection data between trials for further analysis of problem behavior that may be evoked of the entire course of SPA. This data could also serve to provide a better picture of overall problem behavior at any time during the assessment process, which may be helpful for practitioners.
A limitation of the current research was that not all participants had FAs conducted on their problem behavior so we could not report these data for all participants. Therefore, researchers cannot draw firm conclusions that the shorter-duration FO preference assessment is appropriate for individuals with problem behavior maintained by access to social positive or negative reinforcement. However, preference assessments are usually conducted before FAs so identifying a preference assessment format that evokes the least amount of problem behavior is valuable despite the function of the problem behavior.
Recent researchers have examined the validity of using a free-operant competing stimulus assessment (FOCSA) to inform a competing stimulus intervention for automatically-maintained problem behavior (Brogan et al., 2018; Frewing et al., 2015). Frewing et al. (2015) conducted one to three 30-min FOCSA sessions for four participants and found that a highly-preferred, low-stereotypy item (i.e., item with high engagement leading to lower levels of stereotypy) consistently was predicted by the combined data from the first 5 min of three FOSCA sessions. Findings from the current study might provide rationale to examine shorter sessions of FOCSA to identify preferences and simultaneously identify effective competing stimuli.
Another limitation of this research was the number of FO preference assessment sessions that were conducted at each duration. Three sessions were conducted at each duration based on single-subject convention in establishing dependent measure stability (Kazdin, 2011). However, previous researchers have conducted up to eight sessions when comparing correspondence across different preference assessment formats (cf., Carr et al., 2000). Future examinations comparing brief durations should include more sessions to draw firm conclusions on correlations across different types of preference assessment formats and arrangements.
A final limitation is related to the social validity of the reinforcer assessment. The reinforcer assessment arrangement we chose to use was based on previous past literature (e.g., Piazza et al., 1996; Roane et al., 1998); however, it could be argued that time allocation in a specific space relative to a different space with nothing in it may not be a relevant response to examine reinforcing efficacy. That is, a different task such as academic responding may have higher social validity when examining reinforcing efficacy.
In sum, it may be more efficient for practitioners to first conduct a brief FO preference assessment. For some clients, this may also lead to fewer instances of problem behavior during the initial assessment process due to less overall time exposed to conditions of the preference assessment. Future researchers should examine if more problem behavior occurs in certain preference assessments based on the function of problem behavior. For example, if a participant has escape maintained behavior, a preference assessment that has more demands inherent in the procedures may be less desirable than a preference assessment that has less.
Future researchers should also measure maintenance of preference following brief preference assessments. Additionally, correspondence between brief FO preference assessments and other types of preference assessment should be conducted. Lastly, future researchers should examine more modifications to increase efficiency of current preference assessment procedures while maintaining reliable and predictive outcomes of preference assessment.
Footnotes
Acknowledgements
Researchers would like to thank Courtney Jorgenson, Ali Ball, Marissa Roll, Nelungwe Darby, and Nicole Schroeder for their assistance with data collection.
Anne M. Clohisy is now in private practice.
Declaration of Conflicting Interests
The author(s) declared no potential conflicts of interest with respect to the research, authorship, and/or publication of this article.
Funding
The author(s) received no financial support for the research, authorship, and/or publication of this article.