
Abstract
Hierarchical linear modeling (HLM) has been recommended as a meta-analytic technique for the quantitative synthesis of single-case experimental design (SCED) studies. The HLM approach is flexible and can model a variety of different SCED data complexities, such as intervention heterogeneity. A major advantage of using HLM is that participant and-or study characteristics can be incorporated in the model in an attempt to explain intervention heterogeneity. The inclusion of moderators in the context of meta-analysis of SCED studies did not yet receive attention and is in need of methodological research. Prior to extending methodological work validating the hierarchical linear model including moderators at the different levels, an overview of characteristics of moderators typically encountered in the field is needed. This will inform design conditions to be embedded in future methodological studies and ensure that these conditions are realistic and representative for the field of SCED meta-analyses. This study presents the results of systematic review of SCED meta-analyses, with the particular focus on moderator characteristic. The initial search yielded a total of 910 articles and book chapters. After excluding duplicate studies and non peer-reviewed studies, 658 unique peer-reviewed studies were maintained and screened by two independent researchers. Sixty articles met the inclusion criteria and were eligible for data retrieval. The results of the analysis of moderator characteristics retrieved from these 60 meta-analyses are presented. The first part of the results section contains an overview of moderator characteristics per moderator level (within-participant level, participant level, and study level), including the types of moderators, the ratio of the number of moderators relative to the number of units at that level, the measurement scale, and the degree of missing data. The second part of the results section focuses on the metric used to quantify moderator effectiveness and the analysis approach. Based on the results of the systematic review, recommendations are given for conditions to be included in future methodological work.
Single-case experimental designs (SCEDs) are becoming increasingly popular as a means to establish an evidence base for interventions (Kratochwill & Levin, 2010), especially in behavioral sciences. Along with the increased number of published SCED studies, there is a growing interest in the quantitative synthesis of SCED data across studies (Jamshidi et al., 2018). Meta-analysis can be used to quantitatively summarize SCED studies in a standardized, objective, reliable, and valid manner (Glass, 1976; Kratochwill et al., 2010; Shadish et al., 2013). By synthesizing the effectiveness of an intervention across a large body of literature, an evidence-base on a particular intervention can be created and important decision can be made based on scientific evidence. In contrast to the well-established and broadly applied methods for meta-analysis of group-comparison design studies (e.g., Cohen’s d, Borenstein et al., 2009; Hedges’ g, Hedges & Olkin, 1985), there is a lack of consensus about which methods can be applied to meta-analyze single-case experimental design (SCED) studies (Van den Noortgate & Onghena, 2008). Similar to group-comparison design studies, the effect of an intervention can be quantified by comparing the mean of data obtained during an experimental condition and the mean of data obtained during a baseline condition (i.e., no intervention is given; Hedges et al., 2012, 2013). The fundamental difference between a group-comparison design study and an SCED study is the unit of analysis. For group-comparison designs the average score across participants assigned to the baseline condition is compared to the average score across participants assigned to the experimental condition. In contrast, individual participants are the unit of analysis in SCEDs. Participants in SCED are not assigned to a treatment and control group, but are repeatedly measured during both baseline and intervention conditions. As a consequence, the participant serves as its own control and no comparison group is needed (Kratochwill et al., 2010; What Works Clearinghouse, 2020). In order to make inferences related to intervention effectiveness beyond an individual participant, SCED relays upon within study and across study replication (Horner et al., 2005; Kazdin, 2011). The experiment needs to be replicated across individuals (which is usually accomplished within one SCED study). Moreover, either direct or systematic replication has to occur across multiple studies in order to establish an evidence-base and enhance external validity (Ferron & Scott, 2005; Horner et al., 2005). As a consequence, SCED research is time consuming and demanding. Because of the aforementioned fundamental differences between group-comparison designs and SCEDs, analysis techniques appropriate for group-comparison designs s are not transferable to SCED and different methods need to be considered.
Types of Analysis for SCED
During the last decade, a variety of different methods have been developed to quantify intervention effectiveness within and across SCED studies. Examples include metrics for quantifying the intervention effect per participant (e.g., non-overlap metrics and regression-based metrics, Parker, Vannest, & Davis, 2011) to approaches suitable to summarize intervention effectiveness across participants (Ferron et al., 2009) and even across studies, such as hierarchical linear modeling (Van den Noortgate & Onghena, 2003a, 2003b). The metrics to quantify the intervention effectiveness can be classified into four broad categories: (a) non-overlap metrics (e.g., PND, Scruggs et al., 1987; IRD, Parker et al., 2009; NAP, Parker & Vannest, 2009; Tau, Parker, Vannest, Davis, & Sauber, 2011; Tarlow, 2017), (b) regression based metrics (including hierarchical linear modeling as an extension) (e.g., Moeyaert, Ugille, et al., 2014; Van den Noortgate & Onghena, 2003a, 2003b), (c) log ratio metrics (Pustejovsky, 2015), and (d) standardized mean difference metrics (BC-SMD, Hedges et al., 2012, 2013). Because of the limited generalizability of any one SCED study, across-participant approaches are appealing. Across participant approaches can be used to summarize intervention effectiveness per study allowing to make more generalizable conclusions.
Meta-Analysis of SCED using HLM
One meta-analytic technique that is appropriate for meta-analysis of SCED is hierarchical linear modeling (HLM) as this technique takes the nested data structure into account: repeated measures are nested within participants and participants are nested within studies (Moeyaert, Ferron, et al., 2014; Shadish et al., 2013). The statistical properties of this approach has been extensively studied and empirically validated using large-scale Monte Carlo simulation studies (Ferron et al., 2009; Moeyaert et al., 2013a, 2013b; Ugille et al., 2012). Given its desirable statistical properties, the HLM approach has been recommended for the quantitative synthesis of SCED study results across studies (Shadish et al., 2013). The HLM approach is flexible and can model a variety of different data complexities, such as autocorrelation (Maggin et al., 2011), linear and non-linear trends (Shadish et al., 2013; Van den Noortgate & Onghena, 2003b), count outcomes (Declercq et al., 2019; Shadish et al., 2013), and intervention heterogeneity (Baek & Ferron, 2013). However, one topic that did not yet receive attention and is in need of methodological research is the inclusion of moderators in the context of HLM of SCED studies. The lack of research on moderator analysis is worrisome as applied SCED meta-analyses including moderators have been published without knowing whether the chosen metric and analytic approach is suitable and powerful enough (Heyvaert et al., 2012, 2014; Hurwitz et al., 2015; Stone, 2011; Vanderkerken et al., 2013; Wang et al., 2013).
Previous methodological work in contexts of quantitative synthesis of SCEDs evaluated the statistical properties of the intervention effect estimate across SCED studies (Van den Noortgate & Onghena, 2003a; Zimmerman et al., 2018) and the between-study and between-case variability in these intervention effect estimates (Moeyaert, Ugille, et al., 2014). The multi-level meta-analytic model is one of the statistical analysis techniques that has been used and empirically validated for this purpose (Moeyaert et al., 2013a, 2013b, 2016; Petit-Bois et al., 2016; Ugille et al., 2012). However, no research up to date has focused on the statistical properties of multi-level models that include moderators. By adding moderators at the case and-or study level, the unexplained variability in intervention effects between cases and-or studies can decrease. Prior to extending methodological work validating the multi-level modeling approach including moderators at the different levels, the characteristics of moderators typically encountered in the field is needed. The overview will inform design conditions to be embedded in future methodological work and ensure that these conditions are realistic and representative for the field of SCED meta-analyses. This study presents the results of a systematic review of SCED meta-analyses, with a particular focus on moderator characteristics. SCED meta-analyses eligible for inclusion are further categorized into three broad categories: (a) meta-analyses including moderators in the analysis, (b) meta-analyses recognizing and presenting moderators (but did not include the moderators as part of the analysis plan), and (c) meta-analyses lacking moderators. To present a focused and in-depth discussion of SCED moderator characteristics, the focus of this study is on the first category of SCED meta-analyses (i.e., meta-analysis including moderators in the analysis).
Reviews of SCED Meta-Analyses
Figure 1 gives a graphical overview of the number of SCED studies and SCED meta-analyses published between 1990 and 2019 using the Web of Sciences database. This illustrates that there has been an exponential increase in the number of SCED studies published over the last three decades. Because more research evidence from primary level SCED studies is available, there is also an exponential increase in the number of meta-analyses (and systematic reviews in general) of SCEDs (see Figure 1 and Jamshidi et al., 2018).

Graphical overview of the number of SCED studies and SCED meta-analyses published between 1990 and 2019.
Several studies have been published summarizing methodological aspects and data characteristics of these meta-analyses and systematic reviews (e.g., Beretvas & Chung, 2008; Farmer et al., 2010; Jamshidi et al., 2020; Maggin et al., 2011; Schlosser et al., 2008). Jamshidi et al. (2020) conducted a systematic review of SCED meta-analyses. Their systematic review covered a large timespan (1985–2015), and included general data characteristics and study design characteristics of SCED meta-analyses. In addition, an overview was provided of the kind of analyses done per primary level SCED study and meta-analysis. Jamshidi et al. (2020) found that 130 out of the 173 meta-analyses conducted a moderator analysis. These moderators were intervention and participant characteristics. However, specific details such as the measurement scale and the number of case-specific and intervention-specific moderators per meta-analysis were not reported. The focus of another systematic review conducted by Jamshidi et al. (2018) was on the methodological quality of SCED meta-analyses. Jamshidi and colleagues assessed the methodological quality of 178 SCED meta-analyses published between 1985 and 2015. They used the Revised-Assessment of Multiple Systematic Reviews (R-AMSTAR) checklist as a guideline. They found that SCED meta-analytic studies did better on some criteria (e.g., “doing a comprehensive literature search,” “providing the characteristics of the included studies”), while it was not the case for other criteria, such as “reporting an assessment of the likelihood of publication bias” and “using the methods appropriately to combine the findings of studies.” Jamshidi and colleagues concluded that the methodological quality of SCED meta-analyses, in general, was low, although it has slightly increased over time. The characteristics of moderators included in SCEDs meta-analyses were not considered as this was not an item included in the R-AMSTAR checklist.
Other systematic reviews of meta-analyses mainly focused on characteristics of effect size metrics used in meta-analyses. For instance, Maggin et al. (2011) reviewed 68 SCED meta-analyses between 1985 and 2009 focusing on participants with and at-risk for disabilities and found that the percentage of non-overlapping data (PND) was the most frequently used metric, followed by the standardized mean difference (SMD). The mean, weighted mean or median was most frequently used to synthesize the results across studies. Farmer et al. (2010) showed similar results to Maggin et al. (2011). Schlosser et al. (2008) focused on exploring the characteristics of PND by reviewing 45 meta-analytic studies from 1985 to 2008 and found that most included studies aggregated the scores of PND across different studies. Compared to the median PND, the average PND was more frequently used to represent the overall intervention effect across studies. Besides examining the effect size metric, Beretvas and Chung (2008) reviewed 25 meta-analyses of SCEDs and explored how the dependency in the original studies with multiple interventions, outcomes, and participants was handled in the meta-analyses. They found that most studies did not report how they dealt with the dependency.
Based on the review of previous systematic reviews of SCED meta-analyses presented in previous sections, it can be concluded that summarizing moderator characteristics has not been thoroughly considered. In addition, items related to moderators have not been considered for inclusion in reporting guidelines to assess the quality of SCED meta-analyses and systematic reviews. This stands in contrast to reporting guidelines developed for group-comparison design systematic reviews and meta-analyses (see Table 1). The items related to moderator characteristics included in these guidelines can be considered as a source to develop similar items to be included in meta-analytic quality assessment tools and reporting guidelines such as the R-AMSTAR checklist (see Table 1).
Reporting Guidelines and Assessment Tools Related to Moderators in the Context of Single-Case Experimental Design (SCED) Studies and Group-Comparison Design Systematic Reviews and Meta-Analyses.
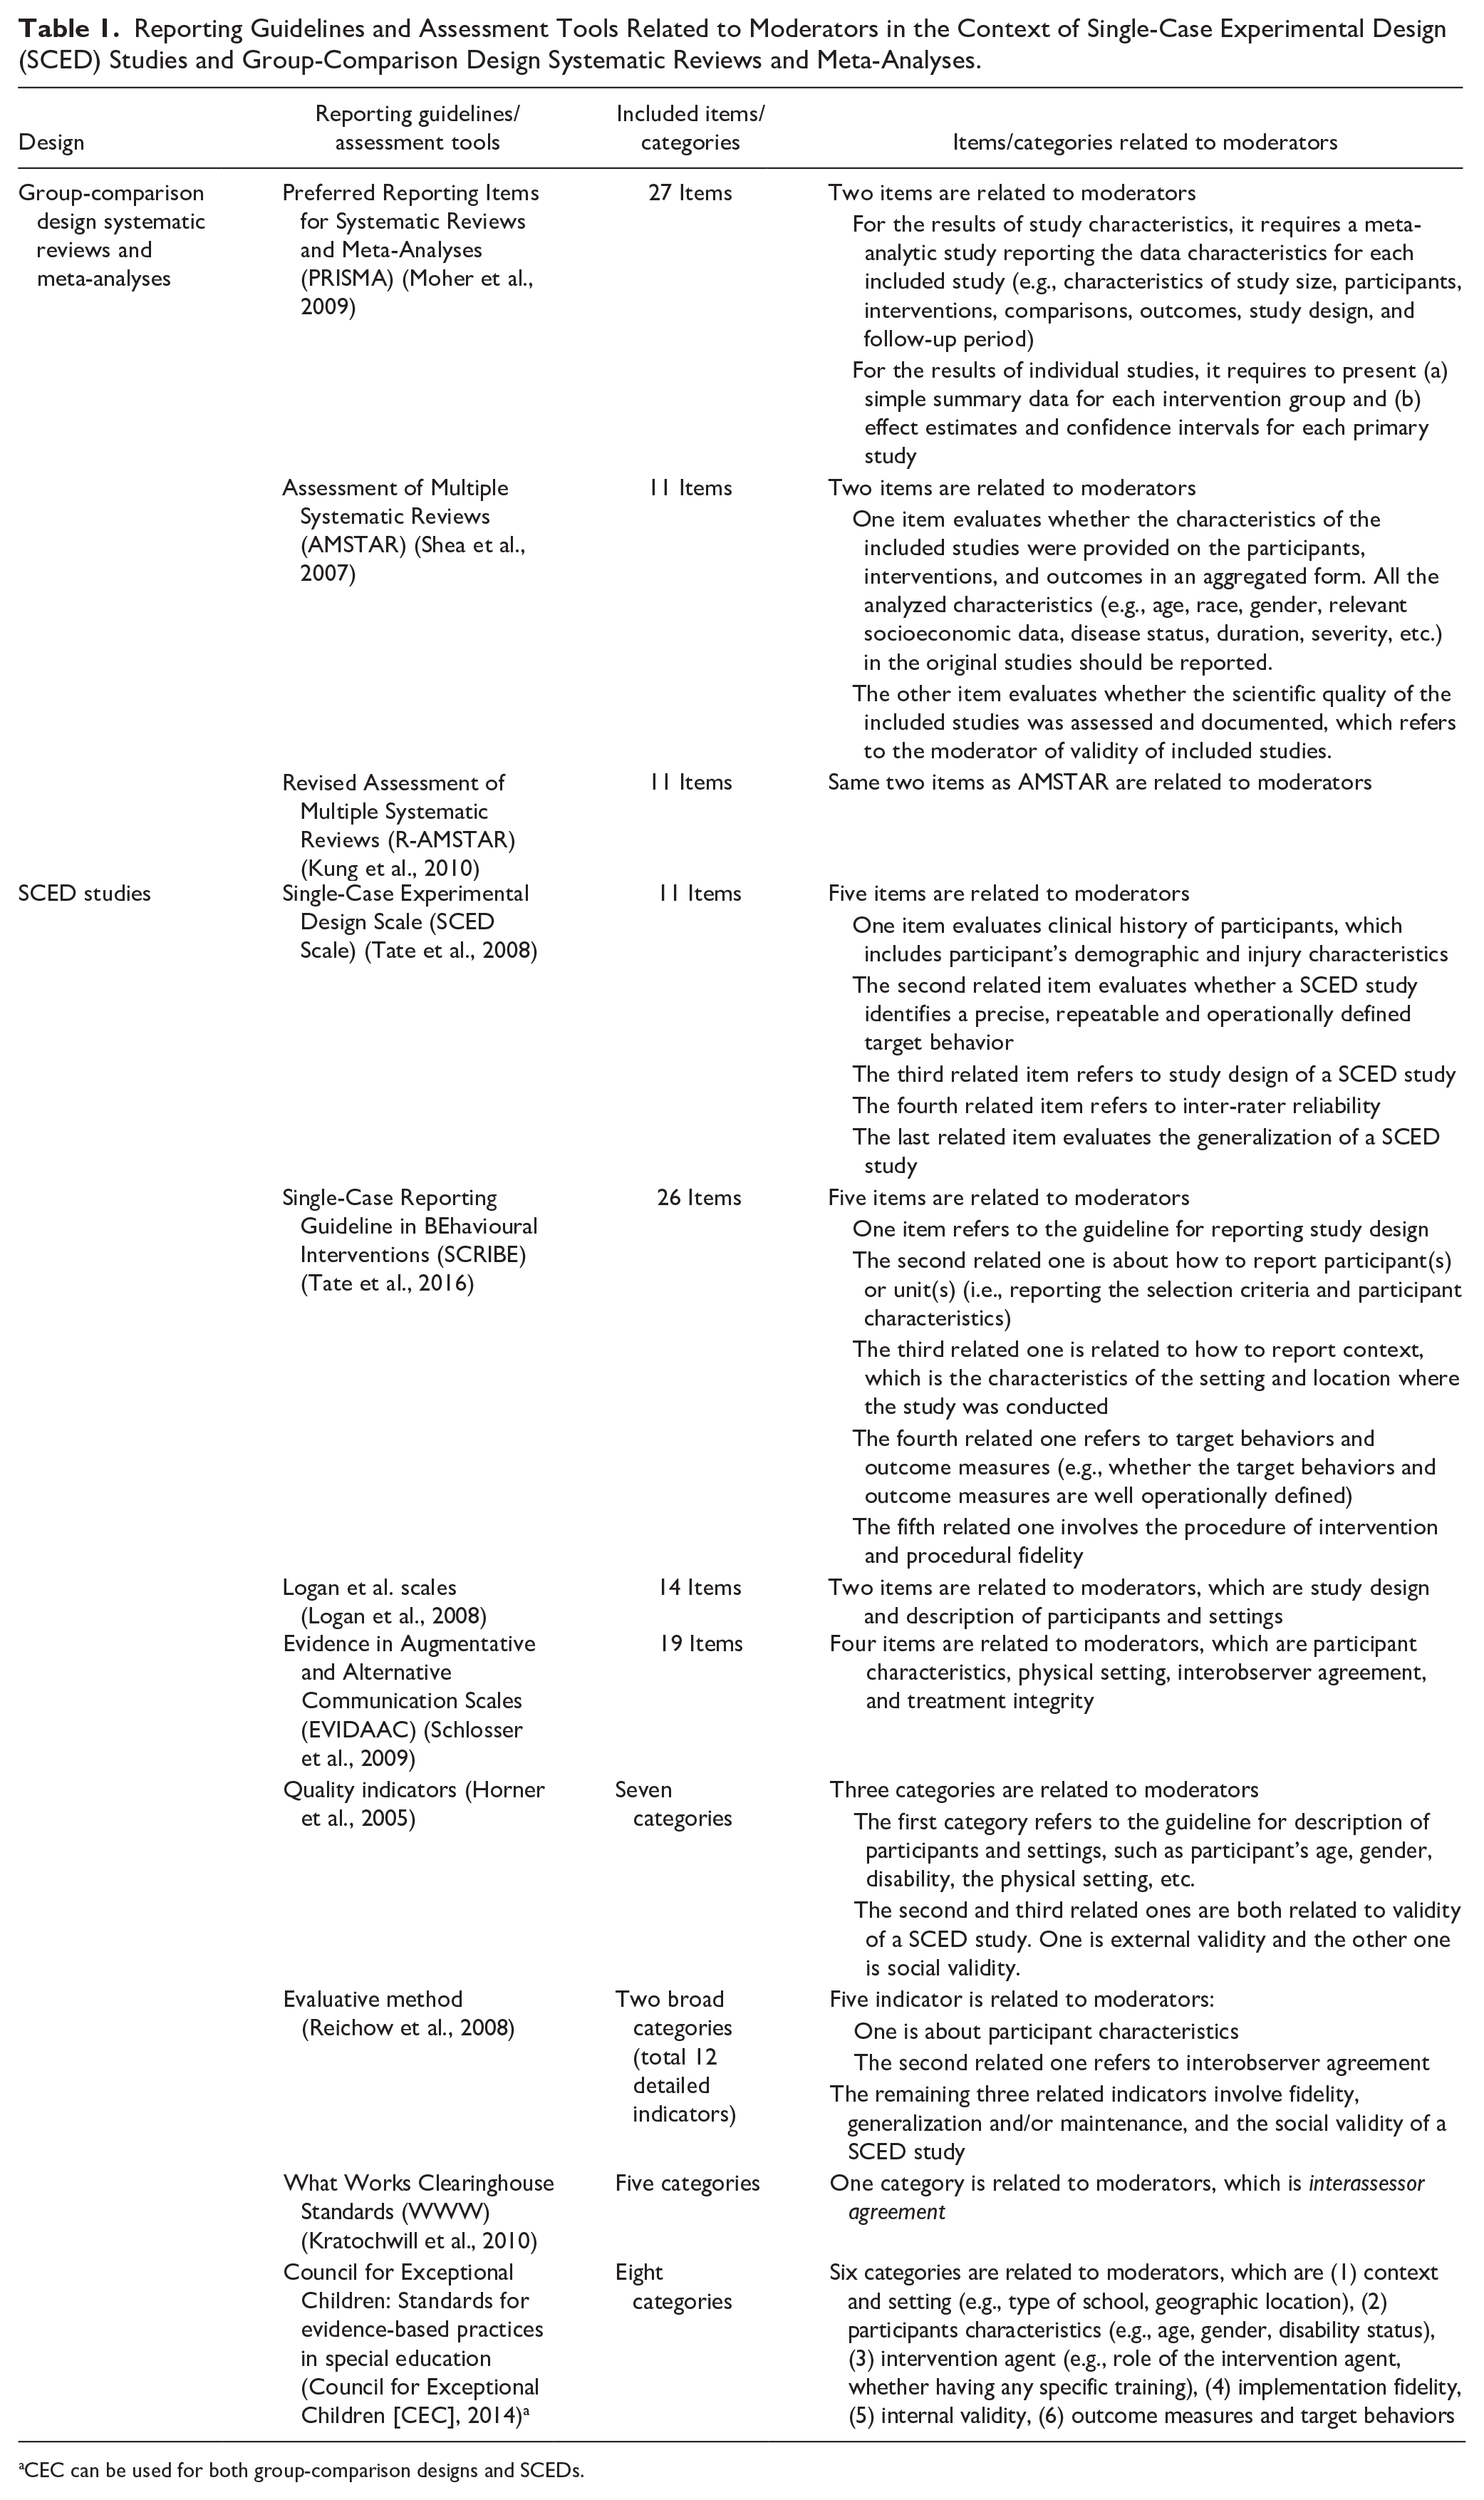
CEC can be used for both group-comparison designs and SCEDs.
SCED Reporting Guidelines and Quality Assessment Tools
Meta-analyses are depending on the information that is reported in the primary level studies eligible for inclusion in the meta-analysis. Therefore, items related to moderator variables are ideally included in reporting guidelines and quality assessment tools for primary level SCED studies. Lobo et al. (2017) provided an overview of quality assessment and reporting tools available for SCEDs; Quality indicators (Horner et al., 2005); Evaluative method (Reichow et al., 2008); Evidence in Augmentative and Alternative Communication Scales (EVIDAAC, Schlosser et al., 2009); Single-Case Experimental Design (SCED, Tate et al., 2008), Logan et al. scales (Logan et al., 2008), and Single-Case Reporting Guideline In BEhavioural Interventions (SCRIBE, Tate et al., 2016). Tate et al. (2008) developed the Single-Case Experimental Design Scale to evaluate the quality of SCED studies. Later on, Tate et al. (2016) further developed the Single-Case Reporting Guideline in BEhavioural Interventions (SCRIBE) to provide a checklist that helps single-case studies to be published as well as journal reviewers and editors to evaluate the quality of single-case studies.
Another source focusing on quality assessment of primary level SCEDs is the What Works Clearinghouse (WWC) technical documentation developed by the Institute of Education Sciences (Kratochwill et al., 2010; What Works Clearinghouse [WWC], 2020). Specifically, when reviewing SCEDs, the study rating criteria of WWC can be used to categorize the SCED studies into three levels of quality, namely Meets WWC SCD Standards Without Reservations, Meets WWC SCD Standards With Reservations, or Does Not Meet WWC SCD Standards. Other available quality assessment tools for SCEDs, such as quality indicators from Horner et al. (2005), evaluative method from Reichow et al. (2008), and Logan et al. scales (Logan et al., 2008), focus on similar aspects as Tate et al. (2008, 2016) to assess the quality of SCEDs (for more detail, review Horner et al., 2005; Reichow et al., 2008).
As we can be deduced from Table 1, existing checklists for quality assessment of group-comparison design meta-analyses and primary level SCEDs, the characteristics of moderators are embedded to some extent (CEC, 2014; Kratochwill et al., 2010; Kung et al., 2010; Moher et al., 2009; Shea et al., 2007; Tate et al., 2008, 2016; WWC, 2020). However, they do not mention what specific characteristics of moderators need to be reported (e.g., measurement scale of moderators and modeling approach). Information related to moderator characteristics of SCED studies are important not only to determine which analytic methods are best used in meta-analyses (Jamshidi et al., 2020), but also to inform the design conditions and parameter values to be included in future Monte-Carlo simulation studies. Including moderators can help explain variability in intervention effectiveness between individuals and-or studies.
Purpose and Research Questions
The purpose of this systematic review of SCED meta-analyses is to provide insights into moderator characteristics. First, the review is designed to provide an overview of the type of moderators studied in SCED meta-analyses. To enhance the discussion, moderators are classified within three “levels” (a) the outcome and intervention level (i.e., level 1, related to within-participant characteristics), (b) the participant level (i.e., level 2), and (c) the study level (i.e., level 3). Per moderator level, an overview and description of commonly encountered moderators is provided. Numerics related to the number of moderators at these levels and the ratio of the number of moderators at a certain level relative to the number of units at that level are reported. In addition, the measurement scale of the moderators at the different levels is discussed (i.e., Nominal, Ordinal or Continuous [Interval/Ratio]). Information related to the degree of missing data per moderator is captured as well. In sum, the first section of the results contains key information related to the moderator characteristics, presented per level. Second, in addition to these specific moderator characteristics, aspects specific to the moderator analysis are captured and discussed, namely (a) the metric used to quantify moderator effectiveness (i.e., non-overlap metrics, regression based metrics, log ratio metrics, and standardized mean difference metrics) (b) the unit of analysis (participant-specific, study-specific or across studies) and (c) the specific approach used to combine metrics across cases and/or across studies (i.e., description in words, frequency table, quantitative metric or statistical modeling).
Methods
Systematic Literature Search
The following six online databases were used to conduct the systematic search: PsycINFO, Web of Science, Science Direct, Medline PubMed, ERIC, and CINAH. The systematic literature search procedure as outlined by Jamshidi et al. (2020) was replicated in current research (by the two independent coders) as this is the most extended and profound systematic review of SCED meta-analyses identified. To be included in the systematic review, the study is required to be (a) available in English, (b) peer-reviewed with full-text availability, (c) published between 2016 and 2019, and (d) a meta-analysis including SCED studies. In addition, the study must (e) provide an effect size, and (f) include moderator analysis. These inclusion and exclusion criteria are displayed in Figure 2. As suggested by Jamshidi, two sets of search strings are specified in all databases: (“single case” OR “single subject” OR “N of 1” OR “small N” OR “multiple baseline design” OR “alternating treatments design” OR “reversal design” OR “withdrawal design”) AND (“meta-analysis” OR “synthesis” OR “review”). In order to ensure that the same search procedure was applied as in Jamshidi et al. (2020), the two independent researchers replicated Jamshidi’s search procedure for 1985 to 2015 for all of the six databases and verified whether the same number of studies per database were retained. Discrepancies between Jamshidi and the two independent researchers were found for all databases. Therefore, Jamshidi was contacted so that these discrepancies could be resolved. Once the discrepancies were resolved, the search procedure together with the options per database were refined. Discrepancies between Jamshidi and the two independent researchers were found for certain databases, namely Web of Science, ERIC and CINAHL. Different access to use different online reference systems such as EBSCOhost was the cause of the discrepancies. The specific search procedure per database is presented in Supplemental Appendix B as search options slightly varied per database. By outlining these details, the search can be replicated and the same number of SCED meta-analyses eligible for inclusion should be identified. The average IOA for the number of retrieved studies across the six databases is 84%. The database specific IOA in terms of the number of studies that were initially identified for each database (i.e., PsycINFO, Web of Science, Science Direct, Medline PubMed, ERIC, and CINAHL) are 93, 99,49, 100; 71, and 89%, respectively.

Flowchart of the systematic review of single-case experimental design meta-analyses.
The same two doctoral students applied the inclusion and exclusion criteria independently and resolved any discrepancies in the number of excluded studies per criterion. The proportion of agreement at phase one (i.e., exclusion of duplicates, see Figure 2) was 99%. The reason for the discrepancy was that a proportion of the included studies were duplicates with slightly different titles. After reviewing the articles with similar titles, discrepancies were resolved. The proportion of agreement at phase two (i.e., exclusion of non-peer reviewed articles, see Figure 2) was 17%. The reason for this large degree of discrepancy was that the two doctoral students used slightly different strategies in identifying peer-review journals. After applying the same strategy, agreement was reached. The proportion of agreement at phase three (i.e., exclusion of articles that were not SCED meta-analyses and do not present an effect size metric, see Figure 2) was 92%. Phase three had four exclusion reasons (see Figure 2), and one doctoral student identified some articles fitting more than one of these exclusion reasons. For example, one article was identified to be a meta-analysis of group designs. In addition, this meta-analysis focused on the quality and characteristics of the included studies without providing an effect size. This double counting of exclusion reason caused the discrepancy. After discussing how to label the reason for exclusion for each moderator, 100% agreement was obtained. The proportion of agreement at phase four (i.e., exclusion of articles that did not include moderators or recommended or acknowledge moderator analysis, see Figure 2) was 78%. The disagreement was because one of the doctoral students included the articles if they emphasized the importance of moderators or recommended the moderator analysis for further research. The other doctoral student included articles that acknowledged the possibility of moderator analysis. The discrepancy was solved after the two doctoral students clarified that only articles SCED meta-analyses conducting moderator analysis, recommending moderator analysis or acknowledged the need of moderator analysis (with reporting of the characteristics of the potential moderators) were eligible for inclusion.
Independent Coders and Interobserver Agreement
The systematic literature search for SCED meta-analyses was conducted by two independent researchers enrolled in the doctoral program Educational Psychology and Methodology. Both researchers successfully completed an SCED class and/or conducted research apprenticeships related to the methodology of SCEDs. Both researchers have profound expertise in the design and analysis of SCED studies. They can identify SCED studies, differentiate and code different types of SCEDs, and are able to retrieve raw data from primary and meta-analytic SCED studies. The independent researchers conducted a systematic literature search using six online databases. The interobserver agreement (IOA) between the two independent researchers was calculated per database by dividing the number of studies identified by both researchers (i.e., the number of agreements) by the sum of the number of agreements and disagreements. Next, the average IOA across the six databases was calculated.
The data retrieval and coding of SCED meta-analysis was performed by three independent researchers. Two of these researchers were part of the systematic literature search. The third independent researcher was also a doctoral students within the program Educational Psychology and Methodology and has a similar background as the other two independent researchers. Given that there are no reporting guidelines for SCED meta-analyses, there is a discrepancy in the way moderator characteristics are reported in SCED meta-analyses. Because of this complexity, the three researchers were first trained using the codebook (i.e., training manual, discussed later). During this training procedure, the three coders independently retrieved data from one SCED meta-analysis. The coding results were compared to identify discrepancies. All discrepancies were discussed until all coders obtained complete agreement. The coders repeated this procedure for other SCED meta-analyses until no discrepancies were identified. Three rounds of coding training was needed to accomplish this. Upon the completion of the training, the researchers coded independently a fourth SCED meta-analysis and the IOA between the three researchers was calculated. The IOA between the three independent researchers was calculated by averaging the 3% of agreement between the pairs of independent coders (i.e., IOAcoder1,2,3 = [IOAcoder1,2 + IOA coder1,3 + IOAcoder2,3]/3). The independent researchers coded several variables, including the specific moderators, the level of the moderators, (i.e., level 1, representing the within-participant level; level 2, representing the participant level; and level 3, representing the study level), the number of moderators and units per level, the ratio of the number of moderators relative to the number of units at that level, the measurement scale per moderator, the degree of missing data per moderator, the metric used to quantify moderator effectiveness, and the specific analytic approach used to combine metrics across cases and/or across studies. The IOA for coding of all these major variables of interest was calculated. A list of these variables of interest together with all other coded variables (of secondary interest) is presented in Supplemental Appendix A.
Single-Case Experimental Design Studies Eligible for Inclusion
After applying the exclusion and inclusion criteria, a total of 60 articles were eligible for inclusion. The complete list of these articles is provided in Supplemental Appendix C. The initial search yielded a total of 910 articles and book chapters. After excluding duplicate studies and non-peer-reviewed studies, 658 unique peer-reviewed studies were maintained. All these articles were screened at the title, abstract, and methods level. A total of 556 articles were excluded; 395 because not being a meta-analysis, 107 because not including SCED studies, 40 because the SCED meta-analyses did not include effect sizes; and 14 because no access to the full text was obtained. The full texts of the remaining 102 articles were further screened, and the two doctoral students identified 60 articles that were eligible for final review and coding.
Data Retrieval and Coding
The codebook was created based on the research aim and research questions to ensure that all relevant variables are captured and coded accordingly. Specifically, two parts of information that reveal the characteristics of moderator and the aspect regarding analysis are coded (see Supplemental Appendix A). Part one of the codebook includes the name, level and measurement scale of the moderator, and ratio between the number of moderators relative to the number of units at each level. Part two includes the metric used to quantify moderator effectiveness and the specific approach used to combine metrics across cases and/or across studies. The complete codebook specifying all coded variables and categories within variables can be found in Supplemental Appendix A. The codebook was used to train the three independent researchers.
The three independent researchers obtained an IOA of 100% for coding the total number of primary studies and participants per SCED meta-analysis. The IOA for moderator identification equaled 78.8%. After identifying the moderator, the three researchers also independently coded the level of each moderator (i.e., the outcome and intervention level, the participant level, and the study level) for which an IOA of 86.6% across the three researchers was obtained. The three researchers obtained complete agreement for coding of the measurement scale of moderators, the metric used to quantify moderator effectiveness and the specific approach used to combine metrics across cases and/or across studies. The degree of missing data of the moderators was also captured and for this an IOA of 86.6% was obtained. The overall IOA between three independent researchers across all the coded variables was 93%. After the three independent researchers were trained using the codebook and the coding reliability was evaluated, each researcher was assigned a set of 20 SCED meta-analyses to code.
Data Analysis
The statistical software program SAS 9.4 (SAS Institute Inc., 2013) was used for quantitative analysis and synthesis. The raw data retrieved from the SCED meta-analyses was entered in separate Excel Sheets by the three independent coders. The excel sheets from the three independent coders were merged per moderator level and imported into SAS 9.4. As there are three moderator levels, (i.e., study level, participant level and within-participant level [i.e., intervention and outcome moderators]), three separate sheets, merged within one big dataset, were created. First, descriptive analyses were run to summarize moderator characteristics per level (i.e., frequency, measurement scale, and information related to the degree of missing data per moderator). Second, SCED metrics (i.e., non-overlap, regression based/HLM, log ratio, and SMD) and analysis approaches (i.e., description in words, frequency table, and quantitative metric or statistical analysis). The results section presents the characteristics of moderators included in at least five SCED meta-analyses. The results for other moderators included in less than five SCED meta-analyses are provided in Supplemental Appendix D.
Results
A total of 60 SCED meta-analyses met the inclusion criteria and were eligible for data extraction. The results of the analysis of moderator characteristics retrieved from these 60 meta-analyses are presented. The first part of this results section provides an overview of moderator characteristics organized per moderator level, including the types of moderators, the ratio of the number of moderators relative to the number of units at that level, the measurement scale, and information related to the degree of missing data per moderator. The second part of the results section focuses on metrics used to quantify moderator effectiveness and details related to the analysis approach (e.g., description in words, inclusion of frequency or frequency table, reporting of quantitative metric or including a statistical analysis).
Moderator Characteristics
Study level moderators
Ratio and type of moderators
The average ratio between the number of moderators at the study level and the corresponding number of units at that level is 0.22. This means that, on average, meta-analyses with 10 primary SCED studies typically include two study level moderators. This ratio ranges from 0 to 1.40. A total of 24 unique study level moderators (across all eligible SCED meta-analyses) are identified among which 13 are included by at least five meta-analytic studies. These 13 moderators represent commonly reported study level moderators and characteristics of these are summarized in Table 2. An overview of the other, less commonly reported study level moderators, can be found in Supplemental Appendix D. Forty-two out of the sixty SCED meta-analyses include SCED design type as a moderator. Specifically, a total of eight different study designs are identified and summarized in Table 3. The multiple-baseline design is the most commonly reported study design, followed by the reversal design. Changing criterion design is the least popular one. Thirty-eight out of the sixty SCED meta-analyses examine the physical setting the intervention took place in as a moderator. The physical setting includes classroom, home, clinic, community center, playground, and others. Twenty-six studies include SCED quality design standards as a moderator, which comprises either the WWC standards or the CEC standards (both discussed under the section reporting guidelines and quality assessment tools for SCEDs). Furthermore, 23 of these 26 studies discuss the degree to which the WWC standards or CEC standards are met (i.e., fully meet the standards, partly meet the standards or do not meet the standards). Fifteen SCED meta-analyses discuss the interobserver agreement. The maintenance and generalization of intervention effectiveness are included as moderator in 15 and 13 SCED meta-analyses respectively. Eleven SCED meta-analyses discuss instructional arrangement (i.e., how the instruction has been provided, such as individual to individual or individual to classroom); 11 incorporate publication type (e.g., journal articles, thesis or dissertation), and 10 SCED meta-analyses discuss validity. Furthermore, six SCED meta-analyses discuss the context of the setting (e.g., simulated setting or natural setting) and specifics about functional behavior assessment (FBA). Finally, five SCED meta-analyses discuss the effect of the study and the study findings as moderators.
Overview of Moderator Characteristics Reported by at Least Five Meta-Analytic Studies.
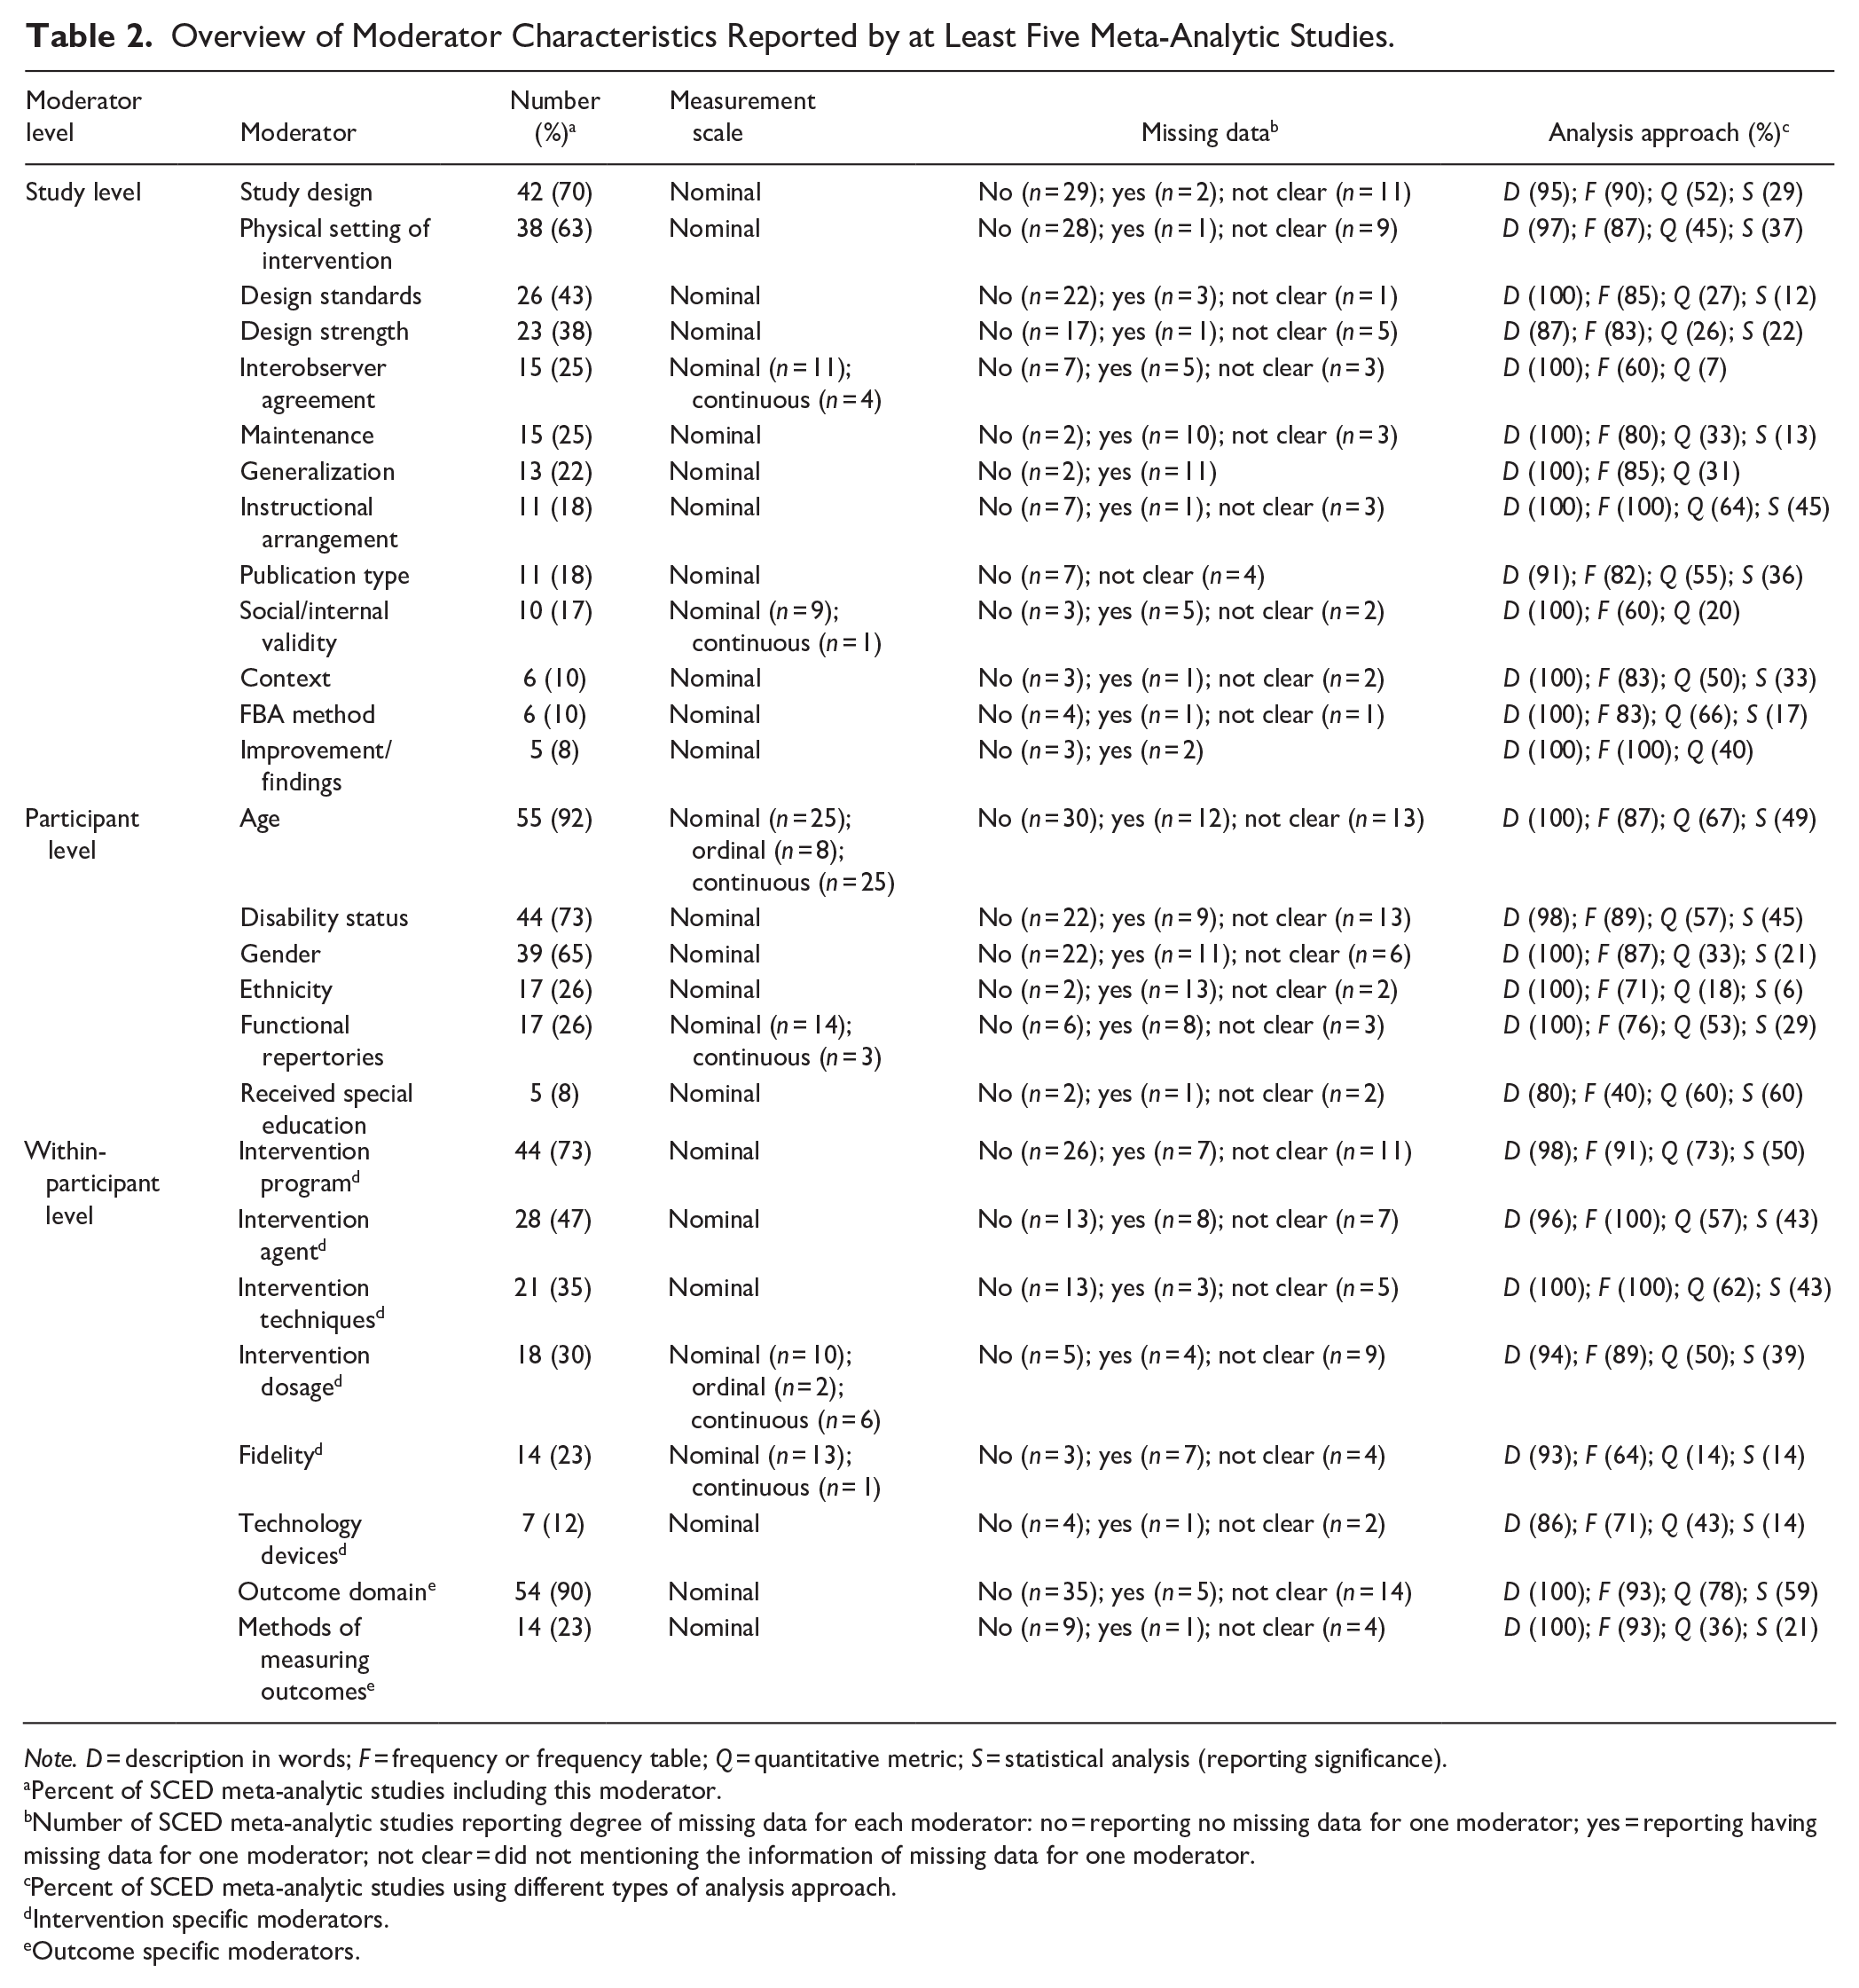
Note. D = description in words; F = frequency or frequency table; Q = quantitative metric; S = statistical analysis (reporting significance).
Percent of SCED meta-analytic studies including this moderator.
Number of SCED meta-analytic studies reporting degree of missing data for each moderator: no = reporting no missing data for one moderator; yes = reporting having missing data for one moderator; not clear = did not mentioning the information of missing data for one moderator.
Percent of SCED meta-analytic studies using different types of analysis approach.
Intervention specific moderators.
Outcome specific moderators.
Types of Research Design Included in Meta-Analytic Studies.

Note. Thirty-six Meta-analyses included more than one type of study designs; seven studies just included one type of study design.
Measurement scale
The measurement scale of these 13 study level moderators is nominal (See Table 2). Two moderators are coded inconsistently, namely the interobserver agreement and validity. Specifically, 11 SCED meta-analyses code the interobserver agreement as a nominal moderator, whereas four code this as continuous. Validity is coded as a nominal variable in nine SCED meta-analyses whereas one study considers it as continuous. In that study, validity is reported as the specific degree of validity.
Missing data
Most SCED meta-analyses report no missing data for moderators at the study level (i.e., study design, physical setting of intervention, design standards, design strength, interobserver agreement, publication type, instructional arrangement, improvement/findings, context, and FBA method) (see Table 2). For example, among the 42 SCED meta-analyses discussing study design, 29 report no missing data, while two SCED meta-analyses have missing data and 11 SCED meta-analyses do not mention whether there is missing data. Among 38 SCED meta-analyses discussing physical settings of intervention, 28 SCED meta-analyses report no missing data, one SCED meta-analysis has missing data, and nine SCED meta-analyses do not mention whether there was missing data. More than half of the SCED meta-analysis including the moderators maintenance, generalization, and validity report missing data. For instance, ten SCED meta-analyses report missing data when discussing maintenance of intervention effects, while only two SCED meta-analyses report no missing data, and three SCED meta-analyses do not mention whether there was missing data or not.
Participant specific moderators
Ratio and type of moderators
The average ratio between the number of participant level moderators and the number of units at the participant level is 0.06. This means that, on average, meta-analyses with 10 SCED study participants include less than one moderator. This ratio ranges from 0 to 0.24. A total of 18 unique study level moderators (across all SCED meta-analyses eligible for inclusion) are identified among which six are reported by at least five SCED meta-analytic studies. These six moderators represent commonly reported participant level moderators and characteristics of these are summarized in Table 2. An overview of the other, less commonly reported study level moderators, can be found in Supplemental Appendix D. The most popular participant moderator is age (55 out of the 60 SCED meta-analyses), followed by disability status (n = 44) and gender (n = 39). Seventeen SCED meta-analyses discuss ethnicity as a moderator and 17 studies report the participant’s functional repertoires (e.g., delusional speech, hallucinatory speech, disorganized speech, different level of communication function, and different level of academic achievement) as a moderator. Finally, five SCED meta-analyses include whether participants received special education or not.
Measurement scale
Among the six participant specific moderators, four moderators (i.e., disability status, gender, ethnicity, and received special education) are included as nominal scaled variables. There is no consistency in the way the other two commonly encountered moderators are coded. Twenty-five SCED meta-analyses code age as a nominal variable, eight SCED meta-analyses consider it as ordinal and 25 SCED meta-analyses code it as continuous. Interestingly enough, among 55 SCED meta-analyses discussing age, three studies code age as both nominal and continuous. For functional repertories, 14 out of 17 SCED meta-analyses code it as nominal, while three SCED meta-analyses code it as continuous (i.e., the degree of functional repertory or relevant functional test scores).
Missing data
The majority of SCED meta-analyses report no missing data for three participant level moderators, namely age, disability status, and gender. For example, 30 SCED meta-analyses report no missing data for the moderator age, whereas 12 studies report missing data. The remaining 14 SCED meta-analyses do not mention any information about missing data for age. For disability status, 22 SCED meta-analyses report no missing data, nine SCED meta-analyses report having missing data, and 13 studies do not include information about missing data.
For the moderators ethnicity and functional repertories, most SCED meta-analyses report missing data (n = 13 for ethnicity and n = 8 for functional repertoires). Only two SCED meta-analyses report no missing data for ethnicity, while this number equals six for functional repertoires. The number of SCED meta-analyses that do not provide information related to missing data equals two and three for ethnicity and functional repertories respectively.
For the variable received special education, an equal amount of studies provide information related to missing data as do not provide information (n = 2). One SCED meta-analysis reports this moderator with missing data.
Within-participant moderators: Intervention and outcome
Ratio and type of moderators
The average ratio between the number of intervention moderators and the number of units at the within-participant level is 0.14. This means that, on average, meta-analyses with ten observations include at least one intervention specific moderator. This ratio ranges from 0 to 0.60. A total of 18 unique intervention specific moderators are identified among which six moderators are reported by at least five meta-analytic studies. Characteristics of these six moderators are presented in Table 2. Forty-four out of the sixty SCED meta-analyses include the intervention program as a moderator (e.g., video modeling, visual cueing, augmentative, or alternative communication). Another 28 SCED meta-analyses mention intervention agents as a moderator. This moderator indicates whether the agent delivering the intervention is a professional (i.e., researcher, clinician, or therapist), a classroom staff member, a student, or a parent. Twenty-one SCED meta-analyses include intervention technique as a moderator (e.g., reinforcement of appropriate behaviors or extinction of the problem behaviors), and 18 SCED meta-analyses discuss the intervention dosage (i.e., length and/or magnitude of intervention). Fourteen SCED meta-analyses include intervention fidelity and seven SCED meta-analyses mention the technology device used for intervention delivery or data collection.
The average ratio of the number of outcome moderators and the number of units at the within-participant level is 0.07. This means that, on average, meta-analyses with ten observations include no outcome specific moderator. This ratio ranges from 0 to 0.60. A total of six unique outcome specific moderators are identified among which only two moderators are reported by at least five SCED meta-analyses. Characteristics of these two moderators are presented in Table 2. The most popular outcome specific moderator is outcome domain (i.e., 54 out of the 60 SCED meta-analyses). The moderator outcome domain refers to the specific outcome or the domain of the outcome that was measured in the primary studies, such as academic skills, adaptive skills, and emotion recognition. Fourteen out of the 60 SCED meta-analyses include the methods of measuring outcomes as moderator. This refers to the method, tool, or technique that was used to measure outcomes, such as student rating, teacher rating, or systematic direct observation.
Measurement scale
The measurement scale of all six most commonly included intervention specific moderators is nominal. However, two of these six moderators are coded inconsistently across SCED meta-analyses. Specifically, ten SCED meta-analyses code intervention dosage as a nominal variable, two as ordinal and six as continuous (e.g., the time of intervention). For fidelity, 13 SCED meta-analyses code it as nominal, while just one SCED meta-analysis code it as continuous (i.e., degree of intervention fidelity reflected as a percentage). The two commonly used outcome specific moderators (i.e., outcome domain and methods of measuring outcomes) are consistently coded in SCED meta-analyses as nominal.
Missing data
The majority of SCED meta-analyses report no missing data for six out of the eight within-participant moderators (i.e., intervention program, intervention agent, intervention techniques, technology devices, outcome domain, and methods of measuring outcomes). For instance, 26 SCED meta-analyses report no missing data for the intervention moderator, whereas this equals seven for having missing data and 11 for not mentioning whether missing data is present. For intervention agents, 13 SCED meta-analyses report no missing data, eight report having missing data and seven do not mention whether or not there was missing data. For the outcome domain, 35 SCED meta-analyses report no missing data, while five SCED meta-analyses report having missing data and 14 SCED meta-analyses do not mention the information about missing data
Most SCED meta-analyses do not provide information related to missing data for intervention dosage (n = 9). For dosage, five SCED meta-analyses report no missing data and the other four SCED meta-analyses report having missing data. For fidelity, most SCED meta-analyses report having missing data (n = 7), while three SCED meta-analyses report no missing data and four do not mention any information about missing data.
Moderator Analysis
Number of SCED meta-analyses quantifying moderation effects
Among the 42 SCED meta-analyses discussing study design as moderator, about half (n = 20) report a metric to quantify its effect. A metric reflecting the effect of the moderator physical settings of intervention delivery is included in only 15 out of the 38 SCED meta-analyses. Less than one third (7 out of 23) of the meta-analyses discussing design standards report a metric to evaluate the effect of the moderator. Six out of the 11 SCED meta-analyses including instructional arrangement as a moderator report a metric. No more than five SCED meta-analyses report metrics for the other commonly encountered study level moderators (e.g., design strength, interobserver agreement, maintenance, and generalization).
For participant specific moderators, 34 out of 55 SCED meta-analyses that discuss age as a moderator report a metric quantifying the effect of that moderator. A metric is included for half of the SCED meta-analyses (22 out of 44) that focus on disability status. Nine SCED meta-analyses report a metric for gender, and the same number of SCED meta-analyses report a metric for functional repertories. Only two out of the 17 SCED meta-analyses discussing ethnicity report a metric. For receiving special education, two out of five report a metric.
Regarding the intervention specific moderators, among 44 SCED meta-analyses discussing intervention program as a moderator, 34 studies report the metric for this moderator. Fifteen out of 28 SCED meta-analyses including intervention agents as a moderator report the metric to evaluate the effect of this moderator. Twelve out of 21 SCED meta-analyses discussing intervention techniques report the metric for intervention techniques. Among 18 SCED meta-analyses mentioning intervention dosage, nine report the metric for this moderator. Moreover, two out of 14 SCED meta-analyses discussing fidelity report the metric for fidelity. Two out of seven SCED meta-analyses report the metric for the moderator of technology devices.
In terms of outcome specific moderators, 41 out of 54 SCED meta-analyses discussing outcome domain report the metric for this moderator. Among 14 SCED meta-analyses analyzing methods of measuring outcomes as a moderator, three report the metric for methods of measuring outcomes.
Metrics used to quantify moderator effects
In total, 13 different types of metrics are reported in the reviewed SCED meta-analyses, which can be clustered into four broader categories, namely non-overlap metrics, regression based/ HLM metrics, the log ratio, and the standardized mean difference metrics. In order to enhance the discussion, these broader categories are summarized, but a complete overview of the specific metrics within each of these four broader categories can be obtained upon request. This section presents the results for moderators included by the largest number of SCED meta-analysis per level (see Table 4) as similar findings apply for other moderators. Again, the complete overview can be obtained upon request by the first author. For within-participant level, intervention specific moderators and outcome specific moderators are reported separately. As a consequence, a total of four moderators are selected for in depth discussion. These moderators are study design (i.e., study level), age (i.e., participant level), intervention program (i.e., within-participant level–intervention specific) and domain of outcome (i.e., within-participant–outcome specific). The results show that 71% of SCED meta-analyses use non-overlap metrics, while 22% of studies use the SMD metrics. Only 4% use regression based metrics and 3% log ratio metrics. In sum, non-overlap metrics are most commonly used in SCED meta-analyses, followed by the SMD metric. Regression based metrics and log ratio metrics are less popular.
Number (%) of Meta-Analyses Using Specific Effects Sizes (The Most Popular Moderator in Each Moderator Level).

Analysis approach used to summarize moderator effects across studies
The type of analyses used in SCED meta-analyses to summarize moderator effects across studies, can be clustered within four broader categories; description in words, inclusion of frequency or frequency table, reporting of quantitative metric (e.g., reporting metric and 95% confidence interval), and inclusion of a statistical analysis (i.e., reporting statistical significance). The analysis approach for each moderator is presented in Table 2. The most commonly used analysis approach is description in words, followed by frequencies. The category of statistical analysis is the least used approach.
For study level moderators, at least 50% of studies analyze study design, publication type, interventional arrangement, context, and FBA method using a quantitative metric. A range of 20% to 46% of meta-analyses analyze physical settings of intervention, design standard, design strength, maintenance, generalization, validity, and improvement using a quantitative metric. For the moderator interobserver agreement, only 7% of studies use a quantitative metric. However, no studies analyzing interobserver agreement, generalization, validity, and improvement use a statistical analysis. Except from these four moderators, the percent of studies using statistical analysis to analyze other study level moderators ranges from 12% to 45%.
For participant level moderators, more than 50% of studies analyze age, disability status, functional repertories, and received special education using a quantitative metric. Thirty-three percent of studies analyze gender using a quantitative metric, while 18% of studies analyze ethnicity using a quantitative metric. The percent of SCED meta-analyses studies using statistical analysis to analyze participant level moderators ranged from 6% to 60%.
For intervention specific moderators, at least 50% of studies analyze intervention program, intervention agent, intervention techniques, intervention dosage, and technology devices using a quantitative metric, while 14% of studies analyze fidelity using a quantitative metric. A range of 14% to 50% of studies analyze intervention specific moderators using statistical analysis. For outcome specific moderators, 78% of studies analyze outcome domain using a quantitative metric, while 59% of studies analyze this moderator using statistical analysis. Thirty-six percent of studies analyze outcome measurement using quantitative metric, and 21% of studies analyze it using statistical analysis.
Discussion
Meta-Analysis of SCEDs
Meta-analysis is a powerful technique for the quantitative synthesis of primary study results (Borenstein et al., 2009; Card, 2016; Cooper, 2017; Glass, 1976; Hedges & Olkin, 1985; Lipsey & Wilson, 2001). As research production is growing exponentially in the field of SCEDs, researchers, practitioners and policy makers are unable to read all research. Therefore, meta-analysis is a welcomed technique in the field of SCEDs. By combining research evidence across SCED studies (investigating the same intervention and the same outcome variable) using meta-analytic techniques, an objective summary statistic evaluating the effectiveness of an intervention can be obtained. Meta-analysis can be used to make more general conclusions related to the effectiveness of an intervention, reduces sampling error, and contributes to evidence-based decisions in practice, policy and research.
One meta-analytic that has been recommended for the quantitative summary of SCEDs is hierarchical linear modeling. The hierarchical linear model takes the multilayered data structure into account as SCED data (level 1) is nested within participants (level 2) and participants are nested within studies (level 3). By explicitly modeling these three levels, the source of systematic variability in intervention effectiveness between and within SCED studies can be identified and moderators at these different levels can be added in an effort to explain this systematic variability. This systematic review focuses on summarizing SCED meta-analyses including moderators as this is currently missing in the literature.
SCED Meta-Analysis including Moderators
There is a lack of methodological research evaluating statistical properties of the hierarchical linear modeling approach summarizing SCED studies, with the inclusion of moderators. The goal of this study is to provide an overview and description of commonly encountered moderator characteristics and analysis techniques that can be used to inform future methodological research as such an overview is currently missing. This systematic review of SCED meta-analysis provides a comprehensive overview and discussion of moderator characteristics typically included in SCED meta-analyses. Second, moderator analysis techniques are summarized (i.e., the metric used to quantify moderator effectiveness, the unit of analysis, and the specific approach used to combine metrics across cases and/or across studies.
General Moderator Characteristics
This systematic review presents moderator characteristics based on a total of 60 SCED meta-analyses published between 2016 and 2019. Based on the systematic review, the following moderator characteristics can be considered in future methodological work. At the study level, the most popular moderators are study design, physical setting of intervention, design standards, design strength, interobserver agreement, and maintenance. At the participant level, commonly encountered moderators are age, disability status, gender, ethnicity, and functional repertories. Finally, at the within-participant level, the most discussed moderators are outcome domain, intervention program, intervention agent, intervention techniques, and intervention dosage. All of the aforementioned moderators’ measurement scales are nominal, except from interobserver agreement, age, functional repertories and intervention dosage. Almost all SCED meta-analyses reported no missing data for included moderators. This implies that a condition representing missing data for moderators does not necessarily need to be part of future methodological work as this is not an issue.
Number of Moderators per Units
Current systematic review provides insights into the typical ratio of the number of moderators versus the number of units at the study level, participant level, and within-participant level. If a SCED meta-analysis includes ten primary SCED studies and a total of ten participants among these ten primary SCED studies, typically this SCED meta-analysis discusses two study level moderators, no more than one participant level moderator (i.e., ratio = .06), and one moderator at the within-participant level. The ratio of the number of moderators at the study level to the number of units at that level ranges from 0 to 1.4. This indicates that some SCED meta-analyses do not include moderators at the study level, whereas others include more moderators relative to the number of units at that level. It is recommended that future simulation studies include conditions reflecting both extremes. The ratio of the number of moderators at the participant level to the number of units at that level ranges from 0 to 0.24. This indicates that an SCED meta-analysis including on average 10 participants per study, typically includes up to two moderators. Only one meta-analysis did not include any participant level moderators. The current study finds that the ratio at the within-participant level ranges from 0 to 0.60 (both for intervention specific and outcome specific moderators).
Quantification of Moderators
Although previous research found that most meta-analyses conducted a moderator analysis (Jamshidi et al., 2020), details of the analysis approach related to each moderator per level was not reported. Current study indicates that statistical significance testing is the least commonly used approach to analyze moderators. The majority of SCED meta-analyses used quantitative metrics to analyze moderator effects. The most commonly used metric to quantify moderator effectiveness is Tau-U. This metric is considered to be a more advanced non-overlap statistic as it compares all the baseline observations with all the intervention observations and it has the potential to account for baseline trends (Parker, Vannest, Davis, & Sauber, 2011). However, recent methodological research has indicated that this metric has no meaningful scale (i.e., is not bounded between -1 and 1), is biased in certain conditions, and is difficult to interpret (Fingerhut et al., 2021; Tarlow, 2017). In addition, synthesizing moderator effects using the average Tau-U ignores the nested data structure and is not recommended. The hierarchical linear modeling approach deals with all these issues, but is only used in a limited number of SCED meta-analyses. As a consequence, efforts are needed to further disseminate the approach to a broader audience.
Limitations and Future Research
The review of previously published systematic reviews of SCED meta-analyses revealed that items related to moderators have not been considered for inclusion in reporting guidelines to assess the quality of SCED meta-analyses and systematic reviews. Therefore, future research is needed to develop such items. Reporting guidelines and checklists for quality assessment of group-comparison design meta-analyses and primary level SCEDs embed to some extent items related to moderator characteristics. Therefore, these items can be considered as a starting point. Having access to information related to moderator characteristics can have far reaching implications for practice, policy and theory as some interventions might only be effective given a certain set of study and/or participant characteristics.
Future Monte-Carlo simulation studies are needed to provide recommendations about the number of units at the different levels of the hierarchical liner modeling approach that are needed to identify true intervention and moderator effects, given a certain set of design conditions representative for SCED meta-analysis including moderators. The moderator characteristics reported in current systematic review can inform these design conditions. However, parameter values for moderator effects (e.g., the size of the effect of age on the intervention), correlations between the moderators (e.g., correlation between age and gender) and correlations between the moderators and the intervention (e.g., correlation between age and intervention) are not discussed. Identifying these parameter values is recommended for future research.
This systematic review presents moderator characteristics based on a total of 60 SCED meta-analyses published between 2016 and 2019. SCED meta-analyses prior to 2016 could also been explored. However, current systematic review evaluates 910 SCED meta-analysis and provides insights in commonly used SCED moderators based on the most recent SCED meta-analyses.
Implications of SCED Meta-Analysis for Evidence-based Practice
In sum, this systematic review provides a comprehensive overview and discussion of moderator characteristics typically included in SCED meta-analyses. This overview of moderator characteristics is timely and can inform the design conditions to be included in future methodological work. Future methodological work is needed to provide answers to practical questions when designing SCED meta-analyses such as: (a) What are typically encountered study, participants and within-participants moderators? (b) What is the scale of typically encountered moderators? (c) What is the number of moderators relative to the number of units? and (d) What is the anticipated power to detect true intervention and moderator effects given a set of design conditions representative for SCED meta-analyses? By further enhancing the field of SCED meta-analysis by including moderators, evidence can be obtained about what intervention works, when, where, for who and at which cost.
Footnotes
Declaration of Conflicting Interests
The author(s) declared no potential conflicts of interest with respect to the research, authorship, and/or publication of this article.
Funding
The author(s) disclosed receipt of the following financial support for the research, authorship, and/or publication of this article: This research was supported by the Institute of Education Sciences, U.S. Department of Education, through grant R305D190022. The content is solely the responsibility of the author and does not necessarily represent the official views of the Institute of Education Sciences, or the U.S. Department of Education.
Supplemental Material
Supplemental material for this article is available online.