



Abstract
Introduction
The present contribution mainly focuses on the evaluation of the visual performance of people with impaired vision and, for comparison purposes, individuals with typical vision under different lighting conditions.
In the past decades, the awareness level concerning the importance of inclusive approaches to design and management of the built environment has been steadily increasing. As such, built environments cannot target solely those populations with assumed default (variously referred to as “healthy” or “typical” or “average”) potential and capacities, be those motoric, perceptual, or cognitive. Also in the field of built environment, approaches labeled under terms such as “universal design,” “design for all,” and “inclusive design” highlight the importance of taking people’s variance into account (Austrian Standards Institute, 2013; ISO, 2001; Nussbaumer, 2012). As with other areas of impairment, various forms of deficiency in visual information processing represent a challenge for people with visual impairments (Corn & Erin, 2010; Kaufman & Alm, 2003). Here too, design and operation approaches in the built environment must address the implications of visual impairment, for instance, in terms of adequate lighting and signage strategies. Whereas there has been some research (Akashi et al., 2017; Cook, Yohannes, Le Scoullier, Booy & O’neill, 2005; Cornelissen, Kooijman, Dumbar, van der Wildt & Nijland, 1991; Dalke, Camgoz, Cook, Bright, Niemann & Yohannes, 2005; Dalke, Conduit et al., 2006; Dalke, Little et al., 2010; Eklund, 1999; Mathiasen & Frandsen, 2018; Pasini & Proulx, 1988; Perlmutter et al., 2013; Wrigbt, Cook & Webber, 1999a, 1999b) and standardization efforts (CIE, International Commission on Illumination, 1997, 2011a, 2011b, 2017) in this area, the field can arguably benefit from further research efforts.
In this context, the present contribution reports on an empirical study conducted in Vienna, Austria, with regard to the scope and implications of visual impairment as relevant to lighting circumstances in the built environment. People with moderate or severe visual impairment (roughly 320,000 individuals in Austria, BSVÖ, 2007) rely primarily on their remaining vision to orient themselves in their surroundings. Reduced visual performance may involve a combination of a number of conditions, including reduced visual acuity and contrast sensitivity, restricted field of vision, illumination adaptation problems, increased sensitivity to glare, impaired color vision, and reduced visual information processing speed. Visually relevant afflictions include obfuscation (cataracts), visual field defects (glaucoma, retinitis pigmentosa), central scotoma (e.g., macular degeneration), hemianopsia, and colorblindness (e.g., achromatopsia).
Unfavorable lighting, as well as subpar color and material choices, can further impede the visual abilities of people with visual impairments. Many individuals with impaired vision have specific lighting requirements with regard to brightness levels and glare control. The readability of information and way-finding at bus stops and train stations can strongly vary depending on the installed lighting system. Lighting circumstances at times make it difficult to detect inscriptions and markings. Disturbing reflections on floors and glass surfaces frequently cause visual confusion and represent an extra burden for and a risk to people with visual impairments. Even though there are a number of standards, which include pertinent recommendations (e.g., Austrian Standards Institute, 2011, 2014), there is a need for further studies concerning the complex interplay of light emission and reflection (luminaires, materials, and colors) and its physiological ramifications in the context of visual impairment.
The present contribution reports on the results of an investigation involving the visual performance of both people with impaired vision and typical vision in different lighting situations. In particular, the visual acuity and contrast sensitivity were explored as a function of adaptation luminance and glare sensitivity. Participants’ subjective assertions were assessed via interviews. These objectives of this study are in line with insights in the field of low vision rehabilitation, which consider the optimization of illumination as one of the most effective measures toward full exploitations of the existing potential of people with visual impairments. Accordingly, the results are arguably relevant to guidelines for adequate treatment of lighting, color, and material combinations in both new designs and retrofit projects.
Approach
GENERAL PROCEDURE
The empirical investigation presented in this paper involved the participation of people with visual impairments and, for comparison purposes, people with typical vision. The following procedure was generally adhered to: (1) reception of the participants at the location of the experimental setting, introductions and questions, and consent agreements; (2) interviews with the participants under low-luminance conditions (the interview duration—about 20 to 30 minutes—further facilitated the participants’ adaptation to low-level lighting conditions); (3) assessment of the visual performance parameter with four different vision screenings at eight different adaptation degrees of luminance (from dark to light); (4) determination of the contrast sensitivity at eight Unified Glare Rating levels (Austrian Standards Institute, 2011); (5) assessment of subjective glare perception; and (6) concluding discussion.
PARTICIPANTS
Participants were divided into three groups. The test group included participants with visual impairments (N = 98; mean age: 53 years). The causes of visual impairment in this group varied. Fifty-nine percent of the participants with visual impairments had retinal defects (e.g., macular degeneration or retinopathy pigmentosa), 14% had diseases of the anterior segment of the eye (e.g., cataract), 7% had glaucoma, and 20% had mixed forms of vision loss or other impairments. The visual acuity of the participants with visual impairment ranged from 0.01 to 0.8. The mean value of the visual acuity of this group was 0.08.
Control group 1 included younger individuals with typical vision (N = 22; mean age: 29 years; visual acuity from 0.63 to 1.25; mean value 1.0). Control group 2 included older individuals without relevant vision loss (N = 16; mean age 67 years; visual acuity from 1.25 to 2.0; mean value 1.6). The test participants with impaired vision were introduced to the study as arranged with and approved by the Hilfsgemeinschaft der Blinden und Sehschwachen Österreichs, (i.e., the Austrian Association of the Sightless and Visually Impaired; Hilfsgemeinschaft, 2020), which acted as the project partner representing VIDEA. All participants were instructed in the purpose and nature of the study in detail at the outset of investigations. All participation was voluntary, consensual, and with the knowledge and agreement of the aforementioned representative body of the people with visual impairment in Austria.
EXPERIMENTAL SETUP
An original test procedure was developed to assess participants’ visual performance. The implemented experimental setup (see Figure 1) facilitated the production of different brightness levels in the visual field (adaptation luminance; Goersch, 2004). The conducted tests were suitable for both people with typical vision and impaired vision. The visual tests were conducted using a monitor. The arrangement (screen and environment) was calibrated by a certified instance, namely, the Testing, Inspection, and Certification Body of the City of Vienna (MA 39, 2020). The total amount of time required for conducting tests was about 45 minutes per participant in order to keep the effect of fatigue as low as possible. Likewise, the selected sequence of vision tests was performed in the shortest possible time to avoid stress and fatigue. Plan (left) and the 3D illustration (right) of the experimental setup.
INTERVIEWS
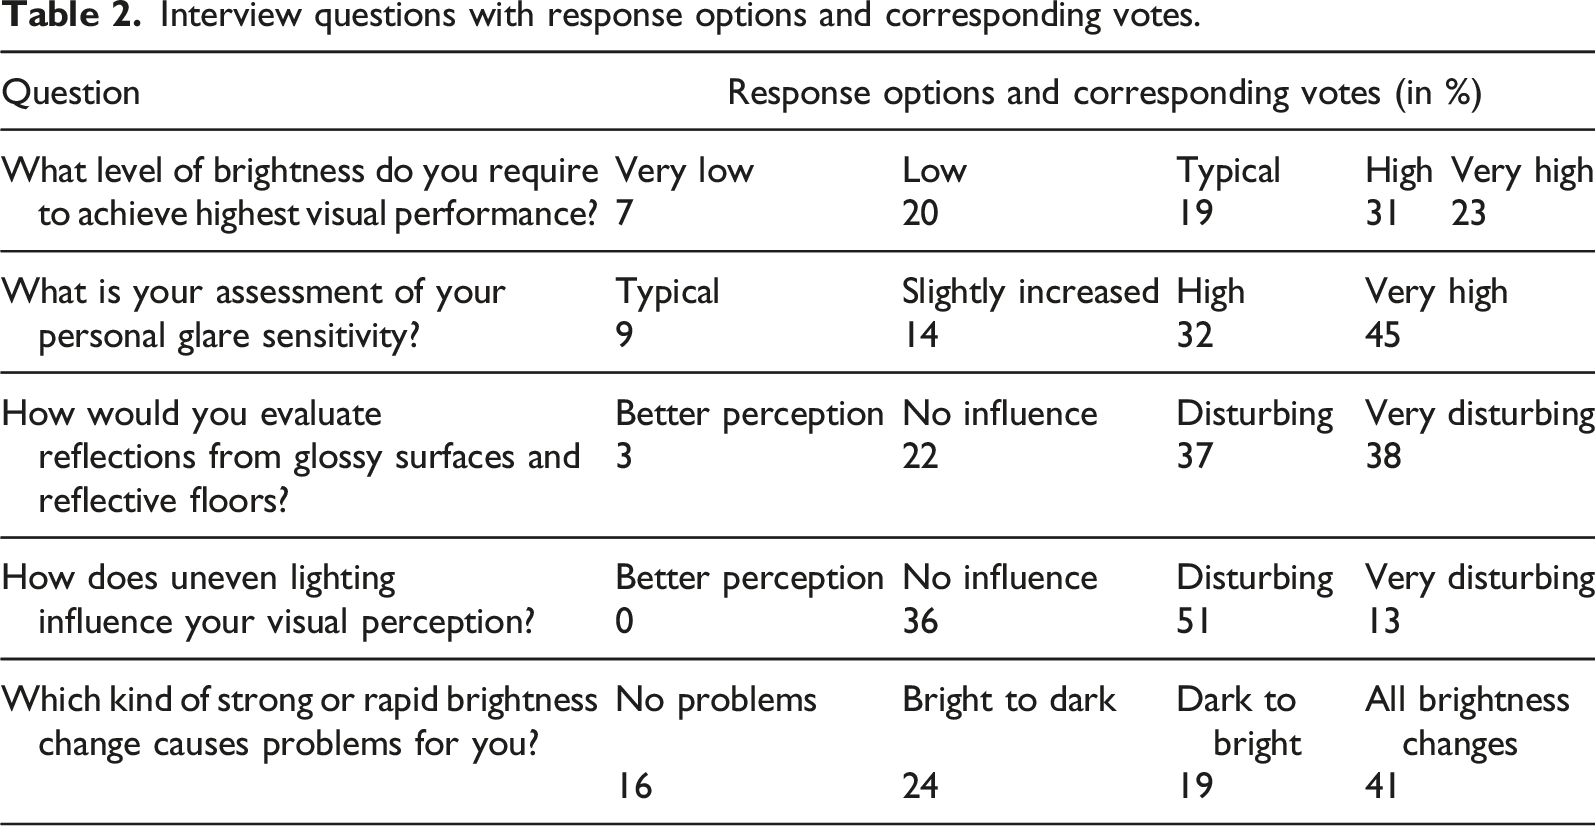
Interviews were conducted to assess participants’ subjective impressions of personal visual performance in different lighting situations. Questions posted to participants with impaired vision included: What is your assessment of the brightness level you require to see best? What is your assessment of your personal glare sensitivity? In what situation does glare sensitivity occur? How does uneven lighting affect your visual perception? Do you have additional problems with strong and rapid changes in brightness? How are you affected by reflections from glossy surfaces and reflective floors? Interview protocols could be obtained from 93% of the participants with visual impairment.
EYE TESTS
The eye tests were presented via a high-quality thin-film transistor (TFT) monitor. The monitor is characterized by uniform luminance distribution, a large background luminance adjustment range (0.1–300 cd.m-2 possible), and a matte surface. Adaptation luminance is determined by the luminance in the visual field. However, the specific part of the visual field responsible for the adjusting criteria of adaptation luminance still represents an open question. The test setup was therefore specially arranged to uniformly stimulate as much of the visual field as possible such that a qualitative statement about the generated adaptation luminance could be made. The luminance of the screen and the surrounding luminance were nearly identical. The color temperature of the environment was about 4500 K (neutral white). All eye tests (visual acuity test, contrast threshold test, and logatom test) were performed at an observation distance of 1 m. The visual acuity test and the contrast threshold test were performed at the following adaptation luminance: 0.1, 0.32, 1, 3.2, 10, 32, 100, and 320 cd.m-2. The logatom test (see the Logatom Recognition as a Function of Contrast section for further details) was carried out at an adaptation luminance of 1, 10, and 100 cd.m-2.
Visual Acuity Test
Participants’ vision was assessed using Landolt rings (Goersch, 2004; Paliaga, 1993) (CMichelson = 0.98) of different sizes. In this contribution, the results of the visual acuity test are expressed in decimal system. The presentation of Landolt rings progressed from large to small. The size grading was logarithmic, hence in accordance with the Weber-Fechner law. The size of the Landolt rings could be presented in a range of visual acuity from 0.01 to 2.0. Three of the five openings of the Landolt rings of each size had to be correctly identified.
Contrast Threshold Test
The contrast threshold test was based on the Pelli-Robson Chart (Precision Vision, 2020). However, instead of using letters, the contrast threshold was determined by using Landolt rings of the same size (corresponding visual acuity 0.02). The contrast was reduced in logarithmic steps until the gap of the Landolt ring was no longer detected. Three of five optotypes of the Landolt rings per contrast level had to be correctly identified. A contrast (CMichelson) between 0.98 and 0.007 was shown.
Logatom Test of Contrast Sensitivity
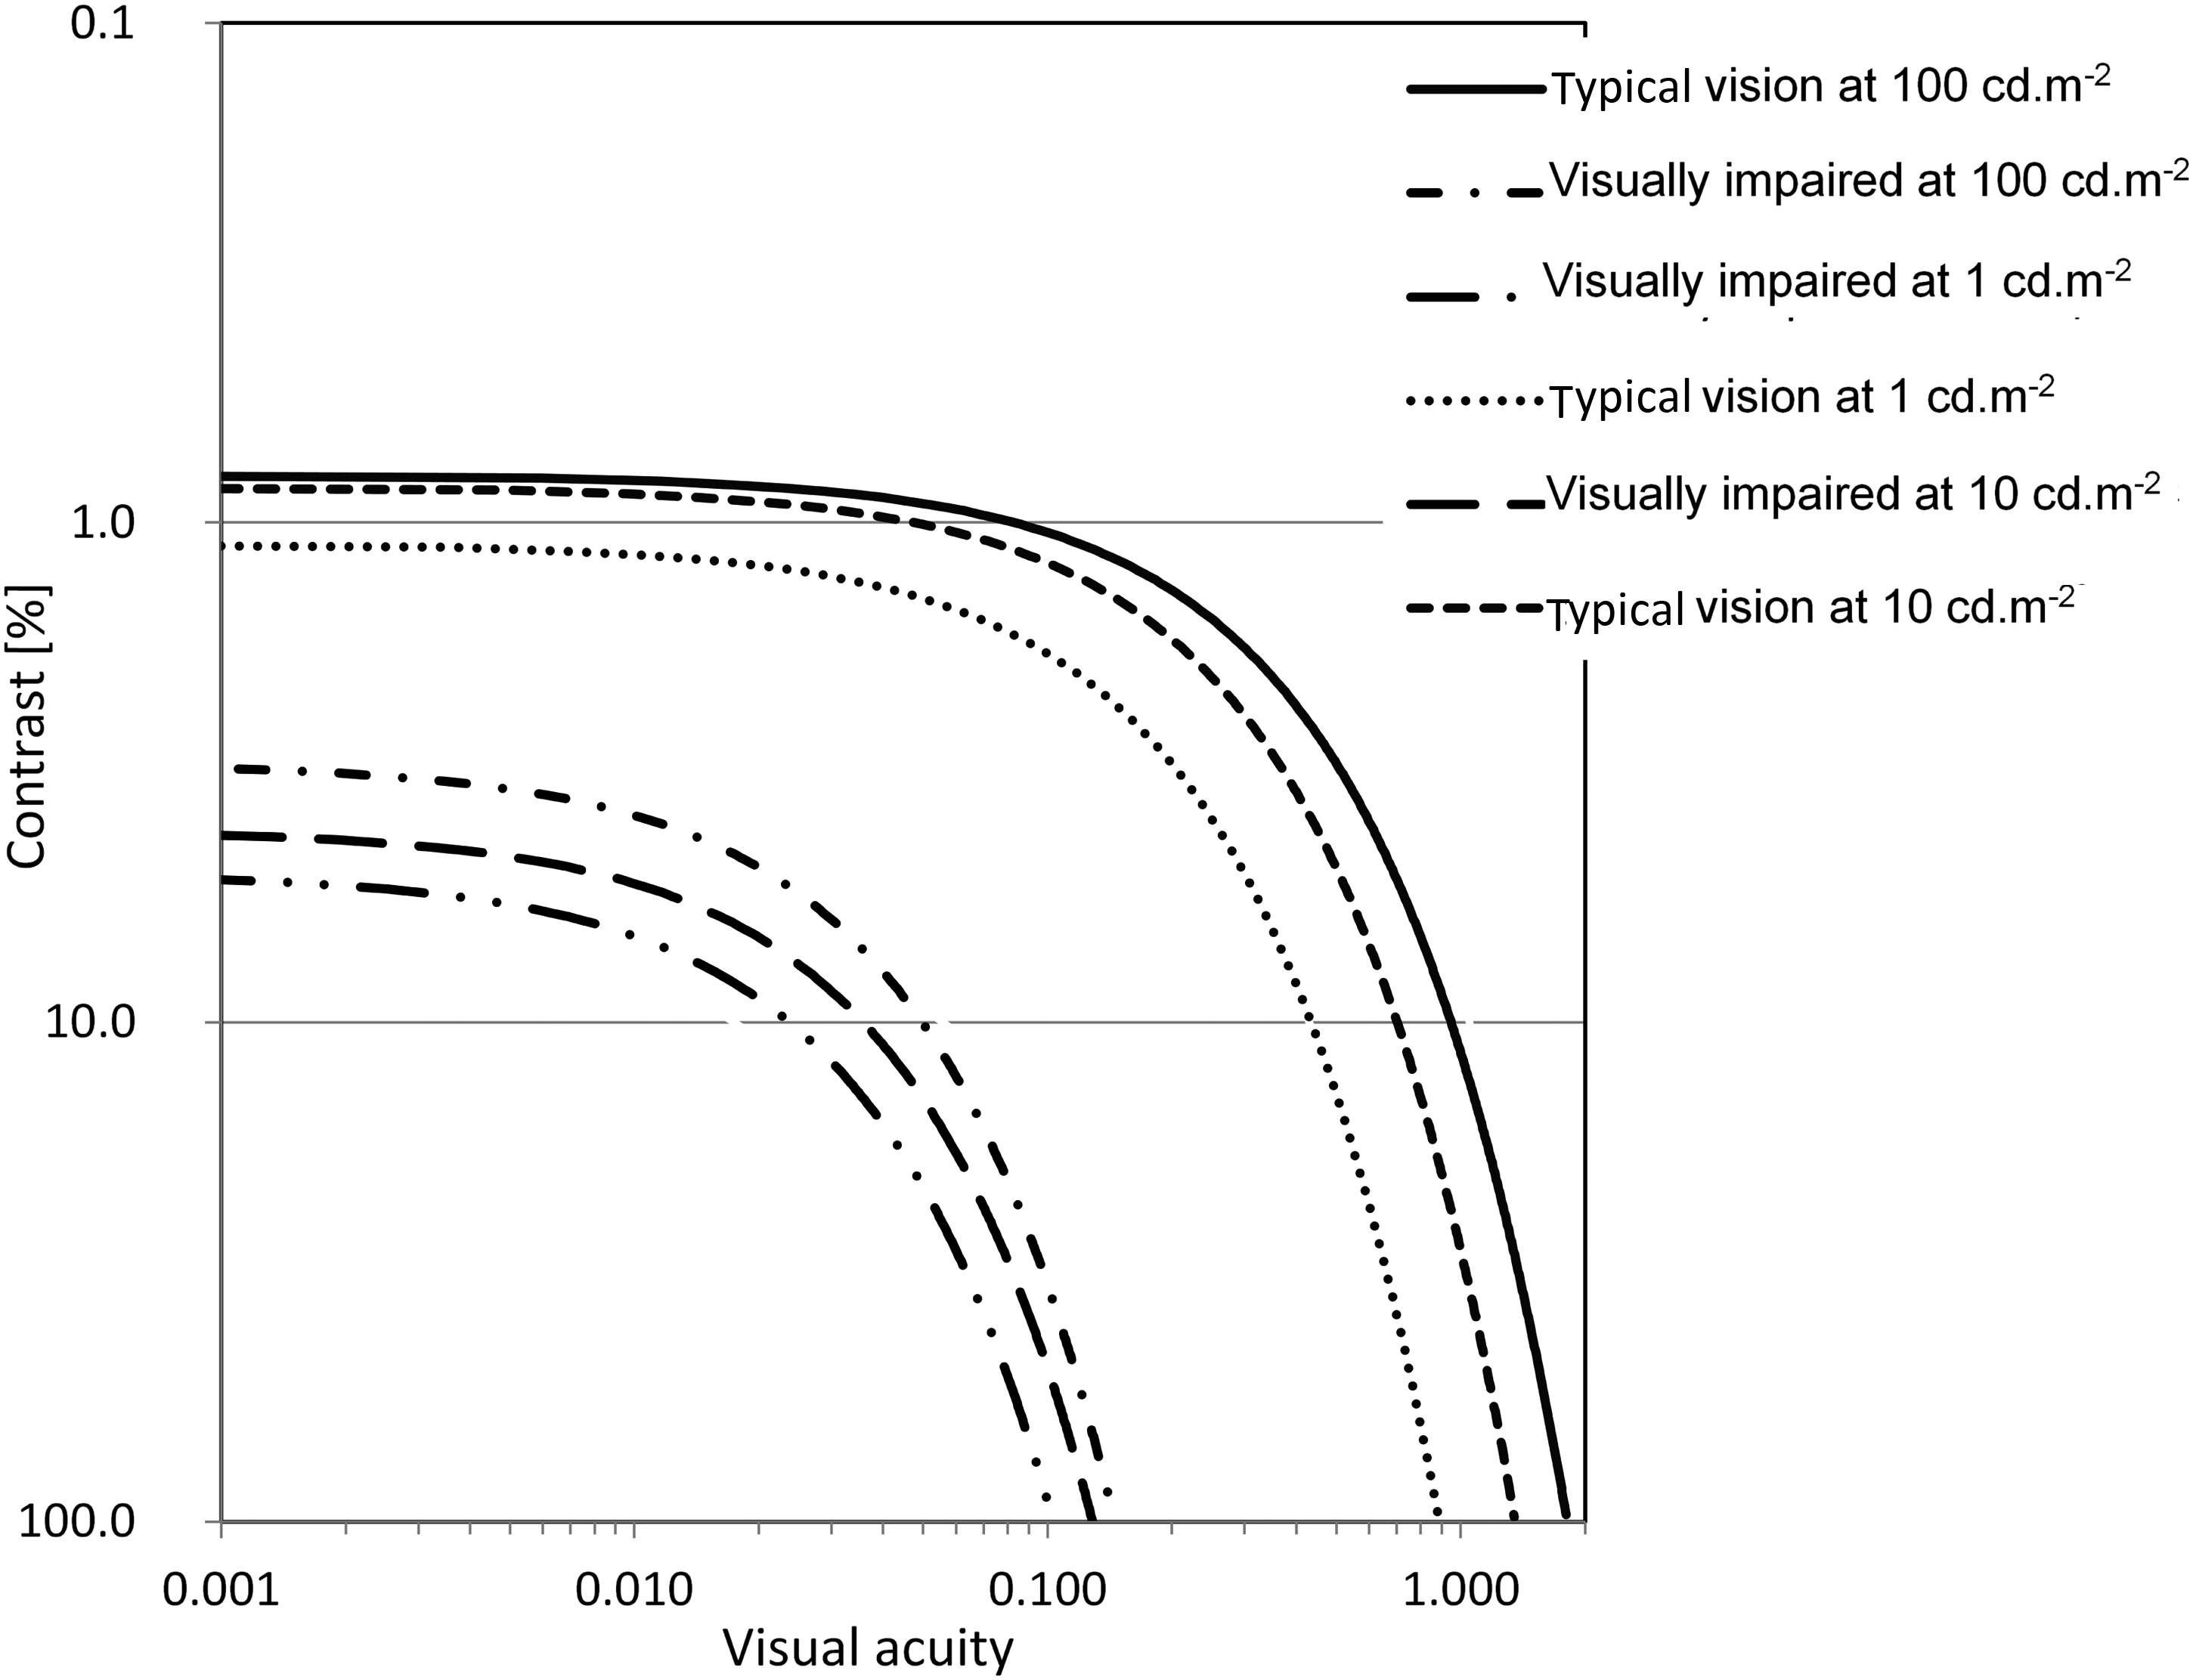
Logatomes come from the field of audiology and represent word-like nonsensical terms (e.g., “GARUWO,” “NOGIWA,” “EDURAX,” “BUSCHO,” “TUGABO,” and “ZUPASI”). The motivation behind their use is to avoid the interference of semantic information (i.e., the meaning) with the primary process of auditory (in our case, visual) perception. For the present test purposes, six-letter logatomes were used for individuals with a visual acuity of 0.032; whereas, at 0.025 and 0.02, there were four letters, and at 0.016 only three. In the lowest visual acuity steps, the logatomes would have to be wider than the (oversized) screen. The logatomes were presented at the following contrast levels (CMichelson): 80%, 50%, 30%, 20%, 10%, 5%, 3%, 1.6%, and 1% (see Figure 2). This type of test has been proven advantageous, as the word image recognition is inhibited, which means that the completely unknown combinations of letters cannot be recognized based on past memory and semantic cues. The level of visual acuity was considered as achieved when two of three logatomes were correctly recognized. Schematic representation of the logatom test.
Glare Test
Subjective impression of glare as a function of unified glare rating (UGR) for people with typical and impaired vision.

Results
INTERVIEWS
Interview questions with response options and corresponding votes.
Illumination and Brightness Requirements
Some 54% of the participants with impaired vision suggested they needed increased light levels for improved visual performance, whereas about 27% (mostly those with very low visual acuity and severe visual impairments) found low or very low light levels more conducive to better visual performance.
Subjective Glare and Reflection Sensitivity
Approximately three-quarters of the participants rated their sensitivity to glare as high or very high. The majority of the glare-sensitive individuals experience glare under both artificial light and daylight. The rest reported to experience such problems under daylight. Reflected glare may have an effect on visual perception. Some 75% of the surveyed participants with visual impairments identified reflected glare (e.g., as on glossy floors) as disturbing or very disturbing. High-luminance reflections can lead to misinterpretations of the visual field and additionally reduce visual acuity, especially in case of individuals with decreased contrast sensitivity.
Spatial and Temporal Tight Distribution Uniformity
People with impaired vision frequently find nonuniform lighting situations problematic, mainly due to the limited adaptability of the visual system, manifest in a reduced dynamic range. In our study, 64% of people with impaired vision negatively evaluated nonuniform illumination (51% found it disturbing, and 13% very disturbing). Moreover, most participants reported adaptation problems due to rapid changes in illumination, which is experienced, for example, when walking into a building on a bright day or vice versa (24% reported problems from bright to dark, 19% from dark to bright). Some 41% of the participants with impaired vision reported problems in both light-to-dark and dark-to-light transition situations.
RESULTS OF THE VISUAL TESTS
Visual Acuity as a Function of Adaptation Luminance
Figure 3 shows the empirically observed visual acuity as a function of adaptation luminance. Thereby, the results are separately displayed, for participants with impaired vision, in three categories: (1) all participants, (2) participants who expressed either very high or high brightness preference (54%), and (3) participants who expressed either very low or low brightness preference (27%). The figure also includes the results for participants with typical vision (both young and old). Note that the results in Figure 3, as well as those in Figures 4, 5, 6, and 7, represent mean values over participants in the respective categories. Visual acuity as a function of the adaptation luminance. Contrast threshold as a function of the adaptation luminance. Contrast sensitivity functions obtained with logatomes at three luminance levels (1, 10, and, 100 cd.m-2).

As it could be expected, young participants with typical vision achieved the highest visual acuity. Visual acuity of the elderly participants without visual impairments was lower than that of the younger subjects, especially at lower brightness levels. The visual acuity of the participants with impaired vision, on the other hand, was found to be greatly reduced. Participants with expressed higher luminance level requirements displayed a significant increase in visual acuity with increasing adaptation luminance. In fact, at very low levels of luminance, the visual acuity of this group approached zero. The participants with impaired vision with expressed low light requirements displayed maximum visual acuity in the brightness range from 10 to 32 cd.m-2. At brightness levels below 10 cd.m-2, the visual performance of this group was decreased, but it was still significantly higher than that of the participants with high illumination requirements. In this case, at luminance levels beyond 30 cd.m-2, the visual acuity slightly declined.
Contrast Threshold as a Tunction of Adaptation Luminance
Figure 4 shows contrast threshold as a function of adaptation luminance. Again as expected, the contrast threshold of the younger individuals with typical vision was lowest (highest contrast sensitivity). The elderly individuals with typical vision displayed a slightly lower contrast sensitivity. Here, the decline at lower luminance levels was not as pronounced as in the case of visual acuity. A majority of individuals with impaired vision experience increased contrast sensation at higher luminance levels. Participants with low light requirements experience a decrease in contrast sensation starting from a luminance level of about 10 cd.m-2.
Logatom Recognition as a Function of Contrast
Contrast sensitivity functions (see Figure 5) that establish the relationship between visual acuity and contrast sensitivity were derived based on the logatom test at three luminance levels (1, 10, and 100 cd.m-2). As compared to people with typical vision, the functions associated with participants with impaired vision display significantly reduced visual acuity and contrast sensitivity. At higher adaptation luminance levels, better visual acuity and contrast sensitivity can be expected.
Contrast Threshold as a Function of Unified Glare Rating
Figure 6 displays the contrast threshold as a function of Unified Glare Rating. In this case, contrast threshold was determined with an additional central source of glare at an adaptation luminance of 10 cd.m-2. Participants with typical vision could detect very low contrasts regardless of glare. Contrast sensitivity slightly decreases as glare increases. This effect is somewhat more pronounced in the results of the elderly participants. In comparison, the contrast sensitivity of the test participants with impaired vision decreases significantly with increasing glare. In several high-glare situations, the decrease in contrast sensitivity was so drastic that practically no contrast sensitivity could be detected. Contrast threshold as a function of glare (expressed in terms of UGR; average measurement results).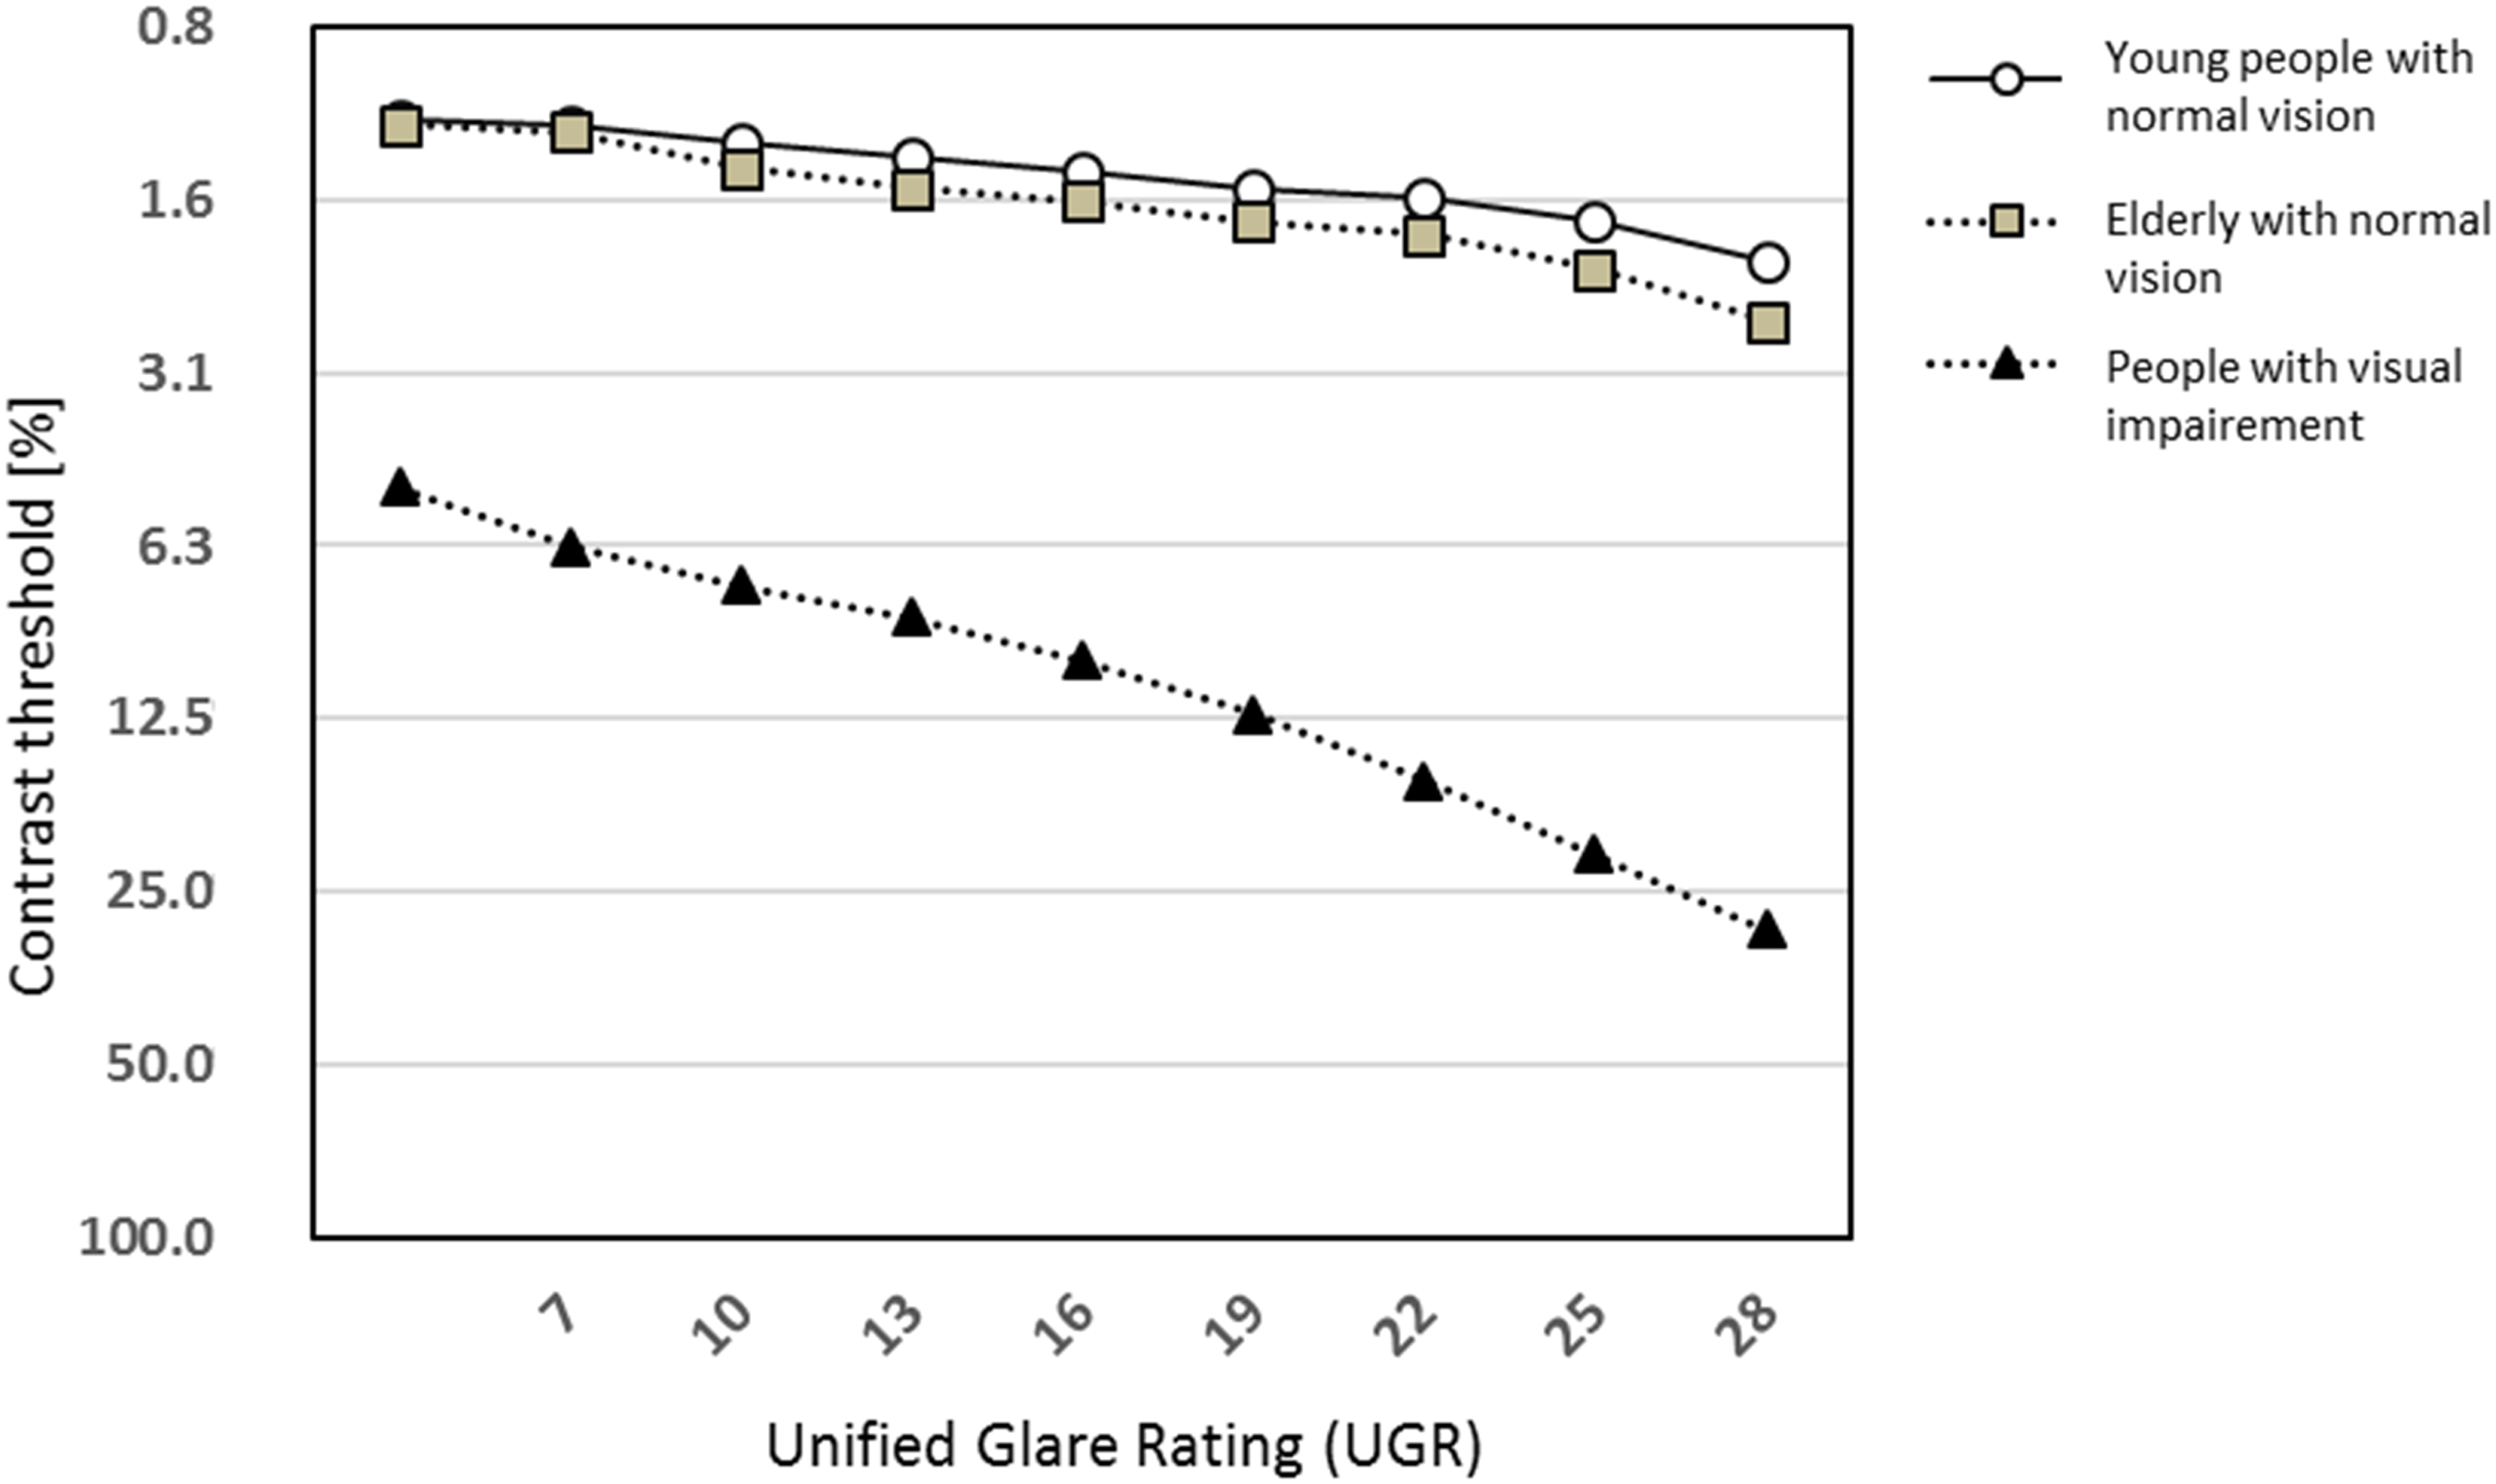
Visual Comfort as a Function of Glare
Obtained comfort levels of participants are shown in Figure 7 as a function of glare (expressed in terms of Unified Glare Rating). Younger subjects with typical vision display the lowest discomfort levels, followed by older participants and those with visual impairments. Generally speaking, discomfort levels rise in tandem with increased glare. Discomfort as a function of Unified Glare Rating (Average Measurement Results).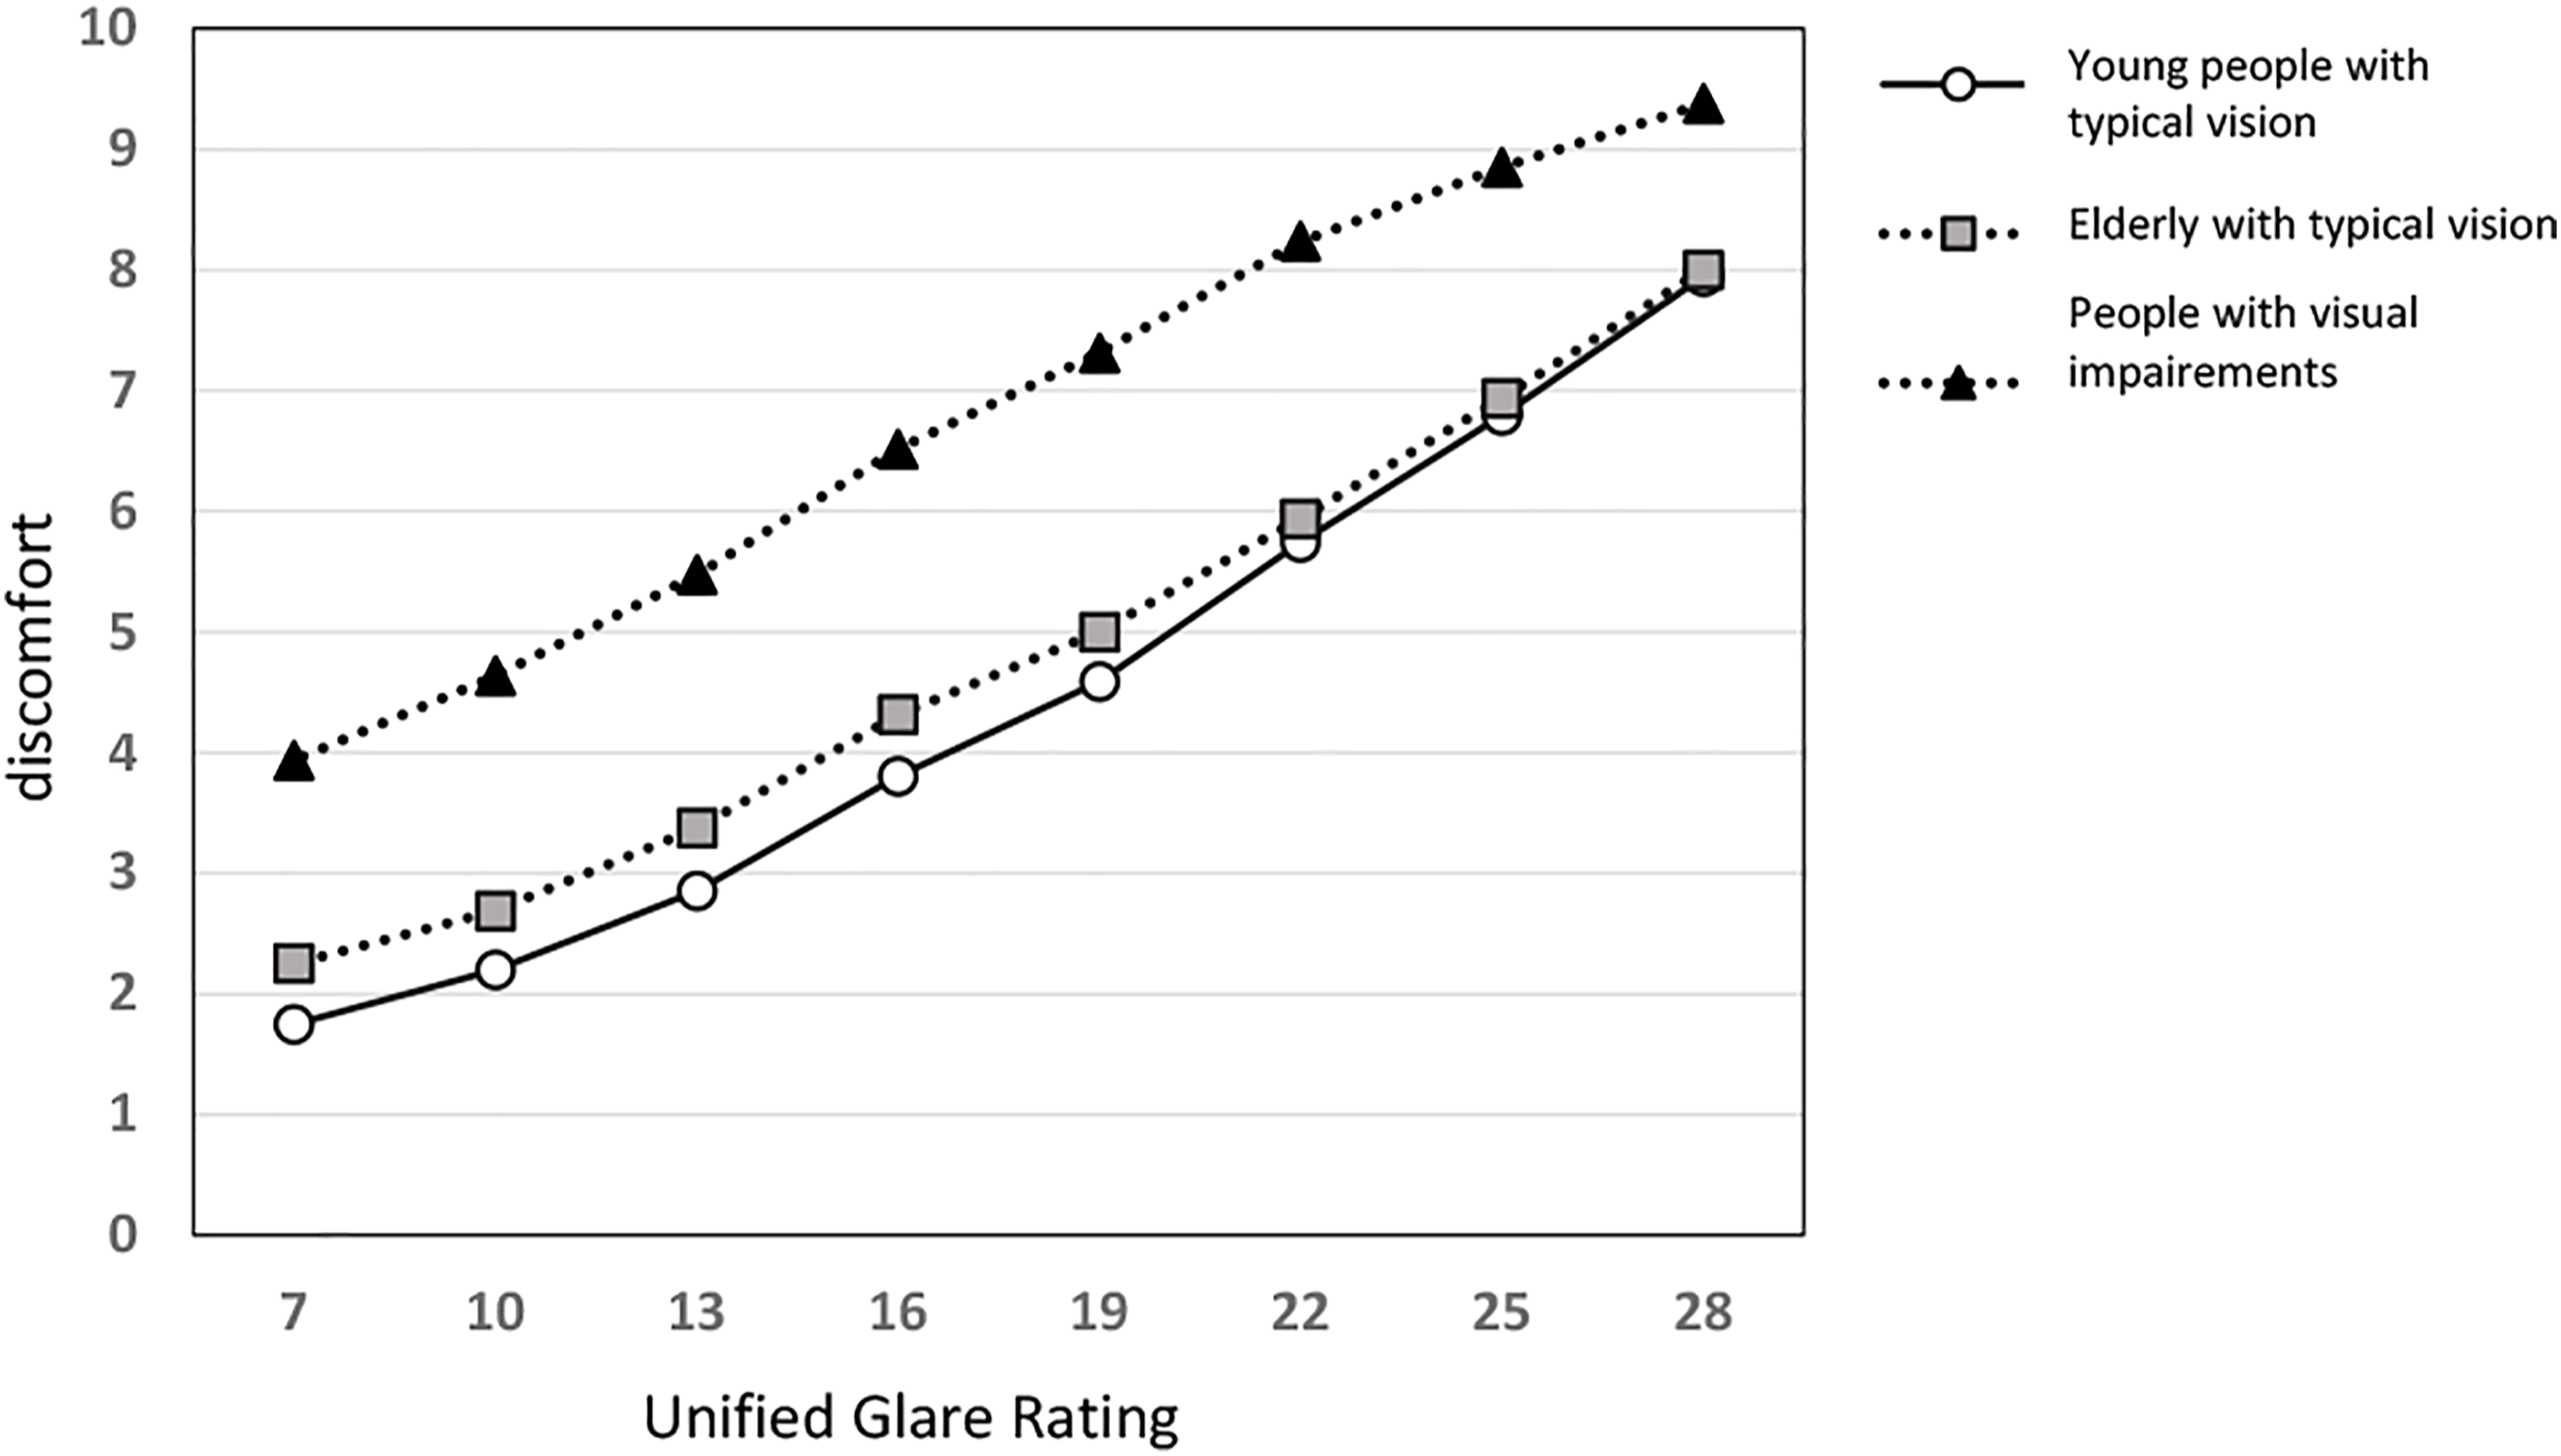
Discussion and Conclusions
SUMMARY OF THE MAIN FINDINGS
The majority (54%) of the participants with impaired vision in our study experience improved visual performance at higher brightness levels. The results of the eye tests show that this is especially important when it comes to perceiving contrast, which occupies a central role in visual information processing in everyday life. However, the measured values of visual acuity display a broad dispersion. In individual cases, specific brightness levels may be needed, which may also vary as the nature of the visual task changes. Elderly participants with typical vision require increased illumination levels, especially when completing visually intensive tasks (e.g., when reading). These individuals can greatly benefit from an increased level of brightness and even achieve a similar level of visual acuity as younger individuals with typical vision.
As compared to people with typical vision, the contrast sensitivity of the participants with impaired vision in our study was significantly reduced. Thus, higher minimum contrast levels would be beneficial for this population. Even under favorable conditions, the individuals with impaired vision do not display the same contrast sensation level as that of typically sighted individuals under unfavorable conditions.
Next to appropriate brightness levels, glare represents the most important factor regarding remaining visual capacity of people with impaired vision, which is evident both in interviews and in empirical glare tests. As compared to people with typical vision (CIE, International Commission on Illumination, 1995, 2002; International Organization for Standardization, 2002), the visual acuity of people with impaired vision decreases much more when experiencing glare. The adaptation process in individuals with impaired vision is hampered due to the reduced efficiency of the visual system, which leads to more severe experiences of glare. Glare occurs when the eye is not able to adapt to the temporal and spatial variation of brightness. It is thus reasonable to suggest that glare is not necessarily caused due too much light, but frequently emerges as a consequence of improper lighting schemes. Individuals with impaired vision are especially affected by glare.
Based on the results of our examination of the relationship between discomfort levels and Unified Glare Rating, we can compare subjective impressions of people with and without visual impairments as a function of glare. Glare limits are frequently specified in terms of Unified Glare Rating values, usually for people with typical vision (Austrian Standards Institute, 2011). Roughly speaking, to establish comparable conditions for people with impaired vision, Unified Glare Rating limits would need to be two steps lower (see Table 1), which implies the need for adjustments in the standardized Unified Glare Rating limits to improve visual accessibility. Note that glare reduction not only greatly benefits the population with impaired vision but also enhances the visual comfort of people with typical vision, especially amongst the elderly population. Limiting glare would be specifically important in places where individuals with impaired vision spend more time and require increased visual performance.
In conclusion, it is important to underline some essential high-level recommendations. To achieve the highest possible level of visual performance, individual lighting needs must be taken into account. This recommendation applies to the conception and implementation of lighting solutions both for home and for work. Specifically, glare risk and its negative consequences must be reduced as much as possible. Moreover, opportunities for individual control and reconfiguration of the relevant components of the lighting system design can contribute to higher levels of the lighting solutions’ effectiveness and acceptability.
LIMITATIONS
Researchers with experience in conducting experimental studies with human participants in general and with those with impairments in particular are aware of the related challenges. Despite our efforts to conduct the study as carefully as possible, multiple limitations apply. Even though our investigation involved a relatively large number of participants (especially for an empirical study in the domain of lighting requirements of people with impaired vision), we cannot assume that the findings are of general validity. Therefore, we also do not imply in any way that the population of participants (and the respective spectrum of visual impairment conditions) is representative—at the national, European, or international level—of the entire population of individuals with visual impairments. Specifically, given limitations pertaining to time, logistics, and resources, only short-term tests of visual acuity and contrast sensitivity could be conducted. Consequently, it was not possible to capture, in detail, the individual types and levels of participants’ physiological afflictions.
Given this circumstance and the limited sample of participants, it was only possible to conduct the correlational studies for two subcategories of participants with impaired vision (namely, those with higher versus those with lower reported brightness needs). Moreover, the distinction between these two groups was merely based on self-assessment results in the course of the interviews, not based on an empirical assessment. Consequently, a finer categorization of impairment conditions and their role in the dispersion of the correlational studies was not possible. As such, detailed results in terms of inferential statistics analyses are not presented, due to, among other things, insufficiently established representativeness level of the sample, as well as insufficient physiological information on participants’ individual visual impairment attributes.
Despite utmost care, the possibility of human errors in data reporting and documentation (measurements and interview transcripts) cannot be categorically excluded. Moreover, interview results (particularly those pertaining to conditions and preferences of the participants) may have been influenced by participants’ specific state of mind at the time of the interviews. In case of some participants, the allocated time for adaptation (used to conduct the interviews) may have not been sufficiently long.
Note that, despite these limitations, we believe we have an obligation to report the findings to the pertinent community of researchers and practitioners, with the hope that the entailed approaches and information will contribute to a growing repository of investigations and data toward a richer knowledge base for the refinement of lighting guidelines and design strategies for accessible visual environments of the future.
FUTURE RESEARCH
In the course of ongoing and future studies, a number of assumptions and recommendations with regard to barrier-free lighting design are to be further scrutinized. These include, for instance, recommendations concerning the maximum luminance of light sources at computer workstations (Austrian Standards Institute, 2011). Experience suggests certain luminance limits (e.g., 1500 and 3000 cd.m-2) for predominantly indirect lighting and for predominantly direct lighting, respectively. Experience further appears to suggest that the ratio of the luminance of the luminaire to that of the immediate surrounding area should not exceed certain thresholds. Our study also appears to confirm the importance of both spatial and temporal uniformity of illumination for people with visual impairments (including adaptation problems). Likewise, it appears to be advisable to provide a transition zone with intermediate brightness impression at such locations in order to avoid a sudden luminance change during both day and night. Further research is also needed to reexamine recommendations concerning the minimum reflectance values of room enclosure elements.
We are currently engaged in the exploration of the opportunities to make the results of this study inform ongoing and future efforts in the development of new versions of relevant lighting standards and guidelines. This study is being applied to formulate recommendations for glare und luminance limits in applicable Austrian standards. Future efforts can explore other relevant aspects, such as the horizontal illuminance. Minimum illuminance requirements for public buildings are specified, for instance, in standards EN 12464-1 and 12464-2 (Austrian Standards Institute, 2011, 2014). However, for certain critical functions, minimum levels are recommended to be increased. For privately used spaces and in the workplace, it is advisable to consider the individual brightness requirements to provide optimal visual performance. Likewise, future research will explore flickering lighting and stroboscopic effects in more detail. In general, these effects are to be avoided. Especially where individuals with central visual field defects are concerned (as in macular degeneration), flickering light is perceived both more intensely and at a lower frequency, as the fusion effect abates toward the periphery of the retina (Methling, 2012). This effect can be explored in more detail.
Moreover, efforts are being made to use the obtained results both to elevate the state of awareness concerning the critical lighting needs of people with visual impairment and to provide practical tools and instruments to support architects, urban planners, and lighting designers toward more inclusive trends in the visual design of the built environment.
Footnotes
Acknowledgments
The authors would like to specially thank Fritz Buser for his valuable professional input to the background and design of the experiments described in this paper. The authors also thank Helene Teufl and Josef Lechleitner for their support in the preparation of some of the data and visual material used in this paper. Ms. Teufl specially contributed to the review and corrections relevant to the final version of the paper. We gratefully thank all participants in the experiments for their kind collaboration and input. The research entailed in this paper benefited from the support by FFG (Austrian Research Promotion Agency; Project 844,320) and bmvit (Austrian Federal Ministry of Climate Action, Environment, Energy, Mobility, Innovation, and Technology), as well as projects ViDeA (Visual Design for All) and BaLiA (“Barrierefreies Licht für alle”: barrier-free light for all).
Declaration of Conflicting Interests
The author(s) declared no potential conflicts of interest with respect to the research, authorship, and/or publication of this article.
Funding
The author(s) disclosed receipt of the following financial support for the research, authorship, and/or publication of this article: The research entailed in this paper benefited from the support by FFG (Austrian Research Promotion Agency; Project 844,320) and bmvit (Austrian Federal Ministry of Climate Action, Environment, Energy, Mobility, Innovation, and Technology), as well as projects ViDeA (Visual Design for All) and BaLiA (“Barrierefreies Licht für alle”: barrier-free light for all).
