
Abstract

The most recent American Community Survey (ACS) data indicate that only 46.2% of people with visual impairments were employed in 2019 compared to 78.6% of people without disabilities (U.S. Census Bureau, 2020a). Yet, these percentages reflect only one point in time, corresponding to the week before the ACS participants completed the survey. The ACS and other large, national datasets provide considerable details about respondents’ employment status, including continuity of work. For example, ACS collects information about how many weeks people worked during the past year, and the Survey of Income and Program Participation (SIPP) collects monthly employment data over a 4-year period. However, these datasets have been minimally explored for people with visual impairments.
The concept of year-round work has received less research attention than full-time and part-time work. Year-round workers are individuals who worked 50–52 weeks during the reference year, and part-year workers worked less than 50 weeks of the reference year (U.S. Census Bureau, n.d.). The latest Current Population Survey (CPS) estimates indicate that 80.4% of employed adults in the general population worked year-round in 2019, including 82.4% of men and 78.2% of women (U.S. Bureau of Labor Statistics, 2020). According to Cornell University’s Annual Disability Status Report, people without disabilities had a substantially higher full-time/full-year employment rate in 2018 than those with disabilities (including visual impairments) (Erickson et al., 2020).
Our second focus in exploring the employment status of individuals with visual impairments is continuity of work, over one year and four years. Few studies have addressed continuity of work specifically for people with visual impairments. In a study based on data from 1976, Kirchner and Peterson (1980) found that people with visual impairments held fewer permanent jobs and worked fewer weeks per year than people in the general population. In another study, Kirchner et al. (1999) investigated short-term transitions to and from employment using data from the National Health Interview Survey on Disability; however, due to limitations of the dataset, they only examined employment at two points in time, about 1 year apart. They found that the most substantial transition from employment was evident among older adults (ages 55–69 years); 28% of older adults who were employed initially were not employed approximately one year later. No other researchers have assessed continuity of work for people with visual impairments. In this study, we will examine the following four research questions related to continuity of employment: 1. What percentage of men and women with visual impairments worked year-round versus part of the year? 2. Are people with visual impairments less likely than people without visual impairments to work year-round? 3. What is the average number of weeks worked by men and women with visual impairments? 4. Over a 4-year time frame, what percentage of people with visual impairments (a) worked continuously, (b) worked initially and then stopped, (c) didn’t work initially but did later, (d) worked on and off, and (e) did not ever work?
Method
Data Sources
ACS
The ACS is an annual nationwide survey administered by the U.S. Census Bureau, which provides population and housing information for the United States. The ACS collects data from approximately 3.5 million addresses throughout each year and uses pooled data to produce 1-year estimates for geographic areas with at least 65,000 people (U.S. Census Bureau, 2020b). The U.S. Census Bureau releases the ACS Public Use Microdata Sample (PUMS) every year to provide more detailed information at the person and housing-unit levels for data users to create custom estimates (U.S. Census Bureau, 2021).
We utilized the person-level file from the 2019 ACS 1-Year PUMS, which contains about two-thirds of the 2019 ACS records. We utilized data from civilian, non-institutionalized persons who were currently employed or had worked within the past 12 months and were between the ages of 18 and 65 years. People with visual impairments were identified based on “yes” responses to the question, “Is this person blind or does he/she have serious difficulty seeing even when wearing glasses?” The ACS sample for this study consisted of 1,502,474 individuals without visual impairments (weighted n = 158,421,448) and 19,460 individuals with visual impairments (weighted n = 2,031,140). The sample of individuals with visual impairments who worked at some time in the past year represents 49.6% of the civilian, non-institutionalized population between the ages of 18 and 65.
SIPP
The SIPP, also administered by the U.S. Census Bureau, is a nationwide longitudinal survey of the civilian, non-institutionalized population of the United States. SIPP covers numerous topics, including disability, health, employment, earnings, and other income. Each panel of SIPP includes data from the same households across several years to collect information and evaluate changes in households, families, and individuals over time.
For this study, we utilized the reengineered four-wave 2014 SIPP Panel, which includes data from a sample of approximately 53,000 households. Members of each household were interviewed once a year for four years beginning in February 2014 to collect information for the preceding calendar year. Hence, the 2014 SIPP panel represents calendar years 2013–2016 and covers 48 consecutive months. The study sample includes civilian, non-institutionalized adults with visual impairments, ages 18–65 years at Wave 1, who had all four waves of data. We identified individuals with visual impairments based on their responses to the question, “Is ... blind or does he/she have serious difficulty seeing?” The sample only includes individuals who consistently reported having a visual impairment in all waves. Our final sample consisted of 183 individuals with visual impairments (weighted n = 1,428,233).
Variables
We defined employment as having a job with an employer or being self-employed during the reference period for both data sources. We used ACS data to examine continuity of work across one year based on the number of weeks individuals worked during the previous 12 months. Year-round workers worked 50–52 weeks, and part-year workers worked less than 50 weeks of the year. We examined continuity of work with SIPP data based on individuals’ monthly employment status across 4 years. For each month, we classified individuals as employed if they had a job all weeks of the month. We placed people in one of five categories based on their monthly work status over the 4-year period: (a) worked continuously, (b) worked initially and then stopped, (c) didn’t work initially but did later, (d) worked on and off, and (e) did not ever work.
Data analysis
We addressed the first three research questions using ACS data and the fourth research question using SIPP data. We computed frequencies of year-round and part-year workers and the average number of weeks worked per year by gender and visual impairment. We conducted a Rao-Scott chi-square test to examine the association between year-round employment and visual impairment. We utilized confidence intervals to determine whether differences for weeks worked were significant (i.e., if the confidence intervals for two groups do not overlap, a significant difference exists between the groups). To evaluate long-term continuity of work, we used descriptive statistics to determine the percentage of people in each of the five work categories. Sampling weights were applied to generate nationally representative estimates. Replicate weights were used for the ACS data, and final panel weights and longitudinal replicate weights were used for the SIPP data. For all analyses, we utilized survey analysis procedures in SAS version 9.4.
Results
Sample demographic information.
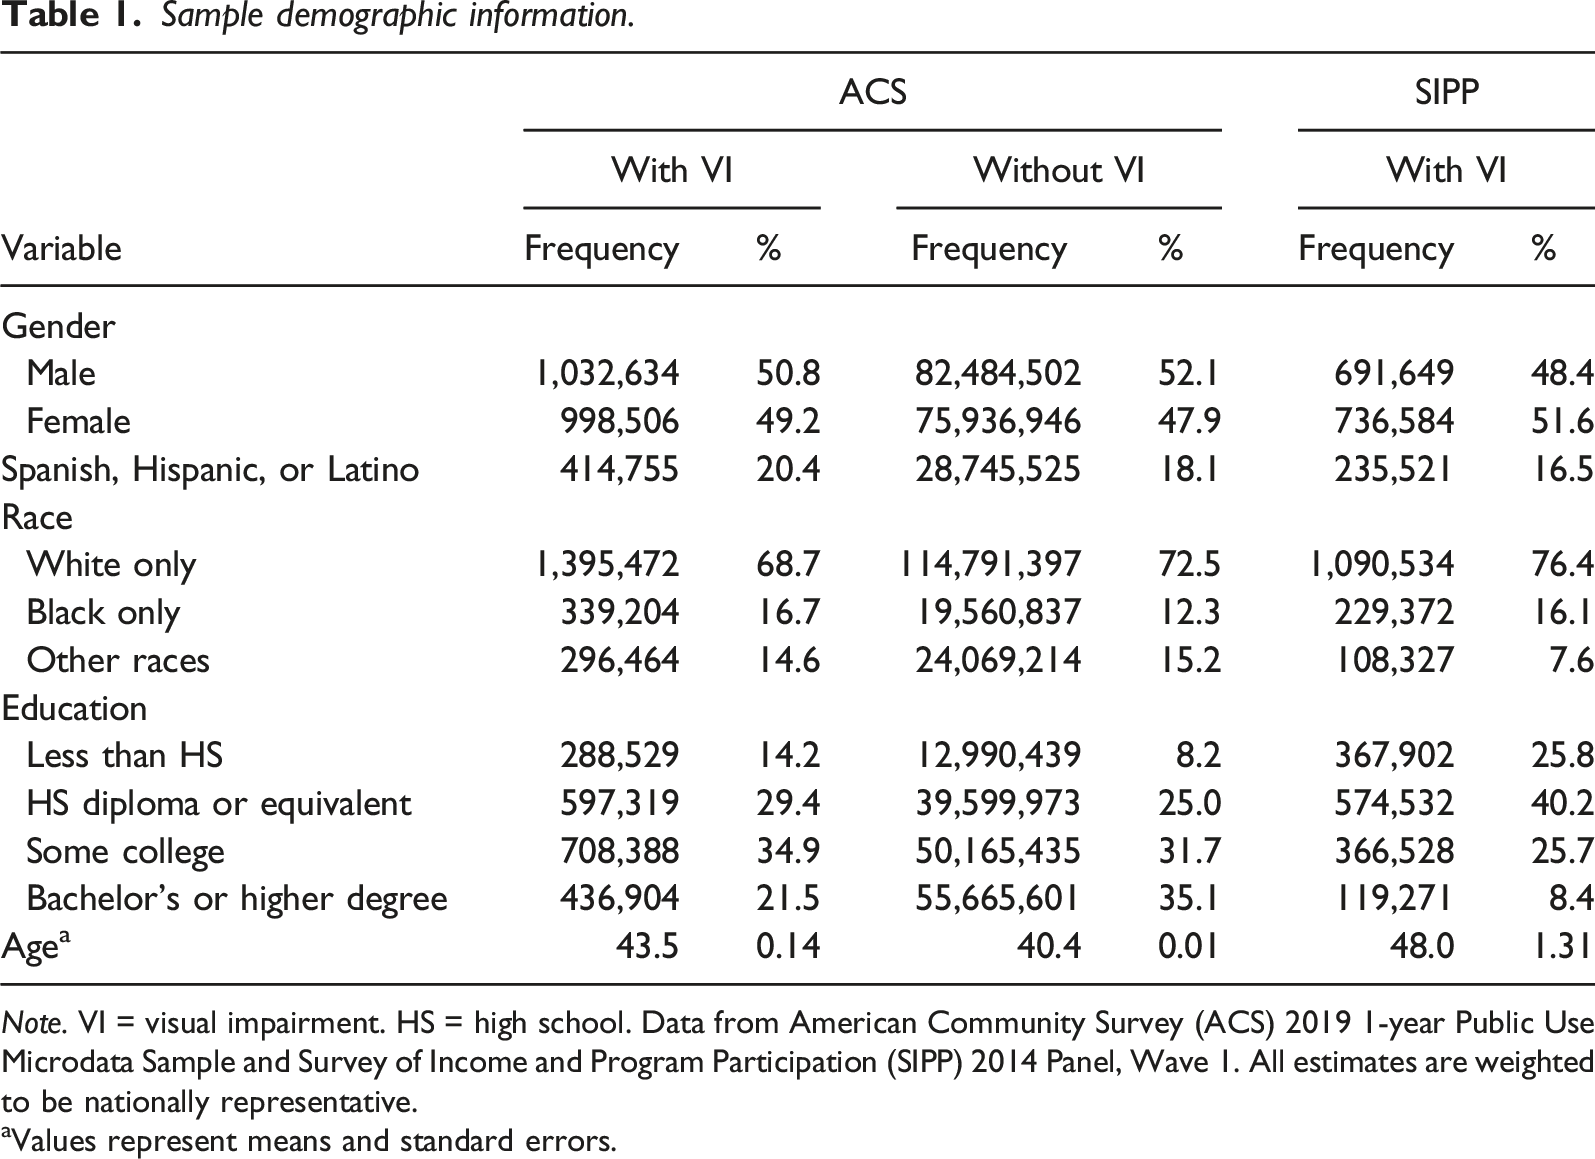
Note. VI = visual impairment. HS = high school. Data from American Community Survey (ACS) 2019 1-year Public Use Microdata Sample and Survey of Income and Program Participation (SIPP) 2014 Panel, Wave 1. All estimates are weighted to be nationally representative.
aValues represent means and standard errors.
Weighted estimates of year-round and part-year workers by gender and Visual Impairment (VI).

Note. Data from American Community Survey 2019 1-year Public Use Microdata Sample. All estimates are weighted to be nationally representative.
Weighted estimates of number of weeks worked in past year by Visual Impairment (VI).

Note. CI = confidence interval. Data from American Community Survey 2019 1-year Public Use Microdata Sample. All estimates are weighted to be nationally representative.
aWeighted n = 2,031,140.
bWeighted n = 158,421,448.
The percentage of people with visual impairments in each of the five work categories over four years of SIPP data was: (a) 17.3% (SE = 3.97) worked continuously, (b) 5.3% (SE = 1.69) worked initially and then stopped, (c) 6.5% (SE = 2.22) did not work initially but did later, (d) 12.1% (SE = 2.94) worked on and off, and (e) 58.8% (SE = 4.24) did not ever work.
Discussion
For this study, we used two national datasets—ACS and SIPP—to investigate continuity of employment for working-age adults with visual impairments. People with visual impairments were less likely to work year-round than people without visual impairments, although the difference between the groups was relatively small. There was a slightly larger gap for men with visual impairments versus men without visual impairments compared to women with visual impairments versus women without visual impairments. In both groups, women were less likely than men to work year-round, although for people with visual impairments, the gap between men and women was minimal (1.6 percentage points). On average, people with visual impairments worked more than two fewer weeks per year than people without visual impairments.
Current results are much different than the results of Kirchner and Peterson (1980), the only other published study that reported national data on weeks worked by people with visual impairments. They utilized 1976 data and documented much lower percentages of people with and without visual impairments who worked year-round (37% and 53%, respectively) than the 2019 ACS estimates in our study. Their results also illustrated a much larger gap between the groups in terms of year-round work.
When evaluating continuity of work for more than one year using SIPP data, we found that only a small percentage of people with visual impairments (about 1 in 6) worked continuously over a 4-year period. About a quarter of people transitioned into or out of employment, or both, leaving the majority of people with visual impairments who did not work at all during that time. Although these findings are certainly less favorable than the ACS findings, it is relevant to consider a key difference in the analysis samples for the two datasets. Our SIPP sample included people who were employed, unemployed, and out of the labor force, whereas our ACS sample was restricted to people who worked in the past year. Therefore, the ACS estimates did not account for individuals who were unemployed or out of the labor force during that time (i.e., approximately half of working-age adults with visual impairments). Additionally, the period for this longitudinal SIPP data (2013–2016) is closer to the Great Recession, when the economy was still recovering and had not reached pre-recession employment levels.
Several limitations are important to consider when interpreting these findings. First, both ACS and SIPP relied on self-report to identify people with visual impairments, and neither dataset provides details about severity of respondents’ visual impairments. Second, the 2014 SIPP panel contains a relatively small number of people with visual impairments who had four waves of data, leading to increased standard errors for our weighted estimates. Third, we used the most current SIPP panel data available at the time of this writing, but the fourth wave of data represents calendar year 2016, making it about 5 years old as of 2021. Despite these limitations, ACS and SIPP provide invaluable information about continuity of employment for nationally representative samples of people with visual impairments.
To summarize our findings, people with visual impairments were less likely than those without visual impairments to work year-round, and they worked an average of about two weeks less per year. This finding was consistent for both men and women with visual impairments compared to those without visual impairments, but there was a slightly larger gap among men. However, more than 73% of all groups worked year-round. Our findings are in stark contrast to Kirchner and Peterson’s (1980) findings, in which just over one-third of people with visual impairments worked year-round, a full 16 percentage points less than those without visual impairments. When evaluating continuity of employment over a longer period of time, findings were not as positive, with only 17.3% of people with visual impairments working during the entire 4-year period. Whether this low rate of continuous employment is associated with the economic recovery from the Great Recession is unknown. Additional research on this topic would clarify and extend our findings. Although it will be worthwhile to evaluate the next panel of SIPP data (2017–2020) for continuity of employment for people with visual impairments once it becomes available, that panel will include the impact of the COVID-19 pandemic.
Footnotes
Declaration of Conflicting Interests
The author(s) declared no potential conflicts of interest with respect to the research, authorship, and/or publication of this article.
Funding
The author(s) disclosed receipt of the following financial support for the research, authorship, and/or publication of this article: The contents of this manuscript were developed under a grant from the U.S. Department of Health and Human Services, NIDILRR grant 90RTEM0007. However, these contents do not necessarily represent the policy of the Department of Health and Human Services and should not indicate endorsement by the Federal Government.