
Abstract
Objectives:
To explore the correlation between the posterior airway space (PAS) in children with adenoid hypertrophy and the acoustic impedance test indicators, in order to provide a reference for clinical assessment of middle ear dysfunction in these children.
Methods:
A retrospective analysis was conducted on 160 children diagnosed with adenoid hypertrophy in the otolaryngology department of our hospital from January 2024 to January 2025. They were divided into 4 groups based on the PAS value (Grade 1: >12 mm, Grade 2: 8-12 mm, Grade 3: 5-8 mm, Grade 4: ≤5 mm), with 40 cases in each group. All underwent acoustic impedance testing, and the middle ear pressure, compliance, and distribution of the tympanogram were compared. Receiver operating characteristic (ROC) curve analysis was used to evaluate the diagnostic value.
Results:
There was no significant difference in the general data among the 4 groups (P > .05); as the PAS grade increased, the average absolute value of middle ear pressure increased (Grade 1: −3.48 ± 20.01 daPa, Grade 4: −124.03 ± 84.92 daPa, P < .001), the average compliance decreased (Grade 1: 0.68 ± 0.09 mL, Grade 4: 0.23 ± 0.04 mL, P < .001), the proportion of type B and C tympanogram increased (P < .01); the area under the curve (AUC) of type B and C tympanogram were 0.654 and 0.650 respectively (P < .01).
Conclusions:
PAS was significantly correlated with the impedance index. The smaller the PAS value (indicating a more severe degree of adenoid hypertrophy), the more obvious the middle ear dysfunction.
Introduction
Adenoid hypertrophy is a common disease in pediatric otolaryngology. 1 Its core pathological feature is abnormal hyperplasia of lymphoid tissue in the adenoids, which can lead to narrowing of the nasal pharyngeal airway and cause local symptoms such as nasal congestion, snoring, and mouth breathing. In severe cases, it can also affect the development of the jaws and the quality of sleep in children.2-4 What is more noteworthy is that adenoid hypertrophy often causes middle ear dysfunction by compressing the eustachian tube or blocking its ventilation function. 5 Secretory otitis media is the most common type, and if not intervened in time, it may lead to hearing loss in children and even affect language development.6,7 Therefore, accurately assessing the correlation between the degree of adenoid hypertrophy and the status of middle ear function is of great significance for clinical diagnosis and treatment decisions.
The value of posterior airway space (PAS) directly reflects the degree of obstruction of the nasopharyngeal airway and the eustachian tube orifice by the adenoid.8,9 Currently, PAS values are measured through X-ray in clinical practice.10,11 Meanwhile, the acoustic impedance test, as a classic non-invasive method for evaluating middle ear function, can precisely reflect the functional status of the middle ear transduction system by detecting middle ear pressure, middle ear compliance, and tympanogram types. 12 Abnormal middle ear pressure indicates an imbalance between the middle ear cavity and the external atmospheric pressure. 13 Decreased middle ear compliance reflects the reduced elasticity of the middle ear transduction structures. 14 The type B and C tympanograms correspond respectively to middle ear effusion and middle ear negative pressure, and both are typical manifestations of middle ear dysfunction. 15
At present, there are no studies on the relationship between PAS reduction and abnormal middle ear function. Therefore, this study retrospectively analyzed the PAS values and acoustic impedance test indicators of 160 children with adenoid hypertrophy. The aims were to clarify how middle ear pressure, middle ear compliance, and tympanogram types differ across PAS grades, verify the correlation between PAS and middle ear dysfunction, and explore the diagnostic value of acoustic impedance testing for middle ear dysfunction in these children. This provides a more reliable theoretical basis for clinical assessment and treatment planning.
Patients and Methods
Study Design and Ethical Declaration
This study was a retrospective cohort study, and the subjects were 160 children with adenoid hypertrophy who visited the otolaryngology department of our hospital from January 2024 to January 2025. The study conformed to the ethical guidelines of the Helsinki Declaration and was approved by the Research Ethics Committee of Jiaxing Hospital of Traditional Chinese Medicine (approval number: Jiaxing Hospital of Traditional Chinese Medicine Ethics Review 2023 Research No. 087-1). Before using the data from their medical records, each patient filled out a written informed consent form.
Study Population
All participants in this study were children with adenoid hypertrophy. The inclusion criteria are as follows: (1) aged 2-12 years (in the high-incidence age group of adenoid hyperplasia and able to cooperate with relevant examinations); (2) diagnosed with adenoid hypertrophy by nasal endoscopy, with diagnostic criteria referring to the Guidelines for Diagnosis and Treatment of Adenoid Hypertrophy in Children (2020 Edition) 16 ; (3) having complete clinical data, including PAS measurement data, tympanometry results, and general demographic information; (4) no history of treatments that may affect middle ear function (such as adenoidectomy or tympanocentesis) within 1 month before enrollment; (5) no acute inflammatory diseases such as acute upper respiratory tract infection or acute otitis media.
The exclusion criteria include: (1) comorbid with ear diseases such as tympanic membrane perforation, congenital ear malformation, or auditory nerve lesions; (2) comorbid with nasopharyngeal organic lesions such as nasopharyngeal tumor, nasal polyps, or nasal septum deviation; (3) comorbid with systemic diseases such as immunodeficiency, coagulation disorders, or severe cardiopulmonary diseases; (4) history of ear surgery or long-term use of ototoxic drugs; (5) incomplete or unreliable tympanometry or PAS measurement data (eg, data deviation caused by excessive crying of the child during the examination).
Grouping Method
All children were divided into 4 groups with 40 cases in each group, based on the PAS values measured via a standardized lateral cephalometric radiograph (X-ray). The grouping criteria are as follows: Grade 1 Group (mild adenoid hypertrophy with mild airway obstruction): PAS > 12 mm; Grade 2 Group (moderate adenoid hypertrophy with certain airway obstruction): PAS ranging from 8 mm to 12 mm; Grade 3 Group (severe adenoid hypertrophy with obvious airway obstruction): PAS ranging from 5 mm to 8 mm; Grade 4 Group (extremely severe adenoid hypertrophy with severe airway obstruction): PAS ≤ 5 mm.
Research Contents
Collection of General Information
General information of the children was extracted from the hospital’s electronic medical record system, which included 2 main categories: demographic information and clinical symptoms. The demographic information covered age (divided into 3 intervals: 2-5 years old, 6-9 years old, and 10-12 years old) and gender; the clinical symptoms included initial symptoms (including hearing impairment, mouth breathing, nasal congestion, snoring, and other symptoms), and the number of cases with each symptom in different groups was recorded. 17
PAS Measurement
All patients underwent a standardized lateral cephalometric radiograph (X-ray) of the nasopharynx. Radiographs were obtained with the patient in a natural standing position, head stabilized, and maintaining a neutral posture with lips closed. The PAS was measured on the digital lateral radiograph using ImageJ software (version 1.8.0, National Institutes of Health, Bethesda, MA, USA). It was defined as the shortest anteroposterior distance between the adenoid and posterior pharyngeal wall. All measurements were performed independently by 2 experienced radiologists who were blinded to the endoscopic grading and tympanometry results. The average of the 2 measurements was used for the final analysis. Inter-observer reliability was excellent, with an intraclass correlation coefficient of >.90.
Acoustic Impedance Test
This study was conducted using the Danish Madsen Zodiac 901-type acoustic impedance instrument for testing. 14 Before the test, professional nurses cleaned the children’s external ear canals and removed cerumen to ensure the ear canals were unobstructed and free of foreign objects. During the test, the children were instructed to remain quiet and keep their heads fixed to avoid interference from actions such as swallowing and crying. The test indicators included 3 items: First, middle ear pressure (unit: daPa), which recorded the average, minimum and maximum middle ear pressure (reflecting the pressure difference between the middle ear cavity and the external atmospheric pressure); second, middle ear compliance (unit: mL), which recorded the average, minimum and maximum compliance (reflecting the elasticity of the middle ear transduction system including the eardrum and ossicular chain); third, tympanogram, which was classified into type A (normal, with no abnormality in middle ear function), type B (middle ear effusion), and type C (middle ear negative pressure) based on the shape of the pressure-compliance curve, and the number and proportion of each type of tympanogram were recorded. Each child underwent 2 tests, and the data from the stable test (with stable results) was selected as the final result. All tests were conducted by the same technician who had received professional training and had more than 3 years of experience in otolaryngological examinations.
Receiver Operating Characteristic Curve
Taking the type B or type C tympanogram as the positive outcome of middle ear functional abnormalities, a Receiver Operating Characteristic (ROC) curve was plotted, and the area under the curve (AUC), sensitivity, specificity, and Youden’ index (Youden index = sensitivity + specificity−1) were calculated. The optimal cut-off value was determined. The AUC value range is 0.5 to 1.0.
Statistical Analysis
Statistical analysis was conducted using SPSS 20.0. 18 Normality was tested using the Kolmogorov-Smirnov test. Count data were compared using the χ2 test. Measurement data that followed a normal distribution were expressed as mean ± standard deviation (SD), and comparisons among multiple groups were performed using one-way analysis of variance. When the variances were not equal, the Welch test was used. Rank data were analyzed using the rank sum test. The diagnostic value of each parameter was analyzed using the AUC of ROC. A difference was considered statistically significant if P < .05.
Results
Comparison of General Data of the 4 Groups of Children
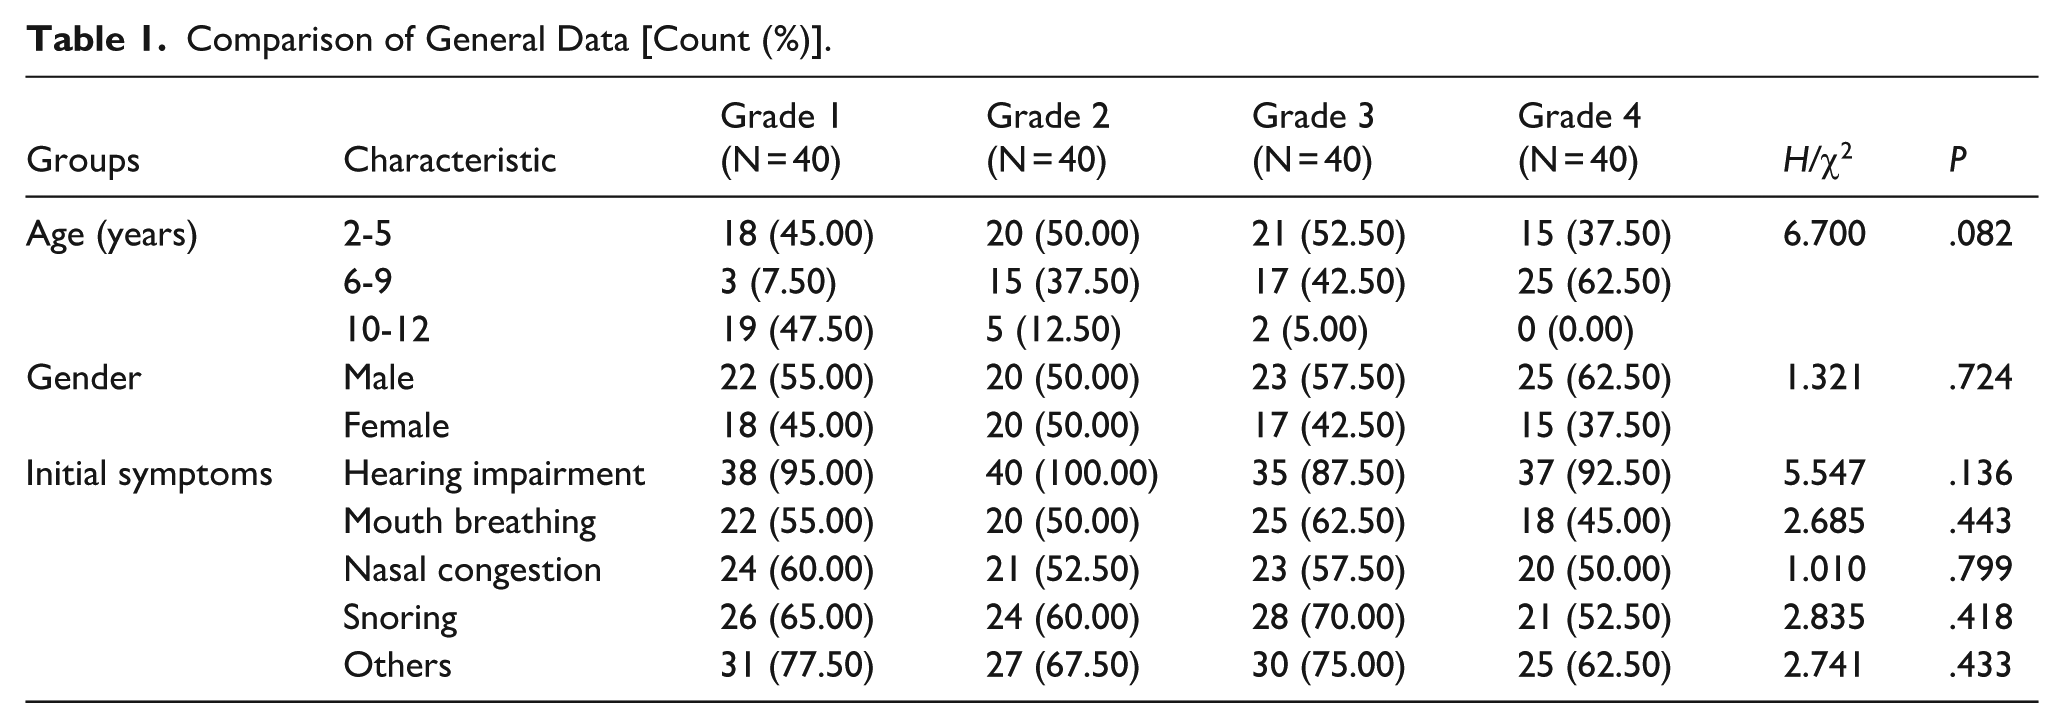
There were no statistically significant differences in the age distribution (2-5 years old, 6-9 years old, 10-12 years old), gender, and the composition ratio of the initial symptoms (hearing impairment, mouth breathing, nasal congestion, snoring, others) among the 4 groups of children (Table 1, P > .05).
Comparison of General Data [Count (%)].
Comparison of Middle Ear Pressure Among Children with Different PAS Grades
As the PAS grading increases (PAS value decreases), the average absolute middle ear pressure of the children showed a gradually increasing trend (Table 2, Figure 1). The average middle ear pressure of the grade 1 group was (−3.48 ± 20.01) daPa, that of the grade 2 group was (−17.08 ± 30.69) daPa, that of the grade 3 group was (−51.50 ± 54.29) daPa, and that of the grade 4 group was (−124.03 ± 84.92) daPa (Table 2). The comparison of the average middle ear pressure among the 4 groups showed a statistically significant difference (Table 2, P < .001). Furthermore, the minimum/maximum middle ear pressure of the grade 1 group was −40/30 daPa, that of the grade 2 group was −105/14 daPa, that of the grade 3 group was −223/42 daPa, and that of the grade 4 group was −280/53 daPa (Table 2).
Comparison of Middle Ear Pressure in Different Degrees of PAS (mean ± SD).

Abbreviations: PAS, Posterior Airway Space; SD, Standard deviation.
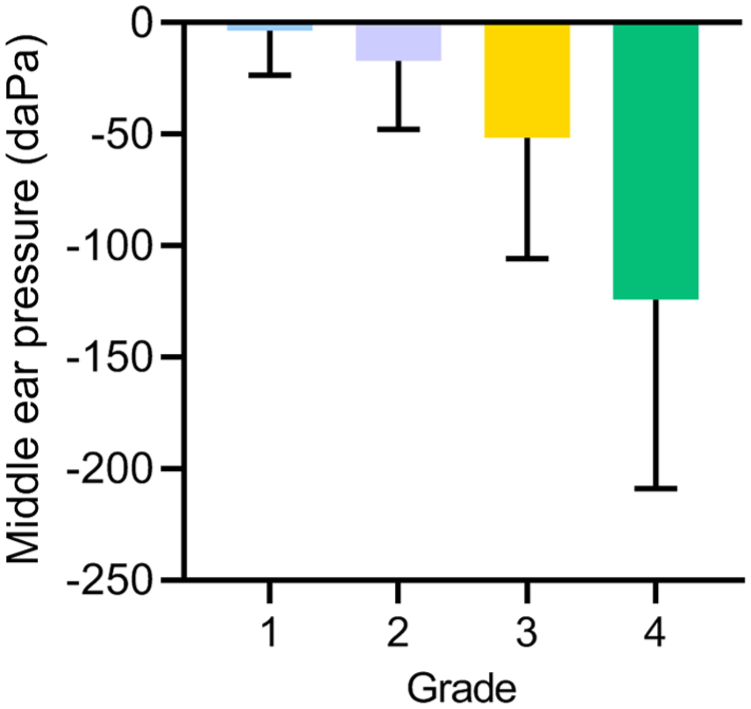
Comparison of average middle ear pressure among children with different PAS grades in adenoid hypertrophy. PAS, Posterior airway space.
Comparison of Middle Ear Compliance Among Children with Different PAS Grades
As the PAS grading increases (PAS value decreases), the average middle ear compliance of the children showed a gradually decreasing trend (Table 3, Figure 2). The average compliance of the grade 1 group was (0.68 ± 0.09) mL, that of the grade 2 group was (0.41 ± 0.08) mL, that of the grade 3 group was (0.34 ± 0.07) mL, and that of the grade 4 group was (0.23 ± 0.04) mL (Table 3). The comparison of the average middle ear compliance among the 4 groups showed statistically significant differences (Table 3, P < .001). The minimum middle ear compliance of the 1 to 4 grade groups was 0.51, 0.19, 0.22, and 0.13 mL, respectively, and the maximum middle ear compliance was 0.87, 0.64, 0.53, and 0.30 mL, respectively (Table 3).
Comparison of Average Compliance Values of Different Degrees of PAS (mean ± SD).

Abbreviations: PAS, Posterior airway space; SD, Standard deviation.
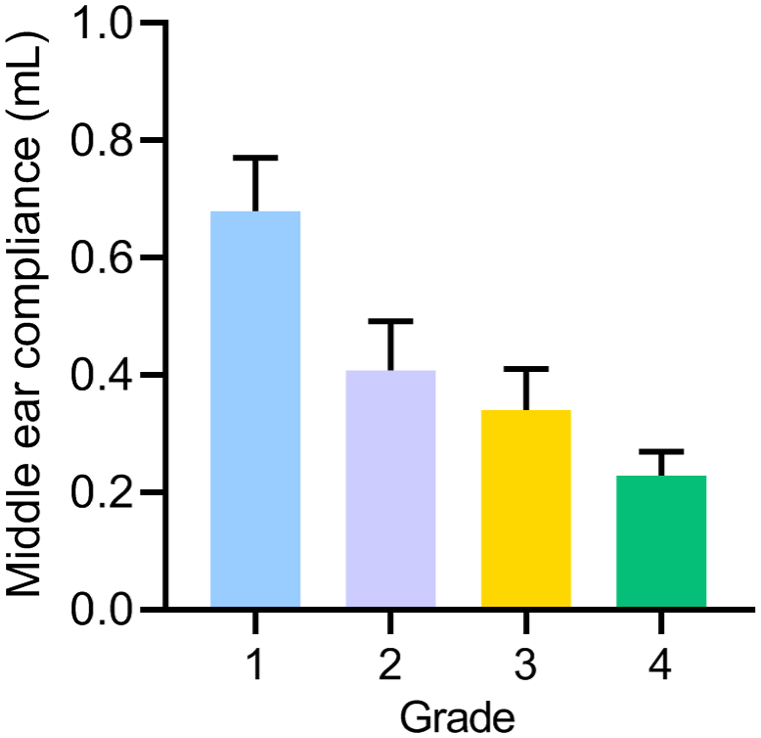
Comparison of average middle ear compliance among children with different PAS grades in adenoid hypertrophy. PAS, Posterior airway space.
Comparison of Tympanogram Distribution in Children with Different PAS Grades
As the PAS grading increases (PAS value decreases), the proportions of type B and type C tympanogram patterns showed a gradually increasing trend (Table 4, Figure 3). In the grade 1 group, the proportion of type B tympanogram pattern was 20.00% (8/40), and the proportion of type C was 37.50% (15/40); in the grade 2 group, the proportion of type B was 40.00% (16/40), and the proportion of type C was 57.50% (23/40); in the grade 3 group, the proportion of type B was 50.00% (20/40), and the proportion of type C was 70.00% (28/40); in the grade 4 group, the proportion of type B was 62.50% (25/40), and the proportion of type C was 75.00% (30/40) (Table 4). The comparison of the distribution of type B tympanogram patterns among the 4 groups of children (P = .001), and the comparison of the distribution of type C tympanogram patterns (P = .003) showed statistically significant differences (Table 4).
Distribution of Different Degrees of PAS Tympanogram [Count (%)].

Abbreviation: PAS, Posterior airway space.
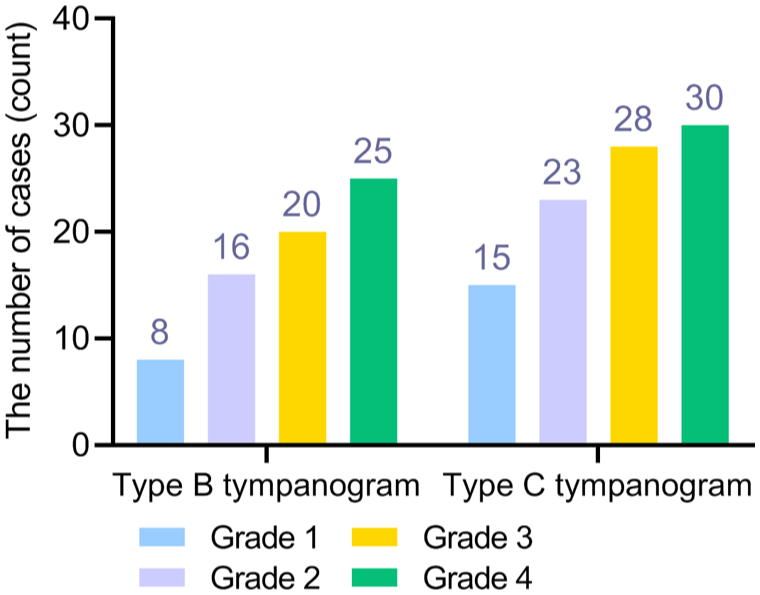
Distribution of tympanogram types among children with different PAS grades in adenoid hypertrophy. PAS, Posterior airway space.
ROC Curve Analysis for Diagnosing Middle Ear Functional Abnormalities
This section conducted ROC curve analysis to evaluate the diagnostic value of type B and type C tympanograms for abnormal middle ear function, with type B or type C tympanograms defined as the positive outcome indicating abnormal middle ear function. The results showed that for type B tympanograms, the AUC was 0.654 (P = .004), with an optimal cut-off value of 0.500, a sensitivity of 0.800, a specificity of 0.508, and a Youden’s Index of 0.308 (Table 5, Figure 4). For type C tympanograms, the AUC was 0.650 (P = .005), with an optimal cut-off value of 0.500, a sensitivity of 0.625, a specificity of 0.675, and a Youden’s Index of 0.300 (Table 5, Figure 4).
Parameters of ROC Curve Results.

Abbreviations: AUC, Area under the curve; CI, Confidence interval; ROC, Receiver operating characteristic.
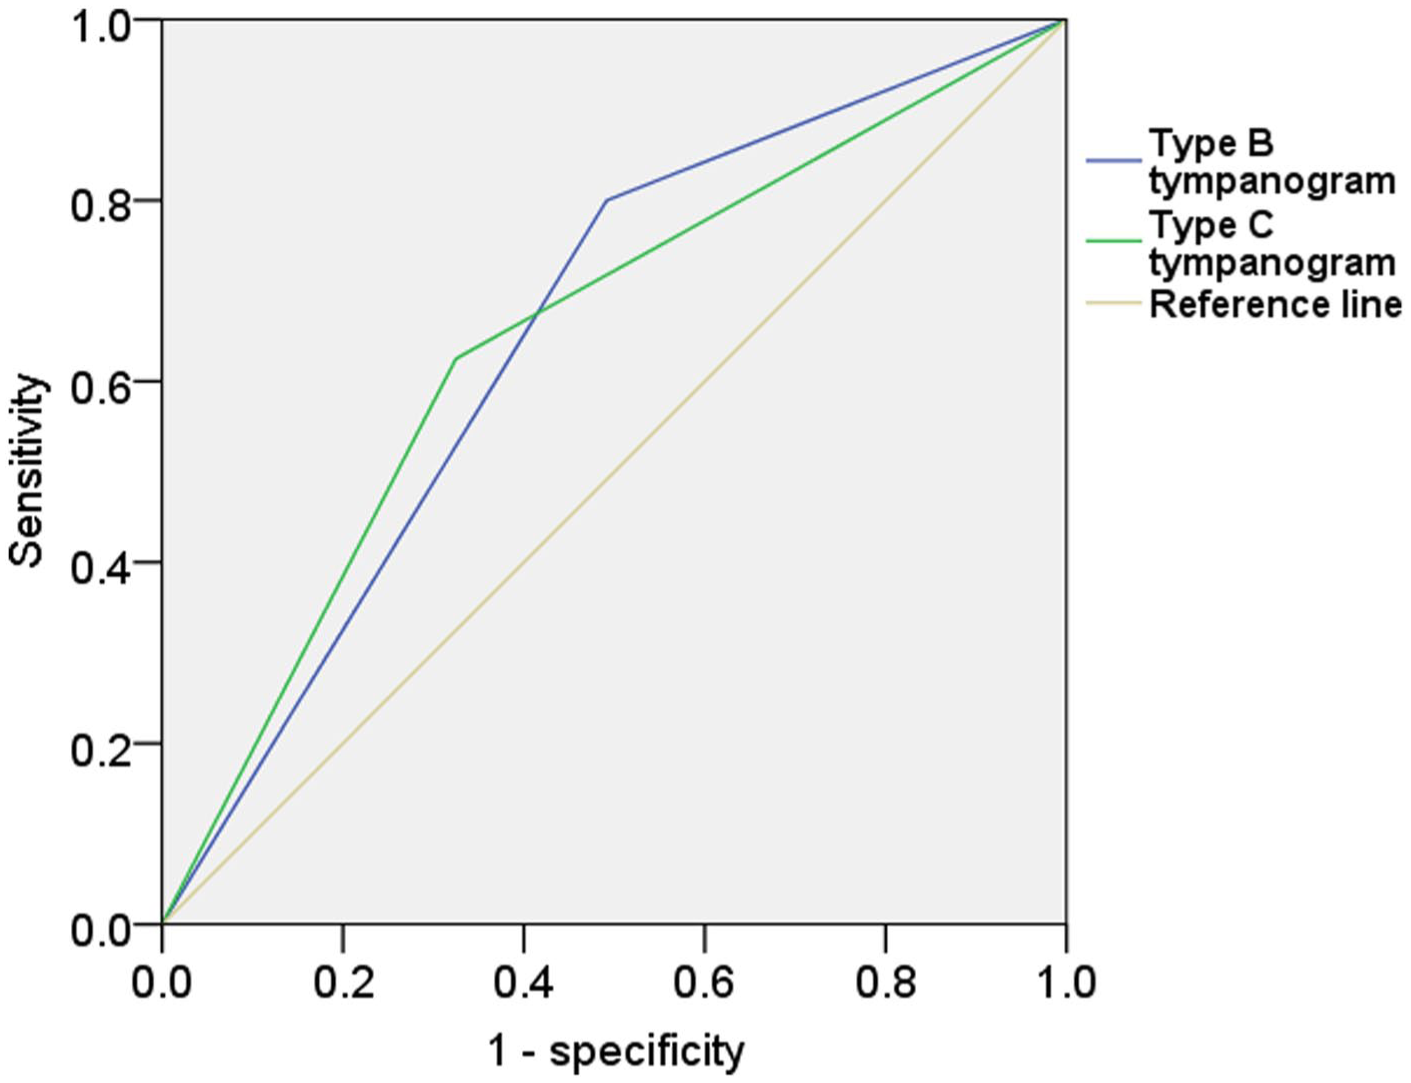
ROC curves of acoustic impedance indices for diagnosing middle ear dysfunction in children with adenoid hypertrophy. ROC, Receiver operating characteristic; AUC, Area under the curve.
Discussion
This study analyzed the clinical data of 160 children with adenoid hypertrophy and deeply explored the correlation between the PAS (defined as the shortest anteroposterior distance between the adenoid and posterior pharyngeal wall) and the acoustic impedance test indicators. To ensure clinical relevance, patients were first stratified into 4 severity groups (Grade 1-4) based on the gold-standard assessment: nasal endoscopic evaluation of choanal obstruction (PAS value (Grade 1: >12 mm, Grade 2: 8-12 mm, Grade 3: 5-8 mm, Grade 4: ≤5 mm). It also verified the significant association between the two, providing an objective basis for clinical assessment.
The adenoids, as an important lymphoid tissue in the nasopharynx, their abnormal hyperplasia mainly affect the middle ear function through dysfunction of the eustachian tube.19,20 The eustachian tube orifice is located on the lateral wall of the nasopharynx. When the adenoids undergo excessive hyperplasia, on the 1 hand, it will directly compress the eustachian tube orifice, resulting in restricted opening; on the other hand, the hyperplastic tissue may trigger local inflammatory reactions, further aggravating the obstruction of ventilation and drainage of the eustachian tube.13,21 In this study, as the PAS grading increased (the PAS value decreased and the degree of adenoid hypertrophy worsened), the average absolute value of middle ear pressure in the children showed a significant upward trend. Previous studies showed that enlarged adenoids are significantly correlated with negative middle ear pressure and decreased compliance, both of which contribute to the development of otitis media with effusion. 14 After the ventilation function of the eustachian tube is impaired, the air in the middle ear cavity is continuously absorbed by the mucosa, gradually forming a negative pressure, and ultimately resulting in an increase in the absolute value of middle ear pressure. 22 At the same time, the average middle ear compliance decreased progressively as the PAS grading increased, suggesting that the negative pressure in the middle ear further led to congestion and edema of the middle ear mucosa, accumulation of secretions, and a reduction in the elasticity of the sound-conducting structures such as the eardrum and ossicular chain, ultimately affecting the compliance of the middle ear. 23 This is consistent with the actual observation conclusion in clinical practice that “children with severe adenoid hypertrophy are more prone to concurrent secretory otitis media,” 24 and the degree of adenoid hypertrophy is also an influencing factor for the recurrence of secretory otitis media after adenoidectomy. 25
The tympanogram is an important component of the acoustic immittance test. The type B is a typical graph for middle ear effusion, while type C indicates negative pressure in the middle ear. 26 This study found that as the PAS grade increased, the proportions of type B and type C tympanograms both showed a significant increase trend. This quantitative result further clarified the strength of the association between PAS and middle ear functional abnormalities. The smaller the PAS, the higher the risk of middle ear effusion or negative pressure. This provides a direct reference for clinicians to predict the middle ear functional status through PAS. Furthermore, the ROC curve analysis revealed that the AUC for PAS in predicting a type B or type C tympanogram were 0.650 and 0.654, respectively. According to conventional interpretive criteria for diagnostic accuracy, these AUC values indicate poor discriminative ability. Therefore, while a significant correlation exists, the PAS measurement alone, at the derived cut-off, shows limited utility as a standalone diagnostic tool for middle ear dysfunction in this cohort.
This study has certain limitations. On 1 hand, it is a retrospective study design, and due to the incomplete integrity of the original clinical data records, factors such as the duration of symptoms, whether there is allergic rhinitis or sinusitis that may affect the middle ear function were not included, which may cause a slight interference to the results. On the other hand, no long-term follow-up was conducted, making it impossible to clarify the association between PAS changes and the prognosis of middle ear dysfunction, and it was also difficult to assess the impact of intervention measures on the relationship between the two.
In conclusion, the PAS in children with adenoid hypertrophy is significantly correlated with the acoustic impedance test indicators (middle ear pressure, middle ear compliance, and tympanogram type). Moreover, the smaller the PAS (indicating a more severe degree of adenoid hypertrophy), the more obvious the middle ear dysfunction. However, its standalone diagnostic accuracy for identifying abnormal tympanograms (type B or C) in our study was limited (AUC ~0.65).
Footnotes
Ethical Considerations
The study conformed to the ethical guidelines of the Helsinki Declaration and was approved by the Research Ethics Committee of Jiaxing Hospital of Traditional Chinese Medicine (approval number: Jiaxing Hospital of Traditional Chinese Medicine Ethics Review 2023 Research No. 087-1).
Author Contributions
Conceptualization: Xiong Qian and Kai Chen; Data Curation: Yongcai Weng and Shufeng Li; Writing – Original Draft Preparation: all authors; Writing – Review & Editing: all authors.
Funding
The authors disclosed receipt of the following financial support for the research, authorship, and/or publication of this article: This work was supported by The Zhejiang Traditional Chinese Medicine Science and Technology Project (Project No. 2024ZL1050) and supported by The Zhejiang Traditional Chinese Medicine Science and Technology Project (Project No. 2023ZF169).
Declaration of Conflicting Interests
The authors declared no potential conflicts of interest with respect to the research, authorship, and/or publication of this article.
Data Availability Statement
The analyzed data sets generated during the study are available from the corresponding author on reasonable request.*