



Abstract
How stable are individual differences in self-esteem? We examined the time-dependent decay of rank-order stability of self-esteem and tested whether stability asymptotically approaches zero or a nonzero value across long test–retest intervals. Analyses were based on 6 assessments across a 29-year period of a sample of 3,180 individuals aged 14 to 102 years. The results indicated that, as test–retest intervals increased, stability exponentially decayed and asymptotically approached a nonzero value (estimated as .43). The exponential decay function explained a large proportion of variance in observed stability coefficients, provided a better fit than alternative functions, and held across gender and for all age groups from adolescence to old age. Moreover, structural equation modeling of the individual-level data suggested that a perfectly stable trait component underlies stability of self-esteem. The findings suggest that the stability of self-esteem is relatively large, even across very long periods, and that self-esteem is a trait-like characteristic.
If an adolescent has high self-esteem, is he or she likely to still be self-confident some years later when he or she goes to college? If a 25-year-old woman suffers from low self-esteem, is she likely to still have self-esteem issues when she turns 40? Is it even possible to predict self-esteem at age 70, when you know whether an individual had high or low self-esteem in young adulthood? The question of how stable self-esteem is has been investigated in previous studies (e.g., Alsaker & Olweus, 1992; Block & Robins, 1993; Marsh, Craven, & Debus, 1998; Trzesniewski, Donnellan, & Robins, 2003). However, earlier research did not systematically examine whether self-esteem—which is defined as “a person’s appraisal of his or her value” (Leary & Baumeister, 2000, p. 2)—can be predicted across very long periods and whether at long test–retest intervals stability approaches zero or a nonzero value. Moreover, previous research did not test which mathematical function describes the time-dependent decline of self-esteem stability. The present research addresses this gap in the literature, using data from a large sample of individuals aged 14 to 102 years who were assessed multiple times over a period of 29 years.
Therefore, this research focuses on the rank-order stability of self-esteem, which provides information on whether individual differences in self-esteem are maintained, and consequently can be predicted, across time (Caspi, Roberts, & Shiner, 2005; B. W. Roberts, Wood, & Caspi, 2008). Rank-order stability can be assessed by using test–retest correlations. Thus, a rank-order stability of 1 would indicate perfect stability and a stability of 0 would indicate complete absence of stability; typically, however, stability is a matter of degree, indicated by some value between 0 and 1. It should be noted that other concepts of stability exist, most importantly the concept of mean-level stability (Caspi et al., 2005; B. W. Roberts et al., 2008). Indices of mean-level stability capture whether populations or samples as a whole change or remain the same on the average level of a psychological construct. The mean-level stability of self-esteem has been examined in many previous studies, overall suggesting that self-esteem systematically changes across the life span (Erol & Orth, 2011; Orth, Robins, & Widaman, 2012; Orth, Trzesniewski, & Robins, 2010; Robins, Trzesniewski, Gosling, & Potter, 2002; Shaw, Liang, & Krause, 2010). Although mean-level stability provides important information that helps understand the development of self-esteem, mean-level stability is mute with regard to the question of whether the relative standing (i.e., the rank-order position) of individuals is stable over time. Moreover, it is important to note that the concepts of rank-order stability and mean-level stability are theoretically and statistically distinct from each other (see Robins, Fraley, Roberts, & Trzesniewski, 2001).
The Time-Dependent Decline of Self-Esteem Stability
As early as 1890, William James alluded to the stability of self-esteem by noting that “there is a certain average tone of self-feeling which each one of us carries about with him” (James, 1890, p. 306). In fact, previous research suggests that self-esteem exhibits considerable rank-order stability in childhood (e.g., Alsaker & Olweus, 1992; Marsh et al., 1998), adolescence (e.g., Block & Robins, 1993; Cairns, McWhirter, Duffy, & Barry, 1990; O’Malley & Bachman, 1983), and young adulthood (Donnellan, Trzesniewski, Conger, & Conger, 2007; Neyer & Asendorpf, 2001; R. E. L. Roberts & Bengtson, 1996). In these studies, test–retest correlations ranged from .34 to .70. Moreover, Trzesniewski et al. (2003) examined the stability of self-esteem across the life span, by meta-analysis of 50 primary studies and by secondary analysis of four large national probability samples. The results of both analyses suggest that self-esteem stability—controlling for time interval, which on average was about 3 years—shows a curvilinear trajectory across the life span; the highest estimates emerged for young and middle adulthood (disattenuated correlations at about .70), whereas the stability was lower in childhood, adolescence, and in old age (disattenuated correlations at about .50). Trzesniewski et al. tested for moderators of self-esteem stability and found that the pattern of results held across gender, ethnicity, self-esteem measure, and nationality.
However, although a test–retest correlation based on two waves of data provides some information about the stability of a construct, Fraley and Roberts (2005) demonstrated that “the common assumption that the stability of a psychological variable is reflected in the size of any one test-retest correlation is incomplete and potentially misleading” (p. 62). The reason is that the stability of a construct may depend on the length of the time interval between the two assessments. For example, the test–retest correlation may be relatively high when the time interval is relatively short (e.g., a few months), but the correlation may be much lower when the interval between assessments is longer (e.g., several years or decades). Therefore, a complete understanding of the stability of a construct requires information about how stability coefficients are patterned across test–retest intervals of different length (Fraley, 2002; Fraley & Roberts, 2005; Fraley, Vicary, Brumbaugh, & Roisman, 2011).
Previous research has repeatedly shown that the stability of most psychological constructs decreases as the test–retest interval increases (e.g., Ardelt, 2000; Conley, 1984a; Ferguson, 2010; Fraley & Roberts, 2005; B. W. Roberts & DelVecchio, 2000; Terracciano, Costa, & McCrae, 2006). An important question, however, is whether the stability of a construct decreases to zero when the interval is very long, or whether stability levels off at some positive (i.e., nonzero) value, even when the test–retest interval becomes very long. The latter finding would be consistent with the notion that a perfectly stable trait component underlies the stability of the construct.
With regard to self-esteem, previous research found that stability decreases with increasing test–retest intervals (Alsaker & Olweus, 1992; Trzesniewski et al., 2003). In Trzesniewski et al.’s (2003) meta-analysis, stability was significantly predicted (with a negative regression coefficient) by the length of the test–retest interval. Similarly, Alsaker and Olweus (1992) examined the stability of self-esteem as a function of test–retest interval and found that stability decreased when the test–retest interval increased. However, a limitation of the analyses conducted by Trzesniewski et al. and Alsaker and Olweus is that only linear models of the relation between test–retest interval and self-esteem stability were tested. Moreover, few of the studies included in Trzesniewski et al. used long intervals (e.g., 10 years or longer) and Alsaker and Olweus examined intervals no longer than 5 years. Consequently, these studies do not allow for conclusions about which mathematical function best describes the time-dependent decline of self-esteem stability and whether stability approaches zero when the test–retest interval becomes very long.
The Present Research
The first goal of the present research was to examine the time-dependent decay of self-esteem stability. As discussed above, longitudinal studies suggest that the stability of personality variables typically decreases as the interval between assessments increases (Conley, 1984a; B. W. Roberts & DelVecchio, 2000). We tested for which mathematical function describes the time-dependent decay of stability coefficients, and we also tested whether stability asymptotically approaches zero or a nonzero value across long test–retest intervals. We hypothesized that an exponential decay function provides the best fit to the data. We also examined whether gender and age moderate the decay of stability.
The second goal of the present research was to test, by using structural equation modeling of the individual-level data, whether a perfectly stable trait component is needed to explain the stability of self-esteem. These analyses were based on Kenny and Zautra’s (2001) STARTS model (see also Kenny & Zautra, 1995). If the analyses yield evidence that a stable trait underlies the long-term stability of self-esteem, this may provide an explanation for a nonzero asymptote of self-esteem stability.
The present research extends previous studies in several ways. First, the longitudinal study design covered 29 years, which allowed examining stability across a very long period. Second, the analyses include six waves of data, providing for stability estimates based on multiple test–retest intervals of different length and, consequently, many more data points compared with the two-wave studies that are common in the literature. Third, we tested for which mathematical function describes the time-dependent decline of self-esteem stability and whether at long test–retest intervals stability of self-esteem approaches zero or a nonzero value; no previous study has addressed these questions. Fourth, we used data from a large sample with a broad age range from adolescence to old age, which enabled us to draw more precise and generalizable conclusions about the pattern of long-term stability of self-esteem.
Method
The data come from the Longitudinal Study of Generations (LSG; Bengtson, 2009). The LSG includes members of families that were randomly drawn from a subscriber list of about 840,000 members of a health maintenance organization in Southern California. Although the sample was originally recruited in Southern California, at recent waves, more than half of the sample lived outside the region in other parts of California, in other states of the United States or abroad, due to residential mobility (Bengtson, Biblarz, & Roberts, 2002).
Participants were assessed in 1971, 1985, 1988, 1991, 1994, 1997, and 2000. Although the five most recent waves included the full 10-item Rosenberg Self-Esteem Scale (RSE; Rosenberg, 1965), in 1971 only 8 items and in 1985 only 1 item was included. We therefore decided to examine the data from 1971, 1988, 1991, 1994, 1997, and 2000—using the 8-item 1971 version across all waves (for further information on the measure see below)—but not to examine the 1985 data. We excluded any participant whose age was unknown or who did not provide data on self-esteem at any of the six waves.
Participants
The sample consisted of 3,180 individuals (54% female). In 1971, the mean age was 40.3 years (SD = 19.6). Across Waves 1 to 6, the participants’ age ranged from 14 to 102 years. Of the participants, 91% were Caucasian, 3% were Hispanic, 1% were African American, 1% were Native American, and 4% were of other ethnicity. Because of the low frequencies of ethnicities other than Caucasian, we did not examine ethnic differences. Data on study variables were available for 1,550 individuals in 1971; for 1,467 individuals in 1988; for 1,451 individuals in 1991; for 1,686 individuals in 1994; for 1,712 in 1997; and for 1,945 individuals in 2000. To investigate the potential impact of attrition, we compared individuals who did and did not participate in the most recent wave of data collection (2000) on self-esteem assessed at the five preceding waves (1971, 1988, 1991, 1994, and 1997). Participants who dropped out (versus those who did not) reported slightly lower self-esteem in 1991 (Ms = 3.46 vs. 3.53, respectively; d = −0.15) and 1994 (Ms = 3.25 vs. 3.33, respectively; d = −0.18); differences in 1971, 1988, and 1997 were nonsignificant. Thus, differences in self-esteem were small to nonsignificant, suggesting that nonrepresentativeness because of attrition was not a serious concern in the present study.
Measure of Self-Esteem
Self-esteem was assessed with the RSE (Rosenberg, 1965), which is the most commonly used and well-validated measure of self-esteem (Robins, Hendin, & Trzesniewski, 2001). As mentioned above, self-esteem was assessed with an 8-item version of the scale, because the 1971 assessment did not include the full 10-item RSE. However, at each wave from 1988 to 2000, the 8-item RSE correlated at .98 or higher with the full 10-item RSE. The items included in the 8-item RSE were as follows: “I feel that I’m a person of worth, at least on an equal basis with others”; “All in all, I am inclined to feel that I am a failure” (reverse-scored); “I am able to do things as well as most other people”; “I feel that I do not have much to be proud of” (reverse-scored); “I take a positive attitude toward myself”; “On the whole, I am satisfied with myself”; “I wish I could have more respect for myself” (reverse-scored); and “At times I think I am no good at all” (reverse-scored). Responses were measured with a 4-point scale, ranging from 1 (strongly disagree) to 4 (strongly agree). Table 1 shows means, standard deviations, alpha reliabilities, and test–retest correlations of self-esteem across waves.
Means, Standard Deviations, Alpha Reliabilities, and Test–Retest Correlations of Self-Esteem Across Waves.
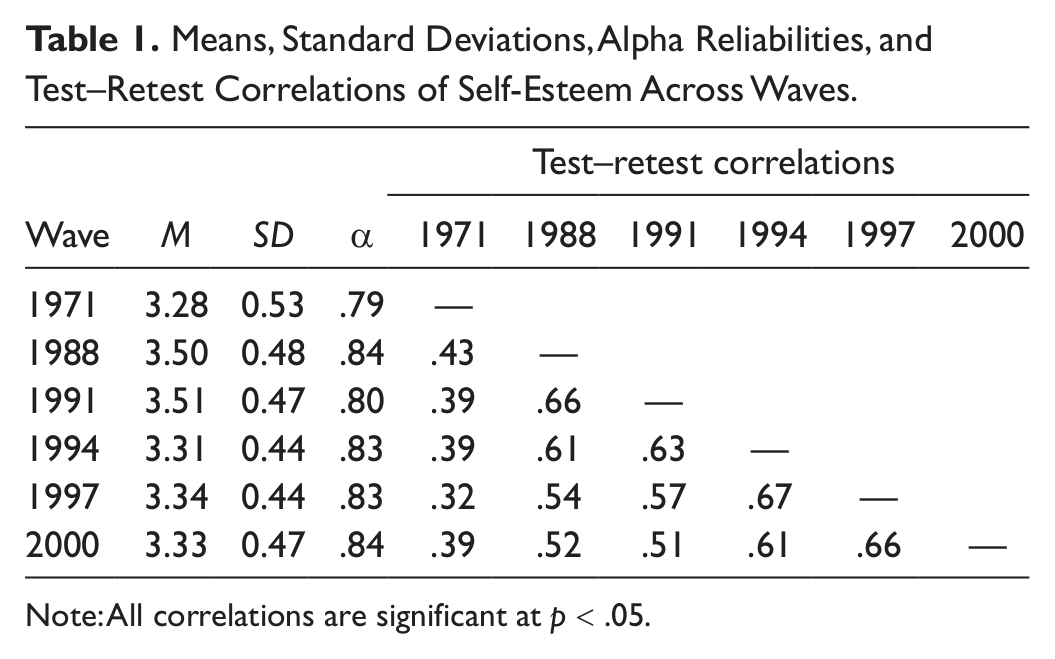
Note: All correlations are significant at p < .05.
Statistical Analyses
In the first part of the analyses, we examined the time-dependent decay of rank-order stability coefficients using nonlinear regression analysis (Ratkowsky, 1990). For these analyses, we used the SPSS 20 program (SPSS, 2011).
In the second part of the analyses, we tested the STARTS model (Kenny & Zautra, 2001) using structural equation modeling. These analyses were conducted using the Mplus 6.1 program (Muthén & Muthén, 2010). To deal with missing values, we used full-information maximum likelihood estimation to fit models directly to the raw data, which produces less biased and more reliable results compared with conventional methods of dealing with missing data, such as listwise or pairwise deletion (Allison, 2003; Schafer & Graham, 2002). Model fit was assessed by the comparative fit index (CFI), the Tucker–Lewis index (TLI), and the root mean square error of approximation (RMSEA), based on the recommendations of Hu and Bentler (1999) and MacCallum and Austin (2000). Good fit is indicated by values greater than or equal to .95 for CFI and TLI, and less than or equal to .06 for RMSEA (Hu & Bentler, 1999).
Testing for Metric Measurement Invariance of the RSE Across Waves
The analyses reported in this article are valid only if the self-esteem measure used shows metric measurement invariance across waves (Schmitt & Kuljanin, 2008; Widaman, Ferrer, & Conger, 2010). Using confirmatory factor analysis, we tested whether metric invariance holds for the 8-item RSE in the present data. The model included 48 items (8 items for each of the six waves) and 6 correlated latent self-esteem factors (i.e., 1 factor per wave). In addition, the model included method factors that accounted for bias due to positive versus negative wording of the items (Marsh, Scalas, & Nagengast, 2010). Specifically, we used the CT-C(M-1) method suggested by Eid, Lischetzke, Nussbeck, and Trierweiler (2003). The model included 6 method factors (i.e., 1 method factor per wave) which loaded on the negatively worded items and thereby controlled for the difference between negative and positive wording (see Eid et al., 2003). The method factors were correlated across waves, but uncorrelated with the self-esteem factors within and between waves. Also, the model included longitudinal correlations between the same items measured at different waves (Cole & Maxwell, 2003). Including these correlations controls for possible bias due to item-specific variance that is not captured by the self-esteem and method factors. We analyzed the items as categorical variables (Wirth & Edwards, 2007), using the mean- and variance-adjusted weighted least squares (WLSMV) estimator.
The first model included configural invariance (Widaman et al., 2010) by freely estimating the factor loadings across waves. The second model tested for metric invariance by constraining the loadings to be equal across waves. Because the chi-square value for the WLSMV cannot be used for the chi-square difference test, we used the DIFFTEST option available in Mplus. Results showed that the chi-square values of the two models differed significantly from each other. However, because the chi-square statistic is sensitive to sample size (MacCallum, Browne, & Cai, 2006), we also examined global fit indices for model comparison. The fit of the metric invariance model (CFI = .98, TLI = .98, RMSEA = .021) was as good as the fit of the configural invariance metric (CFI = .98, TLI = .98, RMSEA = .021). On the basis of the global fit indices, we concluded that imposing metric invariance constraints on the eight-item RSE does not lead to a meaningful reduction in model fit. This conclusion corresponds to the results of other longitudinal studies, in which the RSE showed metric measurement invariance over time (e.g., Donnellan, Kenny, Trzesniewski, Lucas, & Conger, 2012; Kuster, Orth, & Meier, 2012; Marsh et al., 2010; Orth, Robins, & Roberts, 2008).
Results
Long-Term Stability of Self-Esteem: Testing the Decay Function
In this part of the analyses, we examined the rank-order stability of self-esteem as a function of the test–retest interval. For the analyses, we computed all test–retest correlations that were available on the basis of the LSG data. Given that the data set included six waves of data (i.e., 1971, 1988, 1991, 1994, 1997, and 2000), there were 15 test–retest correlations based on nine different test–retest intervals (i.e., 3, 6, 9, 12, 17, 20, 23, 26, and 29 years). Because test–retest correlations systematically underestimate the stability of the construct if its measurement is not perfectly reliable, we corrected the correlations for attenuation due to measurement error (Cohen, Cohen, West, & Aiken, 2003). For correcting the correlations, we used coefficient alpha averaged across waves, which was .82.
On the basis of these data, we estimated an exponential decay function corresponding to the following equation: S = a + (1 − a) × e−bt (Ratkowsky, 1990). Here, S represents the outcome (i.e., stability of self-esteem), a represents the asymptote, e is a mathematical constant, b represents the rate of decay (i.e., how quickly the stability decays), and t represents the test–retest interval. Importantly, the function is in accordance with two theoretical assumptions (cf. Fraley, 2002; Fraley & Roberts, 2005). The first assumption is that the stability S equals 1 when t = 0 (because e raised to the power of 0 equals 1). This assumption is necessary because, if the construct is measured without error, its stability approaches 1 when the test–retest interval approaches 0. The second assumption is that the stability S continuously decreases with increasing test–retest interval t (although approaching a constant, that is, the asymptote a). Again, this assumption corresponds to theoretical predictions. Thus, estimation of the function yields two parameters, the asymptote a and the rate of decay b. Although both parameters are needed to fit the function closely to the data, in the present context, the important parameter is the asymptote because it allows testing whether the long-term stability approaches zero (which would correspond to a = 0) or a nonzero value (which would be reflected if a differs significantly from 0).
For the full sample, the parameter estimates were a = .43 and b = .12 (Table 2). Figure 1A shows the observed stability coefficients, the model-implied stability curve for test–retest intervals from 0 to 29 years, and the estimated asymptote. Visual inspection suggests that the estimated function fits the data well; moreover, the results showed that the model explained 94% of the variance in the observed coefficients (Table 2). Importantly, the precision of the estimates was sufficiently large and both parameters differed significantly from 0, as indicated by the corresponding confidence intervals.
Parameter Estimates for Exponential Decay of Self-Esteem Stability in the Full Sample and by Gender and Age Group.
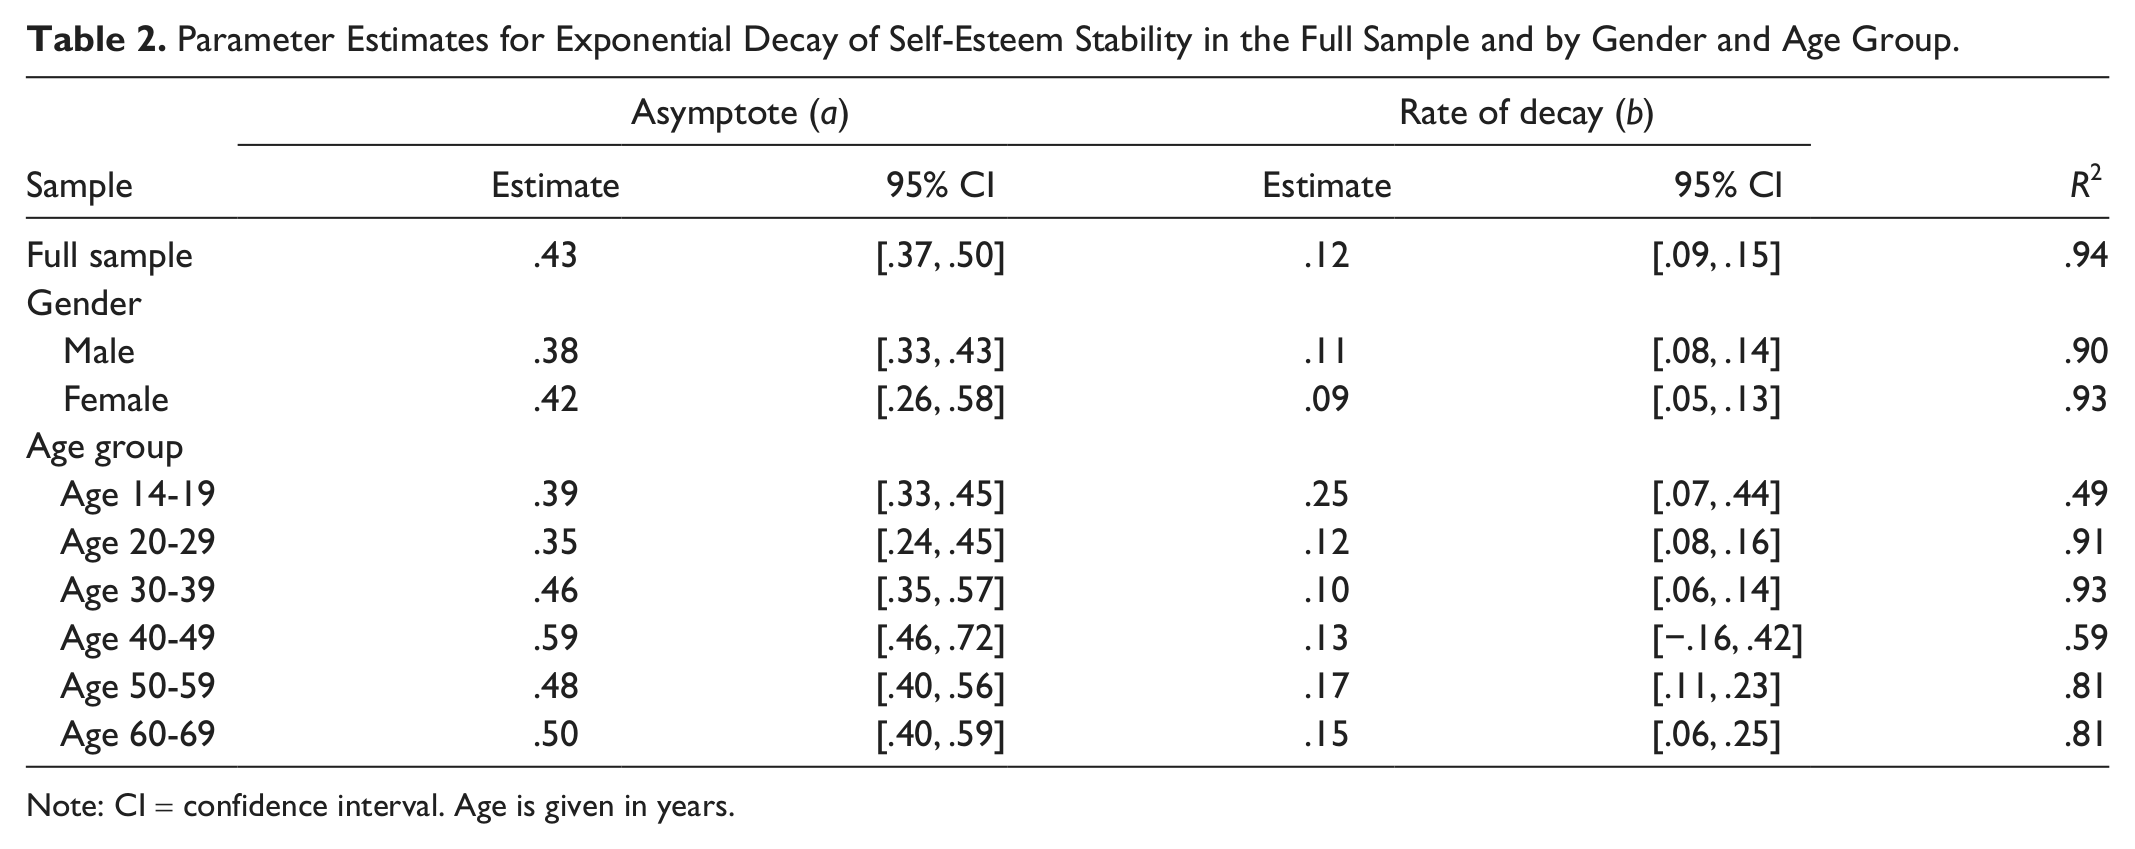
Note: CI = confidence interval. Age is given in years.
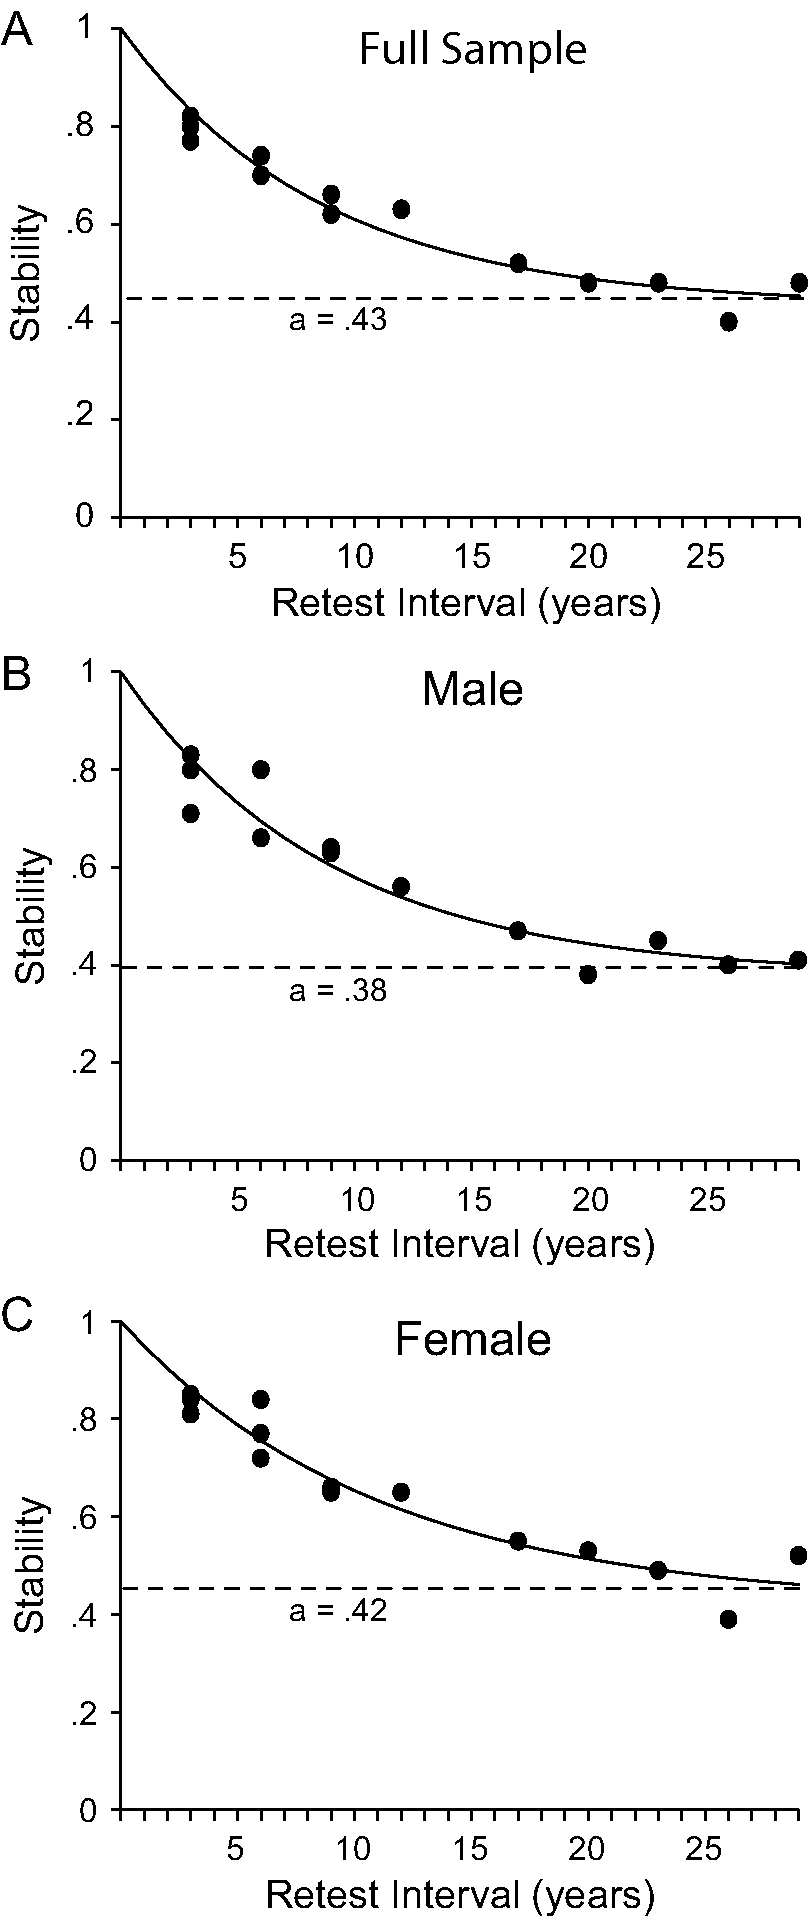
Stability of self-esteem as a function of the test–retest interval, for the full sample (Panel A) and for male and female participants (Panels B and C, respectively).
We tested whether alternative functions provided a better fit to the data than the exponential decay function; specifically, we examined linear and quadratic functions. Both alternative functions accounted for the assumption that the stability approaches 1 when the test–retest interval approaches 0, corresponding to the theoretical reflections outlined above. For the linear function, the equation was as follows: S = 1 + (b1 × t). Here, S is the outcome, b1 is the linear slope, and t is the test–retest interval. For the quadratic function, the equation was S = 1 + (b1 × t) + (b2 × t2). Here, b1 is the linear slope and b2 is the quadratic slope. The results suggested, however, that the exponential decay function provided a better fit to the data than the linear and quadratic functions: whereas the exponential decay function accounted for—as mentioned above—94% of the variance, the linear function explained only 27% and the quadratic function 88% of the variance.
We tested for the linear and quadratic function because readers might ask whether these simpler and more familiar functions would fit the data as well as the exponential decay function. However, we believe that only exponential decay, but not linear or quadratic change, is a theoretically plausible function because only exponential decay matches all of the assumptions described above (i.e., scores continuously decrease with increasing test–retest interval and asymptotically approach a value that is either 0 or a nonzero value between 0 and 1). In contrast, the linear function implies that stability drops below 0 at very long intervals, which cannot be reconciled with theory on stability of psychological constructs (cf. Fraley & Roberts, 2005). The quadratic function implies that—with increasing intervals—stability first reaches a nadir and then increases again; this characteristic of the function is not consistent with the theoretically well-founded assumption that stability does not increase with increasing test–retest interval. Our empirical findings correspond to these theoretical reflections. Although the quadratic function explained a large proportion of variance in stability coefficients, the exponential decay provided a better fit to the data. To summarize, the present results suggest that the long-term stability of self-esteem follows an exponential decay function and approaches a nonzero asymptote (with an estimate of .43). For 1-year intervals, the estimated stability of self-esteem was .93.
Next, we tested whether gender moderated the function of decay (for the results see Table 2 and Figures 1B and 1C). The estimated functions fit the data well (with 90% and 93% of the variance explained for male and female participants, respectively). As in the full sample, the exponential decay function provided a better fit to the data than the linear and quadratic function, for both male and female participants. Also, all parameters differed significantly from 0. For testing whether the asymptote and rate of decay differed significantly between men and women, we used the test of difference between regression coefficients for independent groups (Cohen et al., 2003). No significant gender differences emerged.
Then, we tested whether age is a moderator of the decay. To examine the effects of age, we divided the sample into age groups, separately for each wave that served as first assessment in computing the test–retest correlations. For example, when computing the correlation between Waves 2 and 3, the age groups were based on information from Wave 2. We created the following age groups: 14 to 19 years, 20 to 29 years, 30 to 39 years, 40 to 49 years, 50 to 59 years, and 60 to 69 years. We did not include participants at age 70 and older in examining differences between age groups because for these participants the longest test–retest interval available was only 12 years—in contrast, for the other groups, the longest test–retest interval was 26 years (for the age group 60-69 years) and 29 years (for all other age groups); consequently, for participants aged 70 and older, the precision of the parameter estimates would likely have been low. For all subsamples, we computed test–retest correlations only if the correlation was based on at least 30 cases.
The results for the age groups are shown in Table 2 and Figure 2. Although the variance explained was low in two of the age groups (age 14-19 years and age 40-49 years), the variance explained was relatively large in the other age groups. Importantly, the exponential decay function provided a better fit to the data than the linear and quadratic functions, in all age groups. Again, all parameters differed significantly from 0, except for the rate of decay in the age group 40 to 49 years. The asymptote parameter ranged from .35 to .59 across age groups. However, significant differences emerged only for the age group 20 to 29 years (which had the lowest asymptote), when compared with the age group 40 to 49 years (z = 2.98, p < .05), 50 to 59 years (z = 2.06, p < .05), and 60 to 69 years (z = 2.14, p < .05). Although most of the differences between age groups were nonsignificant, the estimates for the asymptote tended to be higher in middle adulthood (in particular at age 40-49 years) than in adolescence and young adulthood, corresponding to the findings by Trzesniewski et al. (2003). For the rate of decay, there were no significant differences between age groups. Overall, the evidence suggests that the exponential decay function of long-term stability of self-esteem holds across gender and age (i.e., the exponential decay function provided a better fit than the linear and quadratic functions), and that the parameter estimates are similar across gender and relatively similar across age groups.

Stability of self-esteem as a function of the test–retest interval, shown by age group (group membership is based on age at the first assessment of the test–retest interval).
Long-Term Stability of Self-Esteem: Testing the Stable Trait Component of Self-Esteem
In the second part of the analyses, we tested whether structural equation modeling of the individual-level data yields evidence that a stable trait component underlies the long-term stability of self-esteem, which would provide an explanation for the nonzero asymptote of self-esteem stability. For the analyses, we used the STARTS model (Kenny & Zautra, 2001). The model includes three sources of variation in the observed self-esteem scores (see Figure 3). First, a perfectly stable trait factor influences self-esteem at each measurement occasion in the same way. Second, self-esteem is influenced by occasion-specific autoregressive trait factors. Third, at each measurement occasion, some variance in self-esteem remains unexplained by the model, which is captured by the latent error variables.
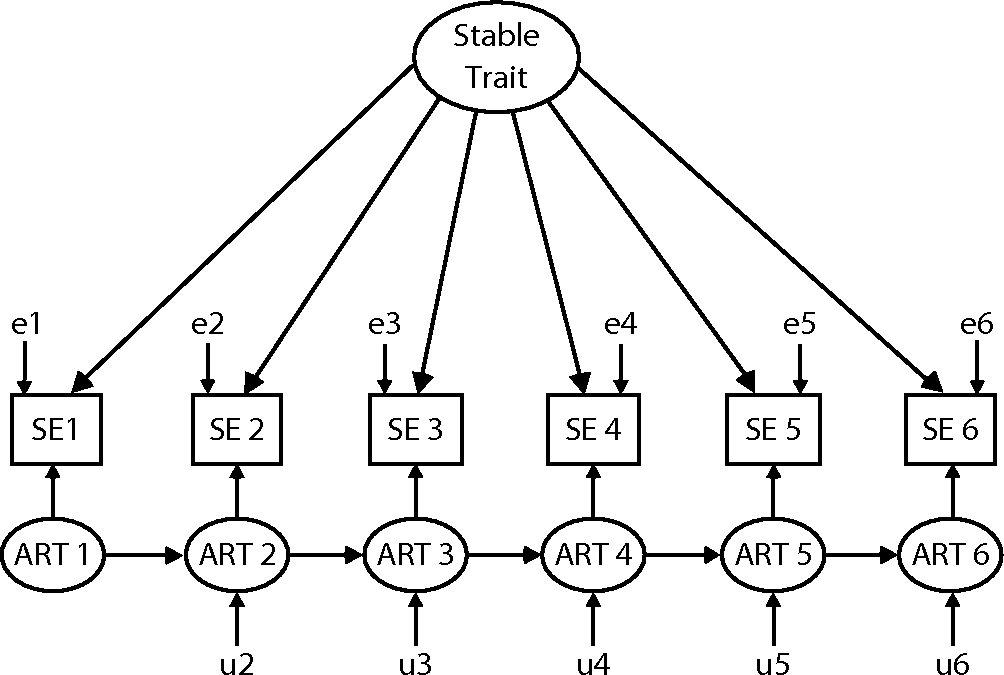
The figure illustrates the STARTS model for six-wave longitudinal data.
In addition, the model includes the following three assumptions. The assumption of stationarity implies that the variance explained by each source is the same at each measurement occasion. The assumption of independence implies that the three sources of variation are uncorrelated (i.e., the stable trait factor is uncorrelated with the autoregressive trait factors, and the error variables are uncorrelated with the stable trait and autoregressive trait factors). Finally, the model includes the assumption of a first-order autoregressive structure for the occasion-specific latent factors (i.e., the autoregressive trait factors). Specifically, the autoregressive structure accounts for the fact that the correlation between occasion-specific factors decreases systematically when the test–retest interval becomes longer. For example, if the autoregressive effect is .90 for factors that are separated by 1 year, then the autoregressive effect is .81 (i.e., .90 raised to the power of 2) for factors that are separated by 2 years. In the present study, the test–retest interval was 17 years between Waves 1 and 2, and 3 years between all other adjacent waves. We therefore used a test–retest interval of 1 year as unit, and constrained the autoregressive effect between factors (denoted as c) to c17 for the effect of Wave 1 on Wave 2 and to c3 for effects between all other adjacent waves. To account for the assumption that the autoregressive trait variances are equal across time (see above), we constrained the variances correspondingly. 1
In the present research, a model accounting for all of these assumptions fitted relatively well (χ2 = 99.0, df = 17, p < .05, CFI = .98, TLI = .98, RMSEA = .039). However, we tested whether relaxing the assumption of stationarity to quasi-stationarity provided for a better model fit (see Donnellan et al., 2012; Kenny & Zautra, 1995). Quasi-stationarity allows the total variance in self-esteem to change over time, but requires that the proportions of variance explained by the stable trait, autoregressive trait, and error are constant across measurement occasions. When we relaxed the assumption of stationarity to quasi-stationarity, the model fit the data very well (Table 3) and significantly better than the previous model (Δχ2 = 79.1, Δdf = 5, p < .05). In the remainder of the analyses, we therefore used the model that accounted for quasi-stationarity.
Fit of the STARTS Model and Alternative Models.
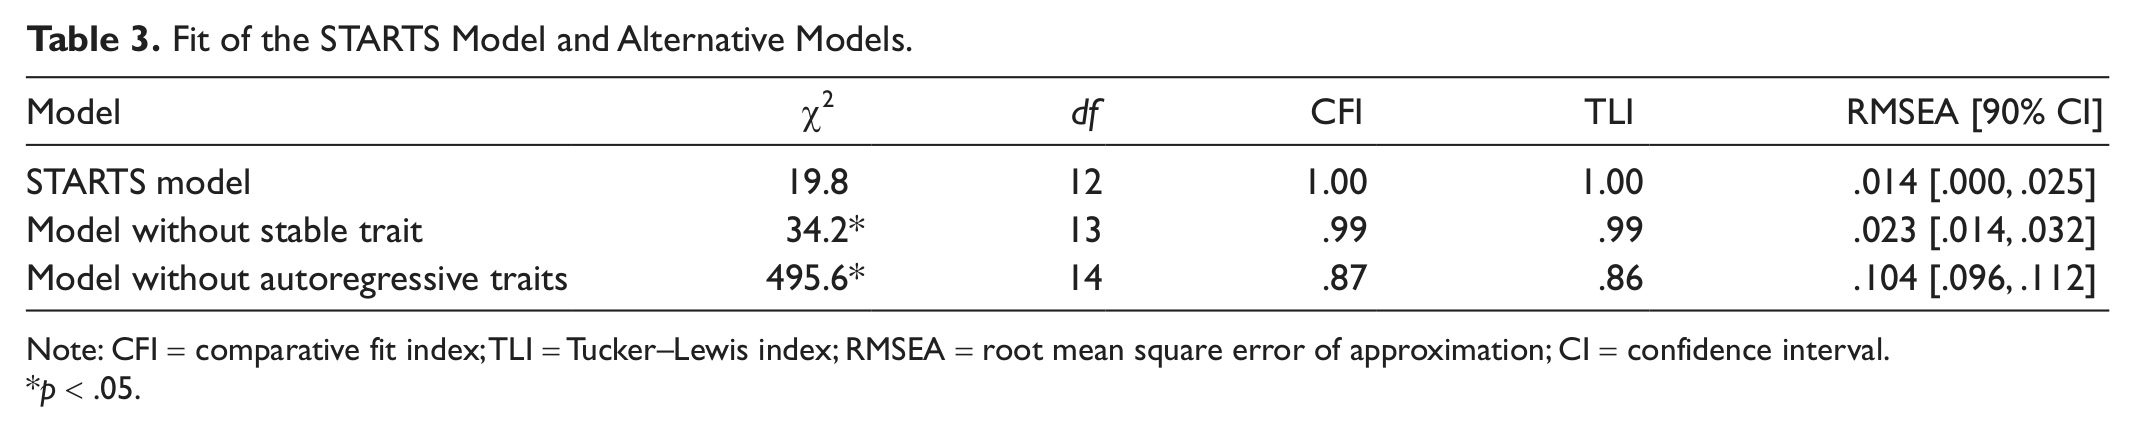
Note: CFI = comparative fit index; TLI = Tucker–Lewis index; RMSEA = root mean square error of approximation; CI = confidence interval.
p < .05.
In addition to the STARTS model, we examined two alternative models: one that included only the autoregressive trait factors and error variables (and omitted the stable trait factor) and one that included only the stable trait factor and error variables (and omitted the autoregressive trait factors). Table 3 shows the fit of the two alternative models. The chi-square difference test indicated that the STARTS model fit the data significantly better than the model without a stable trait factor (Δχ2 = 14.4, Δdf = 1, p < .05) and also significantly better than the model without autoregressive trait factors (Δχ2 = 475.8, Δdf = 2, p < .05). In the STARTS model, the stable trait factor explained 28%, the autoregressive trait factors 43%, and the error terms 29% of the total variance in self-esteem (see Table 4). The standardized estimate of the autoregressive effect, with a test–retest interval of 1 year as unit, was .95. To summarize, the STARTS model fit the data very well, suggesting that a stable trait factor is needed to explain the long-term stability of self-esteem.
Variance in Self-Esteem Explained by Stable Trait, Autoregressive Trait, and Error Terms in the STARTS Model.

Discussion
In the present research, we used data from a large longitudinal study with multiple assessments over 29 years to investigate the long-term stability of self-esteem. We examined the time-dependent decay of self-esteem stability and tested whether stability coefficients asymptotically approach zero or a nonzero value across long test–retest intervals. The results indicated that, as test–retest intervals increased, stability coefficients exponentially decayed and asymptotically approached a nonzero value (estimated as .43 in the full sample). The exponential decay function explained a large proportion of variance in observed stability coefficients, provided a better fit than alternative functions, and held for both men and women and for all age groups from adolescence to old age. Moreover, structural equation modeling of the individual-level data suggested that a perfectly stable trait component underlies the long-term stability of self-esteem, providing an explanation for the nonzero asymptote of self-esteem stability. The findings suggest that the stability of self-esteem is relatively large, even across very long periods, and that a stable trait factor is needed to explain the long-term stability of self-esteem.
Implications of the Findings
Overall, the stability estimates determined in the present research are consistent with the findings from previous studies (e.g., Alsaker & Olweus, 1992; Block & Robins, 1993; Granleese & Joseph, 1994; Marsh et al., 1998; R. E. L. Roberts & Bengtson, 1996; Trzesniewski et al., 2003). For example, the meta-analysis by Trzesniewski et al. (2003) yielded a stability estimate of .64, based on an average test–retest interval of about 3 years. Furthermore, Trzesniewski et al. found no significant gender differences in self-esteem stability, which corresponds to the results of the present research. However, the important point in this context is that previous studies did not focus on the time-dependent decline of self-esteem stability across long periods and did not test whether self-esteem stability approaches zero or a nonzero asymptotic value.
The present research suggests that the stability of self-esteem asymptotically approaches a value of about .40 (for 1-year intervals, the estimated stability was .93, and for 10-year intervals, the estimated stability was .61). This is consistent with the analyses by Fraley and Roberts (2005), which suggested that although the stability of psychological constructs declines when the time interval increases, the stability may level off at a nonzero asymptote at long time intervals.
An important question is whether the asymptotically approached value of about .40 is high or low. Therefore, it is useful to compare this estimate with findings on the long-term stability of other major personality traits such as the Big Five. For example, Conley (1984b) reported stability estimates of .26 for extraversion and .33 for neuroticism based on a 45-year interval. In the study by Fraley and Roberts (2005), the predicted stability of neuroticism was about .45 across 10- and 20-year intervals (when the first assessment was in adolescence or adulthood). Hampson and Goldberg (2006) found that the stability of the Big Five ranged from .00 to .29 across a 40-year interval; however, the first assessment was conducted in childhood, which likely accounts for the fact that the stability estimates are lower than would have been found if both assessments had been conducted in adulthood (see B. W. Roberts & DelVecchio, 2000). We note that observed stability coefficients across long intervals (such as those cited above) are not fully comparable with asymptotic values of stability (such as those examined in the present research). One important difference is that asymptotic values are estimates based on a large number of observed stability coefficients; thus, the asymptotic value likely has greater precision and, consequently, greater validity than a single stability coefficient. Nevertheless, overall, the present research suggests that the stability of self-esteem is similar—with regard to its temporal pattern and magnitude—to the stability of the Big Five personality traits. Thus, given that personality traits can be defined as “relatively enduring patterns of thoughts, feelings, and behaviors that distinguish individuals from one another” (B. W. Roberts et al., 2008, p. 375), the present research suggests that self-esteem should be categorized as a personality trait.
Furthermore, in the present research, the stability of self-esteem tended to be higher in middle adulthood (i.e., in the age group 40-49 years) than in adolescence and young adulthood, which is consistent with the pattern of findings reported by Trzesniewski et al. (2003). The increasing stability from adolescence to middle adulthood is also consistent with findings on the Big Five personality traits (Ferguson, 2010; Lucas & Donnellan, 2011; B. W. Roberts & DelVecchio, 2000; Specht, Egloff, & Schmukle, 2011) and corresponds to the “cumulative continuity principle,” which states that personality stabilizes across the life course (Caspi et al., 2005; B. W. Roberts et al., 2008). However, in contrast to Trzesniewski et al., who found that the stability of self-esteem decreases from middle adulthood into old age, in the present research, the stability remained at a relatively high level in the oldest age group (note that, although the oldest age group was only 60-69 years at the first assessment, these participants were up to age 86-95 at the second assessment). Nevertheless, the asymptotic values estimated for the two oldest age groups were lower, although not statistically significant, than the estimate for the age group 40 to 49 years. In sum, the results of the present research are not fully consistent with the findings on age differences in self-esteem stability by Trzesniewski et al. Future research should therefore examine the stability of self-esteem in old age more closely. Similarly, the currently available evidence on the Big Five personality traits is not entirely clear with regard to their stability in old age. Whereas some research suggests that the stability of the Big Five linearly increases across the whole life span (B. W. Roberts & DelVecchio, 2000), or remains at a constant high level after age 30 (Terracciano et al., 2006), recent studies have found decreases in the stability of the Big Five in old age (Lucas & Donnellan, 2011; Specht et al., 2011).
The present findings also provide evidence on the relative importance of stable trait and autoregressive trait components in self-esteem (for a discussion, see Conley, 1984a; Donnellan, Trzesniewski, & Robins, 2011; Harter, 2006; Rosenberg, 1986; Trzesniewski et al., 2003). The structural equation modeling analyses suggested that the stable trait factor accounted for 28% and the autoregressive trait factor for 43% of the variance in self-esteem. Thus, although a large proportion of the variance was accounted for by the autoregressive trait component and latent error variables, about one quarter of the variance over 29 years was explained by a perfectly stable trait factor. Interestingly, the only other study using a trait-state model for self-esteem (which we are aware of) yielded relatively similar estimates (Donnellan et al., 2012). In the study by Donnellan et al. (2012), which examined self-esteem in adolescents and young adults across 19 years, the stable trait factor accounted for 35% of the variance and the autoregressive factor accounted for 49%. Moreover, Donnellan et al. found, as we did in our study, that a model that omitted the stable trait factor fit the data significantly worse than the model including the stable trait factor. With regard to the present research, the important conclusion is that both studies (i.e., Donnellan et al.’s and ours) suggest that a substantial proportion of variance in self-esteem is completely stable over long periods and that a completely stable trait factor is needed to satisfactorily explain individual differences in self-esteem.
Limitations and Future Directions
A limitation of this research is that the sample is not representative of the population of the United States. Therefore, future research should replicate the analyses in other, ideally nationally representative samples. Moreover, future research should examine the long-term stability of self-esteem in samples from other cultural contexts (cf. Arnett, 2008; Henrich, Heine, & Norenzayan, 2010). For example, individuals from Asian and Western cultures differ in the typical structure of the self-concept and in their need for self-esteem (Heine, Lehman, Markus, & Kitayama, 1999; Markus & Kitayama, 1991; but see Sedikides, Gaertner, & Toguchi, 2003), which may have consequences for the long-term stability of self-esteem.
In the analyses of test–retest correlations, we corrected the observed correlations for attenuation due to measurement error by using coefficient alpha. An important assumption underlying coefficient alpha is that the items measure a unidimensional construct; if the measure is not perfectly unidimensional, alpha may underestimate the true reliability (Schmitt, 1996). Thus, by using alpha, we may have overcorrected the observed correlations to some extent. However, in this research, using uncorrected correlations was not a viable option because, as described in the “Results” section, testing the time-dependent decay of stability needed to account for the fact that stability equals 1 when the test–retest interval equals 0. Nevertheless, future research on the decay of stability coefficients should consider alternative methods for estimating the reliability of the measures used (e.g., dependability estimates, see Anusic, Lucas, & Donnellan, 2012; Chmielewski & Watson, 2009).
Although the longitudinal data used in this research covered a period of 29 years, future research would benefit if data were available across even longer test–retest intervals. The present research suggests that the stability of self-esteem asymptotically approaches a nonzero value and that self-esteem has a perfectly stable trait component; however, the validity of these conclusions should be assessed by examining data on self-esteem stability over even longer periods than those covered by the present research.
Moreover, the sample examined in this research covered all developmental stages from adolescence to old age, but did not include any individuals younger than 14 years. Therefore, future research should replicate the analyses with a sample of children and test whether long-term stability of self-esteem is observable when the first assessment is conducted for example at age 10 or even at age 6. Research suggests that self-esteem stability is lower in childhood than in later developmental periods (Alsaker & Olweus, 1992; Donnellan et al., 2012; Marsh et al., 1998; Trzesniewski et al., 2003). Consequently, an individual’s self-esteem—being highly stable across most part of the life course—could be much more malleable in childhood, and positive and negative experiences in childhood (e.g., through parental behavior and life circumstances) could have a greater influence on the development of self-esteem compared with life experiences in adolescence or adulthood (Murrell, Meeks, & Walker, 1991; Orth et al., 2012; Orth, Robins, & Meier, 2009). It is therefore possible that childhood is a critical period in the development of self-esteem and that childhood experiences shape, to a significant degree, the individuals’ level of self-esteem in adolescence and adulthood.
An important question is whether cohort differences in the mean level of self-esteem might have confounded the rank-order stability of self-esteem in the full sample. If more recent generations systematically have higher self-esteem than previous generations, then these differences might positively bias stability estimates. However, although the hypothesis that there has been a secular increase in self-esteem in the past decades has intuitive appeal (Twenge & Campbell, 2001, 2008), the evidence regarding cohort differences in self-esteem is inconsistent and a topic of ongoing debate. Whereas some studies suggest that there have been generational increases in self-esteem (Gentile, Twenge, & Campbell, 2010; Twenge & Campbell, 2001), the results of other studies—three of which examined data from nationally representative samples—suggest that the mean level of self-esteem has not changed across the generations born in the past century (Erol & Orth, 2011; Orth et al., 2010; Orth et al., 2012; Trzesniewski & Donnellan, 2010). Importantly, one of these studies used the same data set as the present research and did not find evidence for cohort differences in level of self-esteem (Orth et al., 2012). Moreover, in the present research, we estimated the asymptote of self-esteem stability separately for six age groups from adolescence to old age. Given that the pattern of stability found in the full sample replicated relatively well within age groups, we believe that our findings on the stability of self-esteem are not confounded by possible generational changes in level of self-esteem.
The present research raises the important question of which factors contribute to the long-term stability of self-esteem. First, genetic factors may play an important role. The best available evidence is provided by longitudinal behavioral genetic studies (McGuire et al., 1999; Neiss, Sedikides, & Stevenson, 2002). For example, using longitudinal data from about 250 pairs of twins, siblings, and stepsiblings, McGuire et al. (1999) found that genetic factors explained large portions of stability in global and domain-specific self-esteem. Second, the findings by McGuire et al. suggest that environmental factors also contribute to the stability of self-esteem; as discussed by B. W. Roberts et al. (2008), role continuity may account for a stable subjective environment, thereby promoting stability of personality traits. Finally, in addition to genetic and environmental influences, person–environment transactions may contribute to the long-term stability of self-esteem (B. W. Roberts et al., 2008). For example, one of the processes of person–environment transaction is attraction: Most people are attracted to environments that match their personality (e.g., their level of self-esteem; Swann, Stein-Seroussi, & Giesler, 1992), which contributes to the stability of individual differences. Similarly, individuals are selected into social and work-related roles that match their personality, which also increases stability. Another transactional process is that people tend to selectively attend to and search for information that confirms their beliefs about themselves, including their self-evaluation (Sedikides, 1993; Swann & Read, 1981). Moreover, some personality characteristics elicit reactions by others that reinforce the eliciting characteristic; for example, it is possible that people with low self-esteem evoke social reactions that contribute to the maintenance of their low self-esteem. Further person–environment transactions, as discussed by B. W. Roberts et al. (2008), include manipulation and attrition. In future research, it would be highly interesting to examine to what degree these person–environment transactions contribute to the long-term stability of self-esteem.
Finally, we note that the present research introduces a method that can be used for estimating the decay function of stability, and the corresponding asymptote and rate of decay, for any individual-differences construct. Researchers can compare the parameters across a large set of constructs such as personality traits, attitudes, cognitive abilities, and biological characteristics. Knowledge about the differential stability of constructs has important implications for theory because it helps to evaluate to which degree constructs should be categorized as traits. Importantly, in each study, it should be tested whether the decay function provides a sufficiently good fit to observed stability coefficients. Although previous research implicitly suggests that stability coefficients decay exponentially over time (see Cole, 2012; Donnellan et al., 2012; Fraley, 2002; Fraley & Roberts, 2005), this hypothesis has been explicitly tested in only one previous study (Terracciano et al., 2006).
Whereas the meaning of the asymptote parameter is straightforward (i.e., the degree to which individual differences in a construct are stable across very long periods), the substantive meaning of the rate of decay is less well-understood. It is possible that the rate of decay reflects the overall strength of factors that differentially affect the individuals included in a sample. In the present research, the rate of decay was largest for the youngest age group (i.e., participants aged 14 to 19 years at the first measurement occasion). This finding corresponds to theoretical perspectives that highlight the many transitions and complex challenges that occur during adolescence and young adulthood, likely influencing the individual’s self-esteem (Arnett, 2000; Erikson, 1983; Robins et al., 2002). In future research, it would be worthwhile to further explore the meaning of the rate of decay in stability coefficients.
Conclusion
In summary, the present research contributes to the understanding of the life-span development of self-esteem by describing the time-dependent decay of self-esteem stability and by examining the degree to which a perfectly stable trait component underlies the long-term stability of self-esteem. The results suggest that the stability of self-esteem is relatively large and never drops to zero, even across long time periods. Thus, individuals who have high self-esteem at a given time are very likely to have high self-esteem 1 year later and they are still likely to have high self-esteem 5, 10, and even 30 years later. The same holds, likewise, for individuals with low or medium levels of self-esteem. Nevertheless, the findings show that the long-term stability of self-esteem is far from complete stability. Thus, although self-esteem is a relatively trait-like characteristic, it is possible that individuals can significantly improve their self-esteem on a sustained basis and that psychological interventions can help individuals attain this goal (Haney & Durlak, 1998; O’Mara, Marsh, Craven, & Debus, 2006). Future research should therefore continue to explore the conditions of stability and change in self-esteem. Ultimately, such knowledge will inform interventions that are designed to improve self-esteem.
Footnotes
Declaration of Conflicting Interests
The author(s) declared no potential conflicts of interest with respect to the research, authorship, and/or publication of this article.
Funding
The author(s) disclosed receipt of the following financial support for the research, authorship, and/or publication of this article: This research was supported by Swiss National Science Foundation Grant PP00P1-123370 to Ulrich Orth.