
Abstract
Perceivers use visual information to categorize others into social groups. That said, anecdotal reports suggest that perceivers are more comfortable making some categorizations (race, sex) than others (sexual orientation) on the basis of such limited information, perhaps because they hold differing beliefs about the diagnosticity of visual cues to those categories. The current studies tested this hypothesis empirically. We first developed a new measure—the Diagnosticity Scale—to assess beliefs about the diagnosticity of visual cues to diverse social categories. Next, we demonstrated that diagnosticity beliefs explain response tendencies in social perception, such that weak beliefs in the diagnosticity of visual cues to a given category predict biases toward the non-stigmatized, default response option. Collectively, these studies introduce the Diagnosticity Scale as a valid measure of perceivers’ beliefs in visual cues to social categories, which help to explain some noteworthy biases in social perception.
Research designed to test the dynamics and consequences of social perception tends to evoke strong reactions. For example, in several recent studies, we asked participants to judge targets’ sexual orientations on the basis of facial photographs or dynamic body motions. The conclusions afforded by these studies are clear: Participants achieve surprisingly high levels of accuracy when judging sexual orientation from limited visual information (Tskhay & Rule, 2013). Although they are able to provide accurate categorizations, however, participants often bemoan these tasks. Indeed, one recent participant remarked, “. . . part of me was upset when you assumed a person could know if someone was LGBT by looking at their face.” Another said, “I did not like judging whether someone was heterosexual or gay/lesbian by photo.” A third chided, “I found it laughable to judge sexual orientation by picture. I know you’re collecting data, but it’s silly to try and assess others by one picture.”
The juxtaposition of these observations is intriguing. On one hand, observers’ sexual orientation judgments are relatively accurate. On the other hand, observers find providing these judgments to be objectionable. Although it is possible that such objections reflect a general attempt to avoid “judging a book by its cover,” participants in methodologically similar studies seem perfectly willing to provide other judgments on the basis of scant information. For example, when categorizing race or sex based upon visual cues, observers rarely question their ability to make valid judgments. In fact, race and sex categorizations are considered so easy they are commonsensical (Posel, 2001), arousing few if any objections.
We contend that these anecdotal observations reflect issues of theoretical importance for social psychology. Specifically, perceivers appear inclined to accept the diagnosticity of visual cues to some categories (race, sex), but disinclined to do so for other categories (sexual orientation). This difference may reflect a belief that some visual cues reliably communicate social category information whereas others do not. If so, the belief that visual cues diagnostically convey social information may embolden some categorizations, allowing them to occur effortlessly and efficiently based upon scant evidence. The belief that visual cues do not diagnostically convey social information might inhibit other categorizations, demanding a relatively high threshold of evidence to yield confident judgments. If our logic is correct, then diagnosticity beliefs should be reflected in the decision rules that accompany various social categorizations. Here, we test this possibility by developing a new scale to measure beliefs about the diagnosticity of visual information to various social categories and assessing the consequences of perceived diagnosticity for accuracy and response bias across several different social category dimensions.
Visual Cues to Social Categories
Categorization has long assumed a central role in social psychological research. Indeed, Gordon Allport (1954) famously theorized, “The human mind must think with the aid of categories . . . Once formed, categories are the basis for normal prejudgment. We cannot possibly avoid this process. Orderly living depends on it” (p. 19). In the six decades since Allport offered these insights, psychologists have worked diligently to understand both the processes and consequences of social categorization.
Much of the initial work toward understanding social categorization focused on its consequences, in part because categorization was identified as an antecedent of interpersonal animus. Social categorization, it was argued, gives rise to stereotypical and prejudiced beliefs that shape perceivers’ impressions of targets (Allport, 1954). Subsequent empirical studies substantiated these claims, revealing that categorizations indeed bring to mind stereotypes that arouse negative evaluations and guide interpersonal behaviors (Devine, 1989; Sinclair & Kunda, 1999).
Continued efforts to understand and alleviate the consequences of social categorization have led researchers to examine specific factors that govern categorization in the first place. To this end, studies probing the early perceptual mechanics of social categorization have flourished. For example, the burgeoning field of social vision has revealed that visible cues in the face and body strongly guide judgments of social category membership (Freeman, Johnson, Adams, & Ambady, 2012; Johnson & Adams, 2013). Other studies have pinpointed the specific cues that inform these categorizations. For example, perceivers rely on visibly sexually dimorphic traits to make basic sex judgments, such that feminine cues compel female categorizations and masculine cues compel male categorizations (Johnson & Tassinary, 2005). Other work has probed the mechanics of race categorization, revealing that perceivers rely on visible cues in the face (Blair, Chapleau, & Judd, 2005; Johnson, Freeman, & Pauker, 2012), hair (MacLin & Malpass, 2001), and body (Lick, Gill, Golay, & Johnson, 2014) to determine others’ race category memberships.
Importantly, the informational value of visual cues is not restricted to obvious categories such as race and sex. Some of the most intriguing findings from the past decade have revealed that perceivers also rely on visual cues to infer more concealable identities, ranging from chosen affiliations such as political party membership (Carpinella & Johnson, 2013; Olivola & Todorov, 2010; Rule & Ambady, 2010) to more enduring identities such as religious affiliation (Allport & Kramer, 1946; Rule, Garrett, & Ambady, 2010) and sexual orientation (Rule & Ambady, 2008). In fact, a recent meta-analysis revealed modest but reliable accuracy in the perception of concealable identities from non-verbal cues (Tskhay & Rule, 2013).
The specific mechanisms by which perceivers achieve accurate categorizations of concealable identities are increasingly well understood. For example, when judging sexual orientation, gender-atypical cues in the face and body compel accurate gay/lesbian categorizations, whereas gender-typical cues compel accurate straight categorizations (Freeman, Johnson, Ambady, & Rule, 2010; Johnson, Gill, Reichman, & Tassinary, 2007; Lick, Johnson, & Gill, 2013). Gendered features drive judgments of political party affiliation in a similar manner (Carpinella & Johnson, 2013). Collectively, then, recent work on social categorization has illustrated a surprising degree of accuracy in the perception of concealable group memberships based upon visible cues alone.
Beliefs in the Diagnosticity of Visual Cues
While extant data suggest that visual cues provide valid information about social categories ranging from sex to sexual orientation, perceivers’ willingness to make use of this information may well vary between category dimensions. Indeed, in our own research, we have observed that participants categorize sex and race without question but they categorize sexual orientation with considerable reluctance. One factor that may help to explain these differences is the extent to which observers believe that visual information is diagnostic of social category membership, which we refer to as perceived diagnosticity.
The notion that perceived diagnosticity varies between social category dimensions and therefore impinges on categorization processes has escaped prior scrutiny, yet it remains theoretically tenable. Take, for example, visible cues to race and sexual orientation. Despite some variability, visual cues to race are often readily apparent at the level of bodily features, including facial structure (Blair et al., 2005) and skin tone (Levin & Banaji, 2006). Visual cues to sexual orientation, although reliable, tend to be subtler and require inferences from multiple features in combination (e.g., gender atypicality based upon a target’s sex category in conjunction with their gendered appearance; Johnson et al., 2007). Despite this seemingly obvious point, researchers have yet to compare perceptions of diagnosticity across social category dimensions. If perceived diagnosticity indeed varies across social category dimensions, then it may have implications for understanding the processes and consequences of social perception.
For example, the perceived diagnosticity of visual cues may yield differential accuracy rates across categories. Perceptual accuracy nears ceiling for sex and race categorizations, with observers achieving at least 90% accuracy for judgments of facial stimuli (Martin & Macrae, 2007). In contrast, perceptual accuracy for concealable identities is considerably lower (64% for sexual orientation; Tskhay & Rule, 2013). We propose that perceivers are aware of variability in the diagnosticity of visible cues to these categories, and that such awareness impinges on social categorization processes. Specifically, when cues are perceived to be relatively non-diagnostic of a given category, perceivers may have less confidence in them and therefore be reluctant to use them as a basis for consequential judgments, prompting less accurate responses.
The perceived diagnosticity of visual cues may also determine the likelihood that a given categorization will exhibit systematic biases. Indeed, in some instances, observers favor one category alternative over another in social perception tasks. This is especially common in perceptions of ambiguous social categories that carry stigma. When judging sexual orientation, for example, perceivers utilize the straight category more frequently than the gay category. This bias is not merely due to the low base rate of sexual minorities in the population; it persists even when perceivers receive explicit information about the base rates of straight/gay targets in a stimulus set (Lick & Johnson, 2014). Instead, the straight categorization bias appears to reflect perceivers’ desire to avoid applying stigmatizing labels to unknown others without a compelling rationale for doing so (Lick & Johnson, 2014). We propose that perceptions of low diagnosticity may help to explain such response biases. Specifically, the relatively large response bias in sexual orientation categorization may reflect the fact that visual cues are perceived to be non-diagnostic of sexual orientation, and that perceivers are unwilling to categorize targets as belonging to a stigmatized social group without a high threshold of evidence. The relatively small (sometimes non-existent) response biases for sex and race categorizations may be due to the fact that visual cues to those dimensions are perceived to be highly diagnostic, and that perceivers use them to make categorizations without relying on the non-stigmatized default categories.
In summary, perceivers demonstrate lower accuracy and stronger response biases for some social categorizations (e.g., sexual orientation) relative to others (e.g., sex, race). We propose that differences in the perceived diagnosticity of visual cues may help to account for these differences. Put simply, when visual cues are considered diagnostic for a given category dimension, perceivers may use them to achieve high levels of accuracy while exhibiting minimal response biases. When visual cues are considered less diagnostic for a given category dimension, perceivers may be reluctant to exploit relevant information, resulting in lower levels of accuracy and higher levels of response bias toward the default, non-stigmatized category. Here, we systematically tested these possibilities in three studies. In Study 1, we developed a scale for measuring the perceived diagnosticity of visual cues to diverse social categories. In Studies 2 and 3, we tested whether perceived diagnosticity was associated with distinct response patterns across various social category dimensions. We hypothesized that perceivers would place more stock in visual cues to overt category dimensions (race, sex) compared with more concealable dimensions (sexual orientation, religion), and that weak beliefs in the diagnosticity of cues to the latter categories would help to explain lower rates of accuracy and higher rates of response bias associated with them.
Based on recent recommendations (Simmons, Nelson, & Simonsohn, 2012), we determined the duration of our sampling periods in advance, and we report all data exclusions, all manipulations, and all measures for the studies reported below.
Study 1
In Study 1, we sought to (a) construct a scale measuring beliefs in the diagnosticity of visual cues to diverse social categories, (b) test the scale’s psychometric properties, and (c) examine differences in perceived diagnosticity across four social category dimensions—age, race, sex, and sexual orientation.
Method
Participants
One hundred sixty-five Internet users (109 men) completed the study. On average, participants were 29.87 years old (SD = 10.17 years) and most reported a high level of education (88% attended college) and a heterosexual orientation (89% straight). Furthermore, 75% identified as White, 15% as Asian, 6% as Latino, 2% as Black, and 2% as biracial.
Materials and procedure
To assess perceivers’ beliefs in the diagnosticity of visual cues to social categories, we modified an existing measure designed to assess beliefs that certain features of a person are indelible (Bastian & Haslam, 2006). We drew eight items from this scale and restructured them to probe beliefs about the diagnosticity of visible features for determining social category memberships (see Appendix). We worded the items vaguely to capture perceivers’ beliefs in the diagnosticity of visual cues in general, regardless of their origin (e.g., cues emanating from the face, body, or hair). Collectively, we refer to these items as the Diagnosticity Scale.
We tested the Diagnosticity Scale among Mechanical Turk users recruited for a study about their attitudes and beliefs, with no mention of social categorization or visual cues. After providing consent, participants were randomly assigned to complete the Diagnosticity Scale with respect to one of four social category dimensions: age (n = 42), race (n = 40), sex (n = 44), or sexual orientation (n = 39). Participants responded to each item using a 9-point rating scale (1 = strongly disagree to 9 = strongly agree) and then provided demographic information before being debriefed.
Results and Discussion
We sought to (a) test the psychometric properties of the Diagnosticity Scale and (b) determine whether beliefs in the diagnosticity of visual cues varied systematically across social category dimensions. We address these aims in turn below.
Psychometric properties
First, we tested the psychometric properties of the Diagnosticity Scale. Collapsing across category dimensions, the items were internally consistent (α = .89), and they remained internally consistent for each category dimension in isolation: age (α = .89), race (α = .80), sex (α = .84), and sexual orientation (α = .87). We also subjected the items to a principal components analysis with varimax rotation, allowing factors to emerge naturally rather than imposing a specific factor structure onto the data. The Kaiser–Meyer–Olkin (KMO) statistic indicated adequate sample size for the test (KMO = .90) and Bartlett’s test of sphericity indicated acceptably high correlations among items, χ2(28) = 674.27, p < .001 (Field, 2009). Results indicated that all eight items loaded onto a single factor (eigenvalue = 4.59, factor loadings > .64) explaining 57.34% of the variance in diagnosticity beliefs. Importantly, eigenvalues for subsequent factors were less than 1.00, and the scree plot revealed that eigenvalues leveled off after the first factor. Thus, the Diagnosticity Scale tapped a single construct capturing a large portion of the variance in perceivers’ beliefs about the diagnosticity of visual cues to social categories.
Differences in diagnosticity beliefs across social category dimensions
Next, we tested whether the perceived diagnosticity of visual cues varied across social category dimensions. We predicted that perceived diagnosticity would be relatively high for age, sex, and race categories, but lower for sexual orientation categories.
To test whether perceived diagnosticity varied across category dimensions, we subjected mean diagnosticity scores to a one-way ANOVA with social category dimension as a between-subjects factor. The main effect of social category dimension was significant, F(3, 161) = 20.76, p < .001,

Self-reported beliefs in the diagnosticity of visual cues to various social category dimensions in Study 1.
Overall, Study 1 fulfilled several goals. First, we developed a scale to measure perceivers’ beliefs regarding the diagnosticity of visual cues to various social category dimensions. The scale was internally consistent and all items loaded onto a single factor that explained nearly 60% of the variance in responses. Second, we demonstrated that perceivers endorse notably different beliefs about the diagnostic value of visual cues to various social categories. Specifically, perceivers endorsed the strongest belief in visual cues to sex, followed by cues to race and age, and then sexual orientation. These findings were consistent with our hypotheses, highlighting the Diagnosticity Scale as a valuable tool for assessing perceivers’ confidence in visual cues to diverse social categories.
Study 2
Findings from Study 1 revealed that perceivers endorse stronger beliefs in the diagnosticity of visual cues to some social category dimensions (race, sex, age) than others (sexual orientation). Although consistent with our predictions, however, Study 1 only examined self-reported differences in perceived diagnosticity. Evidence that the perceived diagnosticity of visual cues is associated with actual response tendencies during social categorization would further bolster our claims while highlighting the importance of diagnosticity beliefs for social categorizations. Study 2 therefore examined whether perceived diagnosticity predicted response tendencies associated with social categorization—in particular, perceptual accuracy and response bias. As before, we hypothesized that participants would report stronger beliefs in the diagnosticity of visible cues for race and sex than for sexual orientation. Moreover, based on existing research, we hypothesized that participants would exhibit distinct categorization patterns across these dimensions, showing higher accuracy and greater willingness to assign stigmatized labels in some cases (race and sex) than others (sexual orientation). Most importantly, we predicted that these patterns would be tethered to perceptions of diagnosticity, such that low diagnosticity would help to explain the lower rates of accuracy and higher rates of response bias associated with sexual orientation categorizations relative to sex or race categorizations.
Method
Participants
Two hundred thirty-eight Internet users (129 men) completed the study. On average, participants were 35.13 years old (SD = 12.24 years) and most reported a high level of education (87% attended college) and a heterosexual orientation (92% straight). Furthermore, 76% identified as White, 8% as Asian, 8% as Latino, 6% as Black, and 2% as biracial.
Materials and procedure
Mechanical Turk users were recruited for a study about their opinions of other people, with no mention of social categorization or visual cues. After providing consent, participants were randomly assigned to one of three conditions, providing judgments relevant to race (n = 75), sex (n = 80), or sexual orientation (n = 80). We elected not to include an age condition because the perceived diagnosticity of age cues was indistinguishable from the perceived diagnosticity of race cues in Study 1.
Participants first completed the Diagnosticity Scale for race, sex, or sexual orientation as described in Study 1. Next, participants categorized 64 faces, presented in random order, according to race (Black, White), sex (male, female), or sexual orientation (lesbian/gay, straight). The stimuli were a subsample of 64 facial photographs from Johnson and Ghavami (2011) that varied between target by sex, sexual orientation, and race (32 men—8 White gay, 8 White straight, 8 Black gay, 8 Black straight; 32 women—8 White lesbian, 8 White straight, 8 Black lesbian, 8 Black straight). After categorizing these faces, participants provided demographic information before being debriefed.
Results and Discussion
We first sought to replicate findings from Study 1, and then we tested whether perceived diagnosticity predicted accuracy or response biases in social categorization. We present the findings in turn below.
Psychometric properties
Collapsing across category dimensions, the items in the Diagnosticity Scale were internally consistent (α = .93). The items remained internally consistent for each category dimension in isolation: race (α = .90), sex (α = .91), and sexual orientation (α = .89). As in Study 1, we subjected the items to a principal components analysis using varimax rotation, allowing factors to emerge naturally rather than imposing a specific factor structure onto the data. The KMO statistic indicated adequate sample size for the test (KMO = 0.93) and Bartlett’s test of sphericity indicated acceptably high correlations among items, χ2(28) = 974.47, p < .001 (Field, 2009). Results indicated that all eight items loaded onto a single factor (eigenvalue = 5.37, factor loadings > .73) that explained 67.10% of the variance in diagnosticity beliefs. Eigenvalues associated with subsequent factors were less than 1.00, and the scree plot revealed that eigenvalues leveled off after the first factor. These findings replicated results from Study 1, revealing that the Diagnosticity Scale is a reliable measure of perceivers’ beliefs in the diagnosticity of visual cues to diverse social categories.
Differences in diagnosticity beliefs across social category dimensions
Next, we compared perceived diagnosticity across social category dimensions by subjecting mean diagnosticity scores to a one-way ANOVA with social category dimension as a between-subjects factor. The main effect of social category dimension was significant, F(2, 235) = 54.62, p < .001,

Self-reported beliefs in the diagnosticity of visual cues to various social category dimensions in Study 2.
Response tendencies and their relation to diagnosticity beliefs
Having replicated our findings from Study 1, we next examined variability in response tendencies across social category dimensions using several complementary approaches. First, we conducted a one-way ANOVA with social category as a between-subjects factor and the total number of Black, female, or gay categorizations as the outcome. We refer to this outcome as “Stigmatizing Categorizations,” because the categories Black, female, and gay carry more stigma than the default categories White, male, and straight. The main effect of social category dimension was significant, F(2, 235) = 89.44, p < .001,
In a parallel analysis, we compared the average number of stigmatizing categorizations that each participant made to the true base rate for the stimulus set (i.e., 0.50). Results indicated that stigmatizing race categorizations did not differ from the base rate of Black targets in the stimulus set (M = 0.50, SD = 0.02), t(82) = −1.20, p = .23, 95% CI = [−0.006, 0.002]. Stigmatizing sex categorizations were slightly lower than the base rate of female targets in the stimulus set (M = 0.49, SD = 0.03), t(74) = −3.25, p = .002, 95% CI = [−0.02, −0.05], indicating a slight bias toward male categorizations. Stigmatizing sexual orientation categorizations were much lower than the base rate of gay targets in the stimulus set (M = 0.33, SD = 0.15), t(79) = −10.18, p < .001, 95% CI = [−0.21, −0.14]. Thus, participants made stigmatizing sex and race categorizations that were relatively close to the true distributions of Black and female targets in the stimulus set, but they underreported the number of gay targets in the stimulus set.
To better understand these response tendencies, we conducted a signal detection analysis within each condition, which isolated perceptual accuracy and response bias. In particular, we coded correct Black, gay, and female categorizations as “hits” and correct White, straight, and male categorizations as “correct rejections,” computing d′ as a measure of perceptual sensitivity and c as a measure of response bias (Stanislaw & Todorov, 1999; see Table 1 for full signal detection parameters). 1 Using this coding, positive d′ values indicate sensitivity to social category cues, which translates to a high degree of perceptual accuracy. Positive c values indicate a conservative response bias, such that participants were more likely to use the White, straight, and male labels as opposed to the Black, gay, and female category labels, independent of accuracy. Our primary goal was to test whether these response tendencies were associated with the perceived diagnosticity of visual cues to the category dimension in question.
Signal Detection Parameters as a Function of Target Sex, Target Race, and Target Sexual Orientation in Study 2.

Note. Overall, perceivers accurately categorized female targets as female 96% of the time (96.29% hits) and male targets as male 99% of the time (98.75% correct rejections). They accurately categorized Black targets as Black 98% of the time (98.16% hits) and White targets as White 99% of the time (98.61% correct rejections). They accurately categorized gay targets as gay 41% of the time (41.29% hits) and straight targets as straight 76% of the time (75.90% correct rejections). These findings suggest a high degree of sensitivity with little response bias for sex and race judgments, but a more modest amount of sensitivity and stronger bias toward straight categorizations for sexual orientation judgments, as indicated by signal detection analyses (see d′ and c statistics).
p < .05. **p < .01. ***p < .001.
For race categorizations, perceptual sensitivity was significantly greater than chance, Md′ = 2.75, SD = 0.22, t(82) = 114.01, p < .001, 95% CI = [2.70, 2.80], and participants demonstrated no notable response bias, Mc = 0.01, SD = 0.12, t(82) = 0.91, p = .36, 95% CI = [−0.01, 0.04]. Furthermore, in the race condition, perceived diagnosticity was not significantly associated with sensitivity, r(83) = .14, p = .20, 95% CI = [−0.08, 0.34], or response bias, r(83) = −.16, p = .15. 95% CI = [−0.34, 0.08]. For sex categorizations, perceptual sensitivity was again significantly greater than chance, Md′ = 2.68, SD = 0.34, t(74) = 67.84, p < .001, 95% CI = [2.60, 2.76]. Moreover, replicating recent work (Johnson, Iida, & Tassinary, 2012), participants showed a slight bias toward male categorizations, Mc = 0.07, SD = 0.20, t(74) = 3.26, p = .002, 95% CI = [0.03, 0.12]. Importantly, however, perceived diagnosticity was not significantly associated with perceptual sensitivity to sex cues, r(75) = .15, p = .20, 95% CI = [−0.08, 0.36], or the bias toward male categorizations, r(75) = .13, p = .26, 95% CI = [−0.10, 0.35]. Finally, perceptual sensitivity was significantly greater than chance for sexual orientation categorizations, Md′ = 0.39, SD = 0.29, t(79) = 11.81, p < .001, 95% CI = [0.32, 0.45], and participants showed a strong tendency toward straight categorizations, Mc = 0.52, SD = 0.53, t(79) = 8.66, p < .001, 95% CI = [0.40, 0.63]. Although perceived diagnosticity was not associated with sensitivity to sexual orientation cues in faces, r(80) = −.02, p = .84, 95% CI = [−0.24, 0.20], it was associated with the bias toward straight categorizations, r(80) = −.22, p = .05, 95% CI = [−0.418, −0.002]. Thus, low perceived diagnosticity of visible cues to sexual orientation was associated with a stronger response bias toward the straight category.
Diagnosticity beliefs explain different response tendencies across category dimensions
In a final set of analyses, we constructed a series of nested linear regressions that first compared rates of sensitivity and bias across social category dimensions and then tested whether perceived diagnosticity helped to explain any observed differences. Put another way, this analysis tested whether diagnosticity beliefs helped to explain why perceptual sensitivity and response bias differed across social category dimensions. We began by regressing d′ scores onto social category (recoded as two vectors of zeroes and ones with sexual orientation as the reference group). Consistent with our previous analyses, sensitivity was higher for both race and sex categorizations compared with sexual orientation categorizations, Bs = 2.29 and 2.37, SEs = 0.05 and 0.05, ts = 49.76 and 52.66, ps < .001, 95% CIs = [2.20, 2.39] and [2.28, 2.46]. Next, we added perceived diagnosticity to the model, which did not significantly improve model fit, ΔR2 = .00, F(1, 234) = 1.50, p = .22. Moreover, the regression coefficients indicating higher sensitivity to race and sex cues than to sexual orientation cues remained practically unchanged after adding perceived diagnosticity to the model, Bs = 2.26 and 2.34, SEs = 0.06 and 0.05, ts = 40.60 and 58.18, ps < .001, 95% CIs = [2.15, 2.37] and [2.25, 2.44]. Collectively, these results indicate that perceivers were more accurate in their judgments of sex and race relative to sexual orientation, and these differences were not explained by diagnosticity beliefs that varied across category dimensions.
We conducted a similar analysis to examine response biases. We first regressed c scores onto social category (recoded as two vectors of zeroes and ones with sexual orientation condition as the reference category). Results indicated that response biases favoring the non-stigmatized category default (White, male, straight) were significantly smaller for race and sex categorizations than for sexual orientation categorizations, Bs = −0.44 and −0.50, SEs = 0.05 and 0.05, ts = −8.18 and −9.55, ps < .001, 95% CIs = [−0.55, −0.34] and [−0.61, −0.40]. Next, we added perceived diagnosticity to the model, which significantly improved model fit, ΔR2 = 0.01, F(1, 234) = 3.85, p = .05. In fact, accounting for diagnosticity beliefs reduced the magnitude of the differences in response bias across social category dimensions. The coefficients comparing response bias in the sexual orientation condition with response bias in the race and sex conditions after controlling for diagnosticity beliefs were as follows: Bs = −0.37 and −0.46, SEs = 0.07 and 0.06, ts = −5.72 and −8.11, ps < .001, 95% CIs = [−0.50, −0.24] and [−0.57, −0.35]. Although the contrasts remained significant, the regression coefficients were notably smaller in the second model relative to the first model. Indeed, the coefficient comparing response biases associated with race and sexual orientation categorizations changed from −0.44 to −0.37 after accounting for perceived diagnosticity, a 16% reduction in the magnitude of difference in response biases between these two category dimensions. The coefficient comparing response biases associated with sex and sexual orientation categorizations changed from −0.50 to −0.46 after accounting for perceived diagnosticity, a 9% reduction in the magnitude of difference in response biases between these two category dimensions. Collectively, these results reveal that perceivers showed notably stronger response biases toward the non-stigmatized category when judging sexual orientation compared with sex or race, and these differences were partially explained by differences in diagnosticity beliefs across social category dimensions.
Overall, Study 2 extended our previous findings in several ways. First, it provided additional evidence for the reliability of the Diagnosticity Scale and corroborated our initial finding that perceivers endorse stronger beliefs in the diagnosticity of visual cues to sex and race compared with sexual orientation. More importantly, Study 2 revealed that differing levels of perceived diagnosticity help to explain response tendencies in social perception. In general, we found that perceived diagnosticity was not associated with perceptual sensitivity, which indicates that perceivers reach relatively accurate conclusions about sex, race, and sexual orientation regardless of their beliefs in the diagnosticity of visual cues to those categories. However, perceived diagnosticity was associated with different patterns of response bias across category dimensions. Specifically, diagnosticity beliefs were unrelated to response biases for sex and race categorizations, perhaps because those categorizations exhibited modest or non-existent biases to begin with. However, low diagnosticity beliefs were associated with a strong tendency toward straight categorizations in sexual orientation perception. In fact, perceivers consistently showed stronger response biases toward the non-stigmatized category when making sexual orientation judgments compared with sex or race judgments, and these differences were partially explained by lower diagnosticity beliefs in the sexual orientation condition. Thus, one reason why perceivers tend to categorize targets as straight is because they do not trust visible cues to sexual orientation, which leads them to apply non-stigmatizing straight category labels on the basis of what is perceived to be dubious information.
Study 3
Study 2 revealed that diagnosticity beliefs do not predict perceptual accuracy, but do predict biased response patterns in the categorization of certain social identities. In particular, weak beliefs in the diagnosticity of visual cues to sexual orientation were associated with a robust bias toward the default, non-stigmatized category (i.e., straight). Although this finding highlights the role of diagnosticity beliefs in social categorization, its statistical significance was modest (p = .05). Moreover, although diagnosticity beliefs could theoretically impact perceptions of many different categories, Study 2 was specifically concerned with sexual orientation categories. Study 3 therefore sought to replicate our findings with another concealable identity: religious affiliation. We chose to examine religious affiliation in this study for several reasons. First, perceptions of religious affiliation have long been known to affect impression formation (Allport & Kramer, 1946). Second, similar to the sexual orientation categorizations we examined in Study 2, there is a clear category default category for religious affiliation in the United States (i.e., Christian; Gallup, 2011). Third, some religious affiliations, especially Atheism, remain highly stigmatized (Gervais, 2011). Therefore, while we are not aware of previous studies that examined perceptions of Atheism/Christianity from facial photographs, these dimensions offer a strong comparison with the sexual orientation categories we explored in our initial studies. Extending our findings to this category dimension will offer converging evidence for the role of diagnosticity beliefs in social perception.
As before, we hypothesized that participants would report weaker beliefs in the diagnosticity of visible cues to a relatively ambiguous social category dimension (religious affiliation) compared with a more overt category dimension (sex). Moreover, we predicted that participants would exhibit distinct response patterns across these category dimensions, showing greater willingness to assign non-default, stigmatizing labels when making sex categorizations relative to religion categorizations. Most importantly, we predicted that these response patterns would be tethered to diagnosticity beliefs, such that low diagnosticity would help to explain any response biases associated with religion relative to sex categorizations.
Method
Participants
One hundred sixty-six Internet users (101 men) completed the study. On average, participants were 31.22 years old (SD = 9.65 years) and most reported a high level of education (90% attended college) and a heterosexual orientation (90% straight). Furthermore, 64% identified as White, 16% as Asian, 8% as Latino, 10% as Black, and 2% as biracial.
Materials and procedure
Mechanical Turk users were recruited for a study about their opinions of other people, with no mention of social categorization or visual cues. After providing consent, participants were randomly assigned to one of two conditions, providing judgments relevant to sex (n = 83) or religious affiliation (n = 83).
Participants first completed the Diagnosticity Scale pertaining to sex or religious affiliation, as described in Study 1. Next, participants categorized 32 faces, presented in random order, according to their sex (male, female) or religion (Christian, Atheist). The stimuli were 32 facial photographs that varied between target by sex and religious affiliation (16 men—8 Christian, 8 Atheist; 16 women—8 Christian, 8 Atheist), which we collected from public dating websites serving specific religious demographics (e.g., ChristianMingle, AtheistPassions). Importantly, all of the photographs depicted White, heterosexual targets devoid of visible facial piercings or tattoos. After categorizing each target, participants provided demographic information before being debriefed. 2
Results and Discussion
We first sought to replicate findings from Studies 1 and 2 with regard to the psychometric properties of the Diagnosticity Scale, and then we tested whether perceived diagnosticity was associated with response tendencies in social categorization. We present these findings in turn below.
Psychometric properties
Collapsing across social category dimensions, the items in the Diagnosticity Scale were internally consistent (α = .94). The items remained internally consistent for each category dimension in isolation: sex (α = .88) and religious affiliation (α = .81). As in Studies 1 and 2, we also subjected the items to a principal components analysis using varimax rotation, allowing factors to emerge naturally rather than imposing a specific factor structure onto the data. The KMO statistic indicated adequate sample size for the test (KMO = 0.93) and Bartlett’s test of sphericity indicated acceptably high correlations among items, χ2(28) = 1,178.40, p < .001 (Field, 2009). Results indicated that all eight items loaded onto a single factor (eigenvalue = 5.71, factor loadings > .78) that explained 71.43% of the variance in diagnosticity beliefs. Eigenvalues associated with subsequent factors were less than 1.00, and the scree plot revealed that eigenvalues leveled off after the first factor. These findings provided another indication that the Diagnosticity Scale is a reliable measure of perceivers’ beliefs in the diagnosticity of visual cues to diverse social categories, including religious affiliation.
Differences in diagnosticity beliefs across social category dimensions
Next, we compared diagnosticity beliefs across social category dimensions by subjecting mean diagnosticity scores to a one-way ANOVA with social category dimension as a between-subjects factor. The main effect of social category dimension was significant, F(1, 164) = 301.78, p < .001,

Self-reported beliefs in the diagnosticity of visual cues to various social category dimensions in Study 3.
Response tendencies and their relation to diagnosticity beliefs
Having replicated our findings with regard to the Diagnosticity Scale itself, we next tested variability in response tendencies across social category dimensions using several complementary approaches. First, we conducted a one-way ANOVA with social category dimension as a between-subjects factor and the total number of female or Atheist categorizations (“Stigmatizing Categorizations”) as the outcome. The main effect of social category dimension was significant, F(1, 164) = 47.30, p < .001,
In a parallel analysis, we compared the total number of stigmatizing categorizations with the true base rate of stigmatized targets in the sample (i.e., 0.5). Results indicated that stigmatizing sex categorizations did not differ from the base rate of female targets in the stimulus set (M = 0.50, SD = 0.01), t(82) = −1.22, p = .23, 95% CI = [−0.005, 0.001]. Stigmatizing religion categorizations, however, were lower than the base rate of Atheist targets in the stimulus set (M = 0.39, SD = 0.14), t(82) = −7.03, p < .001, 95% CI = [−0.14, −0.08]. Thus, participants made stigmatizing sex categorizations that matched the true distribution of female targets, but they underreported the number of Atheist targets in the stimulus set.
To better understand these response tendencies, we conducted a signal detection analysis within each condition. In particular, we coded correct female and Atheist categorizations as “hits” and correct male and Christian categorizations as “correct rejections,” computing d′ as a measure of perceptual sensitivity and c as a measure of response bias (Stanislaw & Todorov, 1999; see Table 2 for full signal detection parameters). As before, positive d′ values indicate sensitivity to social category cues, which translates to a high degree of perceptual accuracy. Positive c values indicate a conservative response bias, such that participants were more likely to use the male and Christian category labels as opposed to the female and Atheist category labels, independent of accuracy.
Signal Detection Parameters as a Function of Target Sex and Target Religion in Study 3.
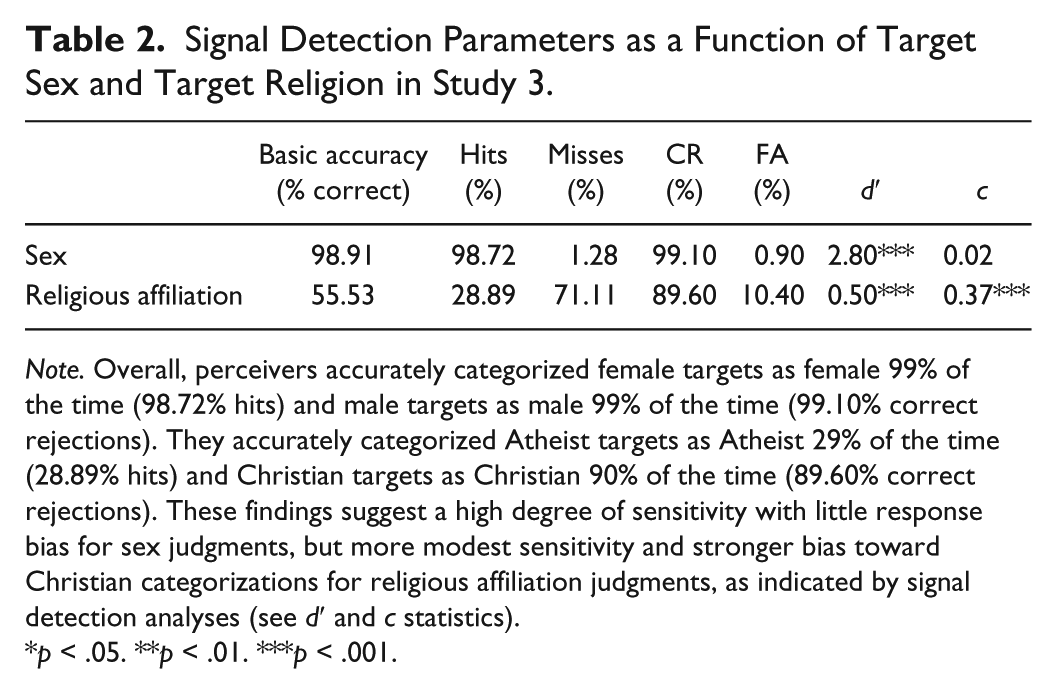
Note. Overall, perceivers accurately categorized female targets as female 99% of the time (98.72% hits) and male targets as male 99% of the time (99.10% correct rejections). They accurately categorized Atheist targets as Atheist 29% of the time (28.89% hits) and Christian targets as Christian 90% of the time (89.60% correct rejections). These findings suggest a high degree of sensitivity with little response bias for sex judgments, but more modest sensitivity and stronger bias toward Christian categorizations for religious affiliation judgments, as indicated by signal detection analyses (see d′ and c statistics).
p < .05. **p < .01. ***p < .001.
For sex categorizations, perceptual sensitivity was significantly greater than chance, Md′ = 2.80, SD = 0.32, t(82) = 79.31, p < .001, 95% CI = [2.73, 2.87], and participants demonstrated no notable response bias, Mc = 0.02, SD = 0.09, t(82) = 1.50, p = .14, 95% CI = [−0.01, 0.04]. Furthermore, perceived diagnosticity was not significantly associated with either sensitivity, r(83) = .13, p = .23, 95% CI = [−0.08, 0.34], or response bias, r(83) = −.03, p = .81, 95% CI = [−0.24, 0.19], in sex categorizations. For religion categorizations, perceptual sensitivity was again significantly greater than chance, Md′ = 0.50, SD = 0.47, t(82) = 9.68, p < .001, 95% CI = [0.40, 0.60]. Moreover, participants showed a strong tendency toward Christian categorizations, Mc = 0.37, SD = 0.50, t(82) = 6.63, p < .001, 95% CI = [0.26, 0.48]. Although perceived diagnosticity was not associated with sensitivity to religion cues, r(83) = .04, p = .69, 95% CI = [−0.17, 0.26], it was associated with the bias toward Christian categorizations, r(83) = −.24, p = .03, 95% CI = [−0.43, −0.03]. Thus, low perceived diagnosticity of visible cues to religion was associated with a bias toward the non-stigmatized default category (i.e., Christian).
Diagnosticity beliefs explain different response tendencies across category dimensions
In a final set of analyses, we constructed a series of nested linear regressions that first compared rates of sensitivity and bias across social category dimensions and then tested whether perceived diagnosticity helped to explain any observed differences in these outcomes. We began by regressing d′ scores onto social category (recoded as a vector of zeroes and ones with religious affiliation as the reference group). Consistent with our previous analyses, sensitivity was higher for sex categorizations compared with religion categorizations, B = 2.30, SE = 0.06, t = 36.90, p < .001, 95% CI = [2.18, 2.42]. Next, we added perceived diagnosticity to the model, which did not significantly improve model fit, ΔR2 = .00, F(1, 163) = 1.03, p = .31. Moreover, the regression coefficient indicating higher sensitivity to sex cues than to religion cues remained similar after adding perceived diagnosticity to the model, B = 2.22, SE = 0.11, t = 21.08, p < .001, 95% CI = [2.01, 2.42]. These results indicate that perceivers were more accurate in their judgments of sex relative to religious affiliation, and these effects were not explained by differences in diagnosticity beliefs across category dimensions.
We conducted a similar analysis to examine response biases. Specifically, we regressed c scores onto social category (recoded as a vector of zeroes and ones with religious affiliation as the reference category). Response biases favoring the non-stigmatized category default (male, Christian) were significantly smaller for sex categorizations than for religion categorizations, B = −0.35, SE = 0.06, t = −6.25, p < .001, 95% CI = [−0.46, −0.24]. Next, we added perceived diagnosticity to the model, which significantly improved model fit, ΔR2 = .02, F(1, 163) = 4.98, p = .03. Moreover, accounting for diagnosticity beliefs reduced the magnitude of the difference in response bias across social category dimensions. Specifically, the coefficient comparing response bias in the religious affiliation condition with that in the sex condition after controlling for diagnosticity beliefs was as follows: B = −0.18, SE = 0.09, t = −1.96, p = .05. This coefficient changed from −0.35 to −0.18 after accounting for perceived diagnosticity, indicating a 49% reduction in the magnitude of difference in response bias between these two category dimensions. Collectively, these results reveal that perceivers showed notably stronger response bias toward the non-stigmatized category when judging religious affiliation compared with sex, and this difference was partially explained by differences in diagnosticity beliefs across category dimensions.
In summary, Study 3 replicated and extended our previous findings to another social category dimension. First, it provided additional evidence for the reliability of the Diagnosticity Scale, validating its use for studying perceptions of religious affiliation. As predicted, perceivers endorsed notably stronger beliefs in the diagnosticity of visual cues to sex compared with religious affiliation. These differing diagnosticity beliefs were not associated with perceptual accuracy—perceivers reached relatively accurate conclusions about sex and religious affiliation regardless of their beliefs in the diagnosticity of visual cues to those categories. That said, perceivers’ relatively weak beliefs in the diagnosticity of visual cues to religious affiliation did help to explain biased response patterns observed across conditions. Specifically, diagnosticity beliefs were unrelated to response biases for sex categorizations, perhaps because those categorizations were unbiased to begin with. However, diagnosticity beliefs were negatively associated with a tendency toward the default Christian categorization in religion perception. In fact, perceivers consistently showed stronger response biases when making religion judgments compared with sex judgments, and this difference was related to lower perceived diagnosticity in the religious affiliation condition. These results corroborated our previous findings, suggesting that one reason perceivers avoid non-default religious categories when categorizing strangers is because they do not trust visible cues to religious affiliation.
General Discussion
Perceivers rely on visual information to make important decisions about others, including the social categories to which they belong. In many cases, such visual information affords accurate and reliable inferences. Importantly, however, observers’ willingness to exploit such information varies depending upon the social category in question. Here, we tested how such beliefs about the diagnosticity of visual cues to social categories relate to response tendencies in social perception. In Study 1, we developed the Diagnosticity Scale and found that observers endorsed notably stronger beliefs in the diagnosticity of visual cues to sex, race, and age categories relative to sexual orientation categories. In Studies 2 and 3, we linked perceptions of diagnosticity to response tendencies accompanying social categorizations. Overall, observers were more sensitive to sex and race cues than to sexual orientation and religion cues, although all categorizations demonstrated above chance accuracy. Moreover, these sensitivities and the differences between them were unrelated to perceived diagnosticity, suggesting that perceivers achieve accurate categorizations without regard for the presumed diagnosticity of visual cues. That said, observers also exhibited some systematic response biases that differed across category dimensions. In particular, observers showed no response bias in race categorizations, a modest bias favoring the male label in sex categorizations, and pronounced biases favoring straight and Christian labels in sexual orientation and religion categorizations, respectively. These response tendencies and the differences between them varied as a function of perceived diagnosticity, such that biases toward the non-stigmatized default (straight, Christian) became more pronounced as perceived diagnosticity declined. Collectively, these findings provide important insights about the role of diagnosticity beliefs in social categorization, and they raise new questions for research in the area of social perception.
First, these studies are among the first to directly compare response tendencies across different social categorizations. While the existing literature has done a tremendous job of describing response patterns that occur within a judgment category (e.g., within race judgments), few studies have compared response patterns across category dimensions. As such, variability in accuracy and response bias across social category dimensions could only be appreciated by comparing findings from literatures that often utilized different stimuli. In contrast, our findings directly compared outcomes associated with these diverse forms of social categorization. We found that observers accurately exploit visual cues to infer the sex, race, sexual orientation, and religious affiliation of novel targets, although the absolute level of sensitivity varied across category dimensions. More importantly, observers exhibited unique patterns of response bias across these dimensions, showing virtually no bias in race categorization, a small but systematic bias favoring male labels in sex categorization, and large biases favoring straight and Christian labels in sexual orientation and religion categorizations. These comparisons provide important insights about the perceptual outcomes that emerge for various types of social categorization, prompting future research to better understand the causes and correlates of such distinct outcomes.
The current studies also highlight perceived diagnosticity as one factor associated with the differential response tendencies accompanying various social categorizations. Perhaps because social perception researchers only recently began to shift their focus away from accuracy to consider the robust biases that sometimes accompany social categorizations, studies have yet to uncover factors that distinguish the distinct patterns of response bias that emerge across category dimensions. Here, we found that beliefs in the diagnosticity of visual cues to social category membership help to explain why perceivers sometimes favor one social category over its alternative. Indeed, the fact that perceivers believed in the diagnosticity of race and sex cues helps to explain why they displayed relatively weak biases when making race and sex judgments—when perceivers place stock in the cues they see, they render accurate judgments that do not rely too heavily on one category alternative over the other. The fact that perceivers were dubious about the diagnosticity of visual cues to sexual orientation and religious affiliation told a different story—when perceivers are doubtful of the cues they see, they render accurate judgments but tend to rely on one category alternative over the other (i.e., the non-stigmatized default).
At first glance, one might expect that if perceivers do not believe visual cues to a category are diagnostic, their categorizations would be randomly distributed, indicating that they are making judgments without regard for visual information. This does not appear to be the case. Instead, biases toward the non-stigmatized category default appear to increase as perceptions of diagnosticity decrease. That is, when perceivers lack confidence in the diagnosticity of visual cues to a given category dimension, they assume that targets belong to the non-stigmatized default group until additional evidence becomes available. This pattern reveals a sophisticated and perhaps even benevolent reasoning process that avoids the incorrect application of stigmatizing identities to others. Although this speculation was not a primary focus of our studies, it provides a foundation for exploring the decision-making processes that underlie social reasoning in greater depth.
One important caveat about the current studies is that the association between diagnosticity beliefs and response biases only emerged for concealable identities that carry stigma. As such, we have theorized that when perceivers believe visual cues to a given category are non-diagnostic, they utilize the default category in an attempt to avoid casting unnecessary stigma onto unknown targets. While this interpretation fits the current pattern of results, it remains possible that diagnosticity beliefs are negatively associated with response biases toward the default category even for identities that do not carry stigma. Future research can and should test this question about perceptions of social identities that are not stigmatized.
Another important consideration for future research is the role that base rates may play in predicting response biases in social perception. Indeed, it may be the case that perceivers’ biased tendency to categorize strangers as straight and Christian reflects not only their weak beliefs in the diagnosticity of visual cues to those categories, but also the relatively low base rates of gay and Atheist individuals in the population. That said, at least two factors make base rates an unlikely explanation for the response biases observed here. First, although perceivers sometimes attempt to probability match, they often ignore base rate information in favor of individuating information when making probabilistic judgments (Tversky & Kahneman, 1981). Second, a series of recent studies revealed that the straight categorization bias in sexual orientation judgment persists even when perceivers are explicitly informed of the base rate of gay targets in a stimulus set (Lick & Johnson, 2014). Collectively, these findings suggest that base rates probably do not offer a parsimonious explanation for the response biases observed here. Still, these possibilities deserve empirical attention in future research.
Another topic for future research involves the determinants of diagnosticity beliefs themselves. Indeed, the current findings are mute about the factors that give rise to diagnosticity beliefs in the first place. It may be the case that cues to some social categories are simply less obvious than cues to other categories. It is also possible that perceivers share less consensus in their beliefs about the cues to some categories than others. Finally, it could be true that perceivers share consensus about the valid indicators of most social identities but that they intentionally ignore those indicators when they would require applying stigma to an unknown person. Any or all of these possibilities may be correct and therefore deserve continued study.
Importantly, the current work provides a novel assessment tool—the Diagnosticity Scale—to aid in the aforementioned as well as other future research endeavors. The scale exhibits strong psychometric properties that differentiate between five social category dimensions while predicting differential response patterns associated with those dimensions. Moreover, it is constructed in a way that makes it easily adaptable. For example, the Diagnosticity Scale could be altered to explore perceivers’ beliefs about the diagnosticity of specific visual cues (e.g., facial phenotype, body morphology) to any number of category dimensions, including biracial identities, bisexual identities, and emotional states, all of which have begun to receive empirical attention.
In summary, perceivers exhibit a remarkable ability to categorize others on the basis of visual information, yet they also endorse varying levels of confidence in the diagnosticity of the visual cues informing those judgments. Such variability is perhaps unsurprising, given that the visible cues to some categories (e.g., sex) are more obvious than the visible cues to other categories (e.g., religion). What is more theoretically intriguing is the fact that differences in the perceived diagnosticity of visual cues help to explain response tendencies in social categorization, including a notable bias toward the non-stigmatized category default in perceptions of concealable identities. In light of this evidence, we suggest some nuance to Allport’s (1954) claim that the human mind thinks with the aid of categories. While social categorizations often arise effortlessly on the basis of visual cues, observers’ beliefs in the diagnosticity of those cues direct categorical thinking in predictable and sometimes biased ways. As researchers continue to probe the dynamics and outcomes of social categorization, it will be critical to consider how diagnosticity beliefs shape the processes and outcomes of social judgment.
Footnotes
Appendix
Below are a series of questions regarding your beliefs about other people. Please read each question and respond using the scale provided.
Declaration of Conflicting Interests
The author(s) declared no potential conflicts of interest with respect to the research, authorship, and/or publication of this article.
Funding
The author(s) disclosed receipt of the following financial support for the research, authorship, and/or publication of this article: This research was supported by a National Science Foundation Graduate Research Fellowship (Lick).
Notes
References
Supplementary Material
Please find the following supplemental material available below.
For Open Access articles published under a Creative Commons License, all supplemental material carries the same license as the article it is associated with.
For non-Open Access articles published, all supplemental material carries a non-exclusive license, and permission requests for re-use of supplemental material or any part of supplemental material shall be sent directly to the copyright owner as specified in the copyright notice associated with the article.