



Abstract
The current study analyzes data from a national probability panel sample of New Zealanders (N = 5,091) to examine stability and change in political orientation over four consecutive yearly assessments (2009-2012) following the 2007/2008 global financial crisis. Bayesian Latent Growth Modeling identified systematic variation in the growth trajectory of conservatism that was predicted by age and socio-economic status. Younger people (ages 25-45) did not change in their political orientation. Older people, however, became more conservative over time. Likewise, people with lower socio-economic status showed a marked increase in political conservatism. In addition, tests of rank-order stability showed that age had a cubic relationship with the stability of political orientation over our four annual assessments. Our findings provide strong support for System Justification Theory by showing that increases in conservatism in the wake of the recent global financial crisis occurred primarily among the poorest and most disadvantaged.
Keywords
Stability and Change in Political Conservatism Following a Recession
The 2007/2008 global financial crisis had a considerable impact on the New Zealand economy, while also presenting a salient threat to many New Zealanders. Between March 2008 and late 2009/2010, the gross domestic product (GDP) of New Zealand decreased by 3.4%, whereas the unemployment rate increased from 3.1% to 7.1% (Statistics New Zealand, 2014; The Treasury, 2014). Although the turmoil caused by the recession was felt across New Zealand, not everyone was equally affected. For instance, increases in the unemployment rate were greater among ethnic minorities, which translated into sharper decreases in their personal well-being relative to New Zealand Europeans (i.e., their ethnic majority counterparts; Sibley, Harré, Hoverd, & Houkamau, 2011). Thus, those who were initially disadvantaged were particularly likely to feel the effects of the global recession.
The current study utilizes data collected immediately after the onset of this volatile period to examine the longitudinal effects of the global recession on people’s political orientation. Specifically, we aim to identify who changed their political orientation (as well as the nature of this change) across four annual assessments that began following the onset of the global recession. Critically, examining change in political orientation in the wake of such a substantive economic upheaval allows us to test core predictions derived from System Justification Theory (see Jost, Banaji, & Nosek, 2004). Based on the tenets of System Justification Theory, one would expect that those who are most disadvantaged by the recession (i.e., the poor) would (ironically) be the most likely to experience an increase in their levels of conservatism. This is because endorsing a conservative ideology should help people establish certainty during a particularly chaotic and unpredictable time (see Jost et al., 2004; Jost, Pelham, Sheldon, & Ni Sullivan, 2003).
We examine this possibility by using Bayesian analyses to model the rank-order stability and latent growth trajectory of political orientation among participants involved in the New Zealand Attitudes and Values Study (NZAVS)—a New Zealand-based national probability panel study that began in 2009. In doing so, our models test the effects of gender, age, and socio-economic status on the rank-order stability and change trajectory of political conservatism across four annual assessments (i.e., 2009-2012). As such, our models provide a stringent test of System Justification Theory, as well as established hypotheses about the stability of political orientation across the life span (e.g., see Sears & Funk, 1999; Visser & Krosnick, 1998). Before presenting our study and results, we provide a brief review of the literature on System Justification Theory and political orientation.
System Justification Theory
According to System Justification Theory, people have a basic motivation to view themselves, their group, and society in a positive/fair light (Jost & Banaji, 1994; Jost, Burgess, & Mosso, 2001). For members of advantaged groups, these separate motivations are compatible with each other. Indeed, endorsing the fairness of the system (i.e., system justification) can help legitimize the privileged position of one’s group. Those who belong to disadvantaged groups, however, are faced with an inconsistency that is particularly uncomfortable. Namely, the need to establish positive regard for themselves (or their group) is in conflict with their need to see society (i.e., the system under which they are disadvantaged) as just.
To resolve these inconsistent motivations, System Justification Theory posits that disadvantaged group members can either aim to improve the status of their group or change their beliefs about the fairness of the system (see Jost, Pelham, et al., 2003). Given the noted difficulties associated with pursuing collective action (e.g., see Jost et al., 2012; Osborne, Huo, & Smith, 2014; Osborne & Sibley, 2013), disadvantaged group members often adopt the latter strategy (i.e., change their beliefs about the fairness of the system; see Jost, Pelham, et al., 2003). Indeed, research suggests that minority group members may, under certain conditions, be more likely than majority group members to endorse the fairness of the system (Jost & Hunyady, 2005). Moreover, the motivation to justify the system should be particularly salient during times of threat and uncertainty (Jost et al., 2004; Jost, Glaser, Kruglanski, & Sulloway, 2003). That is, the existential needs to manage uncertainty and threat that are heightened during times of crisis might motivate people to endorse conservative beliefs (Jost, Glaser, et al., 2003; Jost & Hunyady, 2005).
Although numerous studies have demonstrated that minority group members are (ironically) more likely than majority group members to justify the status quo under certain conditions (e.g., Jost, Pelham, et al., 2003), recent work by Brandt (2013) casts doubt on the consistency of these results. Specifically, through impressive analyses of large international data sets, Brandt failed to find support for the hypothesis that members of low status groups will justify the system more than high status group members, particularly when inequality is high or when people have many civil liberties (i.e., contexts where people could feel responsible for failing to act in ways that would improve the status of their group). As such, Brandt’s findings call into question the robustness of one of System Justification Theory’s central claims.
In this article, we aim to contribute to this debate by providing an arguably more definitive test of System Justification Theory. Specifically, we argue that the recent global recession should have increased people’s motivation to justify the system particularly among disadvantaged group members. One way in which such a motivation could be actualized is through the endorsement of a conservative ideology. Indeed, Jost, Glaser, et al. (2003) argue that conservatism consists of two central components: (a) resistance to change and (b) acceptance of inequality. As such, the endorsement of a conservative ideology may be particularly attractive to those exposed to volatility within the economy, given the sense of stability provided by conservatism (Jost, Nosek, & Gosling, 2008). Accordingly, we argue that the poor (i.e., those particularly disadvantaged by the system) will experience a greater increase in political conservatism than their advantaged counterparts during the 4 years after the onset of the global recession.
Political Orientation Across the Life Span
In addition to testing specific predictions derived from System Justification Theory, our data provide us with the opportunity to contribute to the literature on the development, stability, and change in people’s political attitudes across the life span (see Alwin, Cohen, & Newcomb, 1991; Alwin & Krosnick, 1991; Jennings & Markus, 1984). Beginning with the seminal work by Newcomb (1965), research has shown that political ideology is relatively malleable in early adulthood, followed by a period of remarkable stability (Alwin et al., 1991)—a pattern of change that has since been formalized as the impressionable years hypothesis (Alwin & Krosnick, 1991; Jennings & Markus, 1984; Osborne, Sears, & Valentino, 2011; Sears & Funk, 1999). Coupled with studies showing notable genetic influences on socio-political attitudes and party identification (Alford, Funk, & Hibbing, 2005; Hatemi et al., 2009), the extant literature suggests that political orientation should be stable and resistant to dramatic change following one’s formative years.
Some findings do, however, cast doubt on the generalizability of the impressionable years hypothesis by showing that people are susceptible to attitude change across the life span (Visser & Krosnick, 1998; also see Krosnick & Alwin, 1989). Moreover, most of the research providing support for the impressionable years hypothesis has been conducted in the United States using non-representative cohort studies (e.g., Alwin & Krosnick, 1991; Sears & Funk, 1999) or cross-sectional analyses (e.g., Osborne et al., 2011). As such, relatively few studies have employed nationally representative samples to examine stability and change in political orientation within a longitudinal framework (let alone in a multi-party system). Thus, a secondary aim of the current study is to contribute to this literature by assessing differences in the stability and change of political orientation within a large national probability longitudinal panel study.
The Present Study
The present study seeks to contribute to the literature by answering the central question of who experiences change in their levels of conservatism following a period of salient economic threat. Specifically, we analyze data from a nationally representative panel study of New Zealanders to investigate the patterns of stability and change in people’s political orientation during the 4 years since the 2007/2008 economic recession. In doing so, we develop longitudinal models to examine the following two components of stability: (a) mean-level change and (b) rank-order stability. Our estimates of mean-level change thus represent change trajectories in political orientation during a period of considerable economic threat—a feature that, until now, was notably absent from the literature.
We construct a Bayesian latent growth model to assess mean-level change in conservatism. In doing so, we examine differences in change trajectories across this 4-year period as a function of participants’ (a) socio-economic status, (b) gender, and (c) age. To complement this approach, we also develop a Bayesian model of rank-order stability to examine the distribution of stability coefficients over our 3-year test-retest period (2009 to 2012). This additional model tests for the linear, curvilinear, and cubic effects of age, as well as the effects of gender and socio-economic status, on the stability of political orientation.
These models provide a critical test of System Justification Theory. Specifically, System Justification Theory would suggest that change trajectories should vary as a function of people’s socio-economic status. Because people of low socio-economic status were particularly affected by the global recession in New Zealand, those who are socio-economically disadvantaged should show a greater increase in political conservatism than their advantaged counterparts (see Jost et al., 2004). Our models of the rank-order stability of political conservatism also allow us to examine the possibility that people’s levels of conservatism become increasingly stable from young adulthood toward middle age, thereby providing a formal test of the impressionable years hypothesis (e.g., Sears & Funk, 1999; Visser & Krosnick, 1998).
Methods
Participants and Sampling Procedure
The analyses reported here are based on data from the NZAVS, a New Zealand-based national panel study that has been assessing people’s socio-political attitudes annually since 2009. Time 1 (2009) of the NZAVS contained responses from 6,518 participants who were sampled from the 2009 New Zealand electoral roll (i.e., a national registry of voters; registration on the electoral roll is compulsory in New Zealand). The Time 2 (2010) sample contained responses from 4,442 participants (4,423 of whom were from the initial Time 1 sample; a retention rate of 67.9% over 1 year). Time 3 (2011) of the NZAVS contained responses from 6,884 participants (3,918 retained, 2,965 new participants from an additional booster sample) and the Time 4 (2012) sample contained responses from 12,183 participants (6,805 retained from one or more previous wave; 5,378 new additions from booster sampling via the electoral roll).
In terms of sample retention, the sample at Time 4 contained 4,051 participants retained from Time 1 (a retention rate of 62.2% over 3 years), 3,464 participants retained from Time 2 (a retention rate of 78% over 2 years), and 5,762 participants from Time 3 (a retention rate of 83.7% from the previous year). 1
Due to different requirements associated with our modeling specifications, our two models were estimated using different sample sizes. Our Bayesian latent growth model was estimated using data from 5,091 participants (60.4% women) who responded to the relevant variables in at least two of the four time points. The average age for this subset of the sample was 49.195 (SD = 15.260), 84.5% (n = 4,303) identified as European, and 43.7% identified as religious (n = 2,224; 110 did not answer the question on religious identification). 2 In other words, every participant for whom a slope and an intercept could be estimated was included in this model. Because latent growth models estimate random effects to identify trajectories of change, the contribution of participants’ data to the overall slope and intercept was weighted based on the reliability of their data. As such, there is no need to impute missing data. Rather, those who responded to more than two waves provided more information to the model than those who only responded to two waves. We treated all missing data as missing-at-random.
In contrast to the sample size for our latent growth model, our Bayesian rank-order stability model was estimated using data from the 3,567 participants (60.6% women) who responded to the relevant variables used to assess political orientation, socio-economic status, gender and age. The average age of this subset of the sample was 49.690 (SD = 14.502), 87.3% (n = 3,114) identified as European, and 44.1% identified as religious (n = 1,573; 56 did not answer the question on religious identification). For descriptive purposes, Table 1 presents the size of our sample for every 5-year age cohort beginning at 25 and ending at 75. Sample size restrictions prevented us from estimating slopes for age values outside of this range. Note, however, that both of our models were estimated using the full respective samples. Our formal statistical models thus provide conditional estimates for each age within the 25 to 75 year age range.
Sample Size Across the Age Range Split Into 5-Year Cohorts for Clarity.

Note. People in the age range from 25 to 75 comprise 89.6% (n = 4,559) of the full (n = 5,091) sample of participants who responded to at least two time points. The models were conducted using the full sample. The conditional estimates were calculated for people aged from 25 to 75.
Questionnaire Measures
Political orientation was assessed using a single item that asked participants to report their political orientation on a 1 (Liberal) to 7 (Conservative) scale. Participants also reported their gender (0 = female, 1 = male) and age (in years).
To assess socio-economic status, we measured the affluence of participants’ immediate (small area) neighborhood using the New Zealand Deprivation Index (NZDep; Salmond, Crampton, & Atkinson, 2007). New Zealand is unusual in having rich census information about each area unit/neighborhood of the country that is available for research purposes. The smallest of these area units are meshblocks. The NZAVS includes the meshblock code for each participant.
Statistics New Zealand (2013) defined a meshblock as
a defined geographic area, varying in size from part of a city block to large areas of rural land. Each meshblock abuts against another to form a network covering all of New Zealand including coasts and inlets, and extending out to the two hundred mile economic zone. Meshblocks are added together to “build up” larger geographic areas such as area units and urban areas.
The geographic size of these meshblock units differs depending on population density, but each unit tends to cover a region containing a median of roughly 90 residents (M = 103, SD = 72, range = 3-1,431). In 2013, at the time of the latest census, there were a total of 46,637 meshblocks in New Zealand.
The 2006 NZDep (Salmond et al., 2007) uses aggregate census information about the residents of each meshblock to assign a decile-rank index from 1 (most affluent) to 10 (most impoverished) to each meshblock unit. Because it is a decile-ranked index, meshblocks that receive a score of 1 are more affluent than 90% of the country, meshblocks that receive a score of 2 are more affluent than 80% of the country, and so on. Scores on this index are based on a principal components analysis of the following nine variables (in weighted order): (a) proportion of adults who receive a means-tested benefit, (b) household income, (c) proportion who do not own their home, (d) proportion who are single-parent families, (e) proportion who are unemployed, (f) proportion who are lacking qualifications (i.e., low educational status), (g) proportion who live in a crowded household, (h) proportion with no telephone access, and (i) proportion with no car access. The NZDep thus reflects the average level of deprivation for small neighborhood-type units (or small community areas) across the entire country and is a well-validated measure used in health research and planning by government and local councils (see Salmond & Crampton, 2012; White, Gunston, Salmond, Atkinson, & Crampton, 2008). 3
Model Estimation Methods
Bayesian Latent Growth Model
To test mean-level change in political orientation over the four annual assessments, we developed a latent growth model using Bayesian estimation procedures. A schematic overview of our model is presented in Figure 1. The latent growth model estimates the latent intercept (i) and the latent slope (s) from the four repeated measurements of our manifest items (i.e., political orientation, as assessed in 2009, 2010, 2011, and 2012) which are modeled as random effects. To do this, loadings on the intercept were constrained to 1 at each measurement point. Thus, the intercept and its variance reflect the variability in the mean level of political conservatism at the first assessment period (i.e., 2009) across participants in our sample.

Schematic overview of the Bayesian Latent Growth Model.
The latent slope was specified as a growth factor starting at Time 1. As such, the loadings on the latent slope were constrained to 0 for the first measurement point and fixed to 1, 2, and 3 for the three subsequent measurement points (i.e., Times 2-4). This specification estimates the slope as a growth factor with the intercept at Time 1 and equidistant repeated assessments (i.e., our roughly annual assessment time frame). Thus, the slope represents the trajectory of mean-level change, whereas the variance of the latent slope represents individual variation across participants in our sample.
To test the effects of age, gender and neighborhood deprivation on mean-level change in political orientation across time, the covariates depicted in Figure 1 were incorporated into our model. Each covariate (except gender, which was dummy-coded) was mean-centered and included in an integrated regression model predicting both the latent (a) intercept and (b) slope. Reliable effects of the covariates on the latent intercept thus indicate that individual differences on the given variable account for some of the variance in participants’ initial levels of political conservatism at Time 1. Similarly, a reliable effect of a covariate on the latent slope indicates that the differences on the given variable account for some of the between-participant variance in the rate of mean-level change in political conservatism over the four annual assessments. 4
Where reliable effects were observed, we estimate conditional values of the latent intercept and the latent slope at conditional values of the covariate (e.g., every age from 25 to 75). We used these conditional parameters to estimate the latent growth trajectories at the conditional values of the covariate (e.g., age) to graphically present individual variation in the trajectories of mean-level change in political orientation.
By using a Bayesian approach, we are able to estimate a posterior distribution for each of the parameters, as well as the associated 95% credible intervals (i.e., the interval that contains the most likely parameter value in the population). Relative to frequentist models that utilize standard null-hypothesis tests, Bayesian credible intervals provide a more intuitive and informative indication of the likely distribution for each parameter. Bayesian credibility estimates also include information about the accuracy of the parameter estimate for the population of interest, whereas the resulting p values reflect the proportion of the posterior distribution for a given parameter that overlaps with zero (for further reviews and discussion on Bayesian estimation techniques, see Gelman, Carlin, Stern, & Rubin, 2003; also see Kruschke, Aguinis, & Joo, 2012). In this article, we estimate posterior distributions and 95% credible intervals for each parameter, as well as those for each of our conditional parameters.
Bayesian Rank-Order Stability Model
Extending our earlier work on the stability of personality (Milojev & Sibley, 2014), we also assessed the stability of political orientation across time. To do this, we specified an integrated Bayesian moderated regression model testing the effect of political orientation in 2009 on political orientation in 2012. Such a procedure allows us to estimate a rank-order stability coefficient for political conservatism (i.e., a measure of the stability of conservatism across our four annual assessments). In addition to estimating the effects of gender and socio-economic status on the stability of conservatism, our model included terms assessing the linear, quadratic, and cubic effects of age, as well as their interaction terms with political orientation (as assessed in 2009), on participants’ political orientation in 2012. Before creating these interaction terms, all of our exogenous variables were centered (with the exception of gender, which was dummy-coded) to avoid issues of multi-collinearity and to provide meaningful estimates of our conditional parameters. In doing so, we estimate constrained stability coefficients for Age × Political orientation interaction terms at every point in the available age range (i.e., 25 to 75 years old). Thus, we estimate the continuous effect of age on the rank-order stability of political orientation across a 3-year period. To obtain stability coefficients that are comparable across our predictors, all of the estimated parameters were standardized based on the standard deviations of x and y.
To estimate conditional stability coefficients (including both the linear, quadratic, and cubic effects of age) at each point in the available age range, we specified the following simple slope (s25-75):

where za refers to the standardized effect of political orientation at Time 1 on political orientation at Time 4; zab refers to the standardized Age × Political orientation interaction effect; zabb refers to the standardized Age2 × Political orientation interaction effect; zabbb refers to the Age3 × Political orientation interaction effect of age; and A25-75 refers to the conditional age values (using a centered age variable) for each point from 25 to 75 years old. Therefore, the model estimated 50 standardized simple slopes reflecting the distribution of the 3-year stability coefficients across the adult life span and integrated the linear, curvilinear, and cubic effects of age on the rank-order stability of political orientation. Furthermore, the conditional stability coefficients for men and women, as well as those for participants who were of high and low socio-economic status, were estimated in cases where a moderation effect was observed.
Results
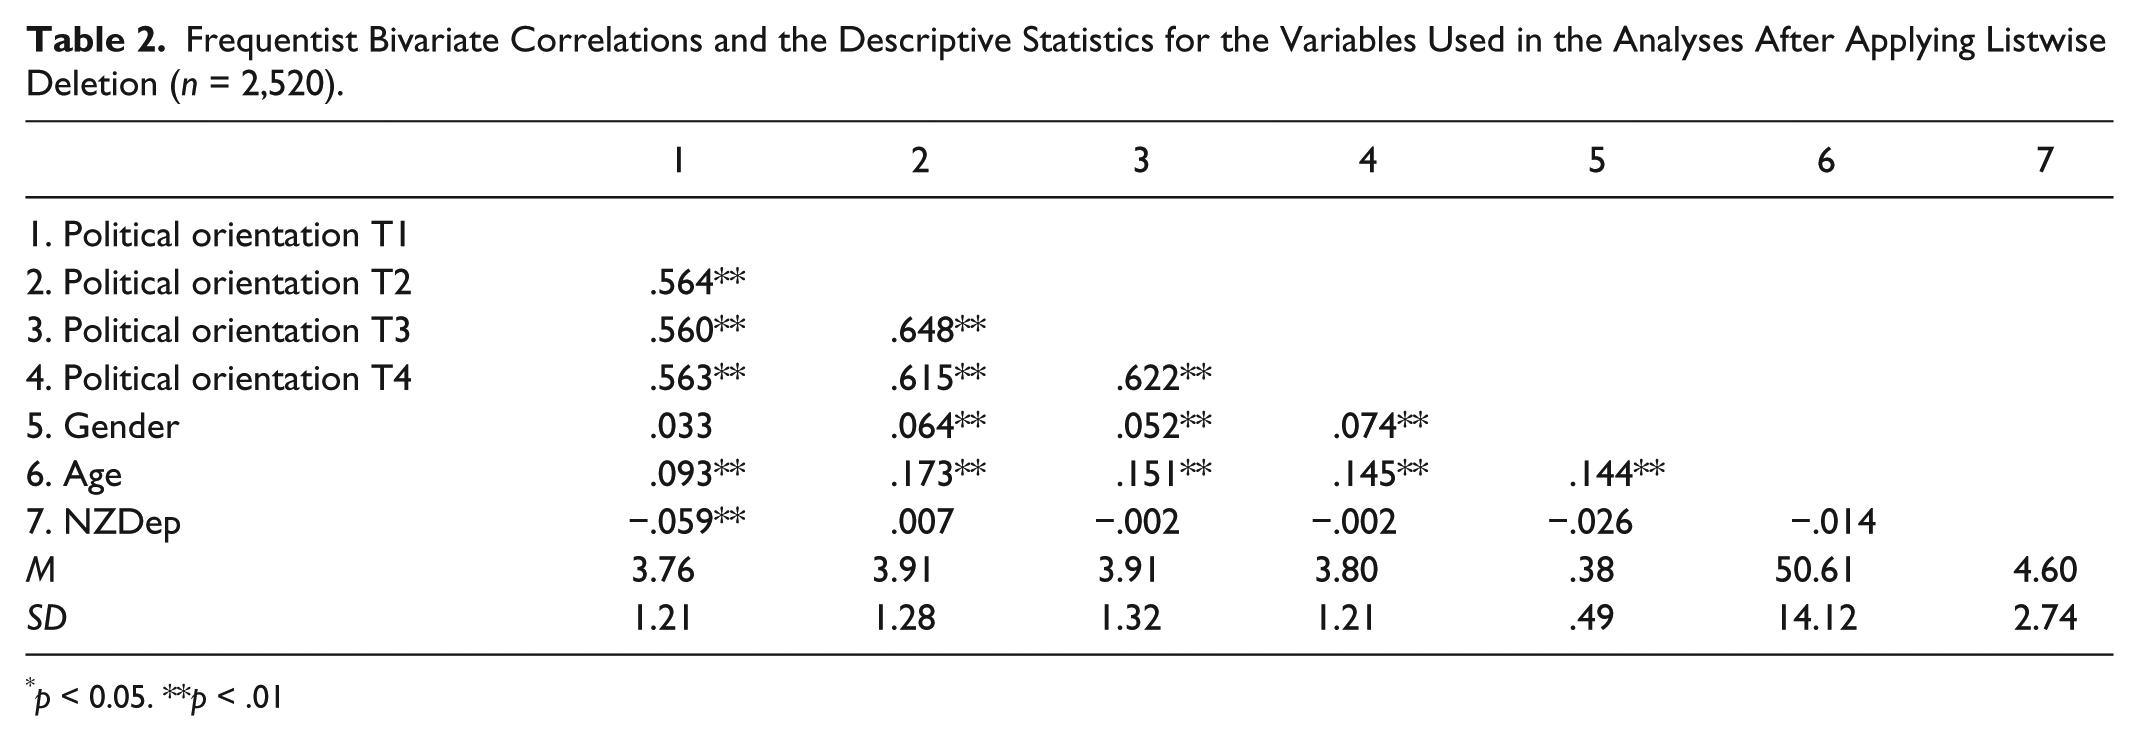
Bivariate correlations and the descriptive statistics for the variables of interest are presented in Table 2. 5
Frequentist Bivariate Correlations and the Descriptive Statistics for the Variables Used in the Analyses After Applying Listwise Deletion (n = 2,520).
p < 0.05. **p < .01
Latent Growth Model
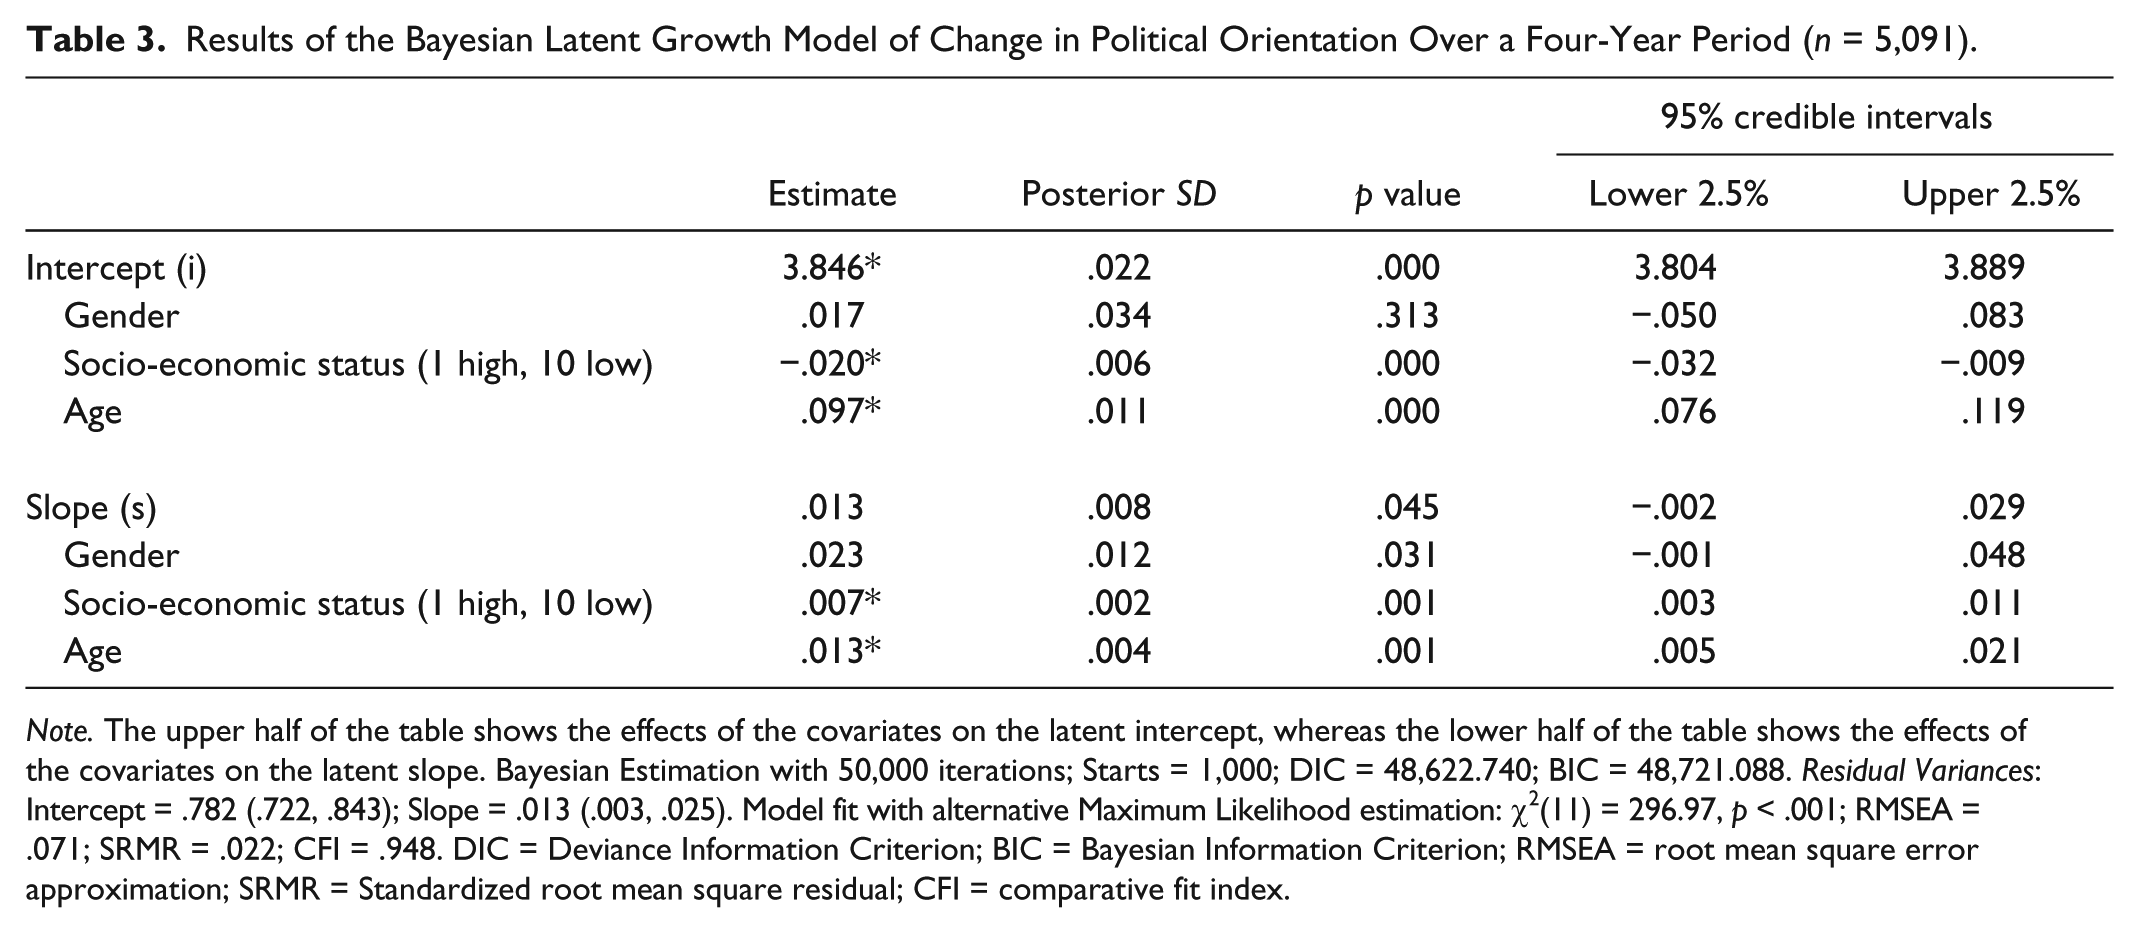
Table 3 presents the Bayesian posterior distributions for the parameters of our latent growth model testing mean-level change in political orientation over the four annual assessments. 6 As shown here, the overall mean level of political conservatism at Time 1 was 3.846, whereas the mean slope for the sample was b = .013. The estimated mean slope indicates that, in general, participants became slightly more conservative over the 4 years following the global recession. Nevertheless, because the 95% credible interval around this parameter estimate included 0 (i.e., 95% credible interval = [−0.002, 0.029]), the slight increase in conservatism over time was unreliable. Indeed, inspection of the p value indicates that about 5% of the distribution of the parameter values fell below 0 (i.e., p = .045).
Results of the Bayesian Latent Growth Model of Change in Political Orientation Over a Four-Year Period (n = 5,091).
Note. The upper half of the table shows the effects of the covariates on the latent intercept, whereas the lower half of the table shows the effects of the covariates on the latent slope. Bayesian Estimation with 50,000 iterations; Starts = 1,000; DIC = 48,622.740; BIC = 48,721.088. Residual Variances: Intercept = .782 (.722, .843); Slope = .013 (.003, .025). Model fit with alternative Maximum Likelihood estimation: χ2(11) = 296.97, p < .001; RMSEA = .071; SRMR = .022; CFI = .948. DIC = Deviance Information Criterion; BIC = Bayesian Information Criterion; RMSEA = root mean square error approximation; SRMR = Standardized root mean square residual; CFI = comparative fit index.
More important for our purposes is our covariates’ ability to explain the variance in our random effects (i.e., the intercept and the slope). To these ends, our results indicated that participants’ gender was unassociated with the variance in the intercept of our growth model (95% credible interval = [−0.050, 0.083]). Similarly, gender was unassociated with variability in the estimated slope of our growth model (95% credible interval = [−0.001, 0.048]). Nevertheless, both neighborhood deprivation and age were associated with the variance in both the intercept and slope of our model. Specifically, higher levels of neighborhood deprivation were associated with lower levels of political conservatism at Time 1 (b = −.020, 95% credible interval = [−0.032, −0.009]). As predicted, however, higher levels of neighborhood deprivation were also associated with increases in political conservatism over the four repeated assessments (b = .007, 95% credible interval = [0.003, 0.011]). That is, those who were most disadvantaged became more conservative across the 4 years post the global recession. Finally, our analyses indicated that age was positively associated with political conservatism at Time 1 (b = .097, 95% credible interval = [0.076, 0.119]), as well as increases in levels of political conservatism over the four repeated assessments (b = .013, 95% credible interval = [0.005, 0.021]).
To further investigate the effects of age on our growth model, the conditional values for both the latent (a) intercept and (b) slope were calculated for every conditional value of age from 25 to 75. These estimates are presented in Figure 2. The top left panel shows the conditional intercept across the age range with 95% credible intervals around each point estimate. As shown, mean levels of political conservatism increase with age. In contrast, the top right panel shows the conditional values of the latent slope across the age range with 95% credible intervals around each point estimate. This figure shows that the most probable estimated value for the conditional slope among people aged 25 to 52 is negative. Nevertheless, this slight decrease in conservatism across time is unreliable given that the 95% credible intervals for each of these point estimates include 0.
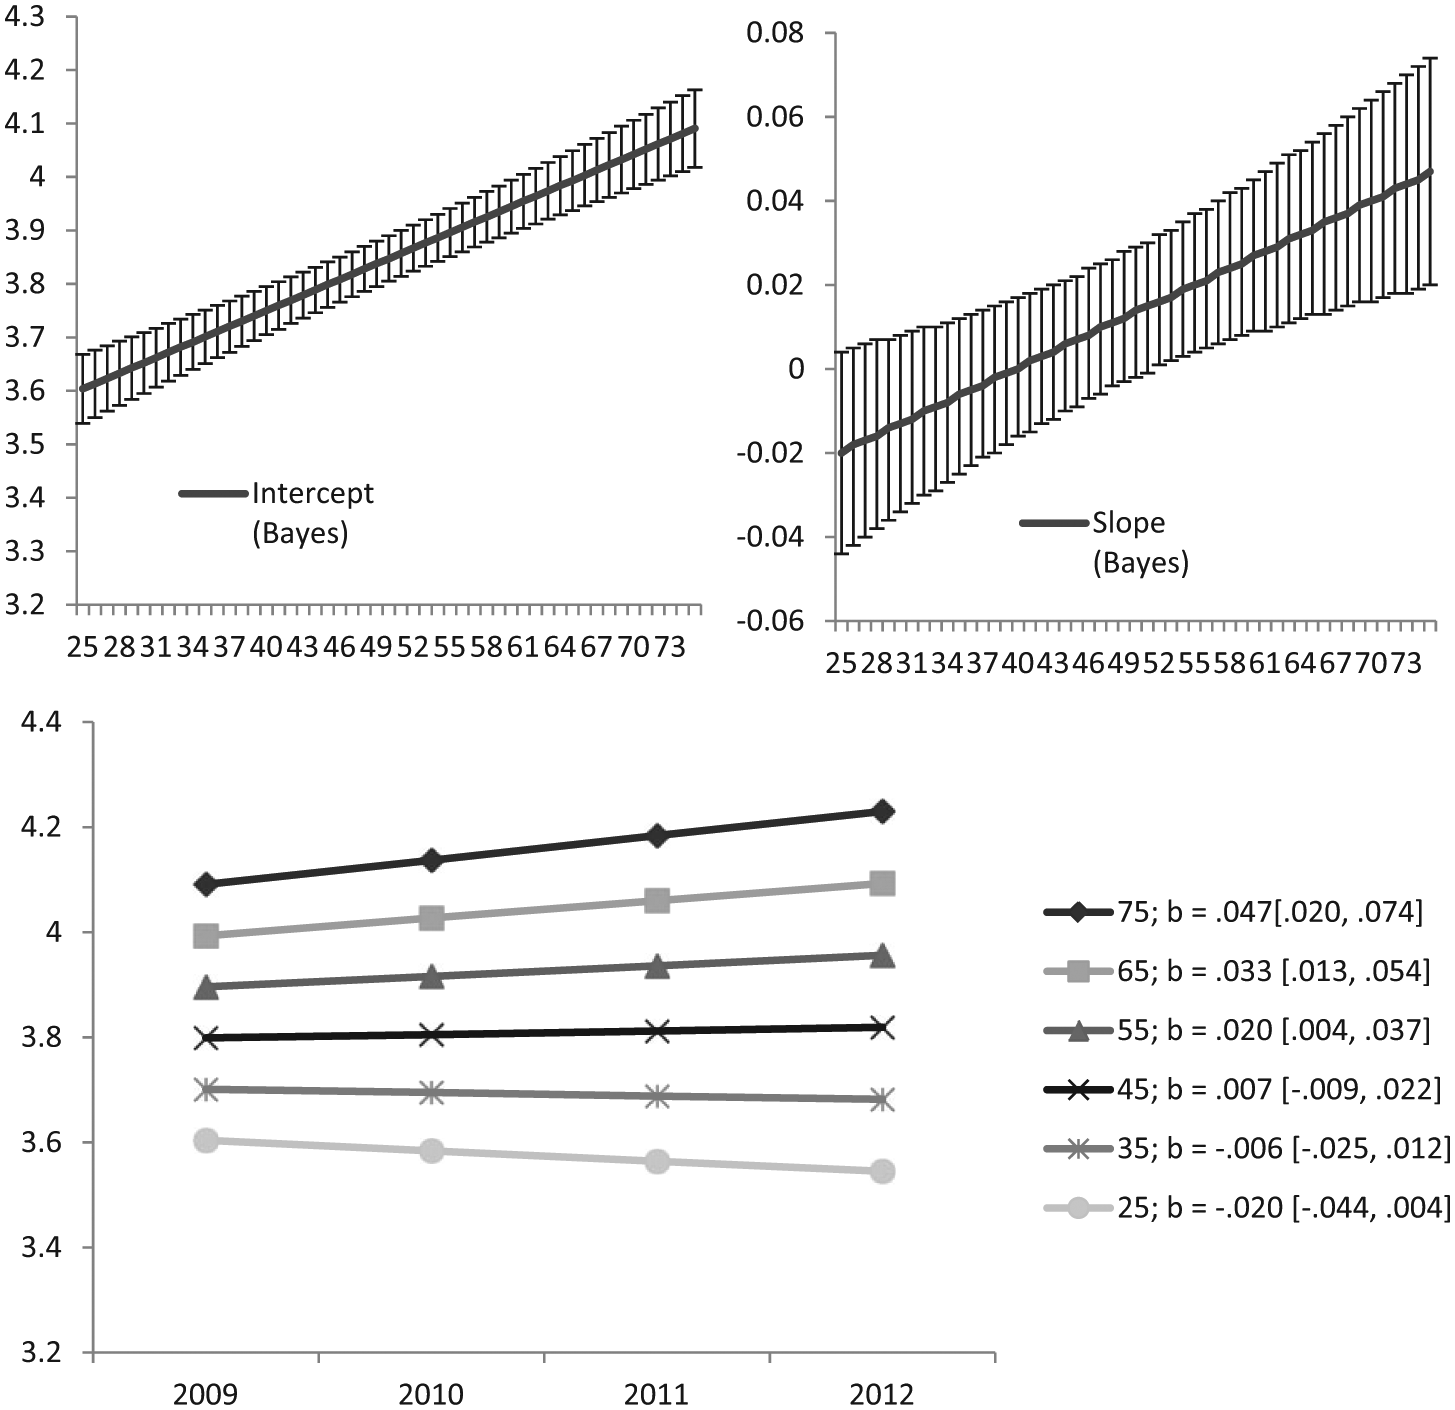
Latent growth trajectories of political orientation over the four repeated assessments at conditional points in the age range.
The results for participants aged 52 and older are notably different from their younger counterparts. Specifically, the conditional slope estimates for rates of change in levels of conservative are positive and reliable (i.e., 95% credible intervals do not include 0) for participants in the former age range. Moreover, the size of the slope appears to increase in magnitude with age. Thus, people’s levels of political conservatism did not change among those who were younger than 52, but those who were 52 and older experienced a notable increase in their levels of political conservatism over time. These relationships are presented in the bottom panel of Figure 2, which shows the full conditional growth trajectories at the conditional values of age (25, 35, 45, 55, 65, and 75).
The same process noted above was used to calculate the conditional growth trajectories in political conservatism at high and low levels of neighborhood deprivation. 7 As shown in Figure 3, those who lived in neighborhoods with low deprivation (i.e., high affluence) had consistent levels of political conservatism across time. Conversely, those who lived in neighborhoods with high deprivation (i.e., low affluence) were less conservative than their affluent counterparts at Time 1. Over time, however, people living in neighborhoods with high levels of deprivation experienced a reliable linear increase in their levels of conservatism, reaching the same levels of conservatism found among those living in more affluent neighborhoods by the end of the 4-year assessment period.
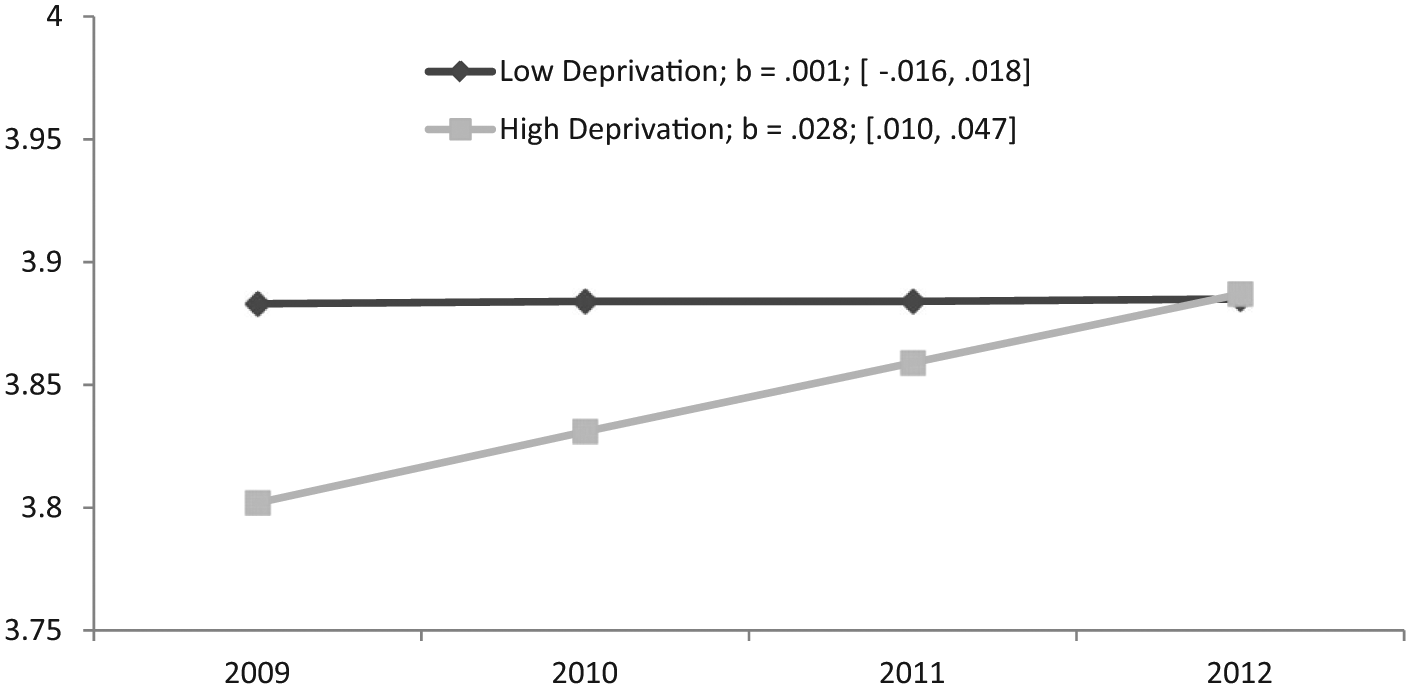
Conditional latent growth trajectories of political orientation at high and low neighborhood deprivation.
Rank-Order Stability
Table 4 presents the standardized Bayesian point estimates, posterior SDs, and the 95% credible intervals for the estimated rank-order stability coefficients as a function of our covariates (i.e., gender, neighborhood deprivation, and the linear, quadratic, and cubic effects of age). The estimated stability coefficients for political orientation over the 3 year assessment period is β = .550 with a relatively narrow 95% credible interval [0.510, 0.588]. Importantly, neighborhood deprivation had a reliable effect on the rank-order stability of political orientation (β = −.054, 95% credible interval = [0.002, 0.058]), as did the linear (β = −.069, 95% credible interval = [−0.123, −0.014]), quadratic (β = −.038, 95% credible interval = [−0.075, −0.002]), and cubic (β = .061, 95% credible interval = [0.006, 0.115]) terms for age. Gender, however, was unassociated with the stability of political conservatism across our annual assessments (i.e., β = −.012), as the 95% credible interval for the most probable parameter estimate included 0 [−0.048, 0.024]. Indeed, the effect of gender on the stability estimate of conservatism had a high one-tailed p value of .252, indicating that over 25% of the posterior distribution of the probable values of this parameter were estimated to be above 0 (i.e., opposite to the most probable parameter value). Finally, estimation of the conditional stability coefficients at high and low levels of neighborhood deprivation indicated that the stability of political orientation was lower among those living in deprived neighborhoods (β = .507, 95% credible interval = [0.459, 0.556]) relative to those living in affluent neighborhoods (β = .586, 95% credible interval = [0.539, 0.633]).
Moderation Model With Bayesian Estimates of the Stability Coefficients for Political Orientation (n = 3,567).
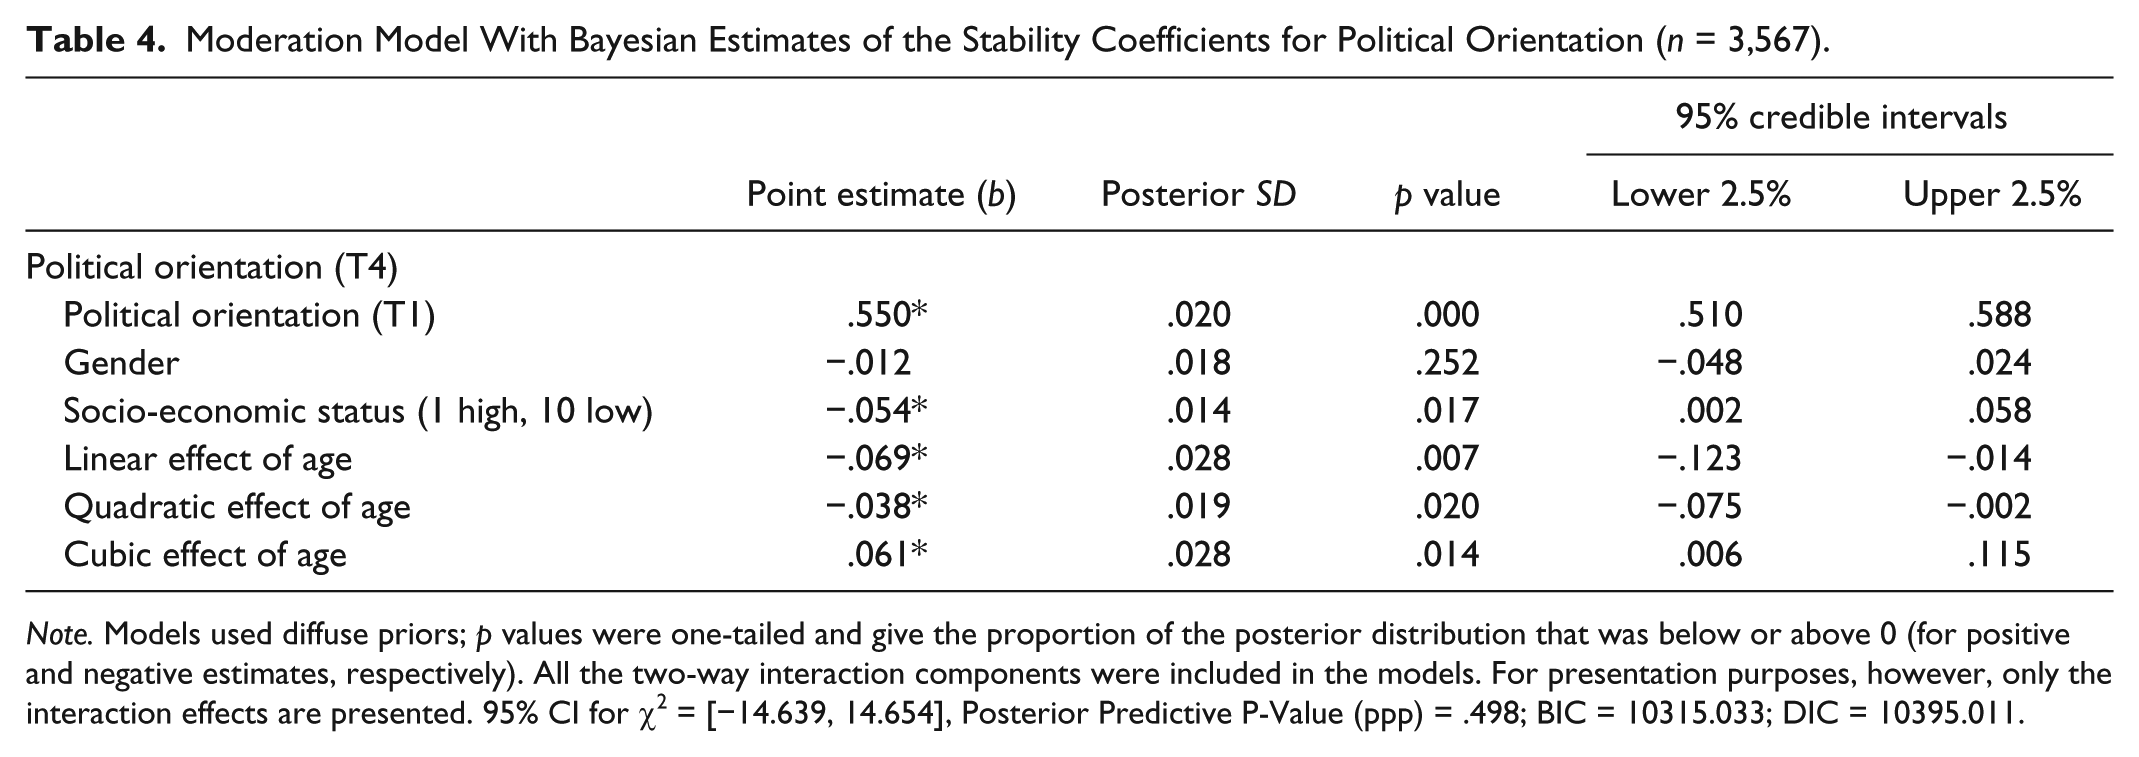
Note. Models used diffuse priors; p values were one-tailed and give the proportion of the posterior distribution that was below or above 0 (for positive and negative estimates, respectively). All the two-way interaction components were included in the models. For presentation purposes, however, only the interaction effects are presented. 95% CI for χ2 = [−14.639, 14.654], Posterior Predictive P-Value (ppp) = .498; BIC = 10315.033; DIC = 10395.011.
To further examine the distribution of the stability of political orientation across the life span, we calculated conditional stability estimates for each age falling between 25 and 75 years old. This estimate integrated the linear, quadratic, and cubic effects of age on our stability coefficient (see Figure 4). As shown here, age also had a cubic relationship with the stability of political orientation across the different age cohorts. These analyses indicate that the stability of political orientation across 3 years was relatively low among young adults, though these stability estimates tended to increase at a decelerating rate among those between 25 and 39 years old. The stability of political orientation among those who were in their late-30s to mid-60s at the start of the study, however, shows very little change across these 3 years. Finally, the rank-order stability of political orientation shows another increase among those who were around 65 years old (i.e., retirement age in New Zealand) at the start of the study.
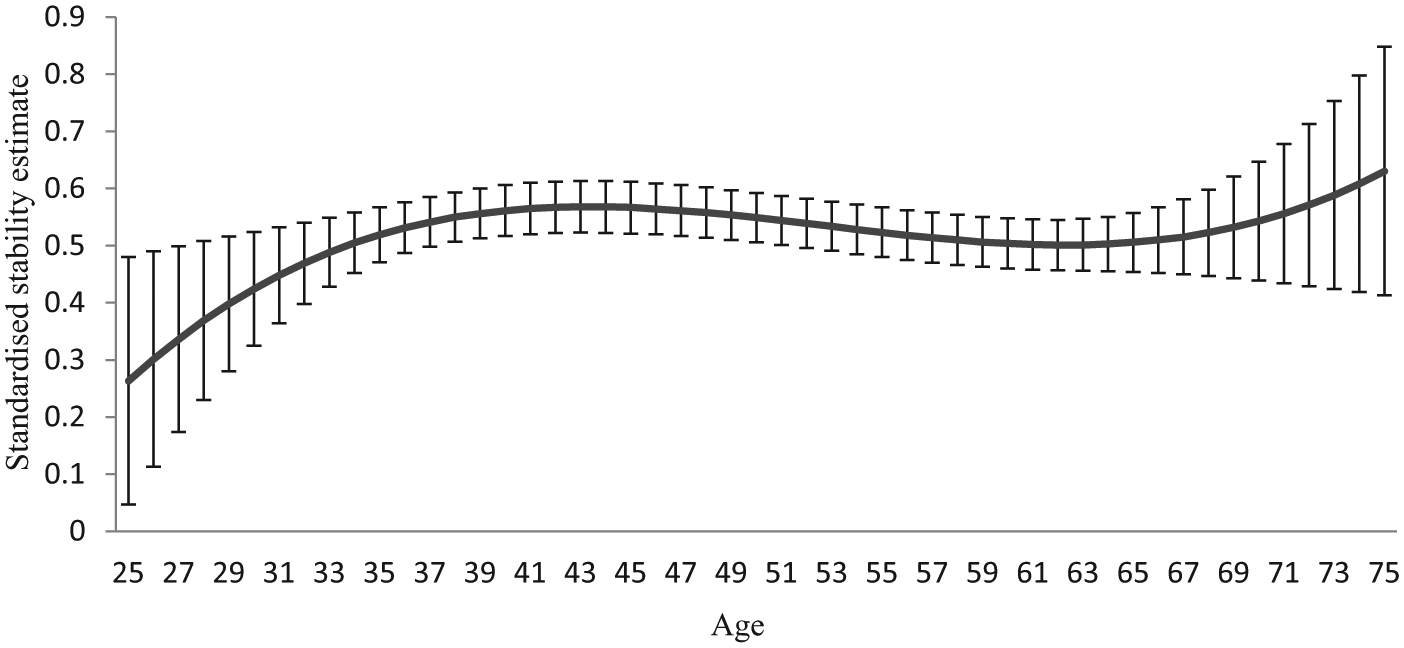
The 3-year standardized Bayesian stability coefficients across the 25 to 75 age span with 95% credible intervals around each point estimate.
Discussion
The central aim guiding this investigation was to model differential patterns of change in political orientation to identify whose levels of political conservatism changed during the 4 years immediately following the 2007/2008 recession. Drawing on System Justification Theory (Jost et al., 2004), we argued that the heightened salience of threat brought about by the global recession would produce differential developmental trajectories between those who are more (vs. less) disadvantaged in society. Specifically, those who were of a lower socio-economic status were expected to show a larger increase in political conservatism in the 4 years post the recession relative to their counterparts who were of a higher socio-economic status.
To these ends, our analyses indicated that people who were of a low socio-economic status were more liberal than those who were of high socio-economic status in 2009. These findings are consistent with Brandt’s (2013) argument that the disadvantaged are not particularly inclined to justify the system. This is not, however, the whole picture painted by our data. Specifically, our results indicated that those who were of a low socio-economic status experienced a reliable increase in political conservatism over our four annual assessments. In contrast, those who were of a high socio-economic status remained largely unchanged in their levels of political conservatism. These results are consistent with our predictions and reveal that only those who were disadvantaged became more conservative during the post-recession period. The wealthy remained more conservative regardless. Our Bayesian rank-order stability model also indicated that political orientation was less stable among the poor (vs. wealthy).
These findings suggest that the poor increased their support for conservative political beliefs in the wake of the recent economic crisis. Because the core tenets of conservatism focus on resistance to change and the acceptance of inequality (see Jost, Glaser, et al., 2003), a conservative belief system may provide people with the stability needed to satisfy their needs for order and structure—needs that would undoubtedly become salient during such a large-scale recession. For those who are already disadvantaged in society (i.e., the poor), these needs should be particularly salient. As such, the poor should be more likely than the wealthy to increase their levels of conservatism during times of economic uncertainty and upheaval. Specifically, by endorsing system-justifying ideologies like conservatism, the poor would be able to reduce the dissonance between their motivation to see their group in a positive light and their desire to see society as fair (Jost, Glaser, et al., 2003; Jost & Hunyady, 2005). Indeed, our results indicated that the swing toward conservatism was solely located among those who were poor (i.e., the wealthy in our sample did not experience a change in their levels of political conservatism over time). As such, our findings are consistent with System Justification Theory and demonstrate that the proposed processes operate in a disadvantaged subpopulation during a salient socio-economic crisis.
Although our findings are consistent with System Justification Theory, it is important to consider some alternative explanations. Specifically, research suggests that a conservative political ideology can be separated into economic and social dimensions (Conover & Feldman, 1981; Jost, Federico, & Napier, 2009). As such, the poor’s tendency to become more conservative over time may be motivated by their desire to limit the amount of economic competition brought about by liberal immigration policies—policies that are typically opposed by conservatives (e.g., Esses, Jackson, & Armstrong, 1998; Sidanius & Pratto, 1999). Alternatively, the observed increase in conservatism among the disadvantaged may reflect increased concerns over the need for in-group cohesion and norm enforcement (i.e., social conservatism)—needs that are likely to be salient during threatening times (see Duckitt, 2001). Thus, while our findings are consistent with System Justification Theory, additional research is needed to rule out these alternative explanations.
Stability and Change Across Cohorts
Research shows that there is considerable stability in political attitudes and party identification across the life span—particularly after people mature past their impressionable years. Specifically, people’s political orientation should be partly malleable during early adulthood, but is likely to become relatively stable once people reach middle adulthood (Alwin et al., 1991; Alwin & Krosnick, 1991; Jennings & Markus, 1984; Sears & Funk, 1999). Nevertheless, there is a relative lack of studies investigating patterns of change across the life span (for exceptions, see Krosnick & Alwin, 1989; Visser & Krosnick, 1998). Even fewer studies have examined these processes using data from a national panel study conducted in a multi-party political system.
The current study addressed these oversights by examining levels of stability and change in political orientation within a national probability sample of New Zealand adults. Notably, our results both corroborate and extend the extant literature on the impressionable years hypothesis. Specifically, we observed a curvilinear relationship between age and the rank-order stability of conservatism such that there were relatively low—albeit increasing—levels of stability in political orientation among those in their mid-20s to late-30s, followed by an extended period of stability among those in their late-30s to mid-60s. What is particularly new about our findings, however, is the noted increase in levels of stability among those in their mid-60s and older. In other words, our data indicate that the crystallization of political attitudes over the life span is a non-linear process that experiences a subtle boost in stability toward people’s twilight years (also see Krosnick & Alwin, 1989; Visser & Krosnick, 1998).
Another interesting finding that emerged from the current study was that the overall stability estimate for political orientation (β = .550) was lower than the high stability estimates reported in previous research (e.g., Sears & Funk, 1999). In considering this discrepancy, it is important to note that our model tests the stability of people’s general ideological orientation within a multi-party political system. Past research, however, has typically examined the stability of party identification within two-party systems. Given the unique historical context of the New Zealand political landscape, a simple liberal–conservative ideological orientation may be less relevant than party identification is in other countries (e.g., Sibley, 2010).
The Bayesian latent growth model developed in the current study provides a unique picture of the different trajectories of mean-level change in political orientation over a 4-year period. Specifically, our growth models allow us to detect systematic increases or decreases in political conservatism across different age cohorts. Our findings indicate that those in the older cohorts had higher levels of political conservatism than their younger counterparts at the initial measurement (i.e., 2009). More interestingly, in the subsequent 4 years, people’s levels of political conservatism were largely unchanged among those who were under ~50 years old. On the other hand, people who were aged 52 and older showed an increase in political conservatism across these same 4 years. Thus, our findings suggest that older people’s ideology became more stable, albeit more conservative, across time.
Strengths, Caveats, and Future Directions
The current study has several important strengths that provide notable contributions to the extant literature. For one, our use of a nationally representative panel study allows us to examine stability and change in political conservatism across a broad range of cohorts and socio-economic statuses, while also ensuring that our findings generalize to the New Zealand population. Also, the use of a sample from New Zealand provides further insights into the stability and change in political conservatism within a multi-party system—a topic that has been relatively absent from the extant literature.
Although the sample itself is unique, the timing and design of the NZAVS means that our longitudinal time frame includes the recent major economic recession in New Zealand (2008-2010) and a brief period of recovery (2011-2012; The Treasury, 2014). Thus, the timing of our study provided us with a rare opportunity to document population changes in political orientation during—and after—a global recession. As such, rather than merely presenting a comprehensive investigation of the rank-order stability of, and mean-level change in, political orientation within a national sample, the present study provides unique insight into the longitudinal patterns of socio-political responses to economic threat as a function of people’s socio-economic status and age.
The modeling strategy employed here also allows us to test two central components of stability: (a) rank-order stability and (b) mean-level change. As such, the current study provides one of the most comprehensive and rigorous investigations of the stability of political orientation to date. The analytic strategy itself—the use of Bayesian estimation procedures to develop the rank-order stability and latent growth models—provides considerable advantages in terms of the reliability and interpretability of the findings, as well as its predictive (rather than simply descriptive) utility.
Despite these strengths, several limitations of our study highlight the need for future research. Specifically, the measure of political orientation used in the current study was a single-item self-report measure of political ideology. As such, our measure overlooks the possibility that political ideology may be a multi-dimensional construct that varies across multiple axes (e.g., social and economic domains; see Conover & Feldman, 1981). In addition, most of the previous research has examined stability and change in party identification (rather than broad ideological preferences). Therefore, an important direction for future research would be to examine stability and change in a broader range of socio-political ideologies.
Another limitation to the current study focuses on our operationalization of participants’ socio-economic status. Specifically, we used the NZDep (see Salmond et al., 2007) to assess the degree to which participants were disadvantaged in society. As discussed above, the NZDep reflects the average level of deprivation for small neighborhood-type units (or small community areas) across the entire country. As such, the measure provides a rare wealth of information pertaining to socio-economic status that is central to the concerns of the present investigation. Indeed, the index is a well-validated measure of the level of deprivation found in small area units and has been widely used in health and social policy research examining numerous health outcomes, including mortality, rates of hospitalization, smoking, cot death, and access to health care (e.g., Salmond & Crampton, 2000; Crampton, Salmond, Woodward, & Reid, 2000). The index is also widely used in service planning by government and local councils, and is a key indicator used to identify high needs areas and allocate resources such as health funding (see Salmond & Crampton, 2012, White et al., 2008). Nevertheless, because this measure captures deprivation at the level of the neighborhood, it is difficult to ascertain whether the change in conservatism we observed among the disadvantaged was motivated by perceived threats to their group or to themselves. Indeed, the effect of participants’ socio-economic status on their changing levels of conservatism may reflect peoples’ concern for others in their community. Alternatively, the perceived threat brought about by the recession may be in relation to one’s own resources and prospects. Future research should aim to untangle these two competing explanations.
Finally, it should be noted that the current study relied on a relatively short longitudinal time frame (i.e., 4 years). While our test-retest period is notably shorter than those reported in past research (e.g., Sears & Funk, 1999), limitations associated with the current time frame are more apparent in terms of the recent economic recession. Specifically, although our research shows that the poor became more conservative during—and shortly after—the recession, the long-term trajectories of these changes in the wake of the economic recovery should be examined in future research. Indeed, it is possible that changes to people’s political ideologies may correspond with systematic changes in the local economy. Critically, our data suggest that the economic recovery may have different effects on the rates of change in conservatism based on people’s socio-economic status. Though our study shows a reliable pattern of change over a 4-year period, the change trajectory over the next 4 or more years remains to be seen.
Concluding Comments
The current study provides unique insights into the stability and change in political orientation following a major socio-political event. Consistent with System Justification Theory, our results show that the poorest and most disadvantaged in New Zealand experienced a reliable increase in their levels of conservatism in the wake of the 2007/2008 global financial crisis. Our results also provide support for the impressionable years hypothesis by showing that political orientation became increasingly stable among the young, maintained that level of stability during people’s 30s to mid-60s, and once again increased in stability as people entered their twilight years. By examining these crucial research questions within a longitudinal framework, we have provided a comprehensive analysis of who changed their levels of conservatism following the recession, as well as the pattern under which this process unfolded. Although we focused on a relatively narrow time frame (i.e., 4 years), we hope that the results presented in the current study provide the foundations for future research examining the longitudinal stability and change of political orientation across the life span.
Footnotes
Declaration of Conflicting Interests
The author(s) declared no potential conflicts of interest with respect to the research, authorship, and/or publication of this article.
Funding
The author(s) disclosed receipt of the following financial support for the research, authorship, and/or publication of this article: This research was supported by a Templeton World Charity Foundation Grant (ID: 0077).

Notes
References
Supplementary Material
Please find the following supplemental material available below.
For Open Access articles published under a Creative Commons License, all supplemental material carries the same license as the article it is associated with.
For non-Open Access articles published, all supplemental material carries a non-exclusive license, and permission requests for re-use of supplemental material or any part of supplemental material shall be sent directly to the copyright owner as specified in the copyright notice associated with the article.
